future year 2028 emissions from oil and gas activity in ... · trfo shale 45 4 1 4 0.0 4 4 4...
TRANSCRIPT

Future Year 2028 Emissions from Oil and Gas Activity in the Greater San Juan Basin and Permian Basin
Draft Report
Prepared for:
Bureau of Land Management New Mexico State Office
301 Dinosaur Trail Santa Fe, NM 87508
Tom Moore
Western States Air Resources Council and Western Regional Air Partnership
3 Caliente Road, #8 Santa Fe, NM 87508
Prepared by:
John Grant, Rajashi Parikh, Amnon Bar-Ilan
Ramboll 773 San Marin Drive, Suite 2115
Novato, California, 94998 www.ramboll.com
P-415-899-0700 F-415-899-0707
January 2018
January 2018 DRAFT
i
CONTENTS
EXECUTIVE SUMMARY............................................................................................................. 1
1.0 INTRODUCTION ................................................................................................................. 5
1.1 Pollutants .................................................................................................................... 5
1.2 Temporal and Geographical Scope .............................................................................. 5
1.3 Forecast Overview..................................................................................................... 10
2.0 SAN JUAN FUTURE YEAR EMISSION INVENTORY METHODOLOGY .................................. 12
2.1 CARMMS 2.0 O&G Emissions Integration .................................................................. 12
2.1.1 Mancos Shale .................................................................................................. 13
2.1.2 SUIT Shale ....................................................................................................... 13
2.1.3 TRFO Shale Gas ............................................................................................... 14
2.1.4 TRFO Development-Phase Emissions .............................................................. 14
2.1.5 Summary of CARMMS 2.0 Integration ............................................................. 14
2.2 Non-Shale Oil, Non-Shale Gas, and CBM Forecast ..................................................... 15
2.2.1 O&G Activity Forecast ..................................................................................... 15
2.2.2 Controls .......................................................................................................... 25
2.3 Permitted (Point) Emissions Forecast ........................................................................ 30
3.0 PERMIAN FUTURE YEAR EMISSION INVENTORY .............................................................. 31
3.1 O&G Activity Forecasts .............................................................................................. 31
3.2 Controls .................................................................................................................... 33
3.2.1 Nonroad Diesel Engine Standards and Fuel Sulfur Standards ........................... 36
3.2.2 New Source Performance Standards and BLM Methane Rule for Pneumatic Devices .......................................................................................... 36
3.2.3 New Source Performance Standards and BLM Methane Rule for Completions .................................................................................................... 36
3.2.4 New Source Performance Standards and BLM Methane Rule for Crude Oil and Condensate Tanks ..................................................................... 37
3.2.5 New Source Performance Standards for Compressor Engines ......................... 37
3.2.6 BLM Methane Rule for Associated Gas Venting and Flaring............................. 38
3.2.7 New Source Performance Standards and BLM Methane Rule for Fugitive Devices .............................................................................................. 38

January 2018 DRAFT
ii
3.2.8 New Source Performance Standards and BLM Methane Rule for Pneumatic Pumps ........................................................................................... 38
3.2.9 New Source Performance Standards and BLM Methane Rule for Liquids Unloading ............................................................................................ 38
3.2.10 Summary......................................................................................................... 38
4.0 SUMMARY RESULTS......................................................................................................... 40
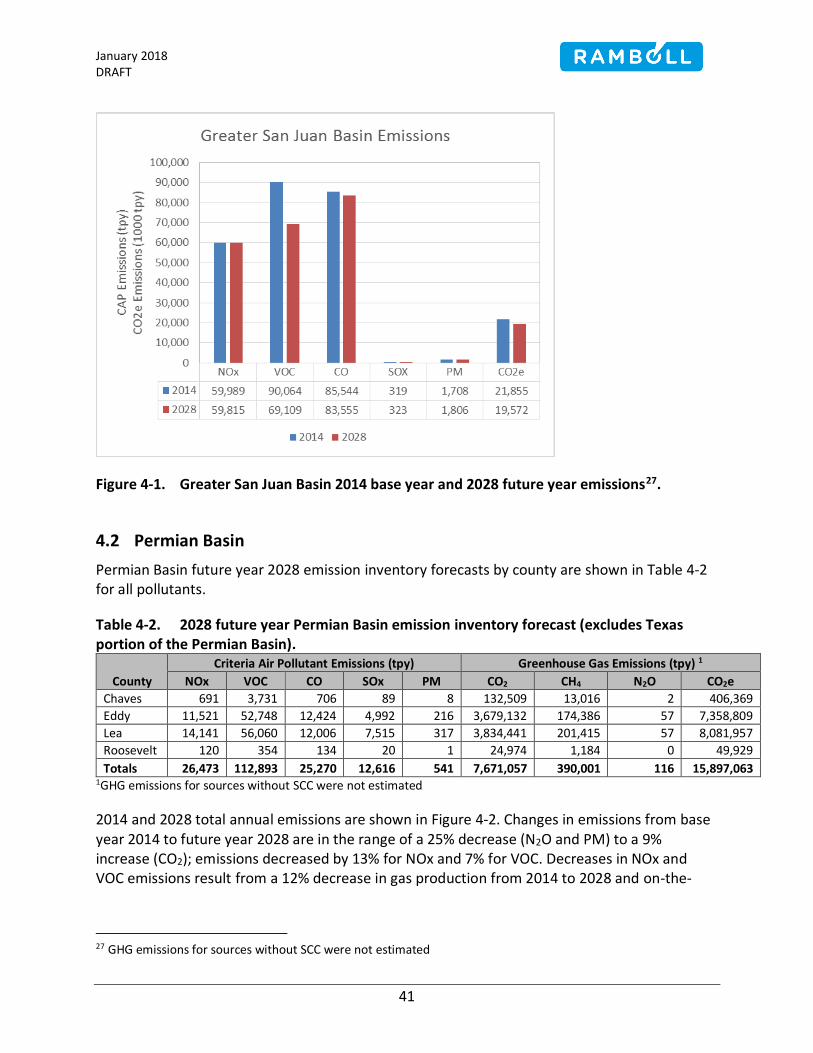
4.1 Greater San Juan Basin .............................................................................................. 40
4.2 Permian Basin ........................................................................................................... 41
5.0 REFERENCES ..................................................................................................................... 43
January 2018 DRAFT
iii
TABLES
Table ES-1. Greater San Juan Basin historical 2014 and forecast 2028 O&G activity............... 2
Table ES-2. Future year 2028 emissions from O&G operations in the Greater San Juan and Permian Basins. .................................................................................... 3
Table 2-1. Summary of 2025 spuds from CARMMS 2.0 study incorporated into future year 2028 Greater San Juan Basin Inventory. .......................................... 15
Table 2-2. Scaling parameter for each O&G source category considered in this inventory. .......................................................................................................... 24
Table 2-3. Summary of 2028 to 2014 scaling ratio by O&G activity metric for the Greater San Juan Basin. ..................................................................................... 25
Table 2-4. Summary of BLM Methane Rule applicability to Greater San Juan Basin emission inventory. ........................................................................................... 27
Table 2-5. Percent reduction in Greater San Juan Basin future year 2028 nonpoint emissions resulting from emission control programs. ........................................ 29
Table 3-1. 2017 AEO O&G production estimates for 2014 and forecasts to 202815. ........... 32
Table 3-2. Permian Basin Future Growth (2028/2014) Scaling Factors. .............................. 33
Table 3-3. Summary of federal and state “on-the-books” regulations affecting O&G source categories considered in this inventory.......................................... 34
Table 3-4. Percent reduction in Permian Basin future year 2028 nonpoint emissions resulting from emission control programs. ........................................ 39
Table 4-1. 2028 future year Greater San Juan Basin emission inventory forecast. .............. 40
Table 4-2. 2028 future year Permian Basin emission inventory forecast (excludes Texas portion of the Permian Basin). ................................................................. 41
FIGURES
Figure ES-1. Greater San Juan Basin NOx (left panel) and VOC (right panel) emissions by mineral designation. ....................................................................... 3
Figure ES-2. Permian Basin (New Mexico only) NOx (left panel) and VOC (right panel) emissions by mineral designation. ............................................................ 4
Figure 1-1. Greater San Juan Basin boundaries overlaid with 2014 O&G well locations by well type. ......................................................................................... 6
Figure 1-2. Greater San Juan Basin boundaries overlaid with 2014 O&G well locations by mineral designation.5 ....................................................................... 7
Figure 1-3. Permian Basin boundaries overlaid with 2014 O&G well locations by well type.5 ........................................................................................................... 8

January 2018 DRAFT
iv
Figure 1-4. Permian Basin boundaries overlaid with 2014 O&G well locations by mineral designation. 5 .......................................................................................... 9
Figure 1-5. Typical O&G activity forecast methodology. ...................................................... 10
Figure 2-1. Colorado field office planning areas (source: Vijayaraghavan et al., 2017). ................................................................................................................ 12
Figure 2-2. Greater San Juan Basin historical oil well count and 2028 forecast.5 .................. 16
Figure 2-3. Greater San Juan Basin historical gas well count and 2028 forecast.5 ................ 17
Figure 2-4. Greater San Juan Basin historical CBM well count and 2028 forecast.5 .............. 18
Figure 2-5. Greater San Juan Basin historical associated gas production and 2028 forecast.5 ........................................................................................................... 19
Figure 2-6. Greater San Juan Basin historical primary gas production and 2028 forecast.5 ........................................................................................................... 20
Figure 2-7. Greater San Juan Basin historical CBM gas production and 2028 forecast.5 ........................................................................................................... 21
Figure 2-8. Greater San Juan Basin historical oil well oil production and 2028 forecast.5 ........................................................................................................... 22
Figure 2-9. Greater San Juan Basin historical condensate production and 2028 forecast.5 ........................................................................................................... 23
Figure 2-10. Greater San Juan Basin historical total gas production.5 .................................... 30
Figure 3-1. EIA Oil and Gas Supply Module regions. ............................................................ 31
Figure 3-2. Permian Basin oil plays . .................................................................................... 32
Figure 4-1. Greater San Juan Basin 2014 base year and 2028 future year emissions. ......................................................................................................... 41
Figure 4-2. Permian Basin 2014 base year and 2028 future year emissions (excludes Texas portion of the Permian Basin)27. ............................................... 42
January 2018 DRAFT
1
EXECUTIVE SUMMARY
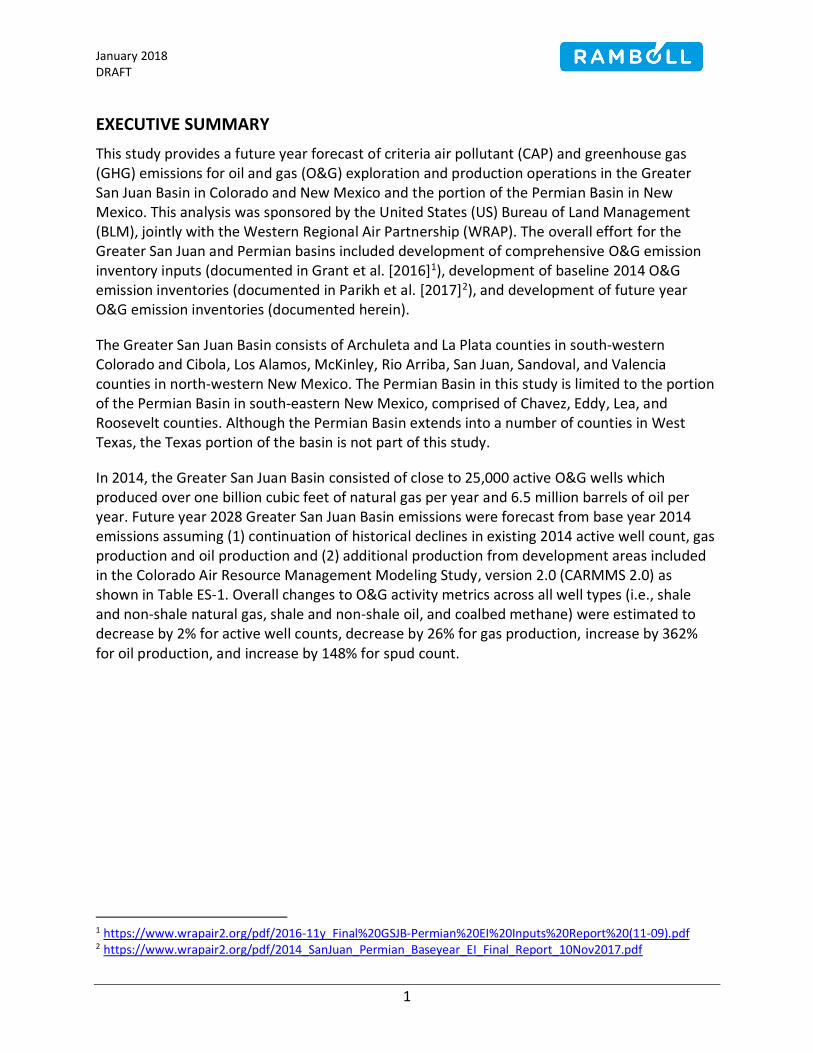
This study provides a future year forecast of criteria air pollutant (CAP) and greenhouse gas (GHG) emissions for oil and gas (O&G) exploration and production operations in the Greater San Juan Basin in Colorado and New Mexico and the portion of the Permian Basin in New Mexico. This analysis was sponsored by the United States (US) Bureau of Land Management (BLM), jointly with the Western Regional Air Partnership (WRAP). The overall effort for the Greater San Juan and Permian basins included development of comprehensive O&G emission inventory inputs (documented in Grant et al. [2016]1), development of baseline 2014 O&G emission inventories (documented in Parikh et al. [2017]2), and development of future year O&G emission inventories (documented herein).
The Greater San Juan Basin consists of Archuleta and La Plata counties in south-western Colorado and Cibola, Los Alamos, McKinley, Rio Arriba, San Juan, Sandoval, and Valencia counties in north-western New Mexico. The Permian Basin in this study is limited to the portion of the Permian Basin in south-eastern New Mexico, comprised of Chavez, Eddy, Lea, and Roosevelt counties. Although the Permian Basin extends into a number of counties in West Texas, the Texas portion of the basin is not part of this study.
In 2014, the Greater San Juan Basin consisted of close to 25,000 active O&G wells which produced over one billion cubic feet of natural gas per year and 6.5 million barrels of oil per year. Future year 2028 Greater San Juan Basin emissions were forecast from base year 2014 emissions assuming (1) continuation of historical declines in existing 2014 active well count, gas production and oil production and (2) additional production from development areas included in the Colorado Air Resource Management Modeling Study, version 2.0 (CARMMS 2.0) as shown in Table ES-1. Overall changes to O&G activity metrics across all well types (i.e., shale and non-shale natural gas, shale and non-shale oil, and coalbed methane) were estimated to decrease by 2% for active well counts, decrease by 26% for gas production, increase by 362% for oil production, and increase by 148% for spud count.
1 https://www.wrapair2.org/pdf/2016-11y_Final%20GSJB-Permian%20EI%20Inputs%20Report%20(11-09).pdf 2 https://www.wrapair2.org/pdf/2014_SanJuan_Permian_Baseyear_EI_Final_Report_10Nov2017.pdf

January 2018 DRAFT
2
Table ES-1. Greater San Juan Basin historical 2014 and forecast 2028 O&G activity.
Area Active Well
Count Gas Production
(BCF/yr1) Oil Production (MMbbl/yr2) Spud Count
2014 Historical
Basin-wide Totals 24,870 1,060 6.1 122
2028 Forecast
Non-Shale 22,319 3 296 3 3.6 3 29 4
TRFO Shale 45 4 1 4 0.0 4 4 4
Southern Ute Shale 400 4 204 4 0.4 4 96 4
Mancos Shale 1,513 4 283 4 24.0 4 173 4
Basin-wide Totals 24,277 784 28.0 302 1 billion cubic-feet per year 2 million barrels per year 3 basis: O&G activity declined from 2014 based on historical trends 4 basis: CARMMS 2.0
In 2014, the portion of the Permian Basin in New Mexico consisted of over 28,000 active O&G wells which produced over 117 million barrels of oil per year. There were over 1,000 wells spudded in the Permian Basin in 2014. Future year 2028 Greater San Juan Basin emissions were forecast from base year 2014 emissions based on US Energy Information (EIA) Annual Energy Outlook (AEO) forecasts of O&G production. Active O&G well count was estimated to increase to 35,000 wells in 2028 and oil production was estimated to increase to 154 million barrels of oil per year.
Emissions control resulting from on-the-books regulations such as New Source Performance Standards (NSPS) OOOO, OOOOa, and JJJJ and the BLM Methane Rule were also included in Greater San Juan and Permian Basin 2028 future year emission inventory forecasts.
Table ES-2 summarizes total emissions from O&G operations in the Greater San Juan and Permian Basin by state. In addition to nitrogen oxides (NOx) and volatile organic compounds (VOCs), emissions of carbon monoxide (CO), particulate matter (PM), sulfur oxides (SOx), and carbon dioxide equivalents (CO2e) are reported. In the Greater San Juan Basin, 72% of 2028 basin-wide NOx emissions and 93% of 2028 basin-wide VOC emissions were from O&G activity in New Mexico. 28% of 2028 basin-wide NOx emissions and 7% of 2028 basin-wide VOC emissions were from O&G activity in Colorado. Colorado comprises a smaller fraction of VOC emissions than NOx emissions as a result of coalbed methane wells which emit small amounts of VOC relative to other O&G wells; coalbed methane wells are the predominant well type in the Colorado portion of the basin.

January 2018 DRAFT
3
Table ES-2. Future year 2028 emissions from O&G operations in the Greater San Juan and Permian Basins.
County Emissions (tpy 1)
NOx VOC CO SOx PM CO2 (e) 2
Greater San Juan Basin
Colorado 16,679 4,680 14,026 56 425 3,284,403 New Mexico 43,136 64,429 69,529 267 1,382 16,287,496
Totals 59,815 69,109 83,555 323 1,806 19,571,899
Permian Basin (excludes Texas portion of the Permian Basin)
New Mexico Totals 30,351 121,644 25,819 12,393 719 15,682,752
1 tons per year
2 GHG emissions for sources without source category classification (SCC) were not estimated
Figure ES-1 shows 2014 and 2028 Greater San Juan Basin-wide NOx and VOC emissions by mineral designation. Changes from 2014 to 2028 Greater San Juan Basin NOx emissions by mineral estate were small (4% decrease for federal, 4% decrease for private/state fee, and 11% increase for tribal sources). Changes from 2014 to 2028 Greater San Juan Basin VOC emissions by mineral estate were small for private/state fee (8% decrease) and tribal (3% increase); more substantial reductions are shown for federal mineral estate (23% decreases), primarily as the result of implementation of the BLM Methane Rule which requires emission control for existing and new federal sources. The BLM Methane Rule is focused primarily on natural gas venting and leak sources and therefore results in reductions to both VOC and methane (CH4) emissions.
Figure ES-1. Greater San Juan Basin NOx (left panel) and VOC (right panel) emissions by mineral designation.
Figure ES-2 shows 2014 and 2028 Permian Basin-wide NOx and VOC emissions by mineral designation. There are no tribal mineral designation sources in the Permian Basin. From 2014 to 2028, Permian Basin NOx emissions by mineral estate decreased by 15% for federal sources and 11% for non-federal sources. From 2014 to 2028 Permian Basin VOC emissions by mineral estate decreased by 34% for federal sources and increased by 19% for non-federal sources.
010,00020,00030,00040,00050,00060,00070,00080,00090,000
100,000
Federal Private/StateFee
Tribal Basin-wide
Emis
sio
ns
(tp
y)
Greater San Juan BasinVOC Emissions
2014 2028
0
10,000
20,000
30,000
40,000
50,000
60,000
70,000
Federal Private/StateFee
Tribal Basin-wide
Emis
sio
ns
(tp
y)
Greater San Juan BasinNOx Emissions
2014 2028

January 2018 DRAFT
4
Substantial reductions to federal VOC emissions (34% decrease) are primarily a result of implementation of the BLM Methane Rule which requires emission control for existing and new federal sources.
Figure ES-2. Permian Basin (New Mexico only) NOx (left panel) and VOC (right panel) emissions by mineral designation. The contents of the report by Chapter are summarized as follows:
Chapter 1.0 provides introductory information on study scope;
Chapter 2.0 describes development of Greater San Juan Basin future year 2028 emission forecasts;
Chapter 3.0 describes development of Permian Basin future year 2028 emission forecasts;
Chapter 4.0 presents summaries in graphical and tabular formats of future year 2028 emission forecasts.
0
20,000
40,000
60,000
80,000
100,000
120,000
140,000
Federal Private/StateFee
Tribal Basin-wide
Emis
sio
ns
(tp
y)
Permian Basin VOC Emissions
2014 2028
0
5,000
10,000
15,000
20,000
25,000
30,000
35,000
Federal Private/StateFee
Tribal Basin-wide
Emis
sio
ns
(tp
y)
Permian Basin NOx Emissions
2014 2028

January 2018 DRAFT
5
1.0 INTRODUCTION
This document outlines the methodologies used to develop 2028 emissions forecasts from O&G sources in the Greater San Juan and Permian basins. These methodologies use as a starting point the 2014 baseline Greater San Juan Basin and Permian Basin O&G emissions inventories, described in the emissions report, “Development of Baseline 2014 Emissions from Oil and Gas Activity in Greater San Juan Basin and Permian Basin”3 (Parikh et. al 2017).
1.1 Pollutants
The following criteria air pollutants (CAPs) are estimated in this study:
Nitrogen oxides (NOx)
Volatile organic compounds (VOCs)
Carbon monoxide (CO)
Particulate matter (PM)
Sulfur oxides (SOx)
The following greenhouse gases (GHGs) are estimated in this study:
Carbon dioxide (CO2)
Methane (CH4)
Nitrous oxide (N2O)
1.2 Temporal and Geographical Scope
Future year annual total emission inventories were developed for calendar year 2028.
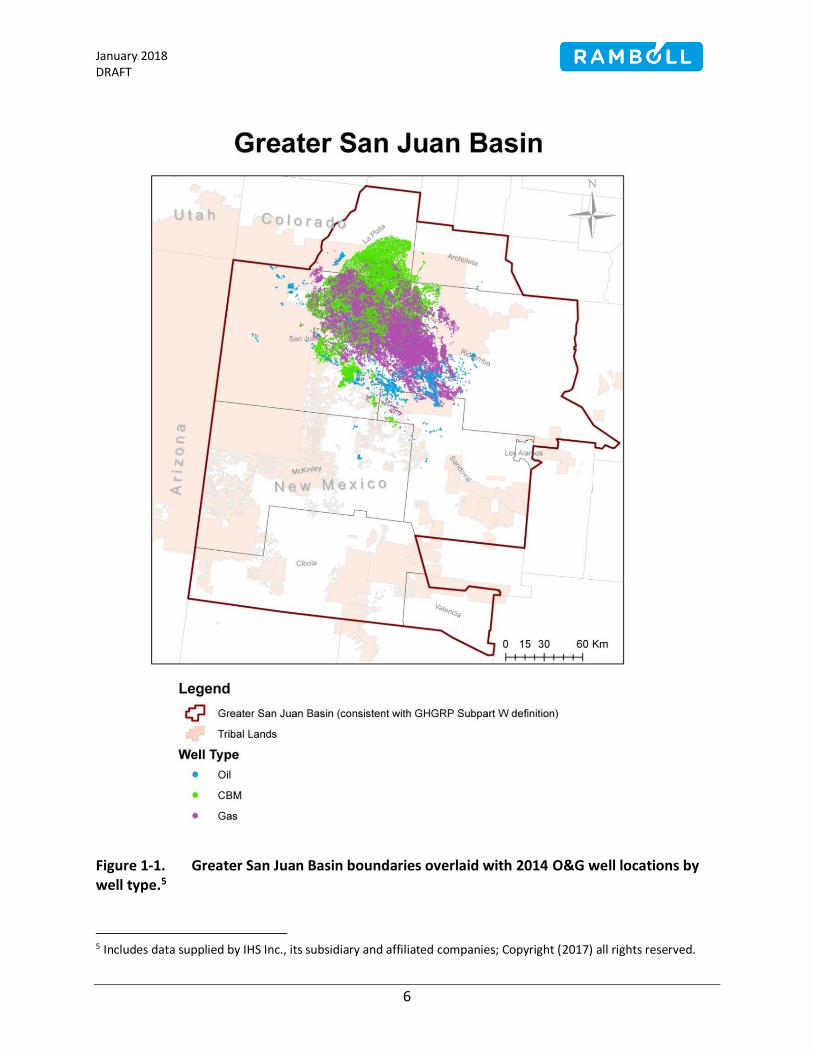
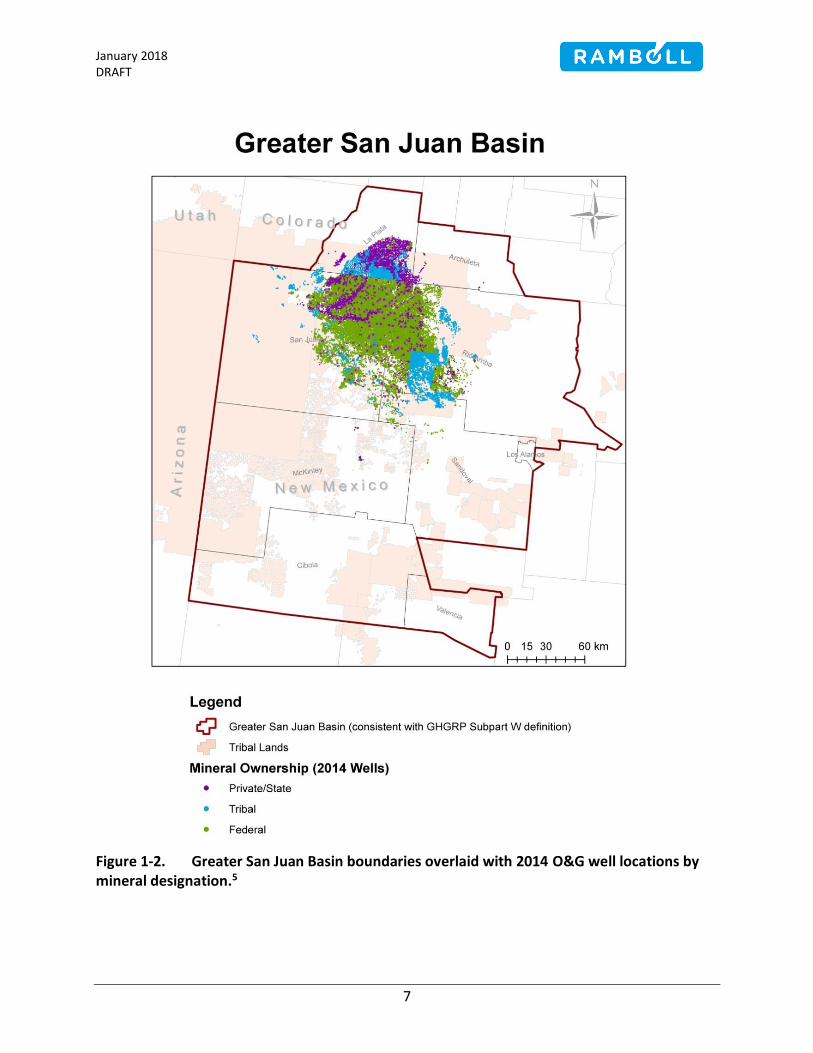
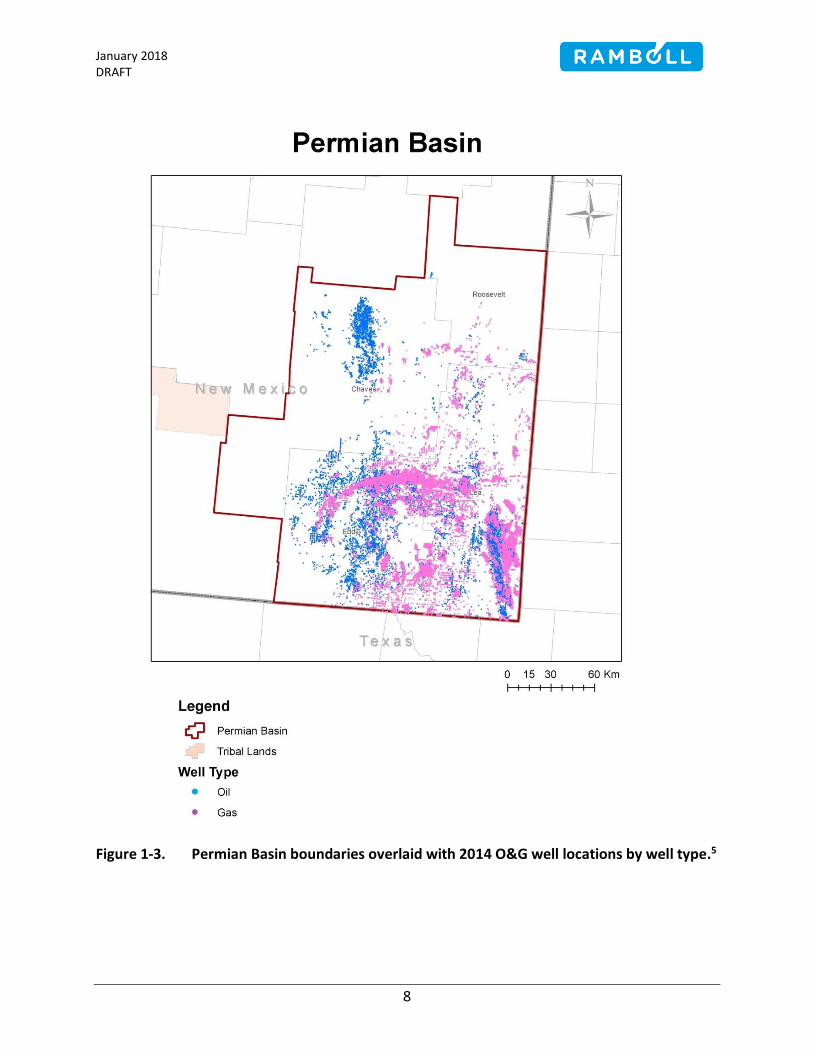
The geographic scope of the inventories is (1) the Greater San Juan Basin in north-western New Mexico and south-western Colorado and (2) the portion of the Permian Basin in New Mexico. Greater San Juan Basin boundaries are based on American Association of Petroleum Geologists4 (AAPG) San Juan Basin consistent with the US Environmental Protection Agency (EPA) Greenhouse Gas Reporting Protocol (GHGRP) basin definition. The Greater San Juan Basin includes Archuleta and La Plata counties in Colorado and Cibola, Los Alamos, McKinley, Rio Arriba, San Juan, Sandoval, and Valencia counties in New Mexico. Permian Basin boundaries are limited to the portion of the Permian Basin in south-eastern New Mexico as defined by the AAPG4, including Chavez, Eddy, Lea, and Roosevelt counties. The geographic scope also considers activities by mineral estate ownership: Federal, Bureau of Indian Affairs (BIA or tribal), and state/private fee.
Figure 1-1 through Figure 1-4 show the boundaries of the Greater San Juan and Permian basins, with 2014 well locations extracted from the IHS database overlaid. Figure 1-1 presents wells by type and Figure 1-2 present wells by mineral designation for the Greater San Juan Basin. Figure 1-3 presents wells by type and Figure 1-4 present wells by mineral designation for the Permian Basin.
3 https://www.wrapair2.org/pdf/2014_SanJuan_Permian_Baseyear_EI_Final_Report_10Nov2017.pdf 4 http://ngmdb.usgs.gov/Geolex/stratres/provinces
January 2018 DRAFT
6
Figure 1-1. Greater San Juan Basin boundaries overlaid with 2014 O&G well locations by well type.5
5 Includes data supplied by IHS Inc., its subsidiary and affiliated companies; Copyright (2017) all rights reserved.
January 2018 DRAFT
7
Figure 1-2. Greater San Juan Basin boundaries overlaid with 2014 O&G well locations by mineral designation.5
January 2018 DRAFT
8
Figure 1-3. Permian Basin boundaries overlaid with 2014 O&G well locations by well type.5

January 2018 DRAFT
9
Figure 1-4. Permian Basin boundaries overlaid with 2014 O&G well locations by mineral designation. 5
January 2018 DRAFT
10
1.3 Forecast Overview
Future year O&G emission inventory forecasts typically account for changes to O&G activity and emission reductions resulting from on-the-books regulations. A brief discussion of future year emissions inventory development and uncertainty is provided in this section.
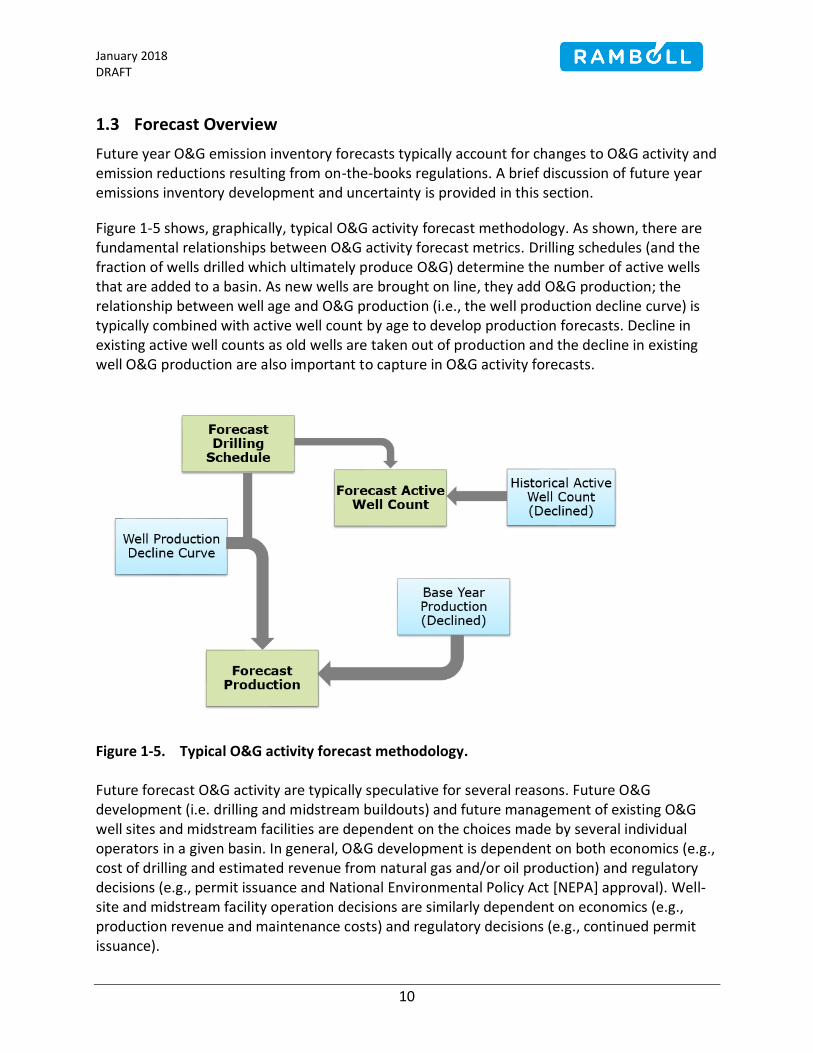
Figure 1-5 shows, graphically, typical O&G activity forecast methodology. As shown, there are fundamental relationships between O&G activity forecast metrics. Drilling schedules (and the fraction of wells drilled which ultimately produce O&G) determine the number of active wells that are added to a basin. As new wells are brought on line, they add O&G production; the relationship between well age and O&G production (i.e., the well production decline curve) is typically combined with active well count by age to develop production forecasts. Decline in existing active well counts as old wells are taken out of production and the decline in existing well O&G production are also important to capture in O&G activity forecasts.
Figure 1-5. Typical O&G activity forecast methodology. Future forecast O&G activity are typically speculative for several reasons. Future O&G development (i.e. drilling and midstream buildouts) and future management of existing O&G well sites and midstream facilities are dependent on the choices made by several individual operators in a given basin. In general, O&G development is dependent on both economics (e.g., cost of drilling and estimated revenue from natural gas and/or oil production) and regulatory decisions (e.g., permit issuance and National Environmental Policy Act [NEPA] approval). Well-site and midstream facility operation decisions are similarly dependent on economics (e.g., production revenue and maintenance costs) and regulatory decisions (e.g., continued permit issuance).

January 2018 DRAFT
11
Typically, future year control estimates are developed based on an estimate of future year control prevalence and associated emission rate reductions. Accurate estimation of regulatory program effects on future year emissions is challenging for several reasons. For example, control programs such as New Source Performance Standards (NSPS) apply to new or modified sources only. Inventories have typically not accounted for NSPS modified sources because information has not been available to determine the prevalence of sources that fall under the modified provision. Additionally, when O&G activity forecasts are based on simple multiplicative factors (rather than treating sources that existed in the base year separately from sources added in future years), such as a basin-wide gas production increase of 30% from base year to future year, new sources are typically represented conservatively as only increases above base year emissions (because of existing well O&G production decline and attrition, new sources are typically expected to represent a larger fraction of sources).
January 2018 DRAFT
12
2.0 San Juan Future Year Emission Inventory Methodology
This section provides 2028 emission inventory development methodology for the Greater San Juan Basin for nonpoint and point sources. Forecasts account for changes to O&G activity and emission reductions resulting from on-the-books regulations.
Greater San Juan Basin emission forecasts are based on (1) emission estimates from new development in the US Bureau of Land Management (BLM) Colorado Air Resource Management Modeling Study 2.0 (CARMMS 2.0; Vijayaraghavan et al., 2017) and (2) declines in existing non-shale O&G activity based on historical trends.
2.1 CARMMS 2.0 O&G Emissions Integration
CARMMS 2.0 includes O&G activity forecasts relevant to the Greater San Juan Basin for the following areas:
Mancos Shale
Southern Ute Indian Tribe Shale Development (SUIT)
Tres Rios Field Office (TRFO)
Farmington Field Office (FFO)
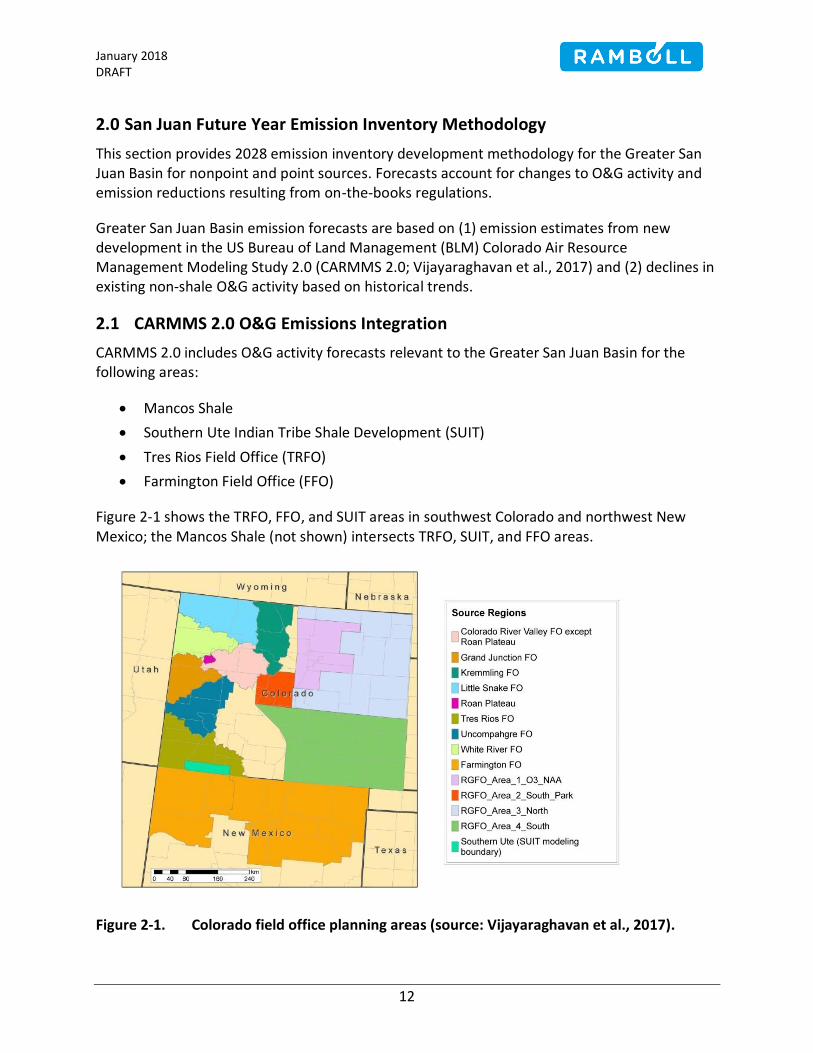
Figure 2-1 shows the TRFO, FFO, and SUIT areas in southwest Colorado and northwest New Mexico; the Mancos Shale (not shown) intersects TRFO, SUIT, and FFO areas.
Figure 2-1. Colorado field office planning areas (source: Vijayaraghavan et al., 2017).

January 2018 DRAFT
13
CARMMS 2.0 future year O&G emissions were developed for low, medium, and high scenarios and incorporate the effects on emissions of on-the-book regulations (Vijayaraghavan et al., 2017). The low and high scenarios are intended to bound future year O&G development activity; the medium scenario assumes the same level of development as the high scenario with additional emission controls. The low scenario is based on recent year O&G development levels and the high scenario is based on Reasonably Foreseeable Development (RFD) estimates. Ramboll estimated future year forecasts based on CARMMS 2.0 low or high scenario 2025 emissions for each area within the Greater San Juan Basin as described below consistent with (Grant et al., 20176). Medium scenario emissions were not used because the medium scenario was developed assuming emission controls beyond those required in on-the-books regulations. CARMMS 2.0 O&G emissions include sources in addition to those included in the base year 2014 Greater San Juan Basin emission inventory such as vehicle traffic, well site construction, and fugitive dust emission sources. CARMMS 2.0 emissions from sources outside the scope of the base year 2014 Greater San Juan Basin emission inventory were not integrated into the 2028 future year inventory.
2.1.1 Mancos Shale
CARMMS 2.0 Mancos shale 2025 low scenario emissions were integrated into the 2028 future year Greater San Juan Basin inventory based on the assumption that oil and natural gas prices will not be favorable to CARMMS 2.0 high scenario development. The price of crude oil since late-2014 has generally remained below $65 per barrel7. The price of natural gas since early-2009 has generally remained below $5 per million BTU8 (with the exception of brief spikes in January 2010, February 2014, and January 2018). Based on the assumption that natural gas and oil prices remain at recent levels, selection of the low scenario is warranted. CARMMS 2.0 Mancos Shale 2025 nonpoint emissions were incorporated as-is for calendar year 2028. All CARMMS 2.0 non-federal well emissions were assigned to “private/state fee” mineral estate and all federal emissions were assigned to “federal” mineral estate. Tribal Mancos Shale activity is accounted for in the SUIT area Shale inventory. Spatial allocation of Mancos Shale emissions were estimated based on CARMMS 2.0 Mancos Shale spatial allocations.
2.1.2 SUIT Shale
CARMMS 2.0 SUIT area shale 2025 “high scenario” emissions were integrated into the 2028 future year inventory because the high scenario is consistent with the upcoming SUIT Shale Supplemental Environmental Impact Statement (SEIS). The SUIT Shale SEIS development forecast was used because preparation of an SEIS document suggests that approvals are already being sought for this level of development. CARMMS 2.0 Mancos Shale 2025 nonpoint emissions were incorporated as-is for calendar year 2028. All SUIT area shale emissions were
6 https://www.wrapair2.org/pdf/OG_ForecastMethod_13Sep2017_memo.pdf 7 US EIA Petroleum Data, Cushing, OK WTI Spot Price FOB. 8 US EIA Natural Gas Data, Henry Hub Natural Gas Spot Price : https://www.eia.gov/dnav/ng/hist/rngwhhdm.htm
January 2018 DRAFT
14
assigned to “tribal” mineral estate and were spatially allocated consistent with CARMMS 2.0 assumptions.
2.1.3 TRFO Shale Gas
Outside of Mancos Shale and SUIT shale development, CARMMS 2.0 assumed additional shale gas development in the TRFO in northern area of Greater San Juan Basin. CARMMS 2.0 “low scenario” TRFO shale gas 2025 future emissions were integrated into the 2028 future year inventory. As mentioned above, the price of natural gas since early-2009 has generally remained below $5 per million BTU9 (with the exception of brief spikes in January 2010, February 2014, and January 2018). Based on the assumption that the natural gas price remains at recent levels, selection of the low scenario is warranted. All non-federal well emissions were assigned to “private/state fee” mineral estate and all federal emissions were assigned to “federal” mineral estate. CARMMS 2.0 spatial allocations were used to allocate TRFO shale gas emissions to individual counties.
2.1.4 TRFO Development-Phase Emissions
CARMMS 2.0 TRFO 2025 low scenario CBM development phase10 emissions (from drilling, hydraulic fracturing, and completion activities) were integrated into the 2028 inventory based on CARMMS 2.0 spatial allocations. As mentioned above, the price of natural gas since early-2009 has generally remained below $5 per million BTU11 (with the exception of brief spikes in January 2010, February 2014, and January 2018). Based on the assumption that the natural gas price remains at recent levels, selection of the low scenario is warranted. All non-federal well emissions were assigned to “private/state fee” mineral estate and all federal emissions were assigned to “federal” mineral estate.
2.1.5 Summary of CARMMS 2.0 Integration
CARMMS O&G emissions that were incorporated into the future year 2028 Greater San Juan Basin emission inventory are shown in Table 2-1. As noted above, CARMMS 2.0 O&G emissions include sources in addition to those included in the base year 2014 Greater San Juan Basin emission inventory such as vehicle traffic, well site construction, and fugitive dust emission sources. CARMMS 2.0 emissions from sources outside the scope of the base year 2014 Greater San Juan Basin emission inventory were not integrated into the 2028 future year inventory and are not included in Table 2-1.
9 US EIA Natural Gas Data, Henry Hub Natural Gas Spot Price : https://www.eia.gov/dnav/ng/hist/rngwhhdm.htm 10 Development phase refers to drilling and completion activities during well “development” 11 US EIA Natural Gas Data, Henry Hub Natural Gas Spot Price : https://www.eia.gov/dnav/ng/hist/rngwhhdm.htm

January 2018 DRAFT
15
Table 2-1. Summary of 2025 spuds from CARMMS 2.0 study incorporated into future year 2028 Greater San Juan Basin Inventory.
Well Type
Emissions (tpy3) Wells Added from 2014 to
2028 2028 Spuds
NOx VOC CO SOx PM
TRFO CBM1 9 1 9 0 0 not
applicable1 29
TRFO Shale Gas 2 70 31 61 0 2 45 4
SUIT Shale 1,695 540 1,809 2 83 400 96
Mancos Shale 2,190 4,615 2,887 4 104 1,513 173 1 Includes only development phase emissions from CARMMS 2.0. 2 Includes only shale gas wells not in SUIT Shale or Mancos Shale. 3 tons per year
2.2 Non-Shale Oil, Non-Shale Gas, and CBM Forecast
Historical non-shale oil, non-shale gas, and CBM well activity trends were developed to estimate declines in existing production phase emissions; control factors were also developed to account for the effects of regulatory control programs on emissions from non-shale oil, non-shale gas, and CBM wells.
2.2.1 O&G Activity Forecast
Recent trends in Greater San Juan Basin O&G activity from show declines in activity across all O&G activity metrics evaluated in this study. Ramboll estimated decline factors based on recent O&G activity trends. Since O&G activity is estimated to decline across all O&G activity metrics evaluated, no additional controls were applied (i.e. the emission rate per unit O&G activity in the future year is assumed equivalent to the base year).
2028 Non-shale oil, non-shale gas, and CBM production-phase emissions forecasts for the Greater San Juan Basin are based on the following O&G activity metrics:
Well counts by type (gas, oil, CBM)
Gas production by type (primary, associated, CBM)
Liquid Hydrocarbon production by type (oil, condensate)
Non-shale oil and non-shale gas development phase emissions in future year 2028 were assumed negligible in the Colorado portion of the Greater San Juan Basin. The assumption of negligible non-shale gas and non-shale oil well drilling in the portion of the Greater San Juan Basin in Colorado is consistent with the most recent year of spuds data available (2016) in which 2 non-CBM and 20 CBM wells were drilled in the Colorado portion of the basin. TRFO CBM development emissions from CARMMS 2.0 were included in the Colorado portion of the Greater San Juan Basin as described above.
Non-shale oil, non-shale gas, and CBM development phase emissions in future year 2028 were assumed to be negligible in the New Mexico portion of the Greater San Juan Basin. The

January 2018 DRAFT
16
assumption of negligible non-shale gas, non-shale oil, and CBM well drilling in the portion of the Greater San Juan Basin in New Mexico is consistent with recent spuds trends in which spud count has decreased substantially in the basin; in the New Mexico portion of the basin there were 141 spuds in 2014, 75 spuds in 2015, and 18 spuds in 2016. Future spudding activity in the basin is assumed to be from the Mancos Shale.
Oil Well Counts
Historical Greater San Juan Basin 1970–2016 active oil well counts are shown in Figure 2-2 with the 2028 forecast. Oil well counts have remained relatively constant in recent years, therefore, the 2028 forecast was set equal to the oil well count in 2016, the most recent year with complete O&G activity data at the time these forecasts were developed.
Figure 2-2. Greater San Juan Basin historical oil well count and 2028 forecast.5
Gas Well Counts
Historical Greater San Juan Basin 1970–2016 active gas well counts are shown in Figure 2-3 with the 2028 forecast. Gas well counts have steadily decreased in recent years; the 2028 forecast was estimated to decrease from 2016 consistent with recent historical declines.

January 2018 DRAFT
17
Figure 2-3. Greater San Juan Basin historical gas well count and 2028 forecast.5
CBM Well Counts
Historical Greater San Juan Basin 1970–2016 active CBM well counts are shown in Figure 2-4 with the 2028 forecast. CBM well counts have decreased monotonically in recent years; the 2028 forecast was estimated to decrease from 2016 based on recent historical declines.

January 2018 DRAFT
18
Figure 2-4. Greater San Juan Basin historical CBM well count and 2028 forecast.5
Associated Gas Production
Historical Greater San Juan Basin 1970–2016 associated gas production is shown in Figure 2-5 with the 2028 forecast. Associated gas production declined from 1989 through 2010, remained relatively constant from 2009 to 2013, increased substantially from 2013 to 2015, and then declined from 2015 to 2016. The future year 2028 association gas production forecast was estimated to be equal to the 20-year average associated gas production from 1997 to 2016.

January 2018 DRAFT
19
Figure 2-5. Greater San Juan Basin historical associated gas production and 2028 forecast.5
Primary Gas Production
Historical Greater San Juan Basin 1970–2016 primary gas production is shown in Figure 2-6 with the 2028 forecast. Primary gas production has steadily decreased in recent years; the 2028 forecast was estimated to decrease from 2016 consistent with recent historical declines.

January 2018 DRAFT
20
Figure 2-6. Greater San Juan Basin historical primary gas production and 2028 forecast.5
CBM Well Gas Production
Historical Greater San Juan Basin 1970–2016 CBM gas production is shown in Figure 2-7 with the 2028 forecast. CBM gas production has steadily decreased in recent years; the 2028 forecast was estimated to decrease from 2016 consistent with recent historical declines.

January 2018 DRAFT
21
Figure 2-7. Greater San Juan Basin historical CBM gas production and 2028 forecast.5
Oil Well Oil Production
Historical Greater San Juan Basin 1970–2016 associated gas production is shown in Figure 2-8 with the 2028 forecast. Oil well oil production declined from 1986 through 2010, remained relatively constant from 2010 to 2012, increased substantially from 2012 to 2015, and then declined from 2015 to 2016. The future year 2028 oil well oil production forecast was estimated to be equal to the 20-year average oil well oil production from 1997 to 2016.

January 2018 DRAFT
22
Figure 2-8. Greater San Juan Basin historical oil well oil production and 2028 forecast.5
Condensate Production
Historical Greater San Juan Basin 1970–2016 condensate production is shown in Figure 2-9 with the 2028 forecast. Annual condensate production has remained between 1.4 million barrels and 2.1 million barrels since 1992 with a declining trend from 1994 to 2010, an increasing trend from 2010 to 2015 and decline from 2015 to 2016. Future year 2028 condensate production was estimated to be equal to 2016 condensate production.

January 2018 DRAFT
23
Figure 2-9. Greater San Juan Basin historical condensate production and 2028 forecast.5
2.2.1.1 O&G Activity Scaling Factor Development
The 2028 to 2014 ratio of each O&G activity metric described above comprise the emission forecast scaling factors for non-shale oil, non-shale gas, and CBM activity in the Greater San Juan Basin as shown in Equation 1.
2014,
2028,,
i
ii W
Wf (Equation 1)
where: fi is the scaling factor for parameter i (non-shale oil, non-shale gas, or CBM well gas production, oil production, or active well count) Wi,2014 is the historical value of parameter i in 2014 Wi,2028 is the forecast value of parameter i in 2028
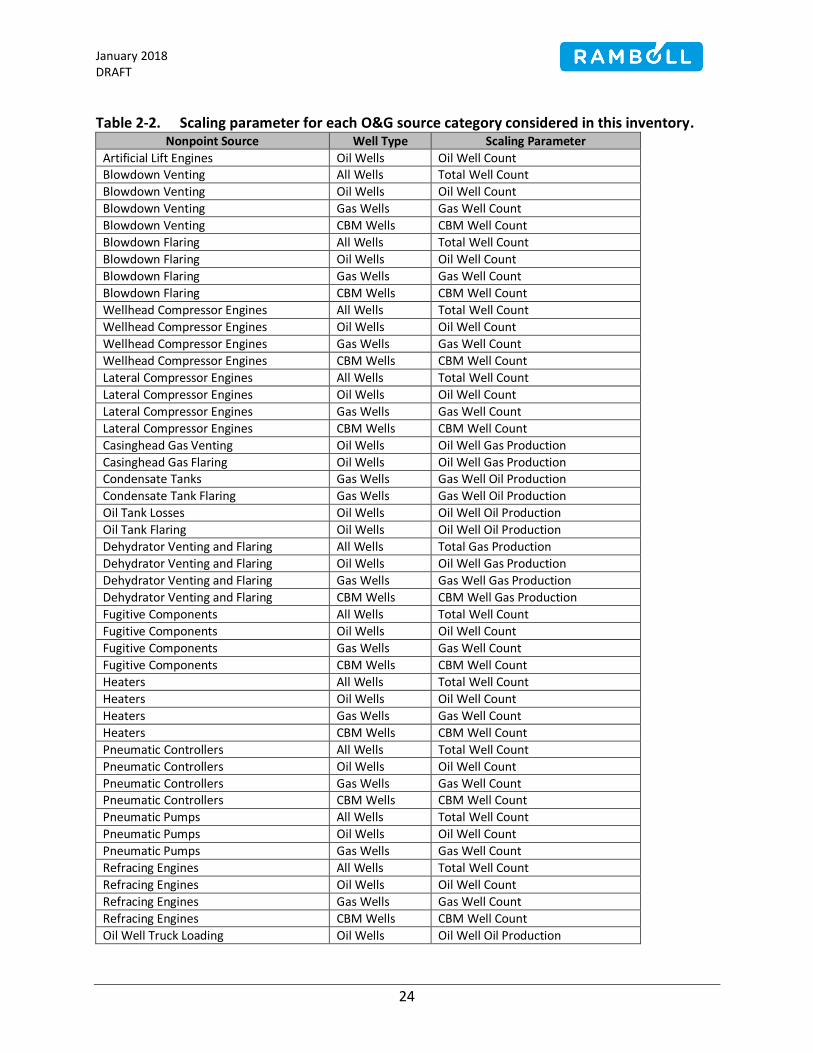
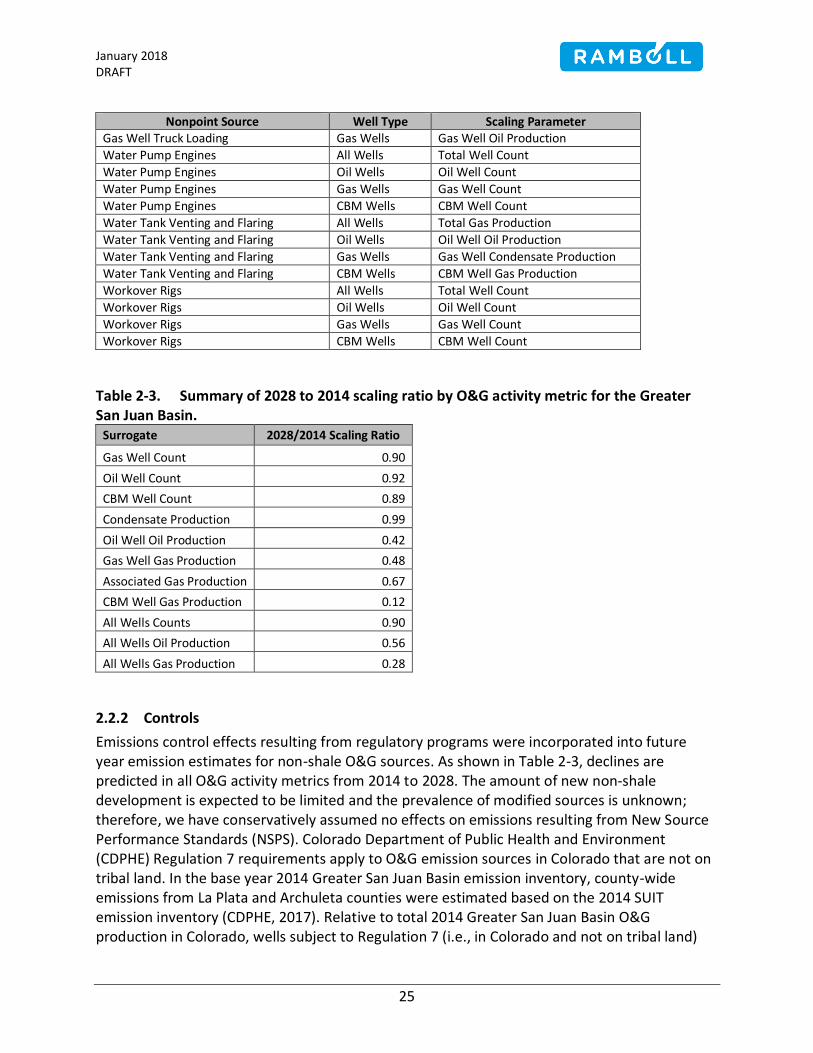
The O&G activity scaling factor associated with each emission source category is shown in Table 2-2. The O&G activity scaling factor estimates for the Greater San Juan Basin are presented in Table 2-3.
January 2018 DRAFT
24
Table 2-2. Scaling parameter for each O&G source category considered in this inventory. Nonpoint Source Well Type Scaling Parameter
Artificial Lift Engines Oil Wells Oil Well Count Blowdown Venting All Wells Total Well Count
Blowdown Venting Oil Wells Oil Well Count
Blowdown Venting Gas Wells Gas Well Count
Blowdown Venting CBM Wells CBM Well Count
Blowdown Flaring All Wells Total Well Count
Blowdown Flaring Oil Wells Oil Well Count
Blowdown Flaring Gas Wells Gas Well Count
Blowdown Flaring CBM Wells CBM Well Count
Wellhead Compressor Engines All Wells Total Well Count
Wellhead Compressor Engines Oil Wells Oil Well Count
Wellhead Compressor Engines Gas Wells Gas Well Count
Wellhead Compressor Engines CBM Wells CBM Well Count
Lateral Compressor Engines All Wells Total Well Count
Lateral Compressor Engines Oil Wells Oil Well Count
Lateral Compressor Engines Gas Wells Gas Well Count
Lateral Compressor Engines CBM Wells CBM Well Count
Casinghead Gas Venting Oil Wells Oil Well Gas Production
Casinghead Gas Flaring Oil Wells Oil Well Gas Production Condensate Tanks Gas Wells Gas Well Oil Production
Condensate Tank Flaring Gas Wells Gas Well Oil Production
Oil Tank Losses Oil Wells Oil Well Oil Production
Oil Tank Flaring Oil Wells Oil Well Oil Production
Dehydrator Venting and Flaring All Wells Total Gas Production
Dehydrator Venting and Flaring Oil Wells Oil Well Gas Production
Dehydrator Venting and Flaring Gas Wells Gas Well Gas Production
Dehydrator Venting and Flaring CBM Wells CBM Well Gas Production
Fugitive Components All Wells Total Well Count
Fugitive Components Oil Wells Oil Well Count
Fugitive Components Gas Wells Gas Well Count
Fugitive Components CBM Wells CBM Well Count
Heaters All Wells Total Well Count
Heaters Oil Wells Oil Well Count
Heaters Gas Wells Gas Well Count
Heaters CBM Wells CBM Well Count
Pneumatic Controllers All Wells Total Well Count
Pneumatic Controllers Oil Wells Oil Well Count
Pneumatic Controllers Gas Wells Gas Well Count Pneumatic Controllers CBM Wells CBM Well Count
Pneumatic Pumps All Wells Total Well Count
Pneumatic Pumps Oil Wells Oil Well Count
Pneumatic Pumps Gas Wells Gas Well Count
Refracing Engines All Wells Total Well Count
Refracing Engines Oil Wells Oil Well Count
Refracing Engines Gas Wells Gas Well Count
Refracing Engines CBM Wells CBM Well Count
Oil Well Truck Loading Oil Wells Oil Well Oil Production
January 2018 DRAFT
25
Nonpoint Source Well Type Scaling Parameter Gas Well Truck Loading Gas Wells Gas Well Oil Production
Water Pump Engines All Wells Total Well Count
Water Pump Engines Oil Wells Oil Well Count
Water Pump Engines Gas Wells Gas Well Count
Water Pump Engines CBM Wells CBM Well Count
Water Tank Venting and Flaring All Wells Total Gas Production
Water Tank Venting and Flaring Oil Wells Oil Well Oil Production
Water Tank Venting and Flaring Gas Wells Gas Well Condensate Production
Water Tank Venting and Flaring CBM Wells CBM Well Gas Production
Workover Rigs All Wells Total Well Count
Workover Rigs Oil Wells Oil Well Count
Workover Rigs Gas Wells Gas Well Count
Workover Rigs CBM Wells CBM Well Count
Table 2-3. Summary of 2028 to 2014 scaling ratio by O&G activity metric for the Greater San Juan Basin.
Surrogate 2028/2014 Scaling Ratio
Gas Well Count 0.90
Oil Well Count 0.92
CBM Well Count 0.89
Condensate Production 0.99
Oil Well Oil Production 0.42
Gas Well Gas Production 0.48
Associated Gas Production 0.67
CBM Well Gas Production 0.12
All Wells Counts 0.90
All Wells Oil Production 0.56
All Wells Gas Production 0.28
2.2.2 Controls
Emissions control effects resulting from regulatory programs were incorporated into future year emission estimates for non-shale O&G sources. As shown in Table 2-3, declines are predicted in all O&G activity metrics from 2014 to 2028. The amount of new non-shale development is expected to be limited and the prevalence of modified sources is unknown; therefore, we have conservatively assumed no effects on emissions resulting from New Source Performance Standards (NSPS). Colorado Department of Public Health and Environment (CDPHE) Regulation 7 requirements apply to O&G emission sources in Colorado that are not on tribal land. In the base year 2014 Greater San Juan Basin emission inventory, county-wide emissions from La Plata and Archuleta counties were estimated based on the 2014 SUIT emission inventory (CDPHE, 2017). Relative to total 2014 Greater San Juan Basin O&G production in Colorado, wells subject to Regulation 7 (i.e., in Colorado and not on tribal land)

January 2018 DRAFT
26
accounted for 12% of gas production and 11% of oil production (CDPHE, 2017). Given the basis of the 2014 base year emission inventory (2014 SUIT inventory) for wells subject to Regulation 7 and the small fraction of base year 2014 Greater San Juan Basin O&G production in Colorado from wells subject to Regulation 7, we have not estimated emission reductions resulting from Regulation 7. The BLM Methane Rule12 applies to existing and new sources as summarized in Table 2-4. We have incorporated emission reductions resulting from the BLM Methane Rule for emissions from federal mineral estate as described below.
12 https://www.blm.gov/programs/energy-and-minerals/oil-and-gas/operations-and-production/methane-and-waste-prevention-rule

January 2018 DRAFT
27
Table 2-4. Summary of BLM Methane Rule applicability to Greater San Juan Basin emission inventory.
Source Category Regulation Enforcing
Agency Applicability Effective Date
Pneumatic Controllers BLM Methane Rule: Requires operators to replace high-bleed pneumatic controllers with low-bleed or no-bleed pneumatic controllers.
US BLM Federal: new and
existing wells (BLM Methane Rule)
BLM Methane Rule: Phase-in from January 2017
Storage Tanks BLM Methane Rule: Requires operators to route storage vessel vapor gas to a sales line, if the storage vessel has the potential to emit at least 6 tpy of VOCs.
US BLM Federal: new and
existing wells (BLM Methane Rule)
BLM Methane Rule: Phase-in from January 2017
Associated Gas Venting and Flaring
BLM Methane Rule: Requires increases to the amount of casinghead gas that is captured to 90 percent in 2020, 95 percent in 2023, and 98 percent in 2026.
US BLM Federal: new and
existing wells (BLM Methane Rule)
BLM Methane Rule: Phase-in from January 2017
Fugitives BLM Methane Rule: Leak Detection and Repair (LDAR) programs are required at applicable well sites.
US BLM Federal: new and
existing wells (BLM Methane Rule)
BLM Methane Rule: Phase in from January 2017
Pneumatic Pumps
BLM Methane Rule: Operator must replace pneumatic diaphragm pumps that operate 90 or more days per year with zero-emissions pumps, if technical feasible and not unduly costly, or route pneumatic diaphragm pump emissions to a control device.
US BLM Federal: new and
existing wells (BLM Methane Rule)
BLM Methane Rule: Phase in from January 2017
Liquids Unloading
BLM Methane Rule: Operator must use best practices to limit emissions associated with liquids unloading (e.g., use of plunger lifts, staying on-site during manual purging).
US BLM Federal: new and
existing wells (BLM Methane Rule)
BLM Methane Rule: Phase in from January 2017

January 2018 DRAFT
28
2.2.2.1 BLM Methane Rule for Pneumatic Devices
Pneumatic device control factors were developed according to BLM Methane Rule requirements.
I. Federal existing and new wells: All pneumatic devices were assumed to be low-bleed (i.e. less than 6 standard cubic-feet per hour bleed rate)12.
II. Non-federal wells: No change resulting from BLM Methane Rule.
2.2.2.2 BLM Methane Rule for Crude Oil and Condensate Tanks
Crude oil and condensate tank control factors were developed according to BLM Methane Rule requirements.
The BLM Methane rule requires control of new and existing tanks that emit over 6 tons per year VOC12. The rule requires that storage vessel vapor gas be routed to a sales line, if the storage vessel has the potential to emit at least 6 tpy of VOCs starting from January 2015 unless technically infeasible or unduly costly.
Ramboll estimated control scalars for tanks at all federal (existing and new) wells. Control factors are based on application of control to tanks with the potential to emit 6 tons per year VOC, but not to tanks with the potential to emit less than 6 tons per year VOC. 99% percent of federal oil tank and 70% of federal condensate tank emissions were assumed to be controlled by vapor recovery unit (VRU)13.
2.2.2.3 BLM Methane Rule for Associated Gas Venting and Flaring
The BLM Methane Rule requires operators to increase capture of casinghead gas. By 2026 98% of casinghead gas must be captured. Greater San Juan Basin-wide, over 99% of base year 2014 casinghead gas was assumed to be captured. Given that basin-wide casinghead gas capture estimates in base year 2014 met 2026 operator specific limits, no additional control was estimated for this source category. The casinghead gas provision of the BLM Methane Rule was designed to address casinghead gas releases in new development areas (such as the Bakken) where lack of gas gathering infrastructure led to substantial casinghead gas releases. The Greater San Juan Basin is a mature O&G development area with substantial gas gathering infrastructure, so the assumption that it already is in compliance with BLM Methane Rule capture requirements is reasonable.
2.2.2.4 BLM Methane Rule for Fugitive Devices
The BLM Methane Rule requires routine fugitive leak monitoring at well sites. LDAR program requirements specify that LDAR surveys are conducted twice annually after the initial survey.
13 The fraction of crude oil and condensate tanks with emissions greater than 6 tons per year VOC was estimated based on base year 2014 tank flashing emission factors and per well production activity from IHS database. We assumed that all production at each well site was sent to a single tank (i.e. multi-tank sites were not considered) because information was not available to estimate the number of tanks per well site.
January 2018 DRAFT
29
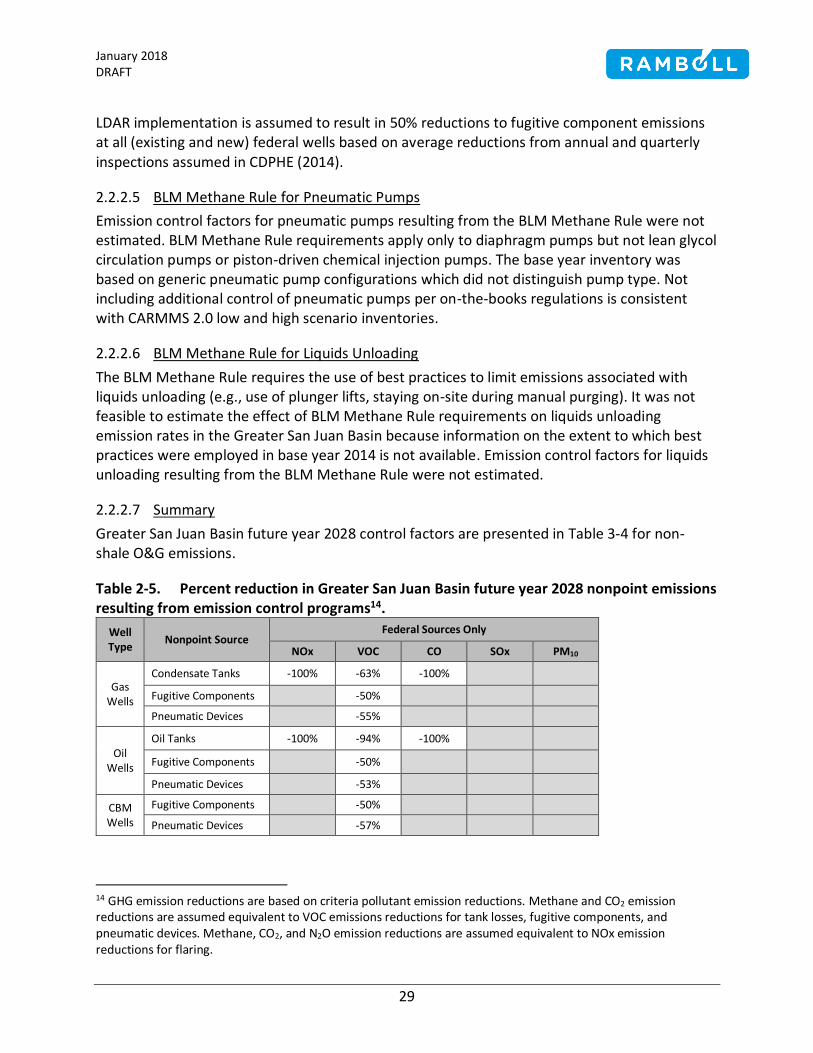
LDAR implementation is assumed to result in 50% reductions to fugitive component emissions at all (existing and new) federal wells based on average reductions from annual and quarterly inspections assumed in CDPHE (2014).
2.2.2.5 BLM Methane Rule for Pneumatic Pumps
Emission control factors for pneumatic pumps resulting from the BLM Methane Rule were not estimated. BLM Methane Rule requirements apply only to diaphragm pumps but not lean glycol circulation pumps or piston-driven chemical injection pumps. The base year inventory was based on generic pneumatic pump configurations which did not distinguish pump type. Not including additional control of pneumatic pumps per on-the-books regulations is consistent with CARMMS 2.0 low and high scenario inventories.
2.2.2.6 BLM Methane Rule for Liquids Unloading
The BLM Methane Rule requires the use of best practices to limit emissions associated with liquids unloading (e.g., use of plunger lifts, staying on-site during manual purging). It was not feasible to estimate the effect of BLM Methane Rule requirements on liquids unloading emission rates in the Greater San Juan Basin because information on the extent to which best practices were employed in base year 2014 is not available. Emission control factors for liquids unloading resulting from the BLM Methane Rule were not estimated.
2.2.2.7 Summary
Greater San Juan Basin future year 2028 control factors are presented in Table 3-4 for non-shale O&G emissions.
Table 2-5. Percent reduction in Greater San Juan Basin future year 2028 nonpoint emissions resulting from emission control programs14.
Well Type
Nonpoint Source Federal Sources Only
NOx VOC CO SOx PM10
Gas Wells
Condensate Tanks -100% -63% -100%
Fugitive Components -50%
Pneumatic Devices -55%
Oil Wells
Oil Tanks -100% -94% -100%
Fugitive Components -50%
Pneumatic Devices -53%
CBM Wells
Fugitive Components -50%
Pneumatic Devices -57%
14 GHG emission reductions are based on criteria pollutant emission reductions. Methane and CO2 emission reductions are assumed equivalent to VOC emissions reductions for tank losses, fugitive components, and pneumatic devices. Methane, CO2, and N2O emission reductions are assumed equivalent to NOx emission reductions for flaring.

January 2018 DRAFT
30
2.3 Permitted (Point) Emissions Forecast
Recent trends in gas production show substantial declines from 1999 peak Greater San Juan Basin production (Figure 2-10). As described above, non-shale gas production declines are estimated to continue to 2028. Based on the assumption that midstream capacity formerly available to declining non-shale production would be used by increasing shale production, forecast 2028 point source O&G emissions were assumed to be equal to base year emissions. Emissions from SUIT Shale SEIS Central Delivery Point facilities were added consistent with CARMMS 2.0.
Figure 2-10. Greater San Juan Basin historical total gas production.5

January 2018 DRAFT
31
3.0 PERMIAN FUTURE YEAR EMISSION INVENTORY
Permian Basin 2014 base year emissions were forecast to future year 2028, accounting for changes to O&G activity and emission control program effects. O&G activity forecast factors were limited to estimates of future changes to O&G production. The use of additional O&G activity metrics (e.g., active well count and spuds) to estimate additional scaling factors would allow O&G forecasts to be more closely to specific activity drivers (e.g., spuds for drill rigs and active well count for pneumatic controllers); however, only O&G production forecasts are available at this time for the Permian Basin.
3.1 O&G Activity Forecasts
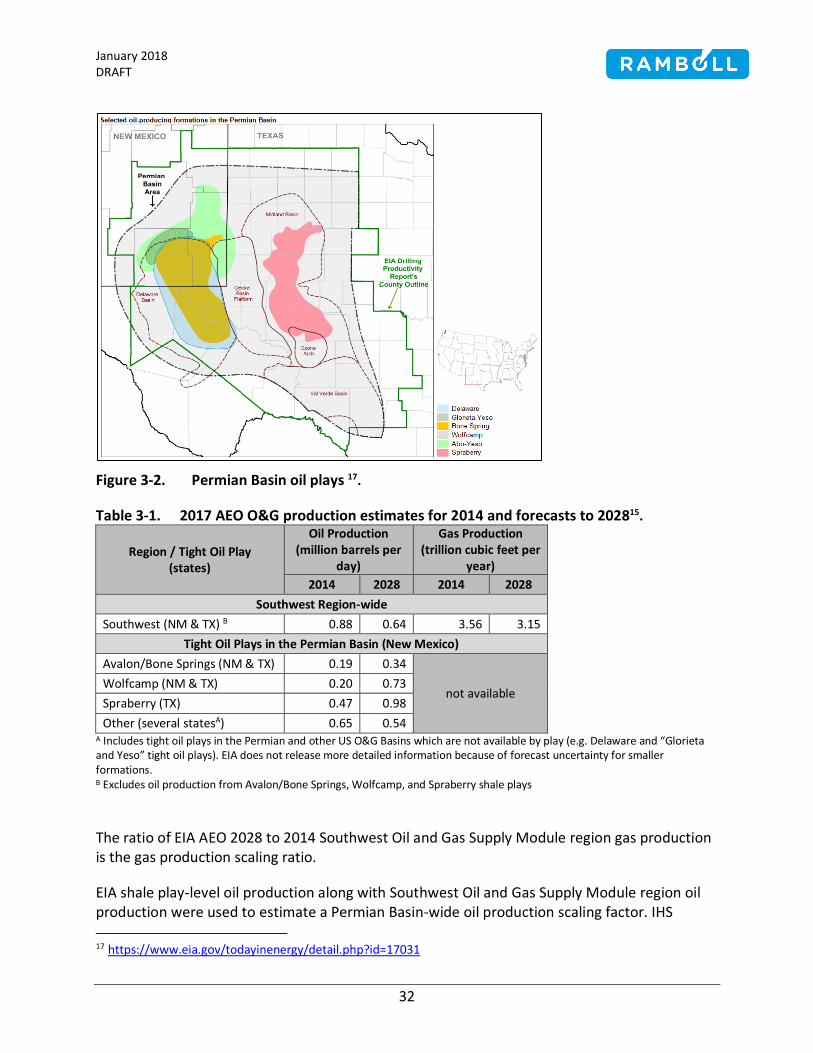
Permian Basin 2014 to 2028 O&G activity scaling factors were developed based on US Energy Information Administration (EIA) Annual Energy Outlook (AEO) forecasts. EIA publishes activity forecasts by Oil and Gas Supply Module region (Figure 3-1). Ramboll obtained shale play-level forecasts from EIA staff which include the Avalon/Bone Springs and Wolfcamp shale plays which are in the portion of the Permian Basin in New Mexico15 (Figure 3-2). Table 3-1 shows EIA forecasts applicable to the Permian Basin. Per EIA staff, information released by EIA as part of the AEO is limited to shale play-level data provided by email to Ramboll15 and Oil and Gas Supply Module region-level data available online. EIA does not release more detailed information because of forecast uncertainty for smaller formations.
Figure 3-1. EIA Oil and Gas Supply Module regions16.
15 Email from John Staub (EIA), June 28, 2017 16 Source: EIA (2017), “Assumptions to the Annual Energy Outlook 2017”, (Figure 9.1), available online at https://www.eia.gov/outlooks/aeo/assumptions/
January 2018 DRAFT
32
Figure 3-2. Permian Basin oil plays 17.
Table 3-1. 2017 AEO O&G production estimates for 2014 and forecasts to 202815.
Region / Tight Oil Play (states)
Oil Production (million barrels per
day)
Gas Production (trillion cubic feet per
year)
2014 2028 2014 2028
Southwest Region-wide
Southwest (NM & TX) B 0.88 0.64 3.56 3.15
Tight Oil Plays in the Permian Basin (New Mexico)
Avalon/Bone Springs (NM & TX) 0.19 0.34
not available Wolfcamp (NM & TX) 0.20 0.73
Spraberry (TX) 0.47 0.98
Other (several statesA) 0.65 0.54 A Includes tight oil plays in the Permian and other US O&G Basins which are not available by play (e.g. Delaware and “Glorieta and Yeso” tight oil plays). EIA does not release more detailed information because of forecast uncertainty for smaller formations. B Excludes oil production from Avalon/Bone Springs, Wolfcamp, and Spraberry shale plays
The ratio of EIA AEO 2028 to 2014 Southwest Oil and Gas Supply Module region gas production is the gas production scaling ratio.
EIA shale play-level oil production along with Southwest Oil and Gas Supply Module region oil production were used to estimate a Permian Basin-wide oil production scaling factor. IHS
17 https://www.eia.gov/todayinenergy/detail.php?id=17031

January 2018 DRAFT
33
Enerdeq 2014 oil production estimates by well include a reservoir and well type designation for each well. Based on the well type and reservoir name associated with each O&G well, the well was assigned to an EIA shale play or the Southwest Oil and Gas Module region. The ratio of EIA AEO 2028 to 2014 oil production was applied to each well’s oil production based on the associated shale play or region to estimate each well’s 2028 forecast. The summation of 2028 forecasts across all wells is the 2028 to 2014 scaling ratio.
Table 3-2 shows O&G activity forecast scalars. Gas well O&G activity scalars were based on gas production forecasts, oil well O&G activity scalars were based on oil production, and midstream O&G activity scalars were based on gas production. This methodology is similar to the methodology used in the 2011 EPA modeling platform (EPA, 2014a), with modifications because the 2014 base year inventory includes emissions by well type (in EPA [2014a] oil and gas well type specific emissions are not available for several source categories such as drill rigs and water tanks).
Table 3-2. Permian Basin Future Growth (2028/2014) Scaling Factors.
Surrogate Oil Wells Gas Wells Total
Oil Production 1.30 1.81 1.31
Gas Production 0.88 0.88 0.88
3.2 Controls
Emissions control resulting from regulatory programs such as EPA’s NSPS Subpart OOOO and OOOOa18, EPA’s NSPS JJJJ standards19, EPA’s off-road diesel engine tier standards20, the BLM Methane Rule12 and state specific regulatory programs were incorporated into future year emission estimates. Accurate accounting of emission control effects is dependent on a number of factors such as the level of emission control in the base year and expected control program penetration in future years. In cases where emission control is applied to new or modified sources only (e.g. NSPS Subpart OOOO), estimates of the prevalence of control application to “modified” sources have not been developed. Therefore, we applied controls to only added emissions; this methodology is consistent with EPA modeling platform future year O&G emission estimation methodology (EPA, 2014a). Table 3-3 below summarizes “on-the-books” federal and state regulations that affect emissions source categories in the O&G industry.
18 https://www.epa.gov/controlling-air-pollution-oil-and-natural-gas-industry 19 https://www.epa.gov/stationary-engines/new-source-performance-standards-stationary-spark-ignition-internal-combustion 20 https://www.epa.gov/vehicles-and-engines

January 2018 DRAFT
34
Table 3-3. Summary of federal and state “on-the-books” regulations affecting O&G source categories considered in this inventory.
Source Category Regulation Enforcing
Agency Applicability Effective Date
Drill Rigs, Fracturing Engines Nonroad engine Tier standards (1-4): Limits emission rates for compression ignition engines.
US EPA All applicable off-road
mobile engine categories
Phase-in from 1996 - 2014
Pneumatic Controllers
NSPS Subpart OOOO: Six standard cubic-feet per hour (scfh) at well sites (i.e. low bleed gas-driven pneumatic controllers). BLM Methane Rule: Requires operators to replace high-bleed pneumatic controllers with low-bleed or no-bleed pneumatic controllers.
US EPA and US BLM
Non-Federal: New and modified1 sources only
(NSPS OOOO and OOOOa)
Federal: new and
existing sources (NSPS OOOO, NSPS OOOOa,
and BLM Methane Rule)
NSPS OOOO: August 2011 BLM Methane Rule: Phase-in from January 2017
Compressor Engines, Artificial Lift Engines
NSPS Subpart JJJJ: Limits emission rates for spark ignition engines.
US EPA New and modified
spark-ignition engines Phase-in from 2005 to 2011
Well Completions
NSPS Subpart OOOO and OOOOa: Green completions required at gas and oil well sites except for specific well types (wildcat, delineation, oil wells with a gas-oil ratio of less than 300 standard cubic-feet of gas per barrel, and oil wells for which a gas pipeline is not available). BLM Methane Rule: Compliance with NSPS Subpart OOOO and OOOOa requirements is sufficient for compliance with BLM Methane Rule.
US EPA and BLM
All applicable completions
NSPS OOOO and OOOOa: Phase-in
from 2015
Storage Tanks
NSPS Subpart OOOO and OOOOa: Storage vessels with VOC emissions equal to or greater than 6 tpy must reduce emissions by at least 95 percent. This can be accomplished by routing emissions to a combustion device.
US EPA and US BLM
Non-Federal: New and modified1 sources only
(NSPS OOOO and OOOOa)
NSPS OOOO and OOOOa: August 2011 BLM Methane Rule: Phase-in

January 2018 DRAFT
35
Source Category Regulation Enforcing
Agency Applicability Effective Date
BLM Methane Rule: Requires operators to route storage vessel vapor gas to a sales line, if the storage vessel has the potential to emit at least 6 tpy of VOCs.
Federal: New and existing sources (BLM
Methane Rule)2
from January 2017
Associated Gas Venting and Flaring
BLM Methane Rule: Rule requires increases to the amount of casinghead gas that is captured to 90 percent in 2020, 95 percent in 2023, and 98 percent in 2026.
US BLM
Non-Federal: not applicable
Federal: new and
existing sources (BLM Methane Rule)
BLM Methane Rule: Phase-in from January 2017
Fugitives BLM Methane Rule and NSPS Subpart OOOOa: LDAR programs are required at applicable well sites.
US EPA and US BLM
Non-Federal: new and modified sources (NSPS
OOOOa)
Federal: new and existing sources (BLM
Methane Rule)
NSPS OOOOa : Phase in from 2015 BLM Methane Rule: Phase in from January 2017
Pneumatic Pumps
NSPS Subpart OOOOa: Route emissions from pneumatic diaphragm pumps to existing onsite control device, if available. BLM Methane Rule: Operator must replace pneumatic diaphragm pumps that operate 90 or more days per year with zero-emissions pumps, if technical feasible and not unduly costly, or route pneumatic diaphragm pump emissions to a control device.
US EPA and BLM
Non-Federal: new and modified sources (NSPS
OOOOa)
Federal: new and existing wells (BLM
Methane Rule)
NSPS OOOOa: Phase in from 2015 BLM Methane Rule: Phase in from January 2017
Liquids Unloading
BLM Methane Rule: Operator must use best practices to limit emissions associated with liquids unloading (e.g., use of plunger lifts, staying on-site during manual purging).
US BLM Federal: new and
existing wells (BLM Methane Rule)
BLM Methane Rule: Phase in from January 2017
1 The fraction of sources that would be classified as "modified" under NSPS OOOO and/or NSPS OOOOa is unavailable. Controls were applied to new sources only. 2 If an operator determines that VRU installation is technically infeasible or unduly costly, the operator may instead route the tank vapor gas to a combustor or flare.
January 2018 DRAFT
36
The methodology used to estimate each control’s effect on nonpoint source O&G emissions is presented below. Point source O&G emissions may also be subject to additional control per requirements such as NSPS Subpart OOOO, NSPS Subpart OOOOa, and the BLM Methane Rule; however, information was not readily available from point source emission inventory databases upon which to estimate the effect on emissions of such controls. Point source O&G emission forecasts do not include additional control resulting from regulatory control programs.
3.2.1 Nonroad Diesel Engine Standards and Fuel Sulfur Standards
EPA MOVES 2014a (EPA, 2015) was run with default inputs for base year 2014 and future year 2028. Model outputs were used to develop basin-wide emissions per unit population for “other oil field equipment” (SCC 2270010010) for base year 2014 and future year 2028. Emissions per unit population reflect the predicted fleet mix of engines – for various tier standards from baseline uncontrolled engines through Tier IV engines – and are used as a representation of fleet turnover for drilling rigs and fracing engines. The ratios of 2028 to 2014 per unit emissions are the control factors estimates which account for federal non-road tier standards and diesel fuel sulfur standards.
3.2.2 New Source Performance Standards and BLM Methane Rule for Pneumatic Devices
Pneumatic device control factors were developed according to NSPS Subpart OOOO and OOOOa and BLM Methane Rule requirements.
III. Federal wells: Pneumatic devices at all (existing and new) wells were assumed to be low-bleed (i.e. less than 6 standard cubic-feet per hour bleed rate)12.
IV. Non-federal wells: Pneumatic devices at new wells were assumed to be low-bleed devices and pneumatic devices at existing wells were assumed to be unchanged from the base year.
3.2.3 New Source Performance Standards and BLM Methane Rule for Completions
NSPS Subpart OOOO and OOOOa require control of emissions from (i) hydraulically fractured gas well completions by flare from August 23, 2011 to December 31, 2014 and with green completion technology from January 1, 201521 and (ii) hydraulically fractured oil well completions by green completion technology from September18, 201522. It was assumed that all completions in future year 2028 will use green completion technology with 99% control efficiency.
21 Fact Sheet: Summary of Requirements for Processes and Equipment at Natural Gas Well Sites. https://www.epa.gov/sites/production/files/2016-09/documents/20120417_natural_gas_summary_gas_well.pdf 22 Fact Sheet Proposed Climate, Air Quality and Permitting Rules for the Oil and Natural Gas Industry https://www.epa.gov/sites/production/files/2016-09/documents/og_fs_081815.pdf
January 2018 DRAFT
37
3.2.4 New Source Performance Standards and BLM Methane Rule for Crude Oil and Condensate Tanks
Crude oil and condensate tank control factors were developed according to NSPS Subpart OOOO and OOOOa and BLM Methane Rule requirements.
I. NSPS Subpart OOOO requires control of condensate and oil tank VOC emissions for tanks that emit over 6 tons per year VOC if the source was constructed or modified after August 23, 2011, NSPS OOOOa extends the requirements to control of methane emissions. The compliance deadline was April 15, 2014 for tanks constructed after April 12, 2013 and April 15, 2015 for tanks constructed between August 23, 2011 and April 12, 201323.
II. BLM Methane rule requires control of new and existing tanks that emit over 6 tons per year VOC12. The rule requires that storage vessel vapor gas be routed to a sales line, if the storage vessel has the potential to emit at least 6 tpy of VOCs starting from January 2015 unless technically infeasible or unduly costly.
Ramboll estimated control scalars for tanks at new non-federal wells and all federal (existing and new) wells. Control factors are based on application of control to tanks with the potential to emit 6 tons per year VOC, but not to tanks with the potential to emit less than 6 tons per year VOC. For non-federal well tank emissions added after base year 2014, 73% percent of oil tank and 77% of condensate tank emissions were assumed to be controlled by flare24. For all federal well tank emissions, 73% percent of oil tank and 77% of condensate tank emissions were assumed to be controlled by VRU.
3.2.5 New Source Performance Standards for Compressor Engines
US EPA NSPS Subpart JJJJ19 requirements are applicable to natural gas-fueled nonpoint artificial lift engines and wellhead compressor engines as well as natural gas-fueled point source reciprocating engines. Permian Basin gas production is estimated to decline from base year 2014 to future year 2028, so the effects of NSPS Subpart JJJJ are expected to be limited to engine turnover and limited new midstream infrastructure build-outs. Information necessary (e.g., fleet turnover rates and engine specific emission rates) to estimate the effects of NSPS Subpart JJJJ on applicable point source engines was not readily available; therefore, future year 2018 forecasts were not adjusted to incorporate the effects of NSPS Subpart JJJJ on point source engine emissions (i.e., fleet turnover of point source engines between 2014 and 2028 is not accounted for). Artificial lift engine emission factor estimates in base year 2014 were below NSPS Subpart JJJJ requirements, hence no additional control was estimated for this source category.
23 Fact Sheet: Final Updates to Requirements for Storage Tanks Used in Oil and Natural Gas Production and Transmission. https://www.epa.gov/sites/production/files/2016-09/documents/20120417_natural_gas_summary_gas_well.pdf 24 The fraction of crude oil and condensate tanks with emissions greater than 6 tons per year VOC was estimated based on base year 2014 tank flashing emission factors and per well production activity from IHS database. We assumed that all production at each well site was sent to a single tank (i.e. multi-tank sites were not considered) because information was not available to estimate the number of tanks per well site.

January 2018 DRAFT
38
3.2.6 BLM Methane Rule for Associated Gas Venting and Flaring
Under this rule, operators are required to increase capture of casinghead gas. By 2026 98% of casinghead gas must be captured. Permian Basin-wide, over 99% of base year 2014 casinghead gas was estimated to be captured; 94% of casinghead gas that was not captured was flared and the remaining 6% was vented. Given that basin-wide casinghead gas capture estimates in base year 2014 met 2026 operator specific limits, no additional control was estimated for this source category. The casinghead gas provision of the BLM Methane Rule was designed specifically to address casinghead gas releases in new development areas (such as the Bakken) where lack of gas gathering infrastructure led to substantial casinghead gas releases. The Permian Basin is a mature O&G development area with substantial gas gathering infrastructure, so the assumption that it already is in compliance with BLM Methane Rule capture requirements is not unexpected.
3.2.7 New Source Performance Standards and BLM Methane Rule for Fugitive Devices
NSPS Subpart OOOOa requires routine fugitive leak monitoring for well sites and compressor stations constructed or modified after September 18, 2015. The BLM Methane rule has similar fugitive leak monitoring requirements for both existing and new wells starting from January 2015. Gas production is estimated to decline from 2014 to 2028, hence no additional control was applied to non-federal gas wells fugitive component emissions. LDAR program requirements specify that LDAR surveys are conducted twice annually after the initial survey. LDAR implementation is assumed to result in 50% reductions to fugitive component emissions at new non-federal wells and all (existing and new) federal wells based on average reductions from annual and quarterly inspections reductions assumed in CDPHE (2014).
3.2.8 New Source Performance Standards and BLM Methane Rule for Pneumatic Pumps
Emission control factors for pneumatic pumps resulting from NSPS Subpart OOOOa and the BLM Methane Rule were not estimated. NSPS Subpart OOOOa and the BLM Methane Rule requirements apply only to diaphragm pumps but not lean glycol circulation pumps or piston-driven chemical injection pumps. The base year inventory was based on generic pneumatic pump configurations which did not distinguish pump type. Not including additional control of pneumatic pumps per on-the-books regulations is consistent with CARMMS 2.0 low and high scenario inventories.
3.2.9 New Source Performance Standards and BLM Methane Rule for Liquids Unloading
The BLM Methane Rule requires the use of best practices to limit emissions associated with liquids unloading (e.g., use of plunger lifts, staying on-site during manual purging). It was not feasible to estimate the effect of BLM Methane Rule requirements on liquids unloading emission rates in the Permian Basin because information on the extent to which best practices were employed in base year 2014 is not available. Emission control factors for liquids unloading resulting from the BLM Methane Rule were not estimated.
3.2.10 Summary
Permian Basin future year 2028 control factors are presented in Table 3-4.

January 2018 DRAFT
39
Table 3-4. Percent reduction in Permian Basin future year 2028 nonpoint emissions resulting from emission control programs25.
Well Type Nonpoint Source Existing Federal New Federal New Non-Federal
NOx VOC CO SOx PM10 NOx VOC CO SOx PM10 NOx VOC CO SOx PM10
Gas Wells
Condensate Tanks -100% -65% -100% 0% 0% -100% -65% -100% 0% 0% 128% -63% 128% 0% 0%
Drilling Engines -69% -39% -87% -57% -83% -69% -39% -87% -57% -83%
Fracing Engines -48% -48% -83% -56% -73% -48% -48% -83% -56% -73%
Fugitive Components -50% -50%
Pneumatic Devices -37% -37%
Initial Completions -100% -97% -100% 0% 0% -100% -97% -100% 0% 0%
Oil Wells
Oil Tanks -100% -63% -100% 0% 0% -100% -63% -100% 0% 0% 175% -81% 175% 0% 0%
Drilling Engines -67% -38% -87% -57% -82% -67% -38% -87% -57% -82%
Fracing Engines -48% -48% -83% -56% -73% -48% -48% -83% -56% -73%
Fugitive Components -50% -50% -50%
Pneumatic Devices -37% -37% -37%
Initial Completions -100% -97% -100% 0% 0% -100% -97% -100% 0% 0%
25 GHG emission reductions are based on criteria pollutant emission reductions. Methane and CO2 emission reductions are assumed equivalent to VOC emissions reductions for tank losses, fugitive components, pneumatic devices, and initial completion losses. Methane, CO2, and N2O emission reductions are assumed equivalent to NOx emission reductions for flaring. For engines, CO2 and N2O emission reductions are assumed negligible; methane emission reductions are assumed equivalent to VOC emission reductions.
January 2018 DRAFT
40
4.0 SUMMARY RESULTS
Future year forecast emission inventory summaries are provided below for the Greater San Juan and Permian basins. Additional summary tables and charts and detailed emission inventory data are available in spreadsheets posted on the Greater San Juan and Permian Basin O&G Emission Inventory Project website26.
4.1 Greater San Juan Basin
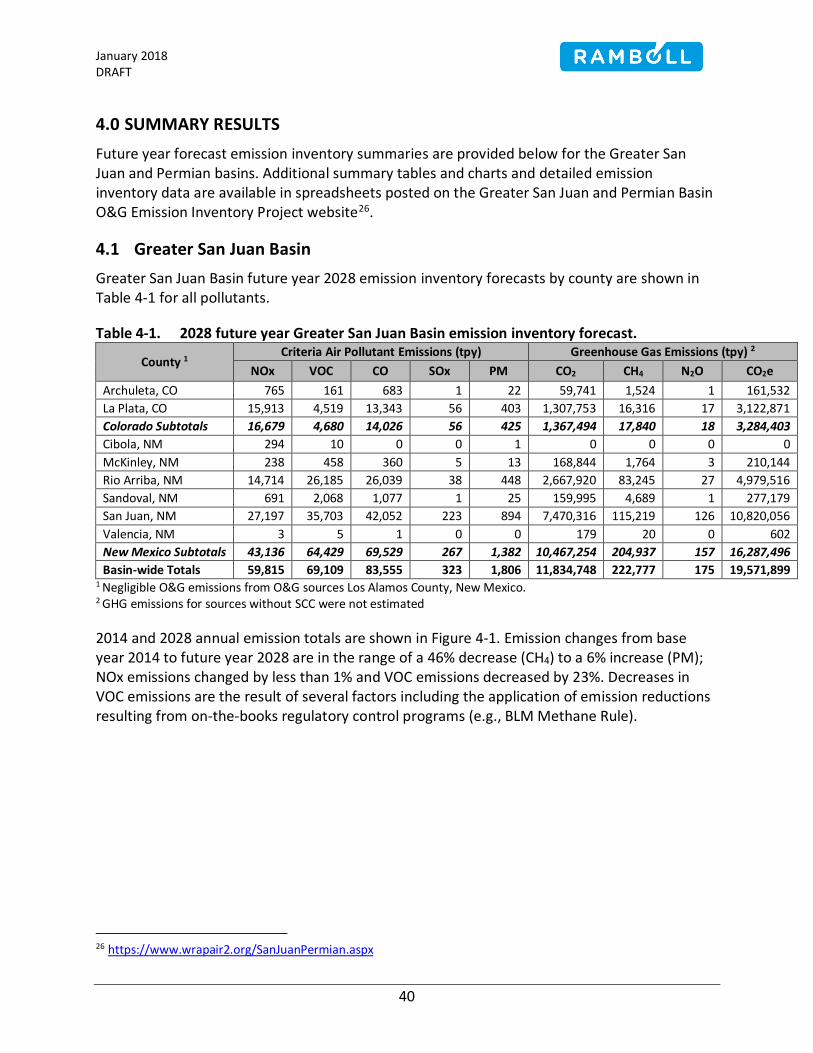
Greater San Juan Basin future year 2028 emission inventory forecasts by county are shown in Table 4-1 for all pollutants.
Table 4-1. 2028 future year Greater San Juan Basin emission inventory forecast.
County 1 Criteria Air Pollutant Emissions (tpy) Greenhouse Gas Emissions (tpy) 2
NOx VOC CO SOx PM CO2 CH4 N2O CO2e
Archuleta, CO 765 161 683 1 22 59,741 1,524 1 161,532
La Plata, CO 15,913 4,519 13,343 56 403 1,307,753 16,316 17 3,122,871
Colorado Subtotals 16,679 4,680 14,026 56 425 1,367,494 17,840 18 3,284,403
Cibola, NM 294 10 0 0 1 0 0 0 0
McKinley, NM 238 458 360 5 13 168,844 1,764 3 210,144
Rio Arriba, NM 14,714 26,185 26,039 38 448 2,667,920 83,245 27 4,979,516
Sandoval, NM 691 2,068 1,077 1 25 159,995 4,689 1 277,179
San Juan, NM 27,197 35,703 42,052 223 894 7,470,316 115,219 126 10,820,056
Valencia, NM 3 5 1 0 0 179 20 0 602
New Mexico Subtotals 43,136 64,429 69,529 267 1,382 10,467,254 204,937 157 16,287,496
Basin-wide Totals 59,815 69,109 83,555 323 1,806 11,834,748 222,777 175 19,571,899 1 Negligible O&G emissions from O&G sources Los Alamos County, New Mexico. 2 GHG emissions for sources without SCC were not estimated
2014 and 2028 annual emission totals are shown in Figure 4-1. Emission changes from base year 2014 to future year 2028 are in the range of a 46% decrease (CH4) to a 6% increase (PM); NOx emissions changed by less than 1% and VOC emissions decreased by 23%. Decreases in VOC emissions are the result of several factors including the application of emission reductions resulting from on-the-books regulatory control programs (e.g., BLM Methane Rule).
26 https://www.wrapair2.org/SanJuanPermian.aspx
January 2018 DRAFT
41
Figure 4-1. Greater San Juan Basin 2014 base year and 2028 future year emissions27.
4.2 Permian Basin
Permian Basin future year 2028 emission inventory forecasts by county are shown in Table 4-2 for all pollutants.
Table 4-2. 2028 future year Permian Basin emission inventory forecast (excludes Texas portion of the Permian Basin).
County
Criteria Air Pollutant Emissions (tpy) Greenhouse Gas Emissions (tpy) 1
NOx VOC CO SOx PM CO2 CH4 N2O CO2e
Chaves 691 3,731 706 89 8 132,509 13,016 2 406,369
Eddy 11,521 52,748 12,424 4,992 216 3,679,132 174,386 57 7,358,809
Lea 14,141 56,060 12,006 7,515 317 3,834,441 201,415 57 8,081,957
Roosevelt 120 354 134 20 1 24,974 1,184 0 49,929
Totals 26,473 112,893 25,270 12,616 541 7,671,057 390,001 116 15,897,063 1GHG emissions for sources without SCC were not estimated
2014 and 2028 total annual emissions are shown in Figure 4-2. Changes in emissions from base year 2014 to future year 2028 are in the range of a 25% decrease (N2O and PM) to a 9% increase (CO2); emissions decreased by 13% for NOx and 7% for VOC. Decreases in NOx and VOC emissions result from a 12% decrease in gas production from 2014 to 2028 and on-the-
27 GHG emissions for sources without SCC were not estimated

January 2018 DRAFT
42
books emission control program (e.g., NSPS and BLM Methane Rule) effects which more than offset 30% oil production growth.
Figure 4-2. Permian Basin 2014 base year and 2028 future year emissions (excludes Texas portion of the Permian Basin)27.

January 2018 DRAFT
43
5.0 REFERENCES
CDPHE, 2014. “Regulatory Analysis for Proposed Revisions to Colorado Air Quality Control Commission Regulation Numbers 3, 6 and 7 (5 CCR 1001-5, 5 CCR 1001-8, and CCR 1001-9)”. Colorado Department of Public Health and Environment. February 2014.
CDPHE, 2017. Personal Communication with CDPHE staff (Dale Wells). Colorado Department of Public Health and Environment. April 2017.
EPA. 1995a. U.S. Environmental Protection Agency. "Protocol for Emission Leak Emission Estimates." US Environmental Protection Agency Office of Air Quality Planning and Standards, November 1995.
EPA. 2014a. Technical Support Document (TSD) Preparation of Emissions Inventories for the Version 6.1, 2011 Emissions Modeling Platform. US Environmental Protection Agency Office of Air and Radiation, Office of Air Quality Planning and Standards, Air Quality Assessment Division. Available Online: https://www.epa.gov/air-emissions-modeling/emissions-modeling-platforms
EPA. 2015. US Environmental Protection Agency, Office of Transportation and Air Quality. MOVES 2014a. November 2015. http://www.epa.gov/otaq/models/moves/index.htm
Grant, J., R. Parikh, A. Bar-Ilan. 2017. Memorandum: Greater San Juan and Permian Basin Future Year Emission Inventory Forecasts. Ramboll Environ. September 2017.
Parikh, R., J. Grant, A. Bar-Ilan. 2017 “Development of Baseline 2014 Emissions from Oil and Gas Activity in Greater San Juan Basin and Permian Basin”. Ramboll Environ. November 2017.
Vijayaraghavan et al., 2017. “2025 CAMx Modeling Results for the High, Low and Medium Oil and Gas Development Scenarios CARMMS 2.0. Final Report”. Ramboll Environ and Kleinfelder. August 2017.