fusion method of fingerprint quality evaluation: from the
TRANSCRIPT

J. Blanc-Talon et al. (Eds.): ACIVS 2006, LNCS 4179, pp. 776 – 785, 2006. © Springer-Verlag Berlin Heidelberg 2006
Fusion Method of Fingerprint Quality Evaluation: From the Local Gabor Feature to the Global
Spatial-Frequency Structures
Decong Yu1, Lihong Ma1,2, Hanqing Lu2, and Zhiqing Chen3
1 GD Key Lab. of Computer Network, Dept. of Electronic Engineering, South China Univ. of Tech., Guangzhou, China, 510640
[email protected], [email protected] 2 National Lab of Pattern Recognition, Inst. Automation, Chinese Academy of Science,
Beijing, China 100080 [email protected]
3 Criminal Tech. Center, Dept. of Public Security of Guangdong Province, China 510050 [email protected]
Abstract. We propose a new fusion method to evaluate fingerprint quality by combining both spatial and frequency features of a fingerprint image. In fre-quency domain, a ring structure of DFT magnitude and directional Gabor fea-tures are applied. In spatial domain, black pixel ratio of central area is taken into account. These three features are the most efficient indexes for fingerprint quality assessment. Though additional features could be introduced, their slight improvement in performance will be traded off with complexity and computa-tional load to some extent. Thus in this paper, each of the three features are first employed to assess fingerprint quality, their evaluation performance are also discussed. Then the suggested fusion approach of the three features is presented to obtain the final quality scores. We test the fusion method in our public secu-rity fingerprint database. Experimental results demonstrate that the proposed scheme can estimate the quality of fingerprint images accurately. It provides a feasible rejection of poor fingerprint images before they are presented to the fingerprint recognition system for feature extraction and matching.
1 Introduction
Fingerprint recognition system is widely used in criminal identification, ATM card verification and access control, due to its feature’s individual uniqueness and age invariability. But the performance of an Automatic Fingerprint Identification System (AFIS) depends heavily on fingerprint quality which mainly concerned with skin humidity, impressing pressure, dirt, sensing mechanism, scar and other factors. A fingerprint of good quality should have clear ridge and valley patterns, and could guarantee a high performance of recognition. Therefore, an efficient criterion for fingerprint quality evaluation will be of benefit to practical applications, such as qual-ity control of fingerprint acquisition, quality distribution analysis of fingerprint data-base, and threshold decision for modification of low quality images. If the fingerprint

Fusion Method of Fingerprint Quality Evaluation 777
quality is assessed at first, the images of poor quality could be discarded and the fin-gerprint acquisition repeated, the AFIS performance will finally be greatly improved.
Some methods have been proposed to evaluate fingerprint quality in the past few years. Hong et al [1] quantified the quality of a fingerprint image by measuring the block variance of gray levels, which was computed in directions orthogonal to the orientation field. The variance was then used to decide the fingerprint quality in terms of the contrast of a considered block. However, this method had to be carried out in a precise orientation field which may not be correctly obtained in heavy noise situation. In addition, it is computational expensive. Ratha and Bolle [2] proposed another method for quality estimation in wavelet domain for Wavelet Scalar Quantization (WSQ) images. But WSQ is not a necessary step for uncompressed fingerprint images in AFIS. Shen et al [3] described a Gabor feature based approach to quality measure-ment, it also suffers from the parameter setting and excessive computation load of Gabor transform. Lim et al [4] employed the ratio of eigenvalues of the gradient vec-tors to estimate local ridge and orientation certainty, and determined the quality with the orientation flow. This can indicate the confidence of orientation estimation, pro-vided the noise is not directional distributed. Other quality assessments include the Fourier spectrum based method [5] and the gradient oriented scheme [6], all these methods utilized only the partial information which is not sufficient to measure a fingerprint image. Hence, Global and local information should be combined together to accomplish the evaluation task. A hybrid method joined seven local and global features of fingerprint [7] to assess quality was reported in 2005. But it is difficult to balance the quality weight of each feature, its linear weighting does not regard the nonlinear contributions of some features.
In this paper, our research is focused on an accurate and feasible method for fin-gerprint quality measurement. A new nonlinear fusion method for quality scoring is suggested based on the combination of three efficient quality features: ring structures in frequency spectrum, Gabor features denoted directional information, and the black pixel ratio of central region which reflects the contrast and the integrity of the ridge and valley patterns. Since the central region around a core point is vital to fingerprint quality evaluation, all the calculation is performed on the central region of a core with the background region removing.
The remainder of this paper is organized as follows. Different quality features and their evaluation performance are presented in Section2. The new fusion criterion and the quality scoring principle are proposed in Section 3. Experimental results are shown in Section 4 to demonstrate the validness of our method. Finally, the conclu-sions and discussions are given in Section 5.
2 Features and Evaluation
The fingerprint quality could be examined by many features. Three most important ones to quantity the fingerprint image quality include black pixel ratio of central area, ring structure of frequency spectrum, and directional Gabor Feature. In this section, we define three quality scoring functions with corresponding respect to these three features. The quality evaluation performances of each feature are compared as well.

778 D. Yu et al.
2.1 Black Pixel Ratio of Central Area
Gray level distribution of the region around a core point is an essential index for fin-gerprint quality evaluation. Fingerprint images with high contrast relate to the well separated ridges and valleys. The smearing of wet fingerprint, the disconnected ridges in dry images and the background pixels introduced in a fingerprint will bias the ridge-valley contrast, thus a good quality image will have high contrast between ridges and valleys, while a poor quality image has low pattern contrast, and its ridge-valley structures are usually corrupted to some extent.
To quantify the ridge-valley contrast, let the black pixel ratio be RB and the number of black pixels be NB, w is the region length and width.
2w
NR B
B = (1)
We suggest that a quality score Q1can be calculated as follows:
⎪⎪⎪⎪
⎩
⎪⎪⎪⎪
⎨
⎧
<⎟⎠⎞
⎜⎝⎛ −⎟⎠⎞
⎜⎝⎛
≤≤−−
>⎟⎠⎞
⎜⎝⎛ −−⎟⎠⎞
⎜⎝⎛ −
=
lmeanBmean
hmeanlB
hmeanBmean
ThGRG
ThGThR
ThGRG
Q
31
150
|6.0|1
3
11
1502
1
(2)
Where Gij is the intensity of pixel (i,j). Gmean denotes the average intensity of the 320×320 central region with w =320 is the region length and width.
∑∑==
=w
jij
w
imean G
wG
112
1. (3)
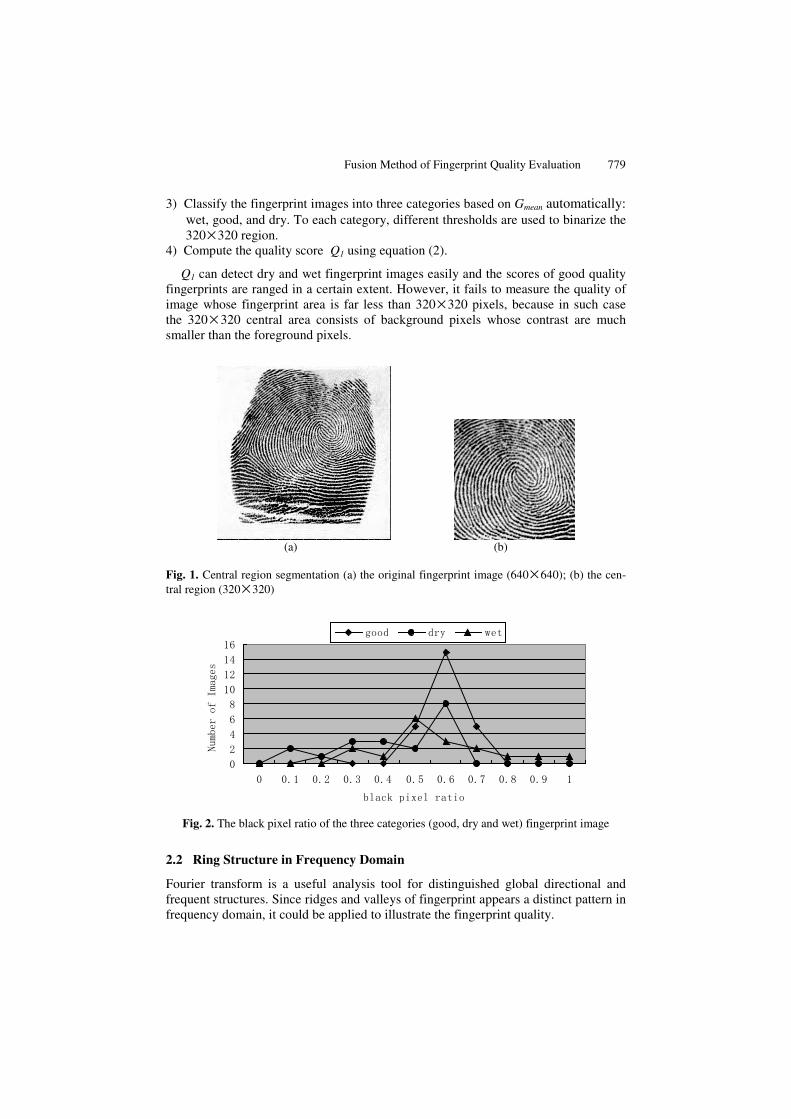
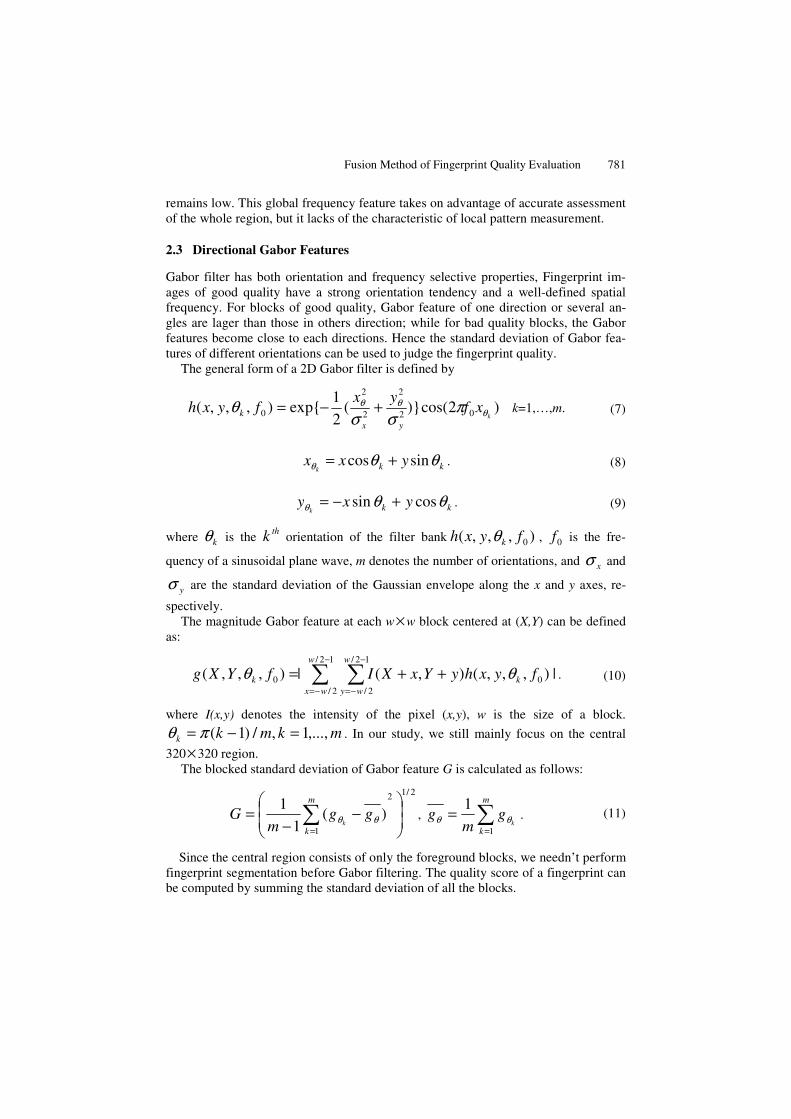
For comparison, the original image and its central region are shown in Fig.1. This scoring function is derived from RB statistical analysis of the three categories
fingerprint images as shown in Fig.2. We could observe from Fig.2 that a wet image with a lower RB, the better quality is. In contrast, the lower the black pixel ratio is, and the worse a dry image will be. On the other hand, good quality fingerprint has an around constant RB and Gmean is valued between Thl and Thh. Thl and Thh are deter-mined empirically. When RB is far from the constant, the fingerprint quality declines quickly. Based on the above ideas, the quality score Q1 is given as the afore men-tioned equation (2).
The steps of fingerprint image quality evaluation by Q1 are described below.
1) Locate the core point of a fingerprint image [8]. If no core point was detected, the image center is taken as a core point.
2) Compute the average gray level of the 320×320 central region, whose center is located at the core point.
Fusion Method of Fingerprint Quality Evaluation 779
3) Classify the fingerprint images into three categories based on Gmean automatically: wet, good, and dry. To each category, different thresholds are used to binarize the 320×320 region.
4) Compute the quality score Q1 using equation (2).
Q1 can detect dry and wet fingerprint images easily and the scores of good quality fingerprints are ranged in a certain extent. However, it fails to measure the quality of image whose fingerprint area is far less than 320×320 pixels, because in such case the 320 × 320 central area consists of background pixels whose contrast are much smaller than the foreground pixels.
(a) (b)
Fig. 1. Central region segmentation (a) the original fingerprint image (640× 640); (b) the cen-tral region (320× 320)
Fig. 2. The black pixel ratio of the three categories (good, dry and wet) fingerprint image
2.2 Ring Structure in Frequency Domain
Fourier transform is a useful analysis tool for distinguished global directional and frequent structures. Since ridges and valleys of fingerprint appears a distinct pattern in frequency domain, it could be applied to illustrate the fingerprint quality.

780 D. Yu et al.
The DFT image of a good quality fingerprint image shows a ring around the origin of the frequency coordinate, because the ridge-valley patterns are quasi-periodic structures and presents a dominant frequency in most directions with an almost uni-form modulus. In contrast, fingerprint images of bad quality do not appear an obvious ring in the spectrum plane, for they contain smear points, blurred edges, disconnected ridges and so on which occupy a wide range of frequency.
Making use of the above frequency characteristic of ridge-valley structures, we could modify the scoring function Q2 firstly defined [5]:
∑=
=359
022
1
θθF
CQ . (4)
where C2 is a constant normalizing the quality score in the range [0,1].
),(),(),(2 llssmm yxPyxPyxPF θθθθ −−= . (5)
),( mm yxPθ denotes the largest ring along the angle θ in magnitude spectrum,
and ),(2
1),( mmss yxyx = , and ),(
2
3),( mmll yxyx = are the reference points
along the same direction. In this paper, we detect the maximum spectrum ring first to retain an accurate qual-
ity score before the calculation of equation (4). This modification is based on the fact that the variation of ridge-valley distance in different fingerprints will result in a nega-
tive θF if we compute equation (5) directly. The detection is performed by selecting
the ith ring with the following equation:
⎩⎨⎧= ∑
=
}),({,359
0θθ yxPMaxii
i, 4030 ≤≤ i . (6)
where ),( yxPθ denotes the frequency band, and ),( yx is its coordinate. The integer
i is the radius of the maximum spectrum ring.
The ),( yxPθ band located at 30 to 40 pixels from the origin along the angleθ , be-
cause the central area of the fingerprint image is 320× 320 region of interest, its aver-age ridge and valley distance is around 9 pixels, thus the corresponding ring of high spectrum magnitudes will appear in the frequency band located at 30 to 40 pixels away from the origin in the spectrum image.
Our algorithm can be briefly stated as follows:
1) Locate the core point of a fingerprint image. 2) Perform FFT on the 320× 320 central region. 3) Find the largest ring in frequency plane using equation (6). 4) Compute the score Q2 with regard to the largest spectrum ring using eq. (4).
Since Fourier transform is calculated on the whole central region, Q2 is a global es-timate to fingerprint quality. Even if the fingerprint is partially bad, its quality score
Fusion Method of Fingerprint Quality Evaluation 781
remains low. This global frequency feature takes on advantage of accurate assessment of the whole region, but it lacks of the characteristic of local pattern measurement.
2.3 Directional Gabor Features
Gabor filter has both orientation and frequency selective properties, Fingerprint im-ages of good quality have a strong orientation tendency and a well-defined spatial frequency. For blocks of good quality, Gabor feature of one direction or several an-gles are lager than those in others direction; while for bad quality blocks, the Gabor features become close to each directions. Hence the standard deviation of Gabor fea-tures of different orientations can be used to judge the fingerprint quality.
The general form of a 2D Gabor filter is defined by
)2cos()}(2
1exp{),,,( 02
2
2
2
0 kxf
yxfyxh
yxk θ
θθ πσσ
θ +−= k=1,…,m. (7)
kk yxxk
θθθ sincos += . (8)
kk yxyk
θθθ cossin +−= . (9)
where kθ is the thk orientation of the filter bank ),,,( 0fyxh kθ , 0f is the fre-
quency of a sinusoidal plane wave, m denotes the number of orientations, and xσ and
yσ are the standard deviation of the Gaussian envelope along the x and y axes, re-
spectively. The magnitude Gabor feature at each w×w block centered at (X,Y) can be defined
as:
|),,,(),(|),,,(12/
2/
12/
2/00 ∑ ∑
−
−=
−
−=
++=w
wx
w
wykk fyxhyYxXIfYXg θθ . (10)
where I(x,y) denotes the intensity of the pixel (x,y), w is the size of a block.
mkmkk ,...,1,/)1( =−= πθ . In our study, we still mainly focus on the central
320×320 region. The blocked standard deviation of Gabor feature G is calculated as follows:
2/12
1
)(1
1⎟⎟⎠
⎞⎜⎜⎝
⎛−
−= ∑
=
m
k
ggm
Gk θθ , ∑
=
=m
kk
gm
g1
1θθ . (11)
Since the central region consists of only the foreground blocks, we needn’t perform fingerprint segmentation before Gabor filtering. The quality score of a fingerprint can be computed by summing the standard deviation of all the blocks.

782 D. Yu et al.
∑=
=N
i
iGC
Q13
3 )(1
. (12)
where C3 is also a normalizing constant ranging the quality score form 0 to 1. In summary, Q3 is aimed at assessing the orientation properties of fingerprint,
strong orientation relates to good quality. The quality estimation by Q3 can also be depicted as follows:
1) Locate the core point of the fingerprint image. 2) Divide the 320×320 central region into N blocks of size w×w. 3) For each block centered at pixel (i,j), compute the m Gabor features and stan-
dard deviation value G by equations (10) and (11) respectively. 4) Obtain the quality score Q3 by summing standard deviation value G of all the
blocks using equation (12).
3 Fusion Criterion and Quality Scoring
In this section, we will present a novel fusion criterion combined the three evaluation results mentioned before. Since each method has its advantages and drawbacks, our research mainly aims at finding an optimal fusion criterion making benefits of the above assessment.
We define a fusion criterion which calculates a quality score Q according to:
∑=
=3
1
1
i
kii
iQwC
Q , 2,1=ik . (13)
where C is a normalizing constant which ranges the quality score in [0,1], iw denotes
the weight of each quality score Qi, and ki is a power factor of each quality score Qi. The above three features contribute differently to fingerprint quality evaluation.
The fingerprint images of three categories are labeled as two kinds good quality and bad quality images merging the original wet and dry fingerprints. The values of Fou-rier and Gabor features are large to good fingerprint images. While, the value of RB of central region is abnormal to bad fingerprint images, Q1 can efficiently detect the bad quality images, so the weight of Q1 will be bigger to bad quality images than others, and k1 k2 and k3 are set to 1,2 and 2 respectively, while Q2 and Q3 can quantify the good quality images very well, the weights of these two scores are bigger than Q1, and k1 k2 k3 are set to 2,1 and 1 respectively. Based on the above analysis, the fusion qual-ity score Q is defined as equation (13).
As the contribution of each feature to the final quality score is nonlinear, the above equation can perform a better classification of good and bad images than the linear method, which will be given in section 4.
4 Experimental Results
The fingerprint database used in this experiment consists of 62 fingerprint images. The size of each fingerprint image is 640×640 pixels with the resolution of 500dpi

Fusion Method of Fingerprint Quality Evaluation 783
and 256 gray levels. And our research focuses on the 320×320 central region, the size of each block is 16× 16 pixels. We verify the evaluation performance of our method on this public security fingerprint database using black pixel ratio of central area, directional Gabor feature and ring structures of spectrum. Fig. 3 shows the im-age score distribution of the three different feature evaluation methods and the score distribution of the fusion approach.
As shown in Fig. 3, the Gabor feature method and Fourier spectrum method can easily classify the fingerprint images into two groups: good and bad quality. The cen-tral area black white pixel ratios method is able to detect bad fingerprint images whose black pixel ratio of central area is abnormal. To some images, though the Gabor feature score and Fourier spectrum score are high, the central area score is low. Under this similar circumstance, the fusion method is needed for getting a reasonable score.
Fig. 3 demonstrates that the fusion method can find the poor quality images easily. After observing the images, we find that those fingerprint images whose final score are less than 0.1 have very bad quality. In order to test our proposed fusion method, we have sent these images to fingerprint classification system [8]. With ten percents finger-print images of poor quality rejected, the five-classification (whorl, right loop, left loop, arch and tented arch) accuracy can be increased from 90.6 percent to 94.3 percent.
Fig. 4 show the score distribution of our nonlinear fusion method and the linear method [7]. From the figure, we can find that nonlinear method show better perform-ance of distinguishing good and bad fingerprint images as described in section 3. In order to compare with the results of linear method, we have also sent these images to fingerprint classification system [8]. Based on the linear method, we reject ten per-cents fingerprint images of poor quality, the five-classification accuracy can be in-creased from 90.6 percent to 92.5 percent. We can get the conclusion that fingerprint classification based on our fusion method shows 1.8 percent better classification accu-racy than the linear method.
By rejecting 25 percent images of bad quality according to our fusion method of fingerprint quality evaluation, the fingerprint classification accuracy will be increased to 96 percent.
Fig. 3. Fingerprint image quality score distribution of different methods

784 D. Yu et al.
Fig. 4. Fingerprint image quality score distribution of nonlinear and linear methods
(a) (b) (c)
Fig. 5. Typical Fingerprint images: (a) good fingerprint; (b) dry fingerprint; (c) wet fingerprint
Fig.5 shows three typical fingerprint images. Based on our fusion method of fin-gerprint quality evaluation, fingerprint Fig.5 (a) whose contrast between ridges and valleys is high has the best score of all the fingerprints, fingerprint Fig.5 (b) with largely corrupted ridge structure and low contrast between ridges and valleys is the worst of all the dry fingerprints, and fingerprint Fig.5 (c) with low gray-level and low contrast ridges and valleys has the lowest score of the wet fingerprints.
5 Conclusions
We have developed a fusion method combining three features for quality evaluation of fingerprint image, which gives better performance than linear methods. Our ex-perimental results demonstrate that the three features were sufficient for detecting poor quality fingerprint images. However, the proposed method relies on the correctly located core point and the foreground central 320× 320 region. Further researches will emphasize on a more accurate core point detection for fusion method to improve the performance of the fingerprint image quality evaluation.

Fusion Method of Fingerprint Quality Evaluation 785
Acknowledgement
We would like to acknowledge the supports of China NNSF of excellent Youth (60325310), NNSF (60472063)& GDNSF/GDCNLF (04020074/CN200402).
References
1. Lin Hong, Yifei Wan, and Anil Jain, “Fingerprint image enhancement: algorithm and per-formance evaluation,” IEEE Trans. Pattern Analysis Machine Intelligent, Vol.20, No. 8, pp. 777-789, August 1998
2. Nalini K. Ratha and R. Bolle, “Fingerprint image quality estimation,” ACCV, PP.819-823, 2000
3. L.L. Shen, A. Kot and W.M. Koo, “Quality measure of fingerprint images,” Third Interna-tional Conference, AVBPA 2001, Halmstad, Sweden, Proceedings, pp. 266-271, Jun, 2001
4. E. Lim, X. Jiang, W. Yau, “Fingerprint quality and validity analysis”, IEEE ICIP, 2002 5. Bongku Lee, Jihyun Moon, and Hakil Kim, “A novel measure of fingerprint image quality
using Fourier spectrum” Proc. SPIE Vol. 5779,105(2005) 6. Jin Qi, Zhongchao Shi, Xuying Zhao and Yangsheng Wang, “Measuring fingerprint image
quality using gradient” Proc. SPIE Vol. 5779,455(2005) 7. Qi, J., Abdurrachim, D., Li, D., Kunieda, H , “A hybrid method for fingerprint image qual-
ity calculation”, Automatic Identification Advanced Technologies, 2005. Fourth IEEE Workshop on 17-18 Oct. 2005 Page(s):124 – 129
8. A.K. Jain, S. Prabhakar and H. Lin, “A Multichannel Approach to Fingerprint Classifica-tion,” IEEE Trans. Pattern Analysis and Machine Intelligence, vol. 21, no. 4, pp. 348-359, 1999.