further insights into aspects of the eu illicit drugs market
TRANSCRIPT

Further insights into aspects of the EU illicit drugs market: summaries and key findings
Justice

1
This document has been prepared for the European Commission however it reflects the views only of the authors, and the
Commission cannot be held responsible for any use which may be made of the information contained therein.
European Commission- Directorate-General for Justice
More information on the European Union is available on the Internet (http://europa.eu).
Cataloguing data can be found at the end of this publication.
Luxembourg: Publications Office of the European Union, 2013
ISBN 978-92-79-28674-2
doi: 10.2838/4281
© European Union, 2013
Reproduction is authorised provided the source is acknowledged.
Europe Direct is a service to help you find answersto your questions about the European Union.
Freephone number (*):00 800 6 7 8 9 10 11
(*) Certain mobile telephone operators do not allow access to 00 800 numbers ot these calls may be billed.

2
Further insights into aspects of the EU illicit drugs market: summaries and key findings
Editors: Franz Trautmann (Trimbos Institute), Beau Kilmer (RAND) and Paul Turnbull (ICPR)
Consortium:
Trimbos Institute, the Netherlands: Franz Trautmann, Margriet van Laar, Tom Frijns;
Linda Lombi (University of Bologna, Italy)
RAND Europe, UK: Beau Kilmer, Jennifer Rubin, Peter Reuter, Jonathan Caulkins, Andres Villaveces, Mafalda Pardal,
Jirka Skoupy, Priscillia Hunt, Deirdre Culley, Peter McGee;
Melvin Soudijn (Research Unit of the Dutch National Police, KLPD, the Netherlands)
ICPR, UK: Paul Turnbull, Tiggey May, Tim McSweeney, Oonagh Skrine
Project partners:
National Centre of Addictions for Bulgaria, Bulgaria (Momtchil Vassilev)
Centre of Addictology, Czech Republic (Tomás Zabransky, Vendula Belackova)
University of Rome ‘Tor Vergata’, Centre for Biostatistics and Bioinformatics, Italy (Carla Rossi)
SICAD, Portugal (Fernanda Feijão)
Faculty of Health and Society of Malmö University, Sweden (Bengt Svensson)
www.trimbos.nl www.rand.org/randeurope www.icpr.org.uk
Developed by

Acknowledgements
3
Acknowledgements
The authors would like to thank all people who contributed to this study.
In particular we would like to thank our partners from the different EU Member States for their valuable input and commit-
ment: Vendula Belackova and Tomás Zabransky (Centre of Addictology, Charles University of Prague), Carla Rossi (University
of Rome ‘Tor Vergata’), Bengt Svensson (Faculty of Health and Society of Malmö University), Momtchil Vassilev (National
Centre of Addictions for Bulgaria) and Fernanda Feijão (SICAD - Service for Interventions on Addictive Behaviours and
Dependences, Lisbon).
We also would like to thank a number of experts who assisted with meaningful input, advice and comments. Joris Verster
(Utrecht University) made a major contribution to developing the web survey. Mario Lap (drugtext) provided help with
identifying relevant sources of information for our cannabis research and with reviewing the report on the changes of the
Netherlands coffee shop policies. Caitlin Hughes reviewed the report on decriminalization of drug possession in Portugal.
We are grateful to Brian Eastwood from the National Treatment Agency for Substance Misuse in England for providing us
with Treatment Outcomes Profile data to inform our estimates of the impact of opioid substitution treatment.
We would like to express our thanks to the European Monitoring Centre for Drugs and Drug Addiction (EMCDDA) in Lisbon
for the meaningful input we received on many issues. The EMCDDA proved to be a particularly valuable source of information
for our purposes. We want to express special thanks to Paul Griffiths, Frank Zobel and Maria Moreira who helped to sharpen
our minds in several discussions, as well as to their colleagues who contributed to specific sections in this study.
Special thanks to the experts who made themselves available to review the draft report for their valuable input. The following
experts gave input and precious suggestions for streamlining the final manuscript: Tom Decorte, Emma Disley, Tjalling Erke-
lens, Paul Gruter, Stijn Hoorens, Barrie Irving, Rosalie Pacula, and Jaap de Waard.
Finally, many thanks to the people who gave precious support to get all things done: Toine Ketelaars (Trimbos Institute) for
all the thorough literature searches, Yvonne Borghans and Danielle Branderhorst (Trimbos Institute) for their scrupulous text
editing and for care and logistic support during the project, and Andre Ladenius and his team for desk top publishing.
The authors are solely responsible for the views in their chapters.


5
Table of contents
Highlights 7
1. General Introduction 9
1.1 Approach 9
1.2 Structure of the study 11
2. Surveys on user types, availability and consumption estimates 15
2.1 Key findings 15
2.2 Summary 15
3. The impact of opioid substitution treatment (OST) on the European heroin market 23
3.1 Key findings 23
3.2 Summary 23
4. Estimating the size of the EU cannabis market 27
4.1 Key findings 27
4.2 Summary 27
5. Managing potential conflict in illegal markets 31
5.1 Key findings 31
5.2 Summary 31
6. Insights about cannabis production and distribution costs in the EU 33
6.1 Key findings 33
6.2 Summary 33
7. The impact of changes in the Netherlands coffee shop policies on local buyers and markets 37
7.1 Key findings 37
7.2 Summary 37
8. Key trends of the illicit drugs market and drug policy in the EU 41
8.1 Key findings 41
8.2 Summary 41


Highlights
7
Highlights
• Our estimates for the EU cannabis market suggest a range of approximately €7 billion to €10 billion for 2010. These
estimates are likely low as they do not account for the “consumption gap” (see below) that is created when data from
general population surveys are used to measure substance use. Prior estimates of the EU cannabis market ranged from
€15-35 billion.
• This difference arises from two key findings of this study:
o Cannabis users who use more frequently also smoke more each time they use. This is true across the seven countries studied.
o Occasional users are more likely to share than are frequent users; that still further reduces the amount they consume at
each session.
o This picture also seems to apply to amphetamine, ecstasy and cocaine use.
• Prior estimates multiplied the number of users by the average number of sessions per user and the average amount per
session; this will lead to overestimates of the quantity consumed because, for example infrequent users are the vast majority
of all users and they use much less per session as the result of sharing.
• Our study also shows that intensive users are a small to modest fraction of cannabis users (between 5% and 25%), but
are responsible for the bulk (between 55% and 77%) of the total amount of cannabis annually consumed in all countries.
Infrequent users of cannabis, using less than once per month, form the largest group of past year cannabis users but account
for 2 percent or less of the quantity consumed.
• Another important finding is that users stating that they used in the past month and specifying the quantity used in the
past month do not consume (the same amounts) each month. Multiplying their consumption by twelve to obtain an annual
estimate may result in an overestimation. There are also other factors which might have led to earlier overestimations of
cannabis consumption. One might be overstating the share of ‘high consumption users’ among past year. Finally, earlier
studies have used higher estimates of amounts of cannabis used per unit compared to those we found in our study.
• Substantial prior research finds that opioid substitution treatment (OST) such as methadone maintenance treatment (MMT)
contributes substantially to a reduction of drug use related harm and to better health. Research shows that OST reduces
the frequency and intensity of illicit heroin use among treatment clients. Drawing from a wider lower and upper bound
range, the study calculates that the amount of pure illicit heroin consumption averted per Problem Heroin User retained in
MMT each month ranges from a conservative estimate of 1.26 grams to a high estimate of 3.09 grams. This compares with
estimates for the amount of pure heroin consumed when not engaged in MMT, which ranged from 1.79 to 4.5 grams. At
an individual level, changes on this scale are equivalent to a 70 per cent reduction in the amount of pure heroin consumed
while retained in MMT.
• Extrapolating these estimates across the four case study Member States considered, we conclude that retention in MMT
may reduce total pure heroin consumption by around 30 per cent. Assuming 221,452 Problem Heroin Users from a wider
population of 505,173 were in receipt of MMT across these four Member States, total monthly consumption of pure heroin
is estimated to have reduced by between 0.28 and 0.69 metric tons, from an estimated total of between 0.9 and 2.3 metric
tons consumed.
• Enforcing laws against the production and distribution of cannabis dramatically inflate their costs. The increase is largely
driven by producers and traffickers requiring compensation for their risk of arrest, incarceration, seizure, and violent injury
as well as by the inefficiencies associated with having to operate covertly.
• Drug markets to some extent follow the same laws of economics of licit markets, as attested by our Delphi survey of European
drug experts about key trends of the illicit drugs market and policy responses in the EU. The majority of experts stress the
analogy of the illicit drugs market with other (licit) markets. For example, it is important to maintain working relations with
suppliers and employees. A study of 33 failed transactions in the Dutch cocaine smuggling trade found that the smuggler
mostly tried to understand what went wrong and work out a reasonable way of arranging compensation. However about
40% did involve either violence or its threat; how that affects behaviour within the market remains to be worked out.


General Introduction
9
1. General Introduction
Franz Trautmann
This publication presents key findings and summaries of selected reports from the study ‘Further insights into aspects of the
EU illicit drugs market’ (Trautmann, Kilmer and Turnbull, forthcoming 2013), which provides an analysis of characteristics
and operations of the EU’s illicit drugs market, as called for by the European Commission. This study is a follow-up of the
earlier European Commission study, which presented an analysis of the developments of the global illicit drug markets, the
drug problems and drug policy responses in the period 1998-2007 (Reuter and Trautmann 2009). The discussions of that
study resulted in a number of further research questions. Some of the questions considered most important by the European
Commission have been put together in a call for a further analysis of the EU illicit drugs market and responses to it, focusing
on a number of aspects in the following four areas:
A. An analysis of specific characteristics, mechanisms and factors that govern the EU illicit drugs market, including a concep-
tual framework for thinking about the structure of drug suppliers in the EU, an assessment whether there have been
significant shifts in how drugs are supplied in the EU and an assessment of the extent to which drug suppliers are involved
in different drugs and other criminal activities.
B. A detailed analysis of the size and share of the EU illicit drug market, providing an estimate of the volume of the ‘EU
market’ in illicit drugs (production and trafficking), providing an estimate of the profits generated by this market, analysing
whether the EU drugs market is more supply or demand driven and exploring various aspects of drug use: user types,
availability and consumption estimates.
C. A detailed analysis of a number of potential policy impacts on the EU drug market(s) in recent years, assessing the impact
of opioid substitution treatment (OST) on the European heroin market and the impact of policy changes on two EU drug
markets.
D. Scanning the future – trends in the market and policy responses, exploring expert views on future key trends of the illicit
drug markets and policy responses in the EU.
1.1 Approach
The European Commission’s call covers a gamut of research questions under these four areas, which resulted in a complex,
extensive research. It proved to be a challenging job to get all the work done within the timeframe and the available
budget. Some of these questions were addressed by new sophisticated analyses of existing data. For example to estimate the
revenues and composition of the EU market, we built on existing data sources (national prevalence surveys for prevalence
and frequency) combined with information from interviews with producers of medicinal cannabis and coffee shop owners.
The new data allowed us to improve upon the previous market estimates generated in the earlier global illicit drug markets
study (Kilmer and Pacula 2009).
Other questions required supplementary data collection. While our focus was on the EU, we did not have the resources to
conduct primary research in every Member State. So we focused our attention on seven Member States. In these sample
Member States we carried out surveys among drug users and conducted interviews with experts with respect to supply,
consumption and other drug related activities (see for further detail the next paragraph and the introduction of part I). The
surveys among drug users yielded data relevant for different research tasks. They formed the basis for our studies on user
types and availability and for producing consumption estimates (see part I). We also used them to collect information for
analysing policy impacts on the EU drug market(s) in recent years, assessing the impact of opioid substitution treatment (OST)
on the European heroin market and the impact of policy changes on two EU drug markets.
For exploring expert views on future key trends of the illicit drug markets and policy responses in the EU we relied on Delphi
methods for utilizing the only available data, namely the expertise of those engaged in drug problems and policy.

10
General Introduction
Member State sampleFor a more in-depth analysis we selected a sample of seven EU Member States that varied substantially with regards to drug
problems and drug policy. Diversity was the main criterion for selecting countries for our Member State sample. In selecting
our sample states we used the following criteria to assure diversity:
• Substantial differences in drugs problems (production, trafficking and use). For example, Bulgaria is of particular interest
because it is a major transhipment country for heroin, while the Netherlands is thought to be a principal producer of
cannabis. In Italy there is a strong connection between drug trafficking and established organised crime.
• Differences in socio-economic situation (level of economic development, stable/transitional). Bulgaria for instance is among
the poorest Member States, while Sweden is among the wealthiest, etc.
• Differences in drug policy. The United Kingdom has a harm reduction orientation, but also has heavy penalties for convicted
drug offenders; Portugal recently officially decriminalized possession for personal use of any psychoactive substance; In the
Czech Republic policy has been subject to rapid changes; Sweden is beginning to accept some types of harm reduction, etc.
• Geographical coverage.
• Pragmatic considerations (e.g. availability of data). These are all nations where either there is a relatively well developed
research community (e.g. the Netherlands and the United Kingdom) or at least one strong research group in the field of
drugs (e.g. the Czech Republic and Bulgaria).
The Table below provides the sample Member States and the criteria why they were selected.
List of countries for individual study
Member State Specific aspects of interest
Bulgaria Transhipment (heroin to the west, ecstasy to the east), drug policy changes
Czech Republic Production (Methamphetamine, Cannabis), substantial policy changes
Italy Link between trafficking and organised crime, substantial policy variations
The Netherlands Production (Cannabis, ecstasy), transhipment (cocaine), coffee shops for cannabis distribution, highly articulated harm reduction
Portugal Transhipment (cocaine), recent drug policy changes: decriminalisation of use
Sweden New policy development, relatively limited consumption
England and Wales Consumption, emerging cannabis production, tough sentencing, large cocaine market
We used the sample Member States for many of the research tasks in this project, as we expected this to contribute to a
consistent picture of all parts of the research, to deepen the understanding of factors shaping the policy and to facilitate the
work (and the project management), because we could work with one partner organisation in each sample Member State in
order to collect available data and – where appropriate – do some additional research.
Focus on four drugsThe research focussed on the following four drugs: cannabis, cocaine, heroin and Amphetamine Type Stimulants (ATS). In
some Member States other drugs might be important, but they either contribute little to the total EU market for illicit drugs
or they are not the subject of a lot of explicit policy making.
Combining research tasksThere are various links between the different research tasks in this study, highlighting a number of aspects of the drugs
market, showing interactions between the demand and supply side and interactions between drug policy and the market.
We looked for possibilities to combine the actual research work for these different tasks. Besides combining desk research it
was particularly important to find efficient ways of utilising our primary data collection because of the ambitious character of
this study. As already mentioned, we used the surveys among users not only as input for the research in part I on user types
and availability and consumption estimates but also for some other research tasks. To be able to assess the impact of OST on
the heroin market we added some additional questions to the questionnaires for heroin users. We also added some questions
to the Dutch and Portuguese version of our web-based survey to assess the respondents’ view on the impact of drug policy
developments on the drugs market in part III.

General Introduction
11
1.2 Structure of the study
Taking into account these links between the different research tasks we chose the structure of a ‘bottom-up’ order: starting
with analysing the market at the user level (part I of this study), followed by more general aspects of the drugs market (part
II) and ending with drug policy issues (part III).
Part IPoint of departure of the study is to assess the drugs market from the demand side. In part I we analyse different drugs market
features at the users’ end, analysing in more detail characteristics of the buying and using behaviour, distinguishing between
different user types based on the frequency of use and use the findings from this analysis for consumption estimates. For
this part of our study the available data were useful, but far too limited to allow for a thorough analysis. Therefore we did
some rather extensive primary data collection, using two types of surveys in the seven sample Member States. On the one
hand we made use of a web-based survey to reach all types of cannabis users (from infrequent to frequent) and infrequent
and occasional users of amphetamines, ecstasy and cocaine. On the other hand we used face-to-face interviews to reach
frequent users of cocaine, heroin and amphetamines. We present the analysis of this data collection in three reports. The first
report focuses on cannabis. Our web-based survey in all seven selected Member States yielded samples of respondents big
enough to present a rather detailed analysis of different types of users. Here we could distinguish between four types of users:
infrequent, occasional, regular and intensive users. The analysis in this first report provided us with rich information about the
differences between these user groups e.g. regarding the quantities used per use occasion. Some of these differences seem
to be more or less ‘universal’ for all the seven Member States we looked at. However, we also found sometimes notable
differences between these countries.
In the second report we focus on amphetamine, ecstasy and cocaine use, using beside information from other research sources
and data from our web-based survey also data from our face-to-face interviews. The data we collected here were less rich
than the data collected for cannabis, which allowed for a more limited analysis of user types. We limited ourselves to three
user types (infrequent, occasional and frequent users), but not all Member State samples consisted of sufficient respondents to
allow this differentiation for all three substances. This more limited detail of course also resulted in less detailed consumption
estimates. The key findings and summary from these two reports can be found in chapter 2 of this current publication.
In the third report on heroin we have decided to combine three research parts focussing on different issues around heroine
use. In part 1 of this combined report we explore some aspects of heroin consumption, using the data we collected through
the face-to-face interviews besides data from other research sources. These data were insufficient to say anything meaningful
about consumption estimates. In part 2 we therefore have included an analysis on the size of the heroin markets in two
EU Member States (Czech Republic and England), which was originally intended as a separate research. The calculations of
this report are based on data about problem heroin users and estimates of weekly heroin expenditures in the two countries.
Finally, we have also included the analysis of the impact of OST on the European heroin market. For this assessment we used
a combination of existing data sources and data from our face-to-face interviews. The analysis concentrates on methadone
maintenance treatment in four EU Member States (the Czech Republic, England, Italy and the Netherlands). This choice was
for an important part based on pragmatic considerations, i.e. the availability of data and methadone being the most widely
used substitution medication. We have included the key findings and summary of this study as chapter 3.
Finally, we have decided to include in part I also a study on estimating the size of the EU cannabis market, which builds on
the detailed analysis and calculations of the cannabis report. In particular the data on typical quantities consumed by the
different types of users enabled us to produce more sophisticated calculations, taking into account the differences between
consumption quantities on a ‘typical use day’ of the different user types. This has resulted in new, more solid estimates of the
size of the market. Chapter 4 contains the key findings and summary of this study.
Part IIPart II of the study should be taken as a bundle of selected issues of drugs market research. It consists of four reports focusing
on different research questions relevant for better understanding the organisation of the drugs market in the EU. Again, the
focus is on knowledge relevant for policy making.
The first one looks into the complex relationship between drug demand and supply factors by comparing the impact of
increased provision of OST on opioid use in two Nordic EU countries, Finland and Sweden. The report shows that due to
12
General Introduction
complex interfering factors choosing different options of OST programmes in similar countries can result in very different
outcomes. One interesting finding is that Finland seems to have reduced heroin use through increased availability of buprenor-
phine treatment, but is now facing a substantial buprenorphine abuse problem.
The second report focuses on one element of the rules of the game used in illicit drugs business, the way potential conflicts
are managed in illegal markets. It does so by a case study of cocaine smuggling in the Netherlands. An analysis of 33 incidents
involving failure of cocaine smuggling related transactions of smugglers residing in the Netherlands shows that the ways
potential conflicts are managed in an illegal market are not so different from the way disagreements are settled in the legal
market. In most of the analysed cases the disputes were settled through negotiations. Only when attempts to negotiate the
issue failed threats and violence were used. The key findings and summary can be found in chapter 5.
In the third report we investigate the relationships between different areas of illicit business and adaptations of criminal
networks to changes in the field in which they operate. From the available information we can take that criminal organisa-
tions operate as ‘polymorphous criminal networks’, responding to changes in their markets by looking for alternative – licit
and illicit – ways to secure their position and income. A review of existing literature sheds light on the combinations of licit
and illicit activities undertaken by criminal networks. The report also presents a proposal for a new framework for a better
understanding of the relationships between the diverse activities undertaken by internationally operating criminal networks
in particular those involved in illicit drug trafficking.
The last issue covered in part II is the price of cannabis production in the EU. The fourth report provides an analysis of the
impact of different legal regimes on the production costs. Based on interviews with producers of medicinal cannabis and
other data sources it documents the costs involved in producing cannabis in a legal environment for medical purposes. It
also shows how the price of cannabis increases across the supply chain in the EU. On the basis of this information the report
provides a discussion of the possible implications of alternative control regimes. In chapter 5 we present the key findings and
summary of this report.
Part IIIIn this last part of the study we focus on the policy level. We addressed two issues considered important for improving drug
policy making: the effects of policy measures on the market and an exploration of future developments of the drugs market
and drug policy. In the first two reports we analyse two examples of how policy changes impact the market, what effects they
have on the users. The first report looks into the impact of decriminalisation of possession of small quantities for personal use
in Portugal. The qualitative study is based on a literature review, data from our web-based survey and expert interviews. It
shows among others that what can be seen as a major change of the legal framework is not correctly understood by the users.
The second report focuses on the impact of recent changes in the Dutch cannabis coffee shop policy on cannabis users. Until
recently these changes involved a step by step tightening of the rules regulating coffee shops based on modifications of the
municipal regulations (reducing the number of coffee shops, limiting access to coffee shops, etc,). The latest changes seem to
go again in a less restrictive direction. We triangulate insights using a literature review, data from our web-based survey and
expert interviews. The findings underline that the mix of ongoing changes and unresolved issues result in confusion of the
users and in concerns about unintended negative consequences of the policy implemented. The key findings and summary
of this report are presented in chapter 6 of this publication.
Besides knowledge on effects and effectiveness of drug policy measures taken and understanding of relevant developments
of the drug problem drug policy making needs to anticipate what is coming, how the drug problem might develop in the
coming years. Drug policy has expected to be proactive. The third report is therefore an attempt to explore expert views
on how key trends of the illicit drugs market and policy responses in the EU will develop in the near future. Based on a four
stage expert consultation using an adapted version of the Delphi method, a mix of web-based and e-mail questionnaires, we
discuss a number of key trends and formulate some recommendations for a more pro-active policy response to these trends.
The findings are in line with the conclusions of chapter 5 that the development of the illicit drugs market follows the same
general ‘economic laws’ as the different licit markets. The key findings and summary from this Delphi study form the last
chapter of this publication.

General Introduction
13
References
Kilmer, B. and Pacula, R., (2009). Estimating the size of the global drug market: A demand-side approach. In: A report on
global illicit drug markets 1998-2007: full report, Reuter, P. and Trautmann, F. (eds), pp.101-156. European Commission,
Brussels.
Reuter, P. and Trautmann, F., editors (2009). A report on global illicit drug markets 1998-2007: full report. European Commis-
sion, Brussels.
Trautmann, F., Kilmer, B. and Turnbull, P., editors (forthcoming 2013). Further insights into aspects of the EU illicit drugs
market. European Union, Brussels.

Surveys on user types, availability and consumption estimates
15
2. Surveys on user types, availability and consumption estimates
Margriet van Laar, Tom Frijns, Franz Trautmann and Linda Lombi
With contributions of Beau Kilmer, Vendula Belackova, Carla Rossi, Bengt Svensson, Fernanda Feijão and Momtchil Vassilev
2.1 Key Findings
• This study clearly shows that the more frequently cannabis is used, the higher the number of units consumed per typical
use day and the bigger the amount of cannabis consumed per unit. This pattern was consistently found across all seven
EU Member States participating in the web survey. Similar patterns were found in the total samples and selected Member
State samples for amphetamine (Czech Republic, Netherlands and Sweden), ecstasy (Netherlands) and cocaine powder
(Netherlands).
• Infrequent users of cannabis (‘chippers’), who take cannabis less than once per month, form the largest group of past year
cannabis users. This is also true for users of amphetamine, ecstasy and cocaine. Also among past month cannabis users,
who are usually considered to be regular users, infrequent use is common.
• Last month users do not consume (the same amounts) each month. Multiplying their consumption by twelve to obtain an
annual estimate will result in an overestimation.
• The average amount of cannabis consumed annually by intensive users tends to be lowest in Portugal (184 gram) and
highest in Sweden and England and Wales (363 and 374 gram, respectively). However, confidence intervals are fairly wide.
• At country level, our estimates for the amounts of cannabis consumed range from about 4 tons in Bulgaria up to 384 tons
in Italy.
• In all countries (except for Portugal), intensive users form the smallest group of cannabis users (between 5% and 25%), but
they are responsible for the largest part (between 55% and 77%) of the total amount of cannabis annually consumed. The
same picture can be found for the total amounts of amphetamine, ecstasy and cocaine annually consumed in the selected
Member States.
• Some prior estimates on cannabis consumption tended to be too high, probably because the assumed share of ‘high
consumption users’ among past year users was too high, and the assumed amounts of cannabis used per unit were higher
compared to those assessed in our study.
• The proportion of users who indicate that other drugs are available at the location where they usually buy their cannabis
varies from 14% to 52%, suggesting that – in spite of differences between countries – the cannabis market at retail level
seems to be specialized to a great extent across EU Member States.
• Further research is needed to improve the data on the frequency of use of the less common drugs (amphetamine, ecstasy
and cocaine). Moreover, feasible self report methods for assessing amounts of cannabis consumed per unit should be
validated and improved, and the impact of sharing of cannabis on consumption estimates should be studied in more detail.
Finally, estimates of under coverage or underreporting of drug use should be better supported by empirical data.
2.2 Summary
The main aims of this study were three-fold: to describe characteristics of users and consumption patterns among different
types of users of cannabis, ecstasy, amphetamines and cocaine; secondly, to describe the availability of drugs to the different
types of users; and thirdly, to make estimates of the amount of drugs consumed - by user type and in total - in the seven

16
Surveys on user types, availability and consumption estimates
sample EU Member States: Bulgaria, Czech Republic, Italy, the Netherlands, Portugal, Sweden and England and Wales. In
spring 2012 a web survey was carried out in the seven countries to collect data on these topics for the four drugs under study.
For the Czech Republic, amphetamine in this report refers to methamphetamine.
The most detailed data we gathered from our survey are those on cannabis use. Our sample of cannabis users was big enough
to differentiate between four types of users. The final sample consisted of 4,126 persons who had consumed cannabis at
least once in the past year. They were classified on the basis of their number of use days in the past 12 months into four
groups: infrequent users or chippers (<11 days), occasional users (11-50 days), regular users (51-250 days) and intensive
users (>250 days). The numbers of users of amphetamine, ecstasy or cocaine use (especially the more regular users) were
too small to allow a detailed assessment of user types for these drugs in all countries. Analyses on consumption patterns and
estimates were therefore limited to three user types (infrequent, occasional and frequent users), with country-specific data
being available only for amphetamine in the Czech Republic, Sweden and the Netherlands, and for cocaine and ecstasy for
the Netherlands. Additional data on consumption patterns among problem users of amphetamine and (crack) cocaine were
used from the face-to-face interviews.
Characteristics of cannabis users and consumption patternsThe results reveal many differences between user groups, which seem to be more or less ‘universal’, but there are sometimes
also notable differences between countries. Overall, intensive users differ most strongly from other user groups – in particular
from the chippers and occasional users in that they have a relatively early onset of first cannabis use, were more often male
and were older (except for Bulgaria and the Czech Republic), compared to the less frequent user groups.
Moreover, the more frequently cannabis was used in the past year, the higher the number of units (mainly joints) is used on
a typical use day and the more cannabis is put in a unit. For the total sample the average number of units per typical use day
varies from 1.4 among chippers to 4.1 among intensive users (excluding possible sharing). The average amount of cannabis
per unit varies from 0.15 gram to 0.25 gram. The total amount (gram) of cannabis per typical use day for the total sample
increases from 0.2 gram for chippers to 1.1 gram for intensive users.
Amount (gram) of cannabis consumed on a typical use day by user group
Chipper Occasional Regular Intensive
0.80
0.60
0.40
0.20
0.00
1.00
1.20
0.22
0.35
0.60
1.10
Despite these overall main differences between user groups, there are quite a number of specific differences between countries:
Age of first useThe average age of first cannabis use is overall higher in Sweden compared to all other countries. This difference is difficult to
explain on the basis of these data. This finding may be associated with the long-standing relatively restrictive Swedish drug
policy aimed at a drug-free society. Nonetheless, once cannabis is used, the annual amounts consumed by Swedish cannabis
users are similar or sometimes higher compared to those in other countries.

Surveys on user types, availability and consumption estimates
17
Type of unitWhile the majority of the cannabis users consume their cannabis by smoking a joint, up to 45% of the intensive users in
the Czech Republic prefer smoking cannabis by dry pipes/chillums. Health concerns related to tobacco smoking, and better
options to titrate the cannabis dose, smoking efficiency and cultural factors, have been put forward as possible explanations
for the popularity of this consumption method in the Czech Republic.
Mixing cannabisAlthough the majority of cannabis users mix their cannabis with tobacco, there are clear differences between countries.
Proportions of users who consume cannabis ‘pure’ varied from 9% or less in Italy, the Netherlands and Portugal up to 28%
in the Czech Republic and 33% in Bulgaria. As mentioned before, in the Czech Republic, this relatively high proportion may
be associated with the popularity of smoking cannabis by dry pipes/chillums.
Preference for hash or marihuanaThe proportion of users with a preference for marihuana is highest in Bulgaria and the Czech Republic (96%), followed by
England and Wales (83%). Preference for marihuana is lowest in Portugal (38%), where hash tends to be more popular
(overall 43%), especially among intensive users (69%). This is preference for hash is associated with its proximity to Morocco,
which is the world’s largest producer and supplier of hash.
Amount of cannabis consumedThe average amount of cannabis consumed annually by intensive users tends to be lowest in Portugal (184 gram) and highest
in Sweden and England and Wales (363 and 374 gram, respectively). However, confidence intervals are fairly wide.
Sharing on the last occasionAlthough sharing is common among all types of users, especially among the less frequent users, there are notable differences
between countries. The proportions of intensive users reporting sharing their cannabis on the last occasion, varies from 50%
in England and Wales to 91% in Bulgaria.
Availability of cannabisDifferences between user groups are also found with regard to availability indicators, although differences between countries
featured here more prominently. The proportion of users who usually buy their cannabis, instead of employing other modes
to acquire the drug, is highest among regular and intensive users and was lowest among chippers, who most often get
cannabis from others (including sharing). Growing cannabis is mentioned between 15% to over 21% of the intensive users
in five countries, but hardly plays a role as primary way to obtain cannabis among less frequent users. Of those users who
usually buy their cannabis, the amount of cannabis bought per purchase increases from chippers to intensive users, as does
the frequency of buying and amount of money spent on cannabis purchases in the past month. Intensive users also more
commonly buy cannabis for others, and more often indicate that it is very easy to obtain the drug, compared to less frequent
users. In addition to these common trends across user groups, there are many more remarkable differences between countries
on availability indicators.
Growing cannabisThe proportion of intensive users reporting growing their own cannabis as dominant way of obtaining cannabis is lowest
in the Netherlands (5%) and England and Wales (9%) and highest in the Czech Republic (21%), Italy (19%) and Sweden
(18%). Yet, only in the Czech Republic growing seems to play a role in all user groups (10%), suggesting that it is more
widespread than elsewhere.
Locations of purchaseCoffee shops are mentioned as the main location of buying cannabis for the vast majority of users in the Netherlands (87%),
while buying on the street or in a park is mentioned by more than 50% of the users in Bulgaria (58%), and by between 20%
to 34% in Italy, Sweden, Portugal and England and Wales. Buying at a seller’s home is a relevant source especially in the Czech
Republic (45%) and between 21% and 36% in the other countries, except for Bulgaria (10%) and the Netherlands (3%).

18
Surveys on user types, availability and consumption estimates
Availability of other drugsExcluding the Netherlands, between 26% (Czech Republic) and 52% (Sweden) of the cannabis users indicate that other
drugs are available at the location where they usually buy cannabis. The relatively low proportion in the Netherlands (14%
overall, 9% for those who buy in coffee shops), is likely to reflect the policy of separation of the cannabis and hard drugs
markets, but the data also suggest that cannabis markets at retail level seem to be specialized in other countries as well, albeit
to different degrees.
Amount of cannabis bought and pricesAmong intensive users, the amounts of cannabis bought per purchase is lowest in Bulgaria and highest in Italy, Portugal,
Sweden and England and Wales, and prices paid are lowest in Bulgaria and highest in Sweden.
Time and ease to obtain cannabis The proportion of cannabis users estimating that they would be able to buy their usual amount of cannabis within half an hour
is highest in the Netherlands (71%) and varies between 22% (Sweden) and 44% (Czech Republic) in the other countries.
In all countries, the majority of the users indicate that it is easy or very easy to obtain cannabis, but in the Netherlands the
qualification ‘‘very easy’ is the highest (82%), against about 32% (Italy and Portugal) up to 57% (Czech Republic) in other
countries.
Unable to buyThe proportion of users who are sometimes unable to buy cannabis in the past 12 months varies from 18% in the Netherlands
up to 78% in Italy. The lack of available sellers or sellers who did not have cannabis for sale is the most frequently cited
explanation.
Most of the findings on availability indicators with regard to the Netherlands are consistent with the Dutch policy pursuing a
separation of the cannabis and hard drug markets, and allowing the small sale scale of cannabis for personal use under strict
conditions in the so-called coffee shops.
Characteristics of users, consumption patterns and availability of amphetamine, ecstasy and cocaineAs mentioned in the introduction of this summary the data concerning amphetamine, ecstasy and cocaine use allowed for
less detailed analyses than those for cannabis because of smaller (sub)sample sizes. For most Member States and indicators,
data are reported for the total Member State sample. Differences between user types could only be analyzed for a selection
of sample Member States (Czech Republic, Netherlands and Sweden for amphetamine; Netherlands for ecstasy and cocaine).
Similar to findings for cannabis, the more frequently amphetamine, ecstasy and cocaine were used in the past year, the higher
the daily dose (in grams or pills) that was consumed on a typical use day.
The total amount of amphetamine per typical use day in the Czech Republic increases from 0.31 gram for infrequent users
to 0.66 gram for frequent users. Daily doses in the Czech Republic are about half of those in the Netherlands and Sweden in
all user groups, with amount increasing from 0.50 to 1.49 gram in the Netherlands and 0.59 to 1.24 gram in Sweden. This
difference can probably be explained by the consumption of high potency methamphetamine in the Czech Republic, against
‘normal’ amphetamine in the other countries.
The total amount of ecstasy per typical use day for the Netherlands increases from 1.95 pills for infrequent users to 2.43 pills
for occasional users and to 3.56 pills for frequent users. These numbers are lower in the combined other sample Member
States, where consumption on a typical use day increases from 1.51 pills to 1.93 pills to 2.93 pills.
The total amount (gram) of cocaine per typical use day for the Netherlands increases from 0.52 gram for infrequent users to
0.80 for occasional users to 1.28 gram for frequent users. These numbers are somewhat lower in the combined other sample
Member States, where consumption on a typical use day increases from 0.43 gram to 0.88 gram to 0.94 gram.
The proportion of users who usually buy their amphetamine, ecstasy or cocaine, instead of employing other modes to acquire
the drug, tends to be highest among frequent users and lowest among infrequent users, with occasional users in between.

Surveys on user types, availability and consumption estimates
19
Of those users who usually buy their drugs, the amount bought per purchase increases from infrequent to frequent users, as
does the frequency of buying and the amount of money spent on drug purchases in the past month, although these patterns
are less consistent than those for cannabis.
In addition to these trends across user groups, there are also differences between Member States on availability indicators.
Locations of purchase
The seller’s home is the most frequently mentioned location of buying amphetamine in the Czech Republic, the Netherlands
and Sweden, while their own or someone else’s home are most frequently mentioned in England and Wales. On the street or
in a park is most frequently mentioned in Bulgaria, and Italian respondents mention a place of entertainment most often. For
ecstasy, the seller’s home is mentioned most frequently in all Member States except for Bulgaria, where places of entertain-
ment and private parties are most popular. For cocaine, similar to the findings for ecstasy and to a lesser extent those for
amphetamine, the seller’s home is mentioned most frequently in all Member States except for the Netherlands, where the
street or a park are mentioned slightly more often. Interestingly, for all three drugs between 13% and 20% of Italian and
Swedish users report to buy their drugs at school, college or university, while these locations are virtually not mentioned in
the other sample Member States.
Time to obtain drug
Across Member States, the majority of users estimate that they would be able to buy their usual amount of amphetamine
within either ‘less than half an hour’ or ‘half an hour to an hour’. Nevertheless, user estimates vary across member States. Most
notably, Swedish amphetamine users report longer times than users from the other sample Member States. Across Member
States, obtaining ecstasy tends to take more time than obtaining amphetamine, but again estimates vary across Member
States, with the biggest part (37%) of Swedish ecstasy users reporting more than 24 hours. Amphetamine and ecstasy thus
seem to take longer to obtain in Sweden. For cocaine, a large part (26%) of Czech users indicate that it would take them
more than 24 hours to obtain, while 40% of users from England and Wales indicate needing 1-2 hours.
Unable to buy
The proportion of users who were now and then unable to buy amphetamine in the past 12 months varies from 21% in the
Netherlands up to 43% in the Czech Republic. For ecstasy, this proportion varies from 13% in the Netherlands up to 49% in
Bulgaria, and for cocaine it varies from 20% in the Netherlands up to 52% for England and Wales. The proportion of users
who were unable to buy is thus lowest in the Netherlands for all three drugs. The lack of available sellers or sellers who did
not have availability of the drug of choice are the most frequently cited explanations for being unable to buy amphetamine,
ecstasy and cocaine.
Estimates of cannabis consumption We estimated the amount of cannabis consumed by multiplying the number of users per user group by the annual amount
consumed per year by user group in each of the seven sample countries. It should be noted, that although a detailed account
was made of differences between user types and associated consumption patterns, there are still many sources of uncertainty
and methodological differences between countries which affect the precision of the estimates.
In all countries the group of chippers forms the biggest group of the last year cannabis users with proportions ranging from
37% in Portugal up to 66% in Sweden. Intensive users form the smallest group in all countries, except for Portugal, with
proportions ranging from 5% in Sweden up to 25% in Portugal. In Portugal the group of regular users and intensive users
makes up half of all last year cannabis users. There is no explanation so far for these differences between countries.

20
Surveys on user types, availability and consumption estimates
Number of last year cannabis users by country and distribution over user groups*
BG CZ IT NL PT SE E&W
Number of users 138,809 1,128,957 8,105,720 781,233 255,520 171,174 2,800,073
% Chippers 64% 52% 41% 44% 37% 66% 54%
% Occasional 17% 20% 37% 15% 13% 15% 17%
% Regular 12% 22% 12% 25% 25% 14% 19%
% Intensive 7% 6% 10% 17% 25% 5% 9%
* Based on general population surveys. For Italy, and adapted estimate of the number of users has been used, which is based on population
surveys and indirect estimates (see § 1.5.2.3). Numbers are based on prevalence data from population surveys conducted between 2007
(Portugal) up to 2010/2011 (England and Wales), and data on the size of the population in 2011 from Eurostat.
The total amount of cannabis consumed per country varied widely, but in all countries, intensive users account for the
biggest share of cannabis consumed, with proportions varying from 55% in the Czech Republic up to 77% in Bulgaria,
the Netherlands and England and Wales. Chippers and occasional users account for less than 9% of the total amount of
cannabis consumed. As far as data were available in other countries, the addition of (rough) estimates of cannabis consumed
by (marginalised) populations of problem drug users increased the estimates from a low 3% in the Netherlands, up to 25%
in England and Wales, and 35% in Sweden, which is a huge variation.
Amount of cannabis (tons) consumed annually per country and user group (%)*
BG CZ IT NL PT SE E&W
Amount (tons) - lower 2.6 27.2 383.2 44.1 12.7 5.5 96.1
Amount (tons) - upper 5.2 51.3 480.1 69.4 26.3 8.2 221.0
Amount (tons) – average*
3.8 33.4384.3 48.5 17.4 5.8 133.8
% Chippers 2% 2% 1% <1% 1% 2% 1%
% Occasional 3% 6% 5% 1% 2% 4% 2%
% Regular 18% 37% 23% 21% 30% 37% 20%
% Intensive 77% 55% 71% 77% 68% 57% 77%
Additional amount (tons) used by problem drug users***
0.2-0.4 1.4 n.a.** 1.4 ? 2.0 18-34
Upper and lower values are based on the upper and lower values of the 95% confidence interval for the annual cannabis consumption on
the basis of the web survey, multiplied by the number of users according to population surveys (except for Italy, see paragraph 1.5.2.3).
*The average is based on the 5% trimmed mean of the 12 months cannabis consumption. ** For Italy, the adapted method to estimate
the number of cannabis users is likely to take underreporting and undercoverage, including use among problem drug users, into account.
*** Rough estimates of cannabis consumption by problem users of heroin, amphetamine, cocaine, based on indirect estimates of the number
of problem users (Statistical Bulletin EMCDDA) and data on consumption patterns from the face-to-face interviews and other sources.
Estimates of consumption for amphetamine, ecstasy and cocaineWe estimated the annually consumed amounts of amphetamine, ecstasy and cocaine by multiplying the number of users per
user group (estimated from external research combined with Eurostat data on population size) by the average annual amount
consumed per user type (estimated from our data). As mentioned above, limitations in sample sizes made us restrict the
consumption estimates for amphetamine to the Czech Republic, Sweden and the Netherlands, and for cocaine and ecstasy
to only the Netherlands.
In all selected Member States for amphetamine and in the Netherlands for ecstasy and cocaine, infrequent users constitute
the largest part of the last year users, while frequent users form the smallest group. However, because of their much higher
annual consumption rates, frequent users contribute most to the total annual consumption, while occasional and infrequent
users account for relatively small portions of total annual consumption.

Surveys on user types, availability and consumption estimates
21
Amphetamine
Total annual consumption of amphetamine in the Czech Republic is estimated at 4.55 metric tons with a range between 2.73
and 6.01 metric tons. Frequent users account for 96% of this amount while occasional and infrequent users accounted for
respectively only 3% and 1%.
Estimates of the total annual consumption of amphetamine in the Netherlands ranges between 1.51 and 2.79 metric tons,
with point estimates at 2.41 (user type numbers generated from general population survey) and 1.80 (user type numbers
generated from targeted survey among visitors of clubs and parties) metric tons. Frequent users account for 89-93% of these
amounts while occasional and infrequent users account for respectively 5-8% and 2%.
Because no Swedish studies were available from which to derive user type numbers, the figures from the Czech Republic and
the Netherlands were used as a proxy. This resulted in estimates of the total annual consumption of amphetamine in Sweden
that ranges between 1.24 and 4.59 metric tons, with point estimates at 3.40 (based on Czech user type figures), 2.53 and
1.91 metric tons (based on Dutch user type figures from a general population survey and targeted survey, respectively).
Frequent users account for 87-94% of these amounts while occasional and infrequent users account for respectively only
4-9% and 2-4%.
Ecstasy
Estimates of the total annual consumption of ecstasy in the Netherlands range between 4.08 and 5.72 million pills, with point
estimates at 5.22 (user type numbers generated from general population survey) and 4.48 (user type numbers generated
from targeted survey among visitors of clubs and parties) million pills. Frequent users account for 39-49% of these amounts
while occasional and infrequent users account for respectively 31-37% and 20-24%.
Cocaine
Estimates of the total annual consumption of cocaine in the Netherlands ranged between 2.08 and 3.22 metric tons, with
point estimates at 2.74 (user type numbers generated from general population survey) and 2.57 (user type numbers gener-
ated from targeted survey among visitors of clubs and parties) metric tons. Frequent users account for 73-75% of these
amounts while occasional and infrequent users account for respectively only 18-20 and 7%.
Final comments and recommendationsAlthough this study is a further step forward in improving estimates on drug consumption by differentiating different user
types, in terms of frequency of use, it also has limitations. These include, among others, the non-standardised way of recruiting
respondents through various channels (but mainly through the web advertisements) and lack of a sampling frame. This may
have resulted in a relatively high proportion of young (fairly highly educated) users, and, in the Netherlands, respondents who
are associated with recreational (dance) settings (thus possibly inflating consumption estimates). Nonetheless, the reported
‘universal’ (consumption) patterns for cannabis, across countries with varied economic, social, and cultural norms, suggest
that the findings for this drug may have a high degree of validity.
As estimates on the amounts of cannabis consumed per unit relied heavily on subjective reports of amounts based on (digital)
photo cards, it will be important to build on research to further validate and improve methods to estimate amounts of cannabis
consumed. Ideally, this should result in a feasible method to be implemented in (large scale) surveys in different countries.
Moreover, as this study shows that sharing cannabis among users is much more common than previously assumed, a more
detailed analysis of the impact of sharing on the consumption estimated would be recommended.
For the less commonly used drugs (amphetamine, ecstasy, cocaine), numbers of past month users in general population
surveys are often too low to provide reliable information on the frequency of use, which is necessary to allow consumption
estimates at population level. This limitation is hard to solve, information might be obtained by aggregating samples from
successive population surveys to yield a higher number of past year or past month users or by increasing sample sizes, which
is not likely to occur. Studies among targeted samples of users could be useful, but at the expense of representativeness.
For all drugs, it is recommended that (population) surveys also collect data on frequency of use among past year users
instead of last month users only, and, for cannabis specifically, it is recommended to add a few questions on numbers of units
consumed per typical use day.
22
Surveys on user types, availability and consumption estimates
As this web survey was likely to capture mainly integrated drug users, it missed data on more marginalised populations of
problem drug users. To some extent this bias could be reduced by adding data on the number of problem users and their
consumption pattern, but not all groups will have been covered in this way (e.g. homeless in general, institutionalised people).
Moreover, it can be assumed that not all drug users will have ‘admitted’ (or remembered correctly) the frequency or amounts
of drugs consumed. While previous studies have assumed levels of underreporting ranging from for example 20% to 50%,
the empirical support for these values and information on possible differences between countries is limited. It is recommended
to improve insight on these issues, as they may be a main determinant of the final estimates of consumption.

The impact of opioid substitution treatment (OST) on the European heroin market
23
3. The impact of opioid substitution treatment (OST) on the European heroin market
Tim McSweeney and Oonagh Skrine
3.1 Key findings
• The evidence in support of opioid substitution treatment (OST) and methadone maintenance treatment (MMT) in particular,
in contributing towards reducing the frequency and intensity of illicit heroin use among those retained in such treatment
is both considerable and persuasive. Some controversy persists however about the extent to which forms of OST may
contribute towards facilitating the attainment of ‘recovery’ orientated goals and extend opioid using ‘careers’.
• Triangulating data from various sources we conservatively estimate the amount of pure illicit heroin consumed per year,
per problem heroin user not engaged in MMT as 21.5 grams. Our high estimate is 54.0 grams per year. These are
broadly consistent with previous published estimates for annual consumption rates among European Problem Heroin Users
(30.0 - 58.0 pure grams).
• Drawing from a wider lower and upper bound range, we have calculated that the amount of pure illicit heroin consumption
averted per Problem Heroin User retained in MMT each month ranges from a conservative estimate of 1.26 grams to a
high estimate of 3.09 grams. This compares with estimates for the amount of pure heroin consumed when not engaged
in MMT, which ranged from 1.79 to 4.5 grams per month. At an individual level, changes on this scale are equivalent to
a 70 per cent reduction in the amount of pure heroin consumed while retained in MMT.
• Avoided illicit heroin consumption on this scale across a population of 221,452 Problem Heroin Users assumed to be
accessing MMT throughout four case study Member States is equivalent to between 0.3 metric tons (conservative estimate)
and 0.7 metric tons (high estimate) of pure heroin consumption avoided for each month retained in MMT, again drawing
these estimates from a wider lower and upper bound range. Extrapolating these estimates across the four case study Member
States considered, we conclude that retention in MMT may reduce pure heroin consumption by around 30 per cent.
• Problem Heroin Users not engaged in MMT and other forms of OST will account for a disproportionate amount of the
illicit heroin being consumed in a given market. Significantly curtailing their involvement in it, via engagement with MMT
and other evidence-based forms of OST, is likely to considerably undermine the market’s viability and disrupt functionality
by removing or displacing key participants from it.
3.2 Summary
Evidence for the effectiveness of OST The evidence in support of opioid substitution treatment (OST), and in particular the maintenance prescribing of methadone
or buprenorphine (and to a lesser extent heroin, subutex, and suboxone), is considerable and persuasive. This body of
knowledge has accumulated using data and experience over a 40-year period, and from regions as geographically and
culturally diverse as North America, Europe, Australia, Asia and the Middle East.
In aggregate, these findings point to the benefits of retention within OST, and in particular methadone maintenance treatment
(MMT), in contributing towards reducing the frequency and intensity of illicit heroin use. Yet despite this body of evidence,
controversy still persists about the extent to which forms of OST contribute towards facilitating the attainment of ‘recovery’
orientated goals, extend opioid using careers and impact upon drug-related mortality.
Using a combination of existing and primary data sources, we sought to estimate the impact of OST, in the form of MMT, in
contributing towards avoided illicit heroin consumption across four European Union (EU) Member States - the Czech Republic,
England, Italy and the Netherlands.

24
The impact of opioid substitution treatment (OST) on the European heroin market
MethodsThe information used to inform this work was derived from the following sources:
• existing peer reviewed research;
• published and unpublished statistics; and
• supplemented with primary data gathered through interviews with heroin users in the relevant Member States.
AssumptionsIn order to estimate the avoided heroin consumption attributable to MMT it was necessary to make a number of informed
assumptions relating to the:
• number of problem opioid users (POUs) within the four Member States being considered (N=505,153) and the proportion
of this group thought to be accessing OST (52.6%, n=265,721) and MMT (43.8%, n=221,452);
• nature and extent of their heroin consumption (frequency, amount and purity) when not accessing MMT; and
• nature and extent of any changes in this heroin consumption (frequency amount, purity) while exposed to and retained
within MMT.
Nature and extent of heroin consumption when not accessing MMTTriangulating data from various sources we conservatively estimate the amount of pure heroin consumed per year per Problem
Heroin User not engaged in MMT is 21.5 grams. Our high estimate is 54.0 grams per year.
Conservative and high estimates of heroin consumption among Problem Heroin Users not accessing MMT
Assumption Conservative estimate High estimate
Frequency (days) of use last month 21 24
Amount (grams) used per day 0.5 0.75
Purity 17% 25%
Pure grams of heroin consumed per month per Problem Heroin User 1.79 4.5
Pure grams of heroin consumed per year per Problem Heroin User 21.5 54.0
Estimated impact of MMT on avoided illicit heroin consumptionOn the basis of a range of empirically informed assumptions we estimate that the amount of pure heroin consumption averted
per Problem Heroin User retained in MMT each month ranges from 0.45 grams to 4.21 grams, with a conservative estimate
of 1.26 grams and a high estimate of 3.09 grams. Using these estimate ranges, a 95 per cent confidence interval for the
amount of pure heroin consumption averted per Problem Heroin User retained in MMT each month ranged from 0.75 to
2.63 grams, based on 400 random draws using a Monte Carlo simulation.
This compares with estimates for the amount of pure heroin consumed when not engaged in MMT, which ranged from 1.79
to 4.5 grams per month. At an individual level, changes on this scale are equivalent to a 70 per cent reduction in the amount
of pure heroin consumed while retained in MMT.
Avoided illicit heroin consumption on this scale across the 221,452 Problem Heroin Users assumed to be accessing MMT
throughout the four case study Member States is equivalent to between 0.1 and 0.9 metric tons of pure heroin consumption
avoided for each month retained in OST, with a conservative estimate of 0.3 metric tons and a high estimate of 0.7 metric
tons per month. Extrapolating our estimates across the four case study Member States considered, we conclude that retention
in MMT may reduce pure heroin consumption by around 30 per cent.
The impact of opioid substitution treatment (OST) on the European heroin market
25
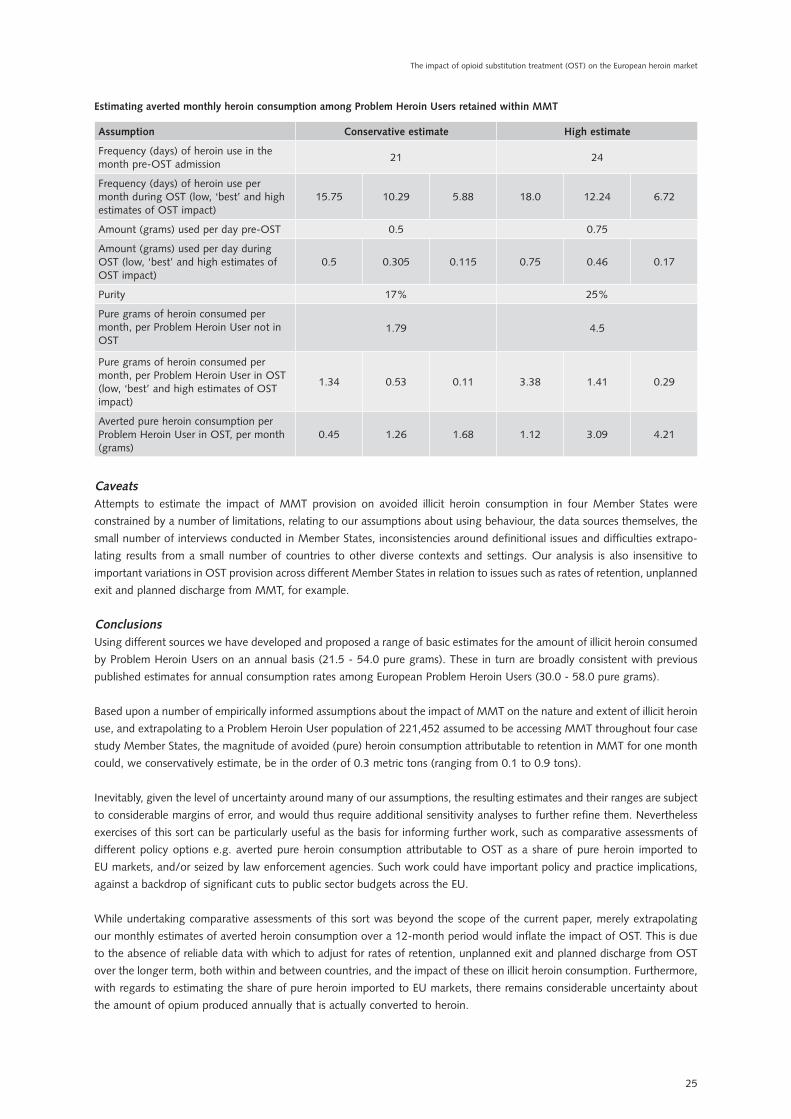
Estimating averted monthly heroin consumption among Problem Heroin Users retained within MMT
Assumption Conservative estimate High estimate
Frequency (days) of heroin use in the month pre-OST admission
21 24
Frequency (days) of heroin use per month during OST (low, ‘best’ and high estimates of OST impact)
15.75 10.29 5.88 18.0 12.24 6.72
Amount (grams) used per day pre-OST 0.5 0.75
Amount (grams) used per day during OST (low, ‘best’ and high estimates of OST impact)
0.5 0.305 0.115 0.75 0.46 0.17
Purity 17% 25%
Pure grams of heroin consumed per month, per Problem Heroin User not in OST
1.79 4.5
Pure grams of heroin consumed per month, per Problem Heroin User in OST (low, ‘best’ and high estimates of OST impact)
1.34 0.53 0.11 3.38 1.41 0.29
Averted pure heroin consumption per Problem Heroin User in OST, per month (grams)
0.45 1.26 1.68 1.12 3.09 4.21
CaveatsAttempts to estimate the impact of MMT provision on avoided illicit heroin consumption in four Member States were
constrained by a number of limitations, relating to our assumptions about using behaviour, the data sources themselves, the
small number of interviews conducted in Member States, inconsistencies around definitional issues and difficulties extrapo-
lating results from a small number of countries to other diverse contexts and settings. Our analysis is also insensitive to
important variations in OST provision across different Member States in relation to issues such as rates of retention, unplanned
exit and planned discharge from MMT, for example.
ConclusionsUsing different sources we have developed and proposed a range of basic estimates for the amount of illicit heroin consumed
by Problem Heroin Users on an annual basis (21.5 - 54.0 pure grams). These in turn are broadly consistent with previous
published estimates for annual consumption rates among European Problem Heroin Users (30.0 - 58.0 pure grams).
Based upon a number of empirically informed assumptions about the impact of MMT on the nature and extent of illicit heroin
use, and extrapolating to a Problem Heroin User population of 221,452 assumed to be accessing MMT throughout four case
study Member States, the magnitude of avoided (pure) heroin consumption attributable to retention in MMT for one month
could, we conservatively estimate, be in the order of 0.3 metric tons (ranging from 0.1 to 0.9 tons).
Inevitably, given the level of uncertainty around many of our assumptions, the resulting estimates and their ranges are subject
to considerable margins of error, and would thus require additional sensitivity analyses to further refine them. Nevertheless
exercises of this sort can be particularly useful as the basis for informing further work, such as comparative assessments of
different policy options e.g. averted pure heroin consumption attributable to OST as a share of pure heroin imported to
EU markets, and/or seized by law enforcement agencies. Such work could have important policy and practice implications,
against a backdrop of significant cuts to public sector budgets across the EU.
While undertaking comparative assessments of this sort was beyond the scope of the current paper, merely extrapolating
our monthly estimates of averted heroin consumption over a 12-month period would inflate the impact of OST. This is due
to the absence of reliable data with which to adjust for rates of retention, unplanned exit and planned discharge from OST
over the longer term, both within and between countries, and the impact of these on illicit heroin consumption. Furthermore,
with regards to estimating the share of pure heroin imported to EU markets, there remains considerable uncertainty about
the amount of opium produced annually that is actually converted to heroin.

26
The impact of opioid substitution treatment (OST) on the European heroin market
As noted in previous research, Problem Heroin Users not engaged in MMT and other forms of OST will account for a
disproportionate amount of the illicit heroin being consumed in a given market. Removing them, or significantly curtailing
their involvement in it via engagement with MMT and other evidence-based forms of OST, is likely to considerably undermine
the market’s viability and disrupt functionality by removing or displacing key participants from it.
Traditionally, demand and supply reduction activities have tended to operate in isolation in this regard, but there is a growing
recognition that complimentary demand and supply reduction efforts could disrupt functionality to a greater extent (but care
also needs to be taken to avoid unintended negative consequences and harms).
Reductions in heroin consumption while exposed to OST will undoubtedly deliver benefits for the individual user. What is less
clear is the wider impact, adverse or otherwise, this avoided heroin consumption will have on broader market dynamics (e.g.
the price, purity and availability of heroin), and the implications of this for those still active as consumers within it.
Estimating the size of the EU cannabis market
27
4. Estimating the size of the EU cannabis market
Jonathan P. Caulkins and Beau Kilmer
With contributions of Marlon Graf
4.1 Key findings
• Previous estimates of the size of the EU cannabis market vary widely, with figures ranging from €15 billion to €35 billion per
year. An important source of uncertainty is the limited information available about typical quantities consumed by different
types of users.
• Our estimates of the EU cannabis market suggest a range of approximately €7 billion to €10 billion annually circa 2010; however,
these figures do not account for the “consumption gap” (see below) that is created when data from general population surveys
are used to measure substance use. Thus, these estimates are likely low perhaps by as much as a factor of 2.
• Information about the type of cannabis consumed (herbal versus resin) across countries is scant. If the new estimates
published by the EMDCCA (2012) are correct, then combining them with our figures suggests that roughly 50-65% of all
cannabis consumed in the EU is resin.
• The analyses presented in this chapter make methodological contributions. Most importantly, we demonstrate that since
consumption intensity (grams per day of use) is positively correlated with consumption frequency (days used per month),
multiplying the average number of use days by the average number of grams consumed per use day generates consumption
figures that are lower than what they should be. The better approach is to multiply each individual’s days consumed and
daily consumption figures and then average across individuals only after that multiplication. We hope this gets incorporated
into future sizing exercises and motivates the collection of additional data about quantities consumed and expenditures.
4.2 Summary
There are several reasons why decision makers want to know how much cannabis is used in the EU and how much users
spend on it. First, information about expenditures helps put the trade in context compared to legal (e.g. alcohol, tobacco)
and other illegal industries. Second, it provides insight about the revenues being generated by criminal traffickers. This is not
only of interest to law enforcement agencies, but also to those who seek to implement drug policy reforms that could reduce
criminal proceeds. Third, knowing cannabis expenditures and amounts consumed is necessary, but not sufficient, information
for projecting the consequences of alternative regulatory regimes (e.g. tax revenues that might be collected if cannabis were
legalised and regulated).
Estimating the size of an illegal market is challenging. Since it is impossible to pull figures from official financial statements,
one should be sceptical of those who claim they have precise estimates. However, understanding of the EU cannabis market
has improved greatly in the past decade as we have learned more about who uses cannabis and how much they use
(Leggett 2006; EMCDDA 2008; EMCDDA 2012). Indeed, we draw upon a web survey conducted in seven Member States
and introduced elsewhere in this volume (Van Laar et al. 2013) that pushes the frontier of our knowledge about cannabis
consumption in the EU, and arguably elsewhere.
Previous estimates of the size of the EU cannabis market vary widely, with figures ranging from approximately €15 billion
to €35 billion per year. An important source of uncertainty is the limited information available about typical quantities
consumed for different types of users. In addition, when surveying respondents about sensitive behaviours, under-reporting is
a perennial concern. Thus, when estimating marijuana consumption from general population surveys, some researchers make
adjustment to the estimates. Sometimes under-reporting is thought of only in terms of survey respondents’ under-reporting
of their activity, but we are interested in a more general concept: How much do respondents’ self-reports under-estimate
28
Estimating the size of the EU cannabis market
true consumption by the entire population? That under-estimate is what governs the size of the “multiplier” that should be
applied to adjust survey-based estimates upward when estimating national consumption. Indeed, it is useful to distinguish
four components of such a multiplier or adjustment (Kilmer et al. forthcoming):
1) Use by people outside the survey’s sampling frame (e.g. homeless who are not in shelters),
2) Use by people who are in the sampling frame but nonetheless are not surveyed (e.g. because they were never home),
3) Under-reporting of past-month use by people who are successfully surveyed, and
4) Under-reporting of quantities consumed (e.g. days used in the past month) even if some use is acknowledged.
To keep the combined effect of these factors distinct from what is usually referred to as under-reporting (i.e., did the
respondent admit use?), we refer here to the aggregate effect of these four phenomena as the “consumption gap.”
Our paper initially estimates spending as consumption times price; however, a significant limitation of that approach is that
users do not always pay the price as estimated and reported in official documents. There can be considerable variation in price
across regions within a country (Caulkins 1995), and perhaps more importantly, large discounts for purchasing in quantity
(Caulkins and Padman 1993). Hence, it is of equal interest to estimate national spending from individuals’ reports of their own
spending. This alternative approach has its own challenges, notably the possibility that some of what individuals purchase they
then resell, either at cost (when they act as an “alpha buyer” purchasing for friends) or for profit (if they are a user-seller). So
neither estimate is obviously superior a priori. For the latter method for estimating spending we sum over countries and user
groups the amounts spent on cannabis herb and resin. Data from the sample Member States of our EU drugs market study
are used to impute spending rates for the other countries.
These approaches suggest a range of €6.7 billion to €9.8 billion annually circa 2010, but this is before adjusting for the
“consumption gap.” This paper does not calculate or advocate for the use of a particular “consumption gap” adjustment; we
think this is best done ex post in a judgmental way, not via some calculation that creates an artificial sense of precision. If one
believes that these survey-based estimates only capture half of the market [an estimate that is not uncommon in the alcohol
literature (see review in Gmel and Rehm 2004), but generally smaller than the figures typically used for cannabis], then the
market would be €13.4 billion to €19.6 billion. Those comfortable with the more conventional adjustment of multiplying by
1.25 would estimate the range to be lower: €8.4 billion to €12.1 billion.
The main reason our estimates appear lower than previous estimates is because the web survey in our EU drugs market study
suggests lower rates of consumption and spending than the rules of thumb from the past which often did not differentiate
by type of users. However, this is just one survey. If our estimates are wrong, it will likely be because web-based surveys
under-sample the really heavy dependent users, or because of the general “consumption gap” that also appears for alcohol
and tobacco.
Finally, the analyses presented in this chapter make methodological contributions that should improve future attempts to
size illegal drug markets. First, we find that if we place all past-month cannabis users into four frequency groups and then
calculate the total amount of cannabis consumed by use group in each of our web survey countries, there are important
similarities across a number of Member States. This has implications for imputing consumption for other Member States.
Second, we show that consumption intensity (grams per day of use) is positively correlated with consumption frequency (days
used per month). Hence, multiplying the average number of use-days by the average number of grams consumed per use
day generates consumption figures that are lower than the correct approach of multiplying each individual’s days consumed
and daily consumption figures and then averaging. I.e., for each frequency group and country, E[days]*E[grams per day]
< E[days*grams per day], where E[] stands for taking the average or expected value. The latter is preferred and can now
be estimated using the web survey data; thus increasing what our estimates would have been if we used the other, more
traditional method. We hope this observation gets incorporated into future sizing exercises and motivates the collection of
additional data about quantities consumed and expenditures.

Estimating the size of the EU cannabis market
29
ReferencesCaulkins, J. P. (1995). Domestic Geographic Variation in Illicit Drug Prices. The Journal of Urban Economics 37(1) 38-56.
Caulkins, J. P. and Padman R. (1993). Quantity Discounts and Quality Premia for Illicit Drugs. The Journal of the American
Statistical Association 88(423) 748-757.
EMCDDA (2008). A cannabis reader: global issues and local experiences. Available: http://www.emcdda.europa.eu/publica-
tions/monographs/cannabis
EMCDDA (2012). Cannabis production and markets in Europe. Available: http://www.emcdda.europa.eu/publications/
insights/cannabis-market
Gmel, G. and Rehm, J. (2004). Measuring alcohol consumption. Contemp. Drug Probs. 31(467).
Kilmer, B., Everingham, S., Caulkins, J., Midgette, G., Reuter, P., Burns, R. et al. (forthcoming): What America’s users spend
on illicit drugs, 2000–2010.
Legget, T. (2006). A review of the world cannabis situation. Bull Narc. 2006 58(1-2):1-155.
Van Laar, M., Frijns, T. Trautmann, F. and Lombi, L. (forthcoming 2013). User types, availability and consumption estimates.
In: Further insights into aspects of the EU illicit drugs market, Trautmann, F., Kilmer, B. and Turnbull, P. (eds). European
Union, Brussels.


Managing potential conflict in illegal markets
3131
5. Managing potential conflict in illegal markets: an exploratory study of cocaine smuggling in the Netherlands
Melvin Soudijn and Peter Reuter
5.1 Key findings
• Cocaine smugglers frequently face potential disputes with others in the same business as the result of shipments being
seized, disagreements about money or drugs or failure of agents or customers/suppliers to perform. They may use violence
to resolve these, as is often assumed. We developed an “incident data base” from 31 large files on Dutch-domiciled cocaine
smugglers. Analysis of this data-base showed that many disputes were resolved without either violence or its threat; the
parties might agree that no one was at fault or that compensation could be provided in a later transaction.
• The disputes that were most likely to result in violent resolution were those involving participants of different ethnic origins
or participants in different organizations. However the incident data-base, with only 33 observations, is too small to make
these findings more than indicative.
• This study was restricted to a specific drug (cocaine), level (smuggling) time (2005-2010) and place (the Netherlands).
However, methodologically the study suggests that it is possible to use rich investigative data to examine what drives
violence in the drug trades.
5.2 Summary
Illegal enterprises operate in settings of risk and uncertainty very different from those in legal businesses. Not only do the
state and competitors threaten their transactions and assets but they cannot make use of written contracts, settle disputes
through the civil courts or obtain information as readily as their legal counterparts. Thus disputes are likely to be more
common. Moreover those entering illegal markets include many whose skill is intimidation. It is widely assumed that illegal
entrepreneurs, such as drug dealers and human smugglers, make routine use of violence to settle disagreements or punish
failures. Studies of drug retailing, mostly in the U.S., show a variety of non-violent dispute resolution methods but there is
no study of high level traffickers, whose risk-reward calculations may differ.
The data for this research were extracted from 31 case files on cocaine smuggling enterprises involving Dutch-resident
Ringleaders. The cases included all the major investigations of cocaine smuggling from 2005-2010. Each enterprise had been
involved in smuggling of shipments of multiple kilos, typically tens of kilos, in a single shipment, worth hundreds of thousands
of Euros. Since the Dutch police make extensive use of wiretaps and other electronic surveillance the case files are relatively
rich in their description of interactions among participants.
We used data on 33 incidents involving failure of cocaine smuggling related transactions of smugglers to examine the use of
violence and threats. We focused on incidents that could potentially, or did actually, derail the trafficking of cocaine. Many
involved transactions between Dutch-domiciled dealers and exporters from South America. We defined incident in a broad sense
keeping it open to include all kinds of possible failures. These could range from accidently faxing the details of an operation to
the wrong fax number, forgetting to extract all the cocaine out of a shipment of fruit to even stealing shipments of cocaine.
These incidents often led dealers, otherwise cautious in their phone conversations, to be more open in their communication in
order to deal with a crisis expeditiously. We focused our analysis on the principal in the operation, hereafter called the Ringleader.
Most Ringleaders are also involved in the smuggling and production of other drugs including, Ecstasy, precursors, hashish,
Dutch cannabis, or heroin. They do not seem to have much involvement in illegal markets other than drugs; one is involved
in cigarette smuggling and another in owns a brothel.

32
Managing potential conflict in illegal markets
The data show that in most instances the Ringleader follows routines perhaps not very different from those in legitimate
organizations, investigating whether the balance of evidence favours an interpretation of bad luck or underling incompetence
as opposed to an effort to defraud. As shown in the Table, sixty percent of the incidents were resolved without threat or
actual violence. Participants were often willing to negotiate a compromise. For example, in one incident a seller says that the
buyer did not hand over as much money as promised following a cocaine delivery; they agree that this will be dealt with in
their next transaction. These kinds of agreements point to the confidence of the participants that their transactional partners
have a high probability of continuing to operate, suggesting that stable markets may be less violent.
However forty percent of incidents did involve the actual use of violence; this count includes two incidents in which the police
stepped in to rescue the target. Looking not at incidents but at Ringleaders (i.e. taking into account that there are multiple
observations on some individuals) we still find seven out of 18 who are involved in at least one incident resolved with violence.
It appears that it is not just a few “bad apples” that feel the need to use violence.
Table Characteristics of incidents
Incident type
Money dispute 9
Loss of drugs 7
Problems offloading 5
Police confiscation 5
Unexpectedly low quality of drugs 3
Delay 1
Quitting 1
Stealing cocaine 1
Exposing operation 1
33
Resolution
Violence 11
Barter 8
Leave it 5
Physical proof 5
Find more capable party 2
Rerouting 2
33
With only 33 incidents in the database, analyses of sub-groups can only be descriptive and indicative. We hypothesized
that incidents involving participants from the same ethnic group would be less likely to require violence for resolution and
similarly that incidents within a group rather than between groups would also be less likely to generate violence. The data
are consistent with both these hypotheses.
It is perhaps surprising that such a high percentage of these incidents involves the use of violence. In some cases the culpable
party had acted in an egregious fashion, which is not to justify morally the violence but to suggest that it was not arbitrary
and capricious. Cocaine smuggling attracts many individuals who indeed cannot be trusted; their behaviour may reasonably
provoke forceful responses, shading into violence.
This is the first systematic study of violence in the higher levels of the drug trade. This sample is limited in scope; Dutch-
resident dealers, cocaine, 2005-2010. While it adds to the literature by providing data on high-level transactions, it cannot
be generalized to other drugs, places and times. For example, the Netherlands is a country characterized by low levels of
violence, which may discourage violence in the drug trades. The results here are preliminary and further analysis of the
data-base is expected.
Insights about cannabis production and distribution costs in the EU
33
6. Insights about cannabis production and distribution costs in the EU
Beau Kilmer and James Burgdorf
6.1 Key findings
• Enforcing laws against the production and distribution of cannabis dramatically inflate their costs. The increase is largely
driven by having to compensate producers and suppliers for their risk of arrest, incarceration, seizure, and violent injury as
well as by the inefficiencies associated with having to operate covertly.
• In Morocco it costs approximately €90 – €180 to purchase the cannabis needed to produce 1kg of cannabis resin. The value
of this 1kg increases as it moves along the supply chain (See Figure S1 below). After accounting for labour and distribution
costs as well as risk compensation, that same 1kg generates approximately €8,000 in gross revenues in a Dutch coffee shop.
• The marginal cost of producing organic, high-potency, medical-grade herbal cannabis that has been professionally tested
and packaged and produced in a Dutch facility with vegetation and flowering rooms that are both 56 square meters is
about €1,000 per kilogram.
• Removing the prohibition on cannabis production and distribution could dramatically reduce the production and distribution
costs; however, the size of the decrease will largely depend on the type of production that is allowed and how the market
is regulated (e.g. will there be several private producers, a state monopoly, non-profit cooperatives, etc.). Further, the
significance of the drop will also depend on the economic situation of the producing countries. We would expect to see
larger drops in industrialized countries where there are significant risks associated with being arrested and sanctioned.
6.2 Summary
Policy makers interested in understanding the fiscal and public health implications of alternative cannabis regimes should not
ignore the effect of these policy changes on cannabis production and distribution costs.1 Indeed, if changes in production
and distribution costs are large enough to influence the retail price, this could influence total consumption since consumers
are sensitive to the price of cannabis (i.e., when price decreases, use increases; see reviews in Pacula 2010; Gallet 2013).2
Enforcing laws against the production and distribution of cannabis dramatically inflate their costs. The increase is largely
driven by having to compensate producers and suppliers for their risk of arrest, incarceration, seizure, and violent injury as
well as by the inefficiencies associated with having to operate covertly. If cannabis were commercially farmed outdoors like
any other agricultural good in developed countries, the production and distribution costs would plummet (see e.g. Gieringer
2009; Caulkins 2010; Caulkins et al. 2012). For example, Caulkins et al. (2012) estimate that the cost of producing a kilogram
of high-potency cannabis could drop below €100 in developed countries if cannabis was allowed to be commercially farmed
outdoors like other crops that need to be transplanted.
This chapter demonstrates how cannabis prices increase across the supply chain in the EU as distributors take additional
mark-ups to compensate themselves not only for shipping costs but also for the risks they assume. Figure S1 displays how
the value of 1kg of cannabis resin increases as it moves from Morocco to the EC. In Morocco it costs about €90 – €180 to
purchase the 36kg of cannabis needed to produce 1kg of cannabis resin. After accounting for labour and distribution as well
as risk compensation, that same 1kg generates about €8,000 in gross revenues in a Dutch coffee shop.
1 Please note that this paper does not take a position about whether cannabis prohibition, or even cannabis for that matter, is a good or bad thing.2 Of course, the overall effect will also depend on the tax rate and regulatory structure. In addition, policy changes may also have non-price
effects on consumption (MacCoun 2010). For a more comprehensive discussion of the possible consequences of alternative cannabis production policies, see Kilmer et al. (2010) and Caulkins et al. (2012).

34
Insights about cannabis production and distribution costs in the EU
Figure S1. Approximate value of 1 kilogram of cannabis resin along the supply chain
4000
3000
2000
1000
0
5000
Raw cannabis (36kg = 1kg resin) (MR)
7000
6000
8000
9000
Resin (MR) Resin--Export price (MR)
Resin--Wholesale (ES)
Imp. Resin--Wholesale (NL)
Imp. Resin--Retail (NL)
Sources: in 2012 €. Created by Kilmer and Burgdorf and based on data from Bussink et al. 2007; UNODC 2006; UNODC 2007; Afsahi
2011; Gamella and Rodrigo 2008; and Niesink et al. 2010, as cited in van Laar et al. 2011. Imp. = imported, MR=Morocco, ES=Spain,
NL=Netherlands.
To learn more about the costs of producing cannabis in a legal environment in an industrialized country, this chapter looked
at the government-approved medical cannabis production program in the Netherlands. While cannabis production and
distribution for commercial purposes is illegal in the Netherlands and laws against upper-market suppliers are enforced, an
exception is made for medical cannabis. The Dutch Ministry of Health, Welfare, and Sport created the legal infrastructure
for medical cannabis in the early 2000s and makes it available in pharmacies to patients with a valid prescription. There are
now approximately 1,000 medical patients in the Netherlands, and all medical cannabis is currently provided by the Dutch
company Bedrocan BV.
At Bedrocan, the clones from a mother plant are nurtured in a sterile and humid room (Figure S2) before they are moved to
a separate room for vegetative growth (Figure S3). Figure S2 displays a picture of one “batch” (130 plants) in the vegetation
room which is about 56 square meters. These plants are eventually moved to a similarly sized room next door for flowering.
These 130 plants will yield 17kg of useable cannabis bud, a figure which is consistent across harvests. The average yield is
approximately 123g per plant, depending on the strain.

Insights about cannabis production and distribution costs in the EU
35
Figure S2. Room full of clones at Bedrocan BV
Figure S3. Room for vegetative growth at Bedrocan BV
Bedrocan reports that its marginal cost for a producing a kilogram of high-potency, medical grade, organic cannabis that has
been professionally tested, packaged, and gamma irradiated is approximately €1,000. When thinking about how this figure
could be used to inform estimates of the cost of producing legal cannabis for the non-medical market, one should keep in
mind that 1) This is a heavily-regulated, high-quality product intended to be used as medicine by those who are sick; 2) the
cannabis is produced in a relatively small indoor facility in a country with a high cost of living; and 3) there is no competition.
As stated earlier, the cost of producing high-potency cannabis in large outdoor commercial farms could be much lower.

36
Insights about cannabis production and distribution costs in the EU
In a licit market, the wholesale price will be shaped by production costs, producer mark-ups,3 distribution costs, and possibly
fees and taxes. With the EMCDDA (2012) reporting that wholesale prices of herbal cannabis ranged between €800-€9000 per
kilogram in the EU circa 2008,4 alternative policies could lead to a large reduction in the wholesale price even after accounting
for the mark-up and extra costs associated with producing in a licit market.
Removing the prohibition on cannabis production and distribution could dramatically reduce the production and distribution
costs; however, the size of the decrease will largely depend on the type of production that is allowed and how the market is
regulated (e.g. will there be several private producers, a state monopoly, non-profit cooperatives, etc.). Further, the signifi-
cance of the drop will also depend on the economic situation of the producing countries. We would expect to see larger drops
in industrialized countries where there are significant risks associated with being arrested and sanctioned.
Indeed, it is possible that a country which allows a commercial market for cannabis could depress retail prices not only for
itself but also for other countries. However, this will depend largely on how governments decide to regulate their newly legal
markets and how neighbouring countries react to these changes. Thus, when evaluating the strengths and weaknesses of
alternative cannabis policies, the cost and price implications of each option should not be overlooked.
ReferencesAfsahi, K. (2011). Cannabis cultivation practices in the Moroccan Rif. In: World wide weed. Global trends in cannabis cultiva-
tion and its control, Decorte, T., Potter, G. and Bouchard, M. (eds), pp. 39–54. Ashgate, Farnham.
Bussink, C., Destrebecq, D., Korenblik, A., Pichon, T. l., Raithelhuber, M., Saenz, E. et al. (2007). Maroc: Enquête sur le
cannabis 2005. United Nations Office on Drugs and Crime (UNODC).
Caulkins, J. P. (2010). Estimated cost of production for legalized cannabis. RAND Working Paper.
Caulkins, J. P. and MacCoun, R. (2003). Limited rationality and the limits of supply reduction. Journal of Drug Issues 33(2), 433-464.
Caulkins, J. P., Hawken, A., Kilmer, B., and Kleiman, M. A. R. (2012). Marijuana legalization: What everyone needs to know.
Oxford University Press, New York.
EMCDDA (2012). Cannabis production and markets in Europe. European Monitoring Centre for Drugs and Drug Addiction, Lisbon.
Gallet, C. A. (2013). Can price get the monkey off our back? A meta-analysis of illicit drug demand. Health Economics.
Gamella, J. F. and Rodrigo, M. L. J. (2008). Chapter 15: Multinational export-import ventures: Moroccan hashish into Europe
through Spain. In: A Cannabis Reader: Global Issues and Local Experiences (Vol. 1). EMCDDA, Lisbon.
Gieringer, D. (2009). Testimony on the legalization of marijuana. Available: norml.org/pdf_files/AssPubSafety_Legalization.pdf.
Kilmer, B., Caulkins, J., Pacula, R., MacCoun, R. and Reuter, P. (2010). Altered state? Assessing how marijuana legalization in
California could influence marijuana consumption and public budgets. RAND Corporation, Santa Monica, CA.
MacCoun, R. (2010). Estimating the non-price effects of legalization on cannabis consumption. RAND Corporation, WR-767,
Santa Monica, CA. Available: http://www.rand.org/pubs/working_papers/WR767/
Pacula, R. (2010). Examining the impact of marijuana legalization on marijuana consumption: Insights from the economics
literature. RAND Corporation, WR-770, Santa Monica, CA. Available: http://www.rand.org/pubs/working_papers/WR770/
UNODC (United Nations Office on Drugs and Crime) (2006). World Drug Report 2006. United Nations, New York.
UNODC (United Nations Office on Drugs and Crime) (2007). World Drug Report 2007. United Nations, New York.
UNODC (United Nations Office on Drugs and Crime) (2012). World Drug Report 2012. United Nations, New York.
Van Laar, M., Cruts, G., Ooyen-Houben, M. v., Gageldonk, A. v., Croes, E., Meijer, R. et al. (2011). The Netherlands drug
situation 2011 Report to the EMCDDA by the Reitox National Focal Point. Trimbos Institute, Utrecht.
3 A mark-up of 25% is not unreasonable for agricultural producers (Caulkins 2010).4 Black market wholesalers currently charge €3000-€4000 for a kilogram of high-potency domestically produced herbal cannabis in the Nether-
lands (Korf 2011; Spapens 2011; UNODC 2012).

The impact of changes in the Netherlands coffee shop policies on local buyers and markets
37
7. The impact of changes in the Netherlands coffee shop policies on local buyers and markets
Tiggey May and Oonagh Skrine
7.1 Key findings
• Of the 871 respondents to the web-based survey most (70%) reported that they were aware that the incoming govern-
ment would implement a weed pass, half of the sample, however, didn’t think their buying habits would change regardless
of whether a weed pass was introduced or not.
• During 2012, few respondents (representing the 12 provinces) reported that they had noticed a change in the number
of coffee shops in their local area. Over three-quarters reported that their attendance at coffee shops had remained the
same over the previous 12 months despite the proposed changes having being implemented in a number of areas of the
Netherlands. For instance, the so-called weed pass was only ‘tested’ in the three Southern provinces for some months in
early 2012.
• A number of respondents were critical of the introduction of the weed pass, mainly because they considered the policy of
condoning cannabis use and sale whilst it remained illegal nonsensical.
• Just over a fifth (22%) believed that the cannabis market should be regulated to ensure its separation from more serious
drugs. The same number (22%) of respondents commented that they believed the introduction of weed passes would
open the cannabis market to a more diverse range of criminals.
• Dutch drug policy experts tended to agree that the Netherlands had achieved an effective market separation; it is widely
accepted that the cannabis markets operate separately from the heroin and cocaine markets. However, how cannabis
is supplied to coffee shops is largely unregulated, un-policed and rarely monitored - leaving it open to infiltration from
organised crime groups.
• The expert interviewees agreed that whilst the weed pass would undoubtedly alleviate some of the problems caused by
drug tourism, none thought it would eradicate them.
• Regulating the supply of cannabis to coffee shops remains a challenge for the Dutch government.
7.2 Summary
Since the late 1960s cannabis use and the possession of cannabis for personal use has been condoned in the Netherlands.
In an effort to separate the markets for hard (heroin and crack) and soft (cannabis) drugs, the Dutch Narcotics Act of 1976
officially decriminalised the possession of cannabis for personal use and the sale of small quantities, characterising it as a
misdemeanour rather than an offence. From 1994 there has been a trend towards tightening the coffee shop regulations. By
May 2012 the then government announced a new policy, restricting access to coffee shops through a membership pass for
local residents (the weed pass). The aim of the pass was twofold: to keep coffee shops small, regulated and only for the use
of the local population, while at the same time rejecting access to drug tourists travelling to the Netherlands. The new rules
were provisionally put in place in a few municipalities in the South of the country in 2012 and were due to be implemented
nationwide in January 2013. A number of commentators, including coffee shop owners and patrons expressed concerns about
the proposed new policies stating that street dealing would increase, the tax revenue from coffee shops would decrease and
the market separation that had been the cornerstone of Dutch drug policy would be eroded. The aim of this small qualitative
case study was to provide a snapshot (in time) of the views of members of the public and a small number of Dutch drug
policy experts of the proposed coffee shop changes.
38
The impact of changes in the Netherlands coffee shop policies on local buyers and markets
MethodsThe information used to inform this work was drawn from the following sources:
• an English language literature review of sources published in the last 20 years;
• a web-based survey with 871 Dutch respondents (this survey was carried out prior to any changes being implemented);
• in-depth interviews with a small number of Dutch drug policy experts.
Dutch cannabis use and regulationSince the late 1960s cannabis use and possession for personal use has been condoned in the Netherlands as part of a
consensus not to combine morality with criminal justice. In the 1970s it began to be argued that criminalising cannabis could
lead users to further involvement with drugs considered more dangerous, such as heroin. In an effort to separate the markets
of hard and soft drugs, the Dutch Narcotics Act of 1976 officially made a separation between soft and hard drugs and
decriminalised the possession of cannabis for personal and the sale of small quantities, characterising it as a misdemeanour
rather than an offence. The prevalence of cannabis use among young people remained much the same, despite the more
relaxed legislation. Throughout the 1980s the coffee shop system emerged and, despite the sale of cannabis remaining illegal,
toleration led to their proliferation.
In 1994 a new coalition took a tougher stance on cannabis regulations. With the aim of reducing public nuisance, drug
tourism, cannabis cultivation and coffee shop related crime, a number of new restrictions were introduced. Limits were
imposed on the quantity of cannabis a coffee shop could sell in any one day or house; minors were not permitted to make
purchases; the number of plants allowed for home cultivation was limited; and mayors’ powers to close coffee shops were
bolstered. Between 2000 and 2009 the number of coffee shops nationally fell from 813 to 666.
In 2009 a review and evaluation (by leading Dutch drug policy experts) of Dutch drug policy was launched. One conclusion
of the review was that the separation of the markets was reasonably successful. The expert committee recommended that
coffee shops should move towards being ‘closed clubs’ thus limiting drug tourism. The committee also highlighted that ideally
there should be a national policy on how coffee shops are managed but this policy should allow municipalities the flexibility
to respond to local demands. Ideally local responses should involve the mayor, Public Prosecution Service, the police and
preferably include an input from the municipal health service. In conclusion the Committee stated that it: “would call for a
more systematic approach, with further development of drugs policy in a more systematic and controlled manner than we
have seen over the past few years ….. and with more guidance from central government…… National policy will have to be
more actively shaped, and this will include the setting up and evaluation of experiments”.
The government responded and issued a memo outlining their proposed new policy which was to make coffee shops quiet
places for adult local residents, to restrict the number of coffee shops in any one area, and to increase efforts against organised
criminals selling cannabis to coffee shops.
In May 2011, the government announced a policy to restrict access to coffee shops through a membership pass, which was
to be open only to adults (although the requirement that buyers are adult is not new) resident in the Netherlands, with the
stated aim of preventing foreign drug tourists from travelling to the Netherlands. The new rules were due to be implemented
countrywide in January 2013. Coffee shop owners expressed concerns that customers would be unwilling to register with
coffee shops and that street dealing would increase, the unwillingness to register was born out by surveys with consumers.
After the ‘weed pass’ was implemented in the Southern provinces, such as Limburg, there were reports of increased street
dealing. During the writing of this report the Dutch government changed and decided not to introduce the weed pass, instead
suggesting that visitors should present their identity card proving that they are residents of the Netherlands. The implementa-
tion of this rule has been left at the discretion of individual municipalities, some of which have decided to continue to allow
non-Dutch residents to purchase cannabis.
The impact of the weed pass on the general publicOur survey was carried out in early 2012, prior to the weed pass plan being abandoned. The views of the respondents
therefore have to be viewed from that perspective. Just over two-thirds (70%) of the web-based survey respondents were
aware that the weed pass was due to be implemented in the Netherlands; just under half, however, believed that its introduc-
tion would have little or no effect on their purchasing habits. Prior to the weed pass becoming formal legislation a number of
areas in the South of the country implemented some of the proposed changes; however, few respondents of the web-based
survey reported noticing any changes occurring in the number of coffee shops in their local area. Although the majority of
respondents did report that stricter policies were being imposed by the proprietors of their local coffee shops, for example:

The impact of changes in the Netherlands coffee shop policies on local buyers and markets
39
restrictions were being placed on the amount individuals could purchase and tighter control was being imposed on who was
admitted to the premises. Despite the regulations changing, just under a quarter of the sample (across the country) reported
that their attendance at coffee shops had remained the same over the previous 12 months.
Dutch cannabis policies: the views of the web-based survey respondents It would appear that with the tightening of the regulations that govern Dutch coffee shops there has been a concurrent drop
in public support for Dutch drug policy. Almost half of the survey respondents were critical of current Dutch cannabis policy
stating that it was nonsensical. Although a third supported the new coffees shop policies. Just over a fifth (22%) believed
that the cannabis market should be regulated to ensure it retains its separation from other more serious drug markets. Nearly
a fifth (22%) of respondents believed that the introduction of weed passes would open the cannabis market up to a more
diverse risk taking range of criminals.
Dutch cannabis policies: the views of Dutch drug policy expertsDutch drug policy experts tended to agree that the Netherlands had achieved an effective market separation; they agreed
that the cannabis market operates separately from the heroin and cocaine markets but were unsure whether the tighter
coffee shop regulations would erode this previously successful policy of market separation. The experts voiced greater concern
regarding the supply of cannabis to coffee shops, stating that how cannabis is supplied to coffee shops is largely unregulated,
un-policed and rarely monitored - leaving it open to infiltration from Organised Crime Groups. The expert interviewees
agreed that whilst the weed pass would undoubtedly alleviate some of the problems caused by drug tourism it was unlikely
to eradicate them entirely and might even create other unforeseen problems.
ConclusionThe introduction of the weed licence has been a relatively contorted and confusing process, with its impact being purely
dependent upon where you live. Although the Southern municipalities adopted the weed pass in 2012, with the aim that the
weed pass would be implemented nationwide in January 2013 the new Government in November 2012 abandoned this plan.
The new government instead implemented the less restrictive proof of residency requirement (see above). In essence, deci-
sions on who to allow into coffee shops have now been left in the hands of the mayor of each municipality. Although complex
and confusing for residents and visitors alike, the decision to devolve responsibility to local politicians seems a pragmatic one,
especially in light of the range of challenges posed by the very different provinces. The more pressing, although less visible,
challenge to Dutch drug policy, however, is how to control the illicit (street) drug market, which is likely to flourish as and
when coffee shops close, if customers have to register and if drug tourists are unable to buy from coffee shops. Another
equally pressing issue, is how to regulate the supply of cannabis to coffee shops – an issue that appears to have been left in
the “too hot to handle basket” by successive Dutch governments. This particular issue, however, may now become far more
pressing if the risk adverse small scale suppliers desist from supplying, and the risk taking organised criminal gangs take over.


Key trends of the illicit drugs market and drug policy in the EU
41
8. Key trends of the illicit drugs market and drug policy in the EU: what do experts anticipate for the coming years?
Franz Trautmann
With contributions of Martine Themmen to the analysis of the drug policy trends
8.1 Key findings
• The study confirms the future importance of key trends we had identified in our earlier study on the global illicit drug
markets study (the increase of scale, growing globalisation and diversification of the drugs market and – in the field of drug
policy – the decriminalisation of use and possession of small quantities for personal use, a tougher approach to illicit drugs
supply, the wider acceptance of harm reduction and regulation instead of prohibition in drug control policies). Experts also
emphasised the importance of the following trends for the coming years: the increasing importance of internet as means
of drugs distribution, the impact of the economic crisis on the drugs market and on drug policy and the (further) increase
of poly substance use.
• Experts underline that the development of the illicit drugs market is following the same general ‘economic laws’ as the
different licit markets. The increase of scale, globalisation and diversification of the illicit drugs market is at the same time
partly understood as unintended consequences of the current prohibitive drug control policy.
• Some of the examined drug policy trends (decriminalisation of use and possession of small quantities for personal use,
wider acceptance of harm reduction and regulation instead of prohibition in drug control policies) are interpreted to be a
response to dissatisfaction and/or disappointment with the results of current drug policy, to its unintended consequences
(individual and public health risks and the contribution to illicit economies and organised crime), to inconsistencies of the
policies towards licit and illicit drugs and to the unreasonableness of criminal proceedings in response to the use of illicit drugs.
• The economic crisis is expected to have a major impact both on the drugs market (e.g. increase of demand) and on drug
policy (e.g. budget cuts). Experts also mention that these effects might be intensified by a rise of political conservatism
in EU Member States, which might have an impact on social and health policies and support a tougher approach in drug
policy. This could lead to divergence from the drug policy consensus reached in the EU in the past decade (e.g. decreased
support of harm reduction in some Member States).
8.2 Summary
In this study we explored expert views on the future development of selected key trends of the illicit drugs market and policy
responses in the EU. As a tool for consulting a number of selected experts we used a variant of the Delphi method, consisting
of the following consecutive steps:
1. Consulting a selected group of EU drug experts about key trends of the illicit drugs market and policy responses in the EU
and about their future development in three rounds. For the first two rounds we used a web-based application. For the
last round we sent out questionnaires through e-mail.
2. Formulating a draft paper, summarising the EU experts’ expectations about the development of these key trends.
3. A one round consultation of experts from the seven sample Member States on the conclusions in this draft paper, using
questionnaires through e-mail.
4. Consulting international experts to discuss the findings and conclusions from this consultation and writing the report.
To take into account the diversity of viewpoints on trends of the illicit drugs market and policy responses we focused on
experts representing different relevant viewpoints on both demand and supply issues, i.e. policy makers, researchers/drug
policy analysts, representatives from demand reduction services, police / justice, user/’hands-on’ expert and journalists. In
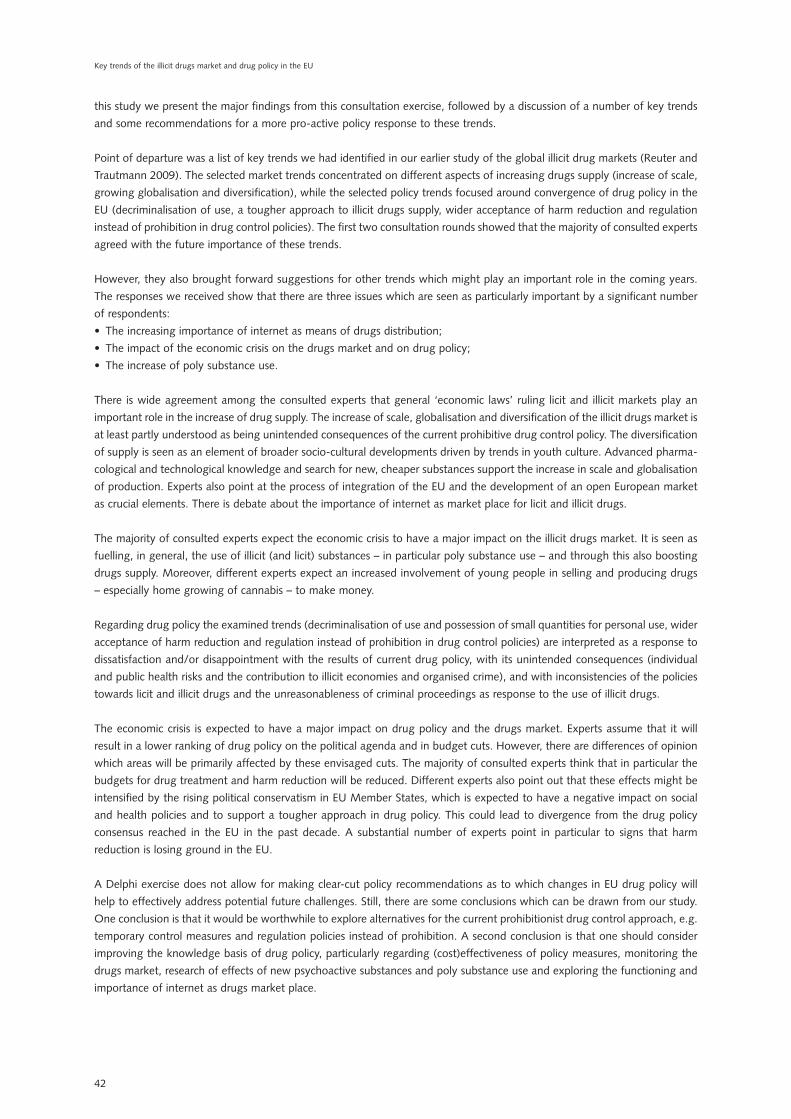
42
Key trends of the illicit drugs market and drug policy in the EU
this study we present the major findings from this consultation exercise, followed by a discussion of a number of key trends
and some recommendations for a more pro-active policy response to these trends.
Point of departure was a list of key trends we had identified in our earlier study of the global illicit drug markets (Reuter and
Trautmann 2009). The selected market trends concentrated on different aspects of increasing drugs supply (increase of scale,
growing globalisation and diversification), while the selected policy trends focused around convergence of drug policy in the
EU (decriminalisation of use, a tougher approach to illicit drugs supply, wider acceptance of harm reduction and regulation
instead of prohibition in drug control policies). The first two consultation rounds showed that the majority of consulted experts
agreed with the future importance of these trends.
However, they also brought forward suggestions for other trends which might play an important role in the coming years.
The responses we received show that there are three issues which are seen as particularly important by a significant number
of respondents:
• The increasing importance of internet as means of drugs distribution;
• The impact of the economic crisis on the drugs market and on drug policy;
• The increase of poly substance use.
There is wide agreement among the consulted experts that general ‘economic laws’ ruling licit and illicit markets play an
important role in the increase of drug supply. The increase of scale, globalisation and diversification of the illicit drugs market is
at least partly understood as being unintended consequences of the current prohibitive drug control policy. The diversification
of supply is seen as an element of broader socio-cultural developments driven by trends in youth culture. Advanced pharma-
cological and technological knowledge and search for new, cheaper substances support the increase in scale and globalisation
of production. Experts also point at the process of integration of the EU and the development of an open European market
as crucial elements. There is debate about the importance of internet as market place for licit and illicit drugs.
The majority of consulted experts expect the economic crisis to have a major impact on the illicit drugs market. It is seen as
fuelling, in general, the use of illicit (and licit) substances – in particular poly substance use – and through this also boosting
drugs supply. Moreover, different experts expect an increased involvement of young people in selling and producing drugs
– especially home growing of cannabis – to make money.
Regarding drug policy the examined trends (decriminalisation of use and possession of small quantities for personal use, wider
acceptance of harm reduction and regulation instead of prohibition in drug control policies) are interpreted as a response to
dissatisfaction and/or disappointment with the results of current drug policy, with its unintended consequences (individual
and public health risks and the contribution to illicit economies and organised crime), and with inconsistencies of the policies
towards licit and illicit drugs and the unreasonableness of criminal proceedings as response to the use of illicit drugs.
The economic crisis is expected to have a major impact on drug policy and the drugs market. Experts assume that it will
result in a lower ranking of drug policy on the political agenda and in budget cuts. However, there are differences of opinion
which areas will be primarily affected by these envisaged cuts. The majority of consulted experts think that in particular the
budgets for drug treatment and harm reduction will be reduced. Different experts also point out that these effects might be
intensified by the rising political conservatism in EU Member States, which is expected to have a negative impact on social
and health policies and to support a tougher approach in drug policy. This could lead to divergence from the drug policy
consensus reached in the EU in the past decade. A substantial number of experts point in particular to signs that harm
reduction is losing ground in the EU.
A Delphi exercise does not allow for making clear-cut policy recommendations as to which changes in EU drug policy will
help to effectively address potential future challenges. Still, there are some conclusions which can be drawn from our study.
One conclusion is that it would be worthwhile to explore alternatives for the current prohibitionist drug control approach, e.g.
temporary control measures and regulation policies instead of prohibition. A second conclusion is that one should consider
improving the knowledge basis of drug policy, particularly regarding (cost)effectiveness of policy measures, monitoring the
drugs market, research of effects of new psychoactive substances and poly substance use and exploring the functioning and
importance of internet as drugs market place.

Key trends of the illicit drugs market and drug policy in the EU
43
ReferencesReuter, P. and Trautmann, F., editors (2009). A Report on Global Illicit Drug Markets 1998-2007: full report. European
Commission, Brussels.

Further insights into aspects of the EU illicit drugs market: summaries and key findings
Luxembourg: Publications Office of the European Union
2013 - 44 pp. - 21 x 29,7 cm
ISBN 978-92-79-28674-2
doi: 10.2838/4281

doi: 10.2838/4281
DS-30-13-272-EN
-N