funding virginia’s schools - virginia senate finance …sfc.virginia.gov/pdf/retreat/2011...
TRANSCRIPT

SENATE FINANCE COMMITTEE
SENATE OF VIRGINIA
Senate Finance Committee
November 18, 2011
Funding Virginia’s Schools in a Global Economy and a Digital World

SENATE FINANCE COMMITTEE
Overview
• Snapshot: With one in six Virginians being ofschool age, public education is the largest singlestate budget item at $5 billion GF (FY 2012).
• Funding Framework: Pursuant to Virginia’sConstitution, the General Assembly has theresponsibility for determining what the cost of ahigh quality education is and how the cost isshared between the state and localities.
• 2012-14 Biennium: With state reductions inrecent years and local actions, the biennialtechnical re-benchmarking update of costs will berelatively modest compared to recent biennia,apart from retirement funding.
• Emerging Issue: Various education policy issueswill compete for the attention of the GeneralAssembly in 2012 and beyond. Online learning isone that has the potential to transform the deliveryof education, but raises funding questions.
2

SENATE FINANCE COMMITTEE
One in Six Virginians is School Aged
• Statewide Virginia currently has 1.2 millionstudents in Average Daily Membership (ADM).
• Children aged 5-17 represent 16.7 percent ofVirginia’s total population.– Virginia has relatively more residents ages 18-64 at
64.4 percent of the resident population, compared tothe U.S. average of 62.9 percent.
3
6.8%
16.7%
64.4%
12.1%
Percent of Virginia's Population By Age Group
Under 5 Ages 5‐17 Ages 18‐64 Ages 65 and Older

SENATE FINANCE COMMITTEE
The Size of Virginia’s 132 School Divisions Varies Substantially
• Big: The ten largest school divisions account for half thestate’s students.
– Really Big: With over 167,000 students, FairfaxCounty is more than twice as large as the nextbiggest school division.
• Very Small: Fifteen school divisions have fewer than1,000 students.
4
# of Students# of School Divisions
Percent of Students
1-999 15 1
1,000-4,999 74 17
5,000-9,999 21 12
10,000-24,999 16 20
25,000-49,999 5 14
50,000 or more 5 36
136* 100%
Data as of FY 2011 projected Average Daily Membership.*Four sets of school divisions are jointly operated: Bedford City/County, Emporia/Greensville, Williamsburg-James City County, and Fairfax City/County.

SENATE FINANCE COMMITTEE
How Do Virginia Students Perform Nationally and Internationally?
• Although Virginia compares favorably to other states interms of Advanced Placement, SAT, and national scienceand reading tests, international comparisons may be morerelevant today but are often more problematic.
• The Commission on Youth is currently undertaking atwo-year study of academic achievement in Virginiacompared with leading industrialized nations.
5
Percent of Class of 2009 at the Advanced Level in Math By State and Countries with Higher and Similar Percentages of All
Students at the Advanced Level
State Rank Percent
Advanced
# of Countries
Significantly Higher*
Countries with Similar Percentages
1. Mass. 11.4 14 Austria, Germany, Denmark, France, Iceland, Slovenia
6. Virginia 7.9 22UK, Hungary, Ireland, Lithuania, Luxembourg, Norway, Poland, Slovakia
U.S. Average 6.0 30 Russia
50. Miss. 1.3 42 Turkey
From U.S. Math Performance in Global Perspective, Nov. 2010. *56 countries participated in the 2006 Program for International Student Assessment (PISA) in math taken by 15 year olds.

SENATE FINANCE COMMITTEE
Education Funding and Virginia’s Constitution
• Pursuant to the Constitution of Virginia, publiceducation is a shared responsibility of the state andlocalities.
– Article VIII, Sections 1 and 2:
The General Assembly has responsibility toprovide a system of free public schools for allchildren and to ensure that an educationalprogram of high quality is established andcontinually maintained.
The State Board of Education must prescribe theStandards of Quality (SOQ) for the schooldivisions, subject to revision only by the GeneralAssembly.
The General Assembly decides what the costsare and how they will be shared between thestate and localities.
6

SENATE FINANCE COMMITTEE
Key Components of the SOQ Funding Framework
1. How many instructional positions are required (byquantified standards)?
– Based on the number of students enrolled and therequired staffing standards (i.e. class size) forteachers and other positions.
On average, class sizes of 24 or 25 throughgrade six.
2. What is the cost of meeting the staffing requirementsand associated costs?
– Since spending in part reflects local decisions, ratherthan simply reimburse spending, the model isintended to recognize reasonable costs based on whatmost school divisions spend (i.e. prevailing costs),with some adjustments.
3. How are costs shared?
– Of the recognized costs, the average state share is 55percent (45 percent required local effort), varyinglocally based on the Composite Index.
– A key exception to this is the distribution of sales taxbased only on school aged population. Not equalizedthrough the Composite Index.
7

SENATE FINANCE COMMITTEE 8
Composite Index of Local Ability-to-Pay
• Each locality’s index is based on their local datapoints relative to the rest of the state, adjusted tomaintain an overall statewide local share of 45percent and capped at a maximum local share of 80percent.
Tax Year 2009 Statewide
Per CapitaWeighted One-Third
Per StudentWeighted
Two-Thirds
True Value of PropertyWeighted 50%
$1.08 trillion
$136,080 $895,824
Adjusted Gross Income (Including Non-Resident)Weighted 40%
$213.1 billion
$26,873 $176,905
Taxable SalesWeighted 10%
$85.8 billion
$10,818 $71,214

SENATE FINANCE COMMITTEE 9
Composite Index
• For 2010-12, the Composite Index ranged from a low of16.92 percent (Lee) local share to a high of ten schooldivisions above the 80 percent local share cap.
Source: Virginia Department of Education
• For 2012-14, the lowest Composite Index increased to18.26 percent (Lee) local share. The local share increasedfor 85 school divisions.– See attached spreadsheet for a complete list of 2012-14
Composite Index, released November 9, 2011.
SENATE FINANCE COMMITTEE
State and Local SharesExample: Fairfax Co. Schools
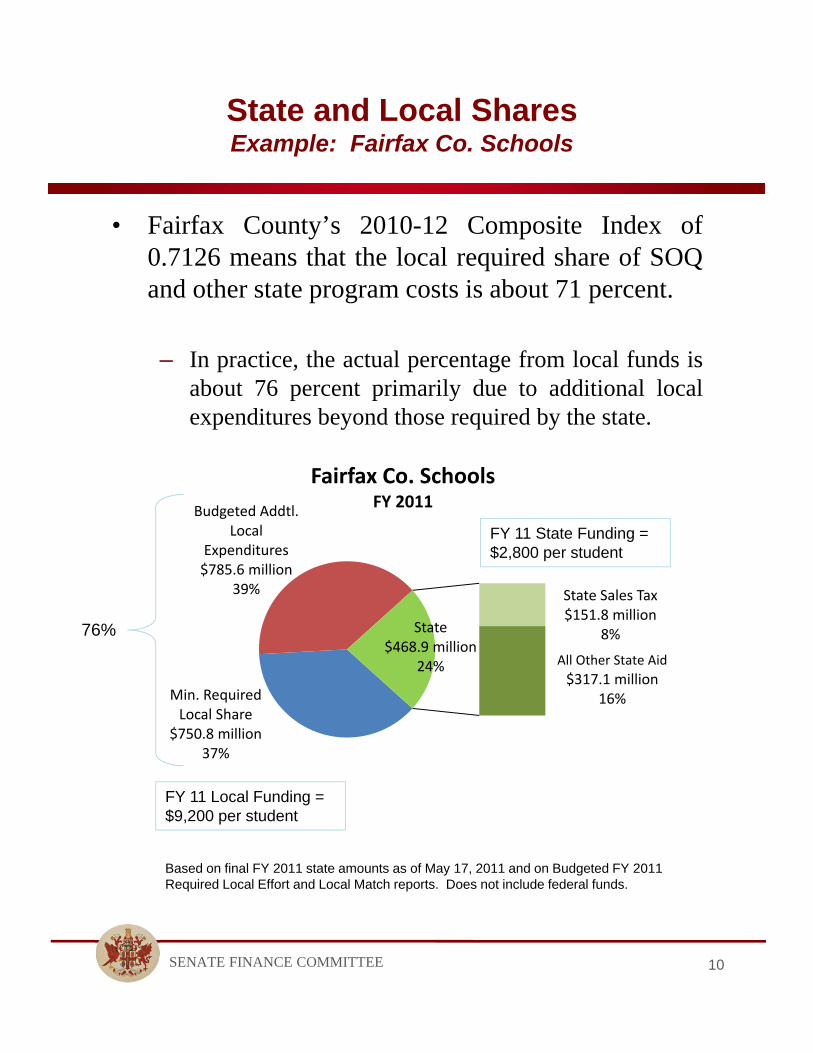
• Fairfax County’s 2010-12 Composite Index of0.7126 means that the local required share of SOQand other state program costs is about 71 percent.
– In practice, the actual percentage from local funds isabout 76 percent primarily due to additional localexpenditures beyond those required by the state.
10
76%
FY 11 State Funding = $2,800 per student
FY 11 Local Funding = $9,200 per student
Min. Required Local Share
$750.8 million 37%
Budgeted Addtl. Local
Expenditures$785.6 million
39% State Sales Tax$151.8 million
8%
All Other State Aid
$317.1 million 16%
State$468.9 million
24%
Fairfax Co. SchoolsFY 2011
Based on final FY 2011 state amounts as of May 17, 2011 and on Budgeted FY 2011 Required Local Effort and Local Match reports. Does not include federal funds.

SENATE FINANCE COMMITTEE
State and Local SharesExample: Chesterfield Schools
• In comparison, with a 2010-12 Composite Index of0.3551, Chesterfield’s local required share is about36 percent.
– In practice the actual percentage is about 40 percentprimarily due to additional local expenditures.
– Chesterfield’s FY 2011 budgeted local expenditureswere about 50 percent above those required by thestate, compared to over 100 percent for Fairfax.
11
40%
FY 11 State Funding = $4,500 per student
FY 11 Local Funding = $2,900 per student
Min. Required Local Share
$112.1 million26%
Budgeted Addtl. Local Expenditures
$58.8 million14% State Sales Tax
$48.3 million11%
All Other State Aid$212.9 million
49%
State$261.2 million
60%
Chesterfield Co. SchoolsFY 2011
Based on final FY 2011 state amounts as of May 17, 2011 and on Budgeted FY 2011 Required Local Effort and Local Match reports. Does not include federal funds.

SENATE FINANCE COMMITTEE 12
Direct Aid to Public Education
• SOQ funding accounts for about 90 percent of stateDirect Aid programs.– As more programs have been funded with Lottery
Proceeds, the distinctions between the categories hasbecome less meaningful.
State Direct Aid to Public Education*FY 2012
($ in millions)
SOQBasic Aid, Sales Tax, Textbooks, CTE/Gifted/Special Ed/ Intervention, VRS/Social Security/Group Life
$4,902.1
IncentiveFY 12 Supplemental Support, Governor’s Schools, Composite Index Hold Harmless, Performance Pay Pilot, Special Ed, and Mentoring
$121.4
CategoricalSpecial Ed, Adult Ed, School Lunch, Virtual Virginia $54.1
Lottery ProceedsSOQ Textbooks, ESL, and Remedial Summer School; Regional Special and Alt. Ed, K-3 Class Size, Preschool, At-Risk, Algebra Readiness, Early Intervention Reading, Project Graduation, CTE Equipment, School Breakfast
$435.9
SupplementalNational Board Certification Bonuses, Teaching Scholarships, Project Discovery, Jobs for Virginia Graduates, CTE Resource Center, GRASP, Regional Consortia $7.6
*Includes $435.9 million in Lottery Proceeds and $130.1 million from the Literary Fund. $5,521.0

SENATE FINANCE COMMITTEE
State GF Direct Aid is Below FY 2007 Levels
• Due to cutbacks since the 2008 Session, FY 2012 GF DirectAid appropriations are below FY 2007 levels.
– On a per pupil basis, state GF Direct Aid for FY 2012 is$4,069, below the FY 2007 amount of $4,408 per pupil.
• Even with the reductions, over the last ten years – a time period thatincluded high rebenchmarking costs and policy changes to the SOQ(2004) -- in constant dollars state aid per pupil increased by anaverage of about one percent per year.
13
Note: For comparison purposes, figures in this chart do not include any Lottery Proceeds, which were budgeted as GF prior to FY 2009.
$4,000
$4,500
$5,000
$5,500
$6,000
$6,500
FY 2006 FY 2007 FY 2008 FY 2009 FY 2010 FY 2011 FY 2012
$ in Millions
$4.8B (2010 Session)
$4.95B
$5.9B (2008 Session)
$4.6B
$5.2B
$5.3B
$5.7B
State GF Direct Aid to Education

SENATE FINANCE COMMITTEE
Recent Funding Actions
• Since the 2008 Session, a number of substantivechanges in state funding policy have been enacted.
14
Key State Funding Policy Changes Since 2008 Session
Biennial $ in millions
Cap funding for support positions 2009 ($754)
Eliminate school construction grants 2009 (55)
Adjust health care for participation rates 2010 (269)
Eliminate certain school expenditures from SOQ calculation (certain equipment, travel, misc.)
2010 (244)
Include $0 values in Linear Weighted Average calculation
2010 (79)
Eliminate Lottery support for school construction and operating costs
2010 (67)
Reduce K-3 class size program 2010 (36)
Update federal deduct percentage 2010 (34)
Extend the school bus replacement cycle from 12 to 15 years
2010 (19)
Eliminate enrollment loss assistance 2010 (16)

SENATE FINANCE COMMITTEE
Local School DivisionBudget Reduction Strategies
• School divisions make different budget decisionsdepending on their local circumstances, but most arestill increasing class sizes and deferring maintenanceneeds.– As of September, some school divisions reported
anticipating providing either a bonus or increase whilenearly all froze or reduced salaries the last two years.
15
Actions Implementing# of School Divisions
(79 responses out of 132)
Increase class sizes At least 72 (out of 79)
Delay textbooks and/or equipment replacements and maintenance
At least 66
Layoff/reduction in force At least 51
Reduction/elimination of electives At least 50
Freeze salaries At least 35
Early retirement incentives At least 14
Reduce pay At least 2
From Sept. 2011 survey by the Virginia Association of School Superintendents.

SENATE FINANCE COMMITTEE
Percent of Funds Spent “In the Classroom”
• Statewide, school divisions’ expenditures in the“instruction” category of disbursements, as defined byVirginia, increased from 64.8 percent in FY 2008 to66.2 percent in FY 2010.
– 38 school divisions were below 65.0 percent, with a fewlower than 50 percent (Orange, Giles, Pittsylvania, andGrayson).
– Excluding Facilities and Debt Service, only three schooldivisions are below 65 percent (Cumberland, Charlotte,Surry).
• Using somewhat different definitions, according to aU.S. Census Bureau report, 60.3 percent of 2008-09spending in Virginia was for instruction, comparedwith 60.2 percent nationwide.
16

SENATE FINANCE COMMITTEE
2012-14 Biennial Re-benchmarking
• Re-benchmarking is the formula-driven costadjustment to meet the SOQ minimum staffingrequirements and related support services andupdates to Incentive, Categorical, and LotteryFunded programs.
• The partial estimate (not including retirement andother costs) for 2012-14, as of July, was $319million.
17
($ in millions)Direct
AidIncrease
Over BaseIncrease Over
Prior Year
FY 2012Base Budget* $5,521
FY 2013 $5,667 $146 2.6%
FY 2014 $5,694 $173 0.5%
Biennial $319
*Includes $435.9 million in Lottery Proceeds and $130.1 million from the Literary Fund.

SENATE FINANCE COMMITTEE
Re-benchmarking: Key Cost Factors
• Although school spending grew less than one percentfrom FY 2008 to FY 2010, the following factorscontributed to the net increase for the 2012-14biennium:– Projected enrollment growth of less than one percent/yr.,
– An increase in instructional salaries of about 2.7 percent(over the two year period),
– Funding inflation averaging 4 percent up to thebeginning of the biennium,
– Restoring textbooks to full funding,
– An increase in health care costs of 12 percent, and
– A 4.9 percentage point increase (to 32.0 percent) in freelunch eligibility.
• The $319 million figure does not yet reflect updatesfor:– Composite Index, assumed savings in at-risk preschool
and projected Sales Tax growth (distributed based onWeldon Cooper Center’s estimate of school age populationrather than a triennial census). These bring the revised total to about $400 million.
– Lottery and revised enrollment projections.
– Retirement and other benefits rates.
18

SENATE FINANCE COMMITTEE
Re-benchmarking: Summary of July 2011 Partial Estimate
Summary of Steps 1-25 ($ in millions)
FY 2013 FY 2014 Total
Calculate Full PreK Slots $22.1 $22.1 $44.3
Remove FY 12 One-Times (107.3) (107.3) (214.3)
Savings (CTE, Special Ed, Pupil Transp., Support Cap) (54.5) (55.0) (109.5)
Instructional Salaries 72.9 73.0 145.9
Base-Year Expenditures 67.7 67.3 135.0
Federal Revenue Deduct* (35.1) (35.1) (70.2)
Inflation 54.3 54.5 108.8
Lottery-Funded Programs 39.3 47.2 86.5
Textbooks 33.4 33.5 66.8
Health Care Premiums 25.2 25.0 50.2
SOL Results and Free Lunch 14.6 14.7 29.3
Enrollment Projections (0.4) 13.3 12.9
Other Increases (Supts, Boards, Nurses, ESL, Gifted, Technology, Summer School)
13.5 19.5 33.0
TOTAL $145.6 $173.1 $318.7
*Reflects deducting Special Education and Title I ARRA dollars, but not the State Fiscal Stabilization Funds that substituted for GF (replacing the FY 2010 support cap reduction).
19

SENATE FINANCE COMMITTEE
Re-benchmarking:School Expenditures
• Total school division operating expenditures (from allrevenue sources) increased less than one percent fromFY 2008 to FY 2010, which actually represented adecrease on a per pupil basis from $11,037 to $11,020.
• In FY 2010 federal stimulus dollars cushioned theimpact of state and local reductions.
– In the 2010-12 biennium, the remainder of the stimulusdollars plus one-time federal Education Jobs Funddollars and local savings from VRS actions providedadditional temporary relief.
20
($ in millions) FY 2008 FY 2010 Change
Local $6,591.3 $6,547.8 ($43.5)
State 4,607.5 4,236.0 (371.5)
State Sales Tax 1,150.7 1,074.6 (76.1)
Federal 857.3 1,445.8 588.5
Total $13,206.8 $13,304.3 $97.5

SENATE FINANCE COMMITTEE
Re-benchmarking: Retirement Rates
• In October, the VRS Board approved a total employerteacher contribution rate of 16.77 percent for 2012-14, upfrom the 6.33 percent funded in the FY 2012 budget.
– Additional state cost: Up to $580 million.
– Additional local costs: Over $1 billion due to the localshare and locally-funded positions.
– Includes 1.43 percent for the ten-year payback of thecontributions deferred in FY 2011 and 2012.
– See Budget Outlook presentation for additionaldiscussion of the rates.
• In addition, the certified Group Life rate of 1.32 percent andRetiree Health Care Credit rate of 1.17 percent would addestimated state costs of over $90 million.
• Although schools were aided in 2010-12 by federal stimulusand artificially low VRS rates, restoring the full retirementrates, in the absence of other state or local restorations, willrepresent a budgetary shock.
21
SENATE FINANCE COMMITTEE22
Education Policy Questions for the 2012 Session and Beyond
• As Virginia strives to ensure all students graduatefrom high school either college- or career-ready,various approaches and priorities will likelycompete for the attention of the 2012 GeneralAssembly.
– Percentage of school expenditures within certainbudget categories (i.e. 65 percent “in the classroom”);
– Flexibility or suspension of certain mandates;
– An alternative federal accountability model to qualifyVirginia for a waiver from No Child Left Behind,including support for the lowest performing schoolsand divisions;
– Teacher recruitment and retention, evaluation andperformance pay;
– Early childhood education and third grade reading;
– Science, Technology, Engineering, and Math(STEM); and
– Online learning and virtual schools.

SENATE FINANCE COMMITTEE 23
Online Learning
• Technology is changing the way we live, work, play,and learn.
– K-12 online learning is growing rapidly andevolving in many different directions.
• Some claim that the traditional model of educationwill ultimately be transformed by the “disruptiveinnovation” of computer-based learning.
• Virtual education is not new to Virginia, which hasbeen involved in distance learning via VirtualVirginia online courses and local programs for sometime, but has moved into new territory with theapproval this summer of several multidivision onlineproviders.
– The magnitude of the impact on state and localeducation budgets, and ultimately “who pays,” isas yet undetermined.

SENATE FINANCE COMMITTEE 24
Supplemental Courses to Full-Time School and In Between
• Online learning has many different dimensions andmeets varying educational needs, including creditrecovery, medically fragile, accelerated, rural,athletic, and home-school students.
Source: Keeping Pace with K-12 Online Learning, 2009, www.kpk12.com

SENATE FINANCE COMMITTEE 25
Emerging Issues in Online Learning
• Several issues could require significant changes in policyand practice going forward.
• Blended learning (also called hybrid) combines online orcomputer-based instruction and brick and mortarteaching and learning in various ways.
– Could be a way to extend the school day or school year(i.e. teachers on early/late shifts while students spend atleast part of the day in labs).
– Can allow more personalized instruction.
– Example from Higher Ed: Virginia Tech’s MathEmporium. Lectures are replaced by a 24/7 learningresource center with 550 computers serving more than8,000 students in 11 courses.
• Competency based learning may be available in ways notpreviously possible.
– Could prompt a further shift from a “seat time” approach.

SENATE FINANCE COMMITTEE 26
Multidivision Online Providers
• Chapter 817 (2010) created a framework formultidivision providers of online courses andvirtual school programs in Virginia.
– Because of funding questions, Carroll Countywas “grandfathered” as the only division tooperate in 2010-11, as the DOE approvalprocess proceeded.
• The ability through technology to enroll a student ina school division far from the students’ residenceraises questions simply not contemplated by statefunding formulas.
• The 2011 Senate budget clarified that SOQ fundingwould be based on the student’s place of residence,pending study by the joint subcommittee on schoolfunding. However, in the Reconvened Session, thelanguage was removed, thus leaving the issueunresolved.
SENATE FINANCE COMMITTEE
Students from 70 Localities Enrolled in Carroll’s Fully Online K-8 Program
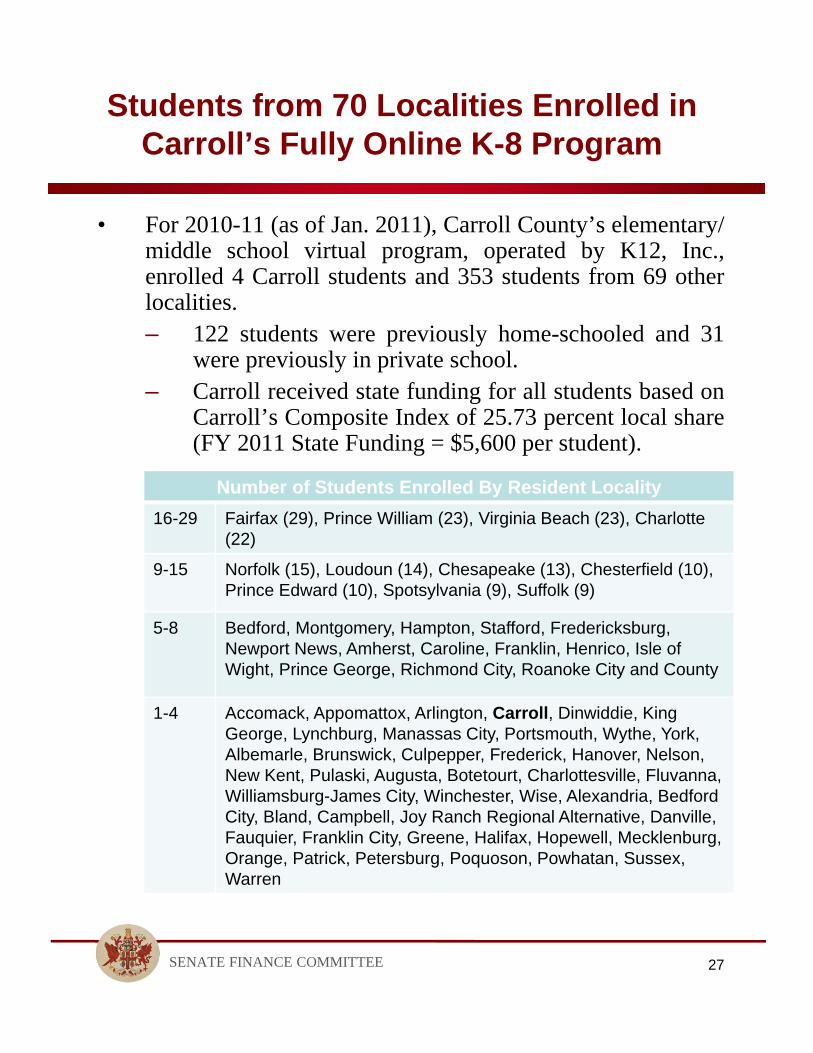
• For 2010-11 (as of Jan. 2011), Carroll County’s elementary/middle school virtual program, operated by K12, Inc.,enrolled 4 Carroll students and 353 students from 69 otherlocalities.– 122 students were previously home-schooled and 31
were previously in private school.– Carroll received state funding for all students based on
Carroll’s Composite Index of 25.73 percent local share(FY 2011 State Funding = $5,600 per student).
27
Number of Students Enrolled By Resident Locality
16-29 Fairfax (29), Prince William (23), Virginia Beach (23), Charlotte (22)
9-15 Norfolk (15), Loudoun (14), Chesapeake (13), Chesterfield (10), Prince Edward (10), Spotsylvania (9), Suffolk (9)
5-8 Bedford, Montgomery, Hampton, Stafford, Fredericksburg, Newport News, Amherst, Caroline, Franklin, Henrico, Isle of Wight, Prince George, Richmond City, Roanoke City and County
1-4 Accomack, Appomattox, Arlington, Carroll, Dinwiddie, King George, Lynchburg, Manassas City, Portsmouth, Wythe, York, Albemarle, Brunswick, Culpepper, Frederick, Hanover, Nelson, New Kent, Pulaski, Augusta, Botetourt, Charlottesville, Fluvanna, Williamsburg-James City, Winchester, Wise, Alexandria, Bedford City, Bland, Campbell, Joy Ranch Regional Alternative, Danville, Fauquier, Franklin City, Greene, Halifax, Hopewell, Mecklenburg, Orange, Patrick, Petersburg, Poquoson, Powhatan, Sussex, Warren
SENATE FINANCE COMMITTEE 28
Eight Providers Now Have Agreements With 30 School Divisions
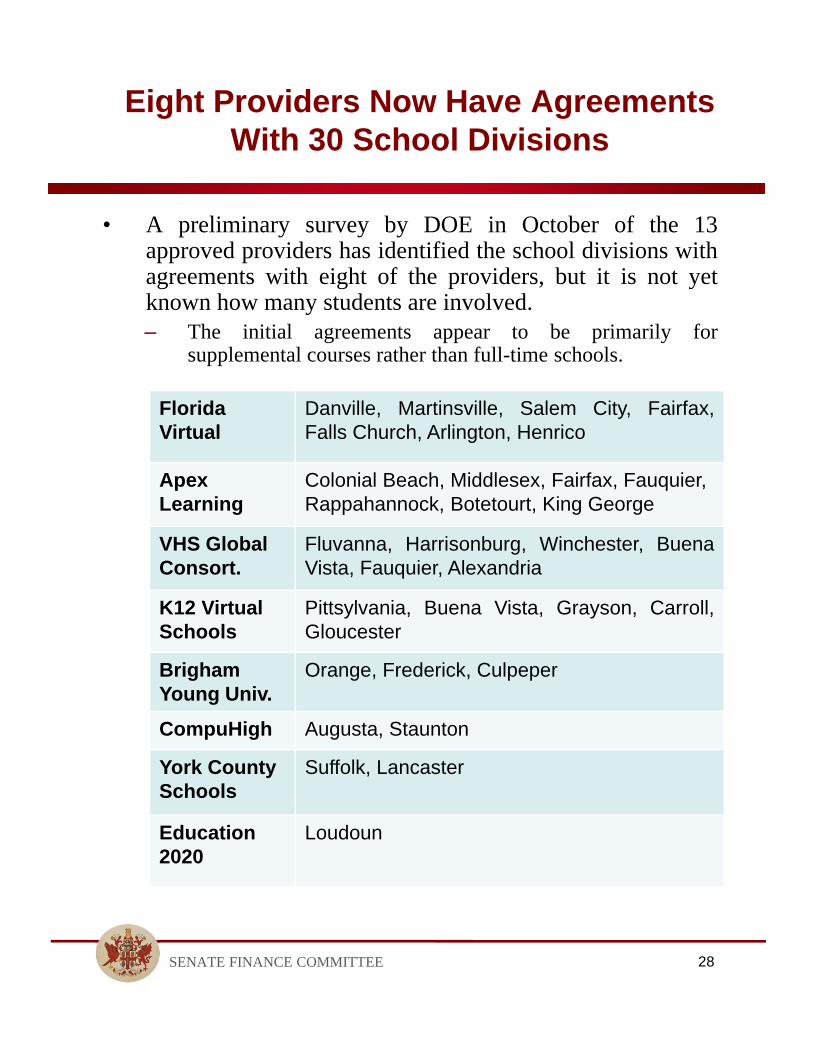
• A preliminary survey by DOE in October of the 13approved providers has identified the school divisions withagreements with eight of the providers, but it is not yetknown how many students are involved.– The initial agreements appear to be primarily for
supplemental courses rather than full-time schools.
Florida Virtual
Danville, Martinsville, Salem City, Fairfax,Falls Church, Arlington, Henrico
Apex Learning
Colonial Beach, Middlesex, Fairfax, Fauquier, Rappahannock, Botetourt, King George
VHS Global Consort.
Fluvanna, Harrisonburg, Winchester, BuenaVista, Fauquier, Alexandria
K12 Virtual Schools
Pittsylvania, Buena Vista, Grayson, Carroll,Gloucester
Brigham Young Univ.
Orange, Frederick, Culpeper
CompuHigh Augusta, Staunton
York County Schools
Suffolk, Lancaster
Education 2020
Loudoun

SENATE FINANCE COMMITTEE 29
What is the Growth Potential for Full-Time Virtual School Enrollment?
• Anecdotal evidence suggests that growth in full-timeonline learning in Virginia is in effect limited by the issueof required local effort.– For example, for 2011-12 the Carroll County School Board
has capped their program at 350 students.
• Based on other states with enrollments ranging from 5,000to 30,000 students, with sufficient funding the growthpotential of full-time online school enrollment could besignificant.

SENATE FINANCE COMMITTEE 30
Costs of Virtual Schooling
• According to the International Association for K-12Online Learning (iNACOL):
– It is a myth that online learning is cheap. Ratherquality online learning is cost-effective.
– Independent national studies suggest virtual schoolsfunding should be about the same as operational costsfor bricks-and-mortar schools.
– Costs for full-time virtual schools ranged from $7,200 -$8,300 per pupil after initial start-up costs(Augenblick, Palaich and Associates), which is asavings compared to $10,000 per pupil nationalaverage for K-12 education.
– Average funding for virtual charter schools in U.S. is$6,500 per pupil (2010).

SENATE FINANCE COMMITTEE
What are Some Possible Funding Models for Virtual Schools?
• Some possible funding models include:– State funding based on the Composite Index of the
school division where the student lives (regionalGovernor’s Schools).
– A fixed number of state funded student slots (regionalalternative education).
– A fixed per pupil funded cost of $6,000 (at-riskpreschool).
– Statewide average per pupil state funding, and localitywhere the student lives required to send local funds(Nov. 16, 2011 Thomas Jefferson Institute report).
• Examples of approaches in other states:– Massachusetts - caps total enrollment at 500.
– Indiana - requires 75 percent of students to have beenenrolled in public school in the prior year; funded at 80percent of the state average.
– Nevada - funding follows the student.
– Pennsylvania - funding is based on student’s residentdistrict, charters invoice the home district directly.
– South Carolina - same formula as for all charterschools.
31

SENATE FINANCE COMMITTEE32
Online Learning and Virtual SchoolsConclusions
• The immediate challenge for the state is how tobalance a desire to expand quality online learning,given the ongoing state and local budgetarychallenges and other priorities.
• One possibility for incremental expansion is toincrease support for the state’s Virtual Virginiaprogram to offer more courses and sections.
• Given the potential demand, the state will continue tobe pressed to address funding questions regardingfull-time programs:
– What per pupil amount should be recognized for virtualschooling, given the differences?
– How should state and required local shares bedetermined? Should local dollars follow the studentwhere they choose to enroll?
– Would a statewide program be a better model forfunding and accountability?
• In addition, the General Assembly may wish to beginconsidering how to address issues such as blendedand competency-based learning.

SENATE FINANCE COMMITTEE33
Summary
• Educating 1.2 million students annually is a key functionand budget driver for the state and local governments inVirginia as we strive to prepare a workforce to succeed inthe global marketplace.
• The 132 school divisions vary in many ways, including sizeand local ability-to-pay.
• Through FY 2012, state reductions have been substantiallymitigated by federal stimulus dollars and local savings fromthe deferred retirement contributions.
– Now the flip side is that returning to more typicalretirement contribution rates brings additional localcosts of about two times the additional state costs.
• Including updates for Composite Index and Sales Tax, thestate cost of re-benchmarking is running about $400 millionfor FY 2013 and FY 2014, not yet including retirementrates or other final updates.
• Online learning is one of many education policy issuescurrently being discussed. It has the potential to transformmany aspects of schooling, but raises some questions notpreviously contemplated by state funding formulas.

Attachment A to Superintendent's Memo #306-11
TRUE VALUE OF PROPERTY
VIRGINIA ADJUSTED GROSS INCOME (Including Nonresident AGI)
VIRGINIA ADJUSTED GROSS INCOME (Excluding Nonresident AGI*)
TAXABLE RETAIL SALES
MARCH 31, 2010 ADM
TOTAL POPULATION
001 ACCOMACK $4,451,393,611 $535,509,744 N/A $271,079,648 4,855 33,548 .3719 N/A .3719002 ALBEMARLE $18,722,429,089 $3,178,963,481 N/A $1,108,475,225 12,624 97,694 .6502 N/A .6502003 ALLEGHANY $1,193,877,227 $269,993,000 N/A $63,621,550 2,769 16,505 .2297 N/A .2297004 AMELIA $1,471,101,455 $228,781,960 N/A $52,631,040 1,792 12,575 .3473 N/A .3473005 AMHERST $2,940,532,414 $525,117,321 N/A $225,671,259 4,444 32,645 .3075 N/A .3075006 APPOMATTOX $1,390,121,858 $247,934,156 N/A $77,312,061 2,194 14,726 .2945 N/A .2945007 ARLINGTON $60,313,707,986 $10,381,698,517 N/A $2,959,336,528 19,267 195,668 .8000 N/A .8000008 AUGUSTA $8,697,115,964 $1,440,303,585 N/A $394,755,753 10,515 74,102 .3627 N/A .3627009 BATH $2,554,342,263 $91,376,356 N/A $59,861,255 672 4,863 .8000 N/A .8000010 BEDFORD COUNTY $9,799,015,089 $1,534,183,181 N/A $335,456,497 9,728 68,003 .4268 N/A .4268011 BLAND $715,482,876 $98,373,937 N/A $15,489,051 921 6,819 .3029 N/A .3029012 BOTETOURT $3,873,486,982 $766,184,164 N/A $166,563,450 4,978 33,374 .3710 N/A .3710013 BRUNSWICK $1,555,159,665 $211,170,894 N/A $53,669,629 2,057 18,340 .2837 N/A .2837014 BUCHANAN $2,738,821,286 $333,508,188 N/A $127,560,716 3,259 24,384 .3263 N/A .3263015 BUCKINGHAM $1,521,850,858 $208,360,136 N/A $106,085,130 1,953 17,153 .3104 N/A .3104016 CAMPBELL $4,171,727,992 $918,220,201 N/A $370,419,571 8,353 54,929 .2655 N/A .2655017 CAROLINE $2,876,250,243 $565,699,218 N/A $110,948,698 4,078 28,070 .3306 N/A .3306018 CARROLL $2,863,037,039 $372,833,027 N/A $132,878,892 3,972 30,646 .2831 N/A .2831019 CHARLES CITY $976,467,743 $143,623,749 N/A $20,564,186 827 7,265 .4483 N/A .4483020 CHARLOTTE $1,092,616,972 $169,179,451 N/A $44,121,579 2,062 12,528 .2365 N/A .2365021 CHESTERFIELD $34,170,453,428 $8,384,040,920 N/A $3,345,047,845 58,665 311,560 .3539 N/A .3539022 CLARKE $2,264,920,530 $422,765,870 N/A $71,433,980 2,141 13,977 .4892 N/A .4892023 CRAIG $541,562,085 $83,653,660 N/A $12,886,883 700 5,133 .3163 N/A .3163024 CULPEPER $5,281,074,170 $1,014,489,930 N/A $480,170,802 7,416 45,825 .3668 N/A .3668025 CUMBERLAND $1,069,699,525 $136,107,935 N/A $29,821,670 1,393 10,029 .2971 N/A .2971026 DICKENSON $1,517,983,403 $198,111,502 N/A $64,054,958 2,455 16,012 .2547 N/A .2547027 DINWIDDIE $2,889,082,395 $489,339,910 N/A $95,609,217 4,679 27,610 .2850 N/A .2850028 ESSEX $1,602,160,518 $198,756,646 N/A $164,186,905 1,604 10,947 .4364 N/A .4364029 FAIRFAX COUNTY $218,889,435,802 $47,640,758,200 N/A $12,932,168,326 165,367 1,070,053 .6789 N/A .6789030 FAUQUIER $11,942,754,221 $2,306,956,870 N/A $587,631,303 11,111 64,497 .5377 N/A .5377031 FLOYD $1,836,002,655 $238,559,214 N/A $59,345,578 2,084 15,232 .3440 N/A .3440032 FLUVANNA $3,451,515,106 $531,321,109 N/A $90,658,684 3,678 25,328 .3924 N/A .3924033 FRANKLIN COUNTY $7,957,254,842 $931,336,456 N/A $340,399,968 7,200 55,357 .4181 N/A .4181034 FREDERICK $8,239,674,671 $1,880,092,732 N/A $813,226,140 12,958 76,587 .3601 N/A .3601035 GILES $1,341,666,055 $275,469,326 N/A $124,648,378 2,547 17,280 .2706 N/A .2706036 GLOUCESTER $4,635,615,530 $814,446,887 N/A $333,790,286 5,919 36,776 .3798 N/A .3798037 GOOCHLAND $5,273,258,201 $1,048,774,887 N/A $194,700,272 2,454 21,261 .8000 N/A .8000038 GRAYSON $1,915,208,078 $198,634,460 $190,702,662 $35,319,877 1,929 15,779 .3420 .3385 .3385039 GREENE $2,343,267,306 $359,663,639 N/A $105,375,993 2,743 18,049 .3724 N/A .3724040 GREENSVILLE $746,838,875 $190,573,081 $146,409,903 $35,419,647 1,559 12,402 .2442 .2174 .2174041 HALIFAX $3,793,992,927 $517,691,742 N/A $270,520,889 5,647 36,448 .2943 N/A .2943042 HANOVER $13,548,365,625 $2,839,509,086 N/A $1,438,740,565 18,433 98,873 .4203 N/A .4203043 HENRICO $35,833,063,765 $8,292,268,311 N/A $4,632,418,985 48,332 304,622 .4276 N/A .4276044 HENRY $3,356,872,357 $749,213,920 N/A $343,985,994 7,142 54,919 .2430 N/A .2430045 HIGHLAND $812,256,710 $37,733,245 N/A $7,978,254 244 2,389 .8000 N/A .8000046 ISLE OF WIGHT $5,011,976,295 $877,326,673 N/A $200,079,929 5,379 34,845 .4258 N/A .4258047 JAMES CITY $11,704,349,566 $2,002,634,441 N/A $787,049,384 9,657 64,997 .5628 N/A .5628048 KING GEORGE $3,048,840,616 $611,890,026 N/A $108,703,459 4,029 23,234 .3787 N/A .3787049 KING AND QUEEN $912,792,994 $125,931,366 N/A $10,935,587 729 7,027 .4469 N/A .4469050 KING WILLIAM $1,477,048,296 $280,287,821 N/A $60,825,620 2,145 12,536 .3375 N/A .3375051 LANCASTER $3,066,525,255 $262,669,013 N/A $156,915,351 1,315 11,487 .7934 N/A .7934052 LEE $1,138,598,241 $283,189,934 $273,717,828 $122,851,363 3,374 25,501 .1849 .1826 .1826053 LOUDOUN $60,025,322,925 $12,996,829,711 N/A $4,113,301,056 59,261 309,640 .5666 N/A .5666
Final 2012-2014
Composite Index
2012-2014 COMPOSITE INDEX OF LOCAL ABILITY-TO-PAY - Updated November 2011
INDICATORS OF ABILITY-TO-PAY (BASE YEAR: 2009)2012-2014 Composite
Index Calculated Excluding Nonresident
AGI*
2012-2014 Composite Index Calculated
Including Nonresident AGI
Div. Num.
Division

Attachment A to Superintendent's Memo #306-11
TRUE VALUE OF PROPERTY
VIRGINIA ADJUSTED GROSS INCOME (Including Nonresident AGI)
VIRGINIA ADJUSTED GROSS INCOME (Excluding Nonresident AGI*)
TAXABLE RETAIL SALES
MARCH 31, 2010 ADM
TOTAL POPULATION
Final 2012-2014
Composite Index
2012-2014 COMPOSITE INDEX OF LOCAL ABILITY-TO-PAY - Updated November 2011
INDICATORS OF ABILITY-TO-PAY (BASE YEAR: 2009)2012-2014 Composite
Index Calculated Excluding Nonresident
AGI*
2012-2014 Composite Index Calculated
Including Nonresident AGI
Div. Num.
Division
054 LOUISA $7,378,492,832 $665,566,237 N/A $172,685,317 4,533 32,599 .5659 N/A .5659055 LUNENBURG $966,577,224 $157,484,480 N/A $36,919,723 1,565 13,021 .2535 N/A .2535056 MADISON $2,065,582,569 $271,463,594 N/A $71,755,844 1,810 13,264 .4486 N/A .4486057 MATHEWS $1,936,040,362 $200,403,944 N/A $37,936,707 1,239 8,974 .5589 N/A .5589058 MECKLENBURG $4,245,951,586 $477,336,257 $461,110,584 $298,261,310 4,620 32,697 .3680 .3650 .3650059 MIDDLESEX $2,665,733,193 $226,564,895 N/A $78,146,239 1,191 10,867 .7232 N/A .7232060 MONTGOMERY $7,571,036,490 $1,828,461,254 N/A $897,455,302 9,495 93,714 .4053 N/A .4053062 NELSON $3,296,671,052 $302,922,511 N/A $78,531,849 1,885 15,013 .5928 N/A .5928063 NEW KENT $2,612,081,661 $495,356,331 N/A $96,749,625 2,786 17,971 .4414 N/A .4414065 NORTHAMPTON $2,438,752,588 $214,924,855 N/A $107,848,718 1,697 12,580 .5103 N/A .5103066 NORTHUMBERLAND $3,720,688,654 $260,841,950 N/A $61,993,865 1,373 12,342 .8000 N/A .8000067 NOTTOWAY $1,020,120,983 $226,315,885 $217,967,050 $110,611,764 2,174 15,779 .2480 .2447 .2447068 ORANGE $4,159,528,827 $762,194,193 N/A $189,399,791 5,058 33,138 .3842 N/A .3842069 PAGE $2,519,461,772 $373,571,393 N/A $153,255,687 3,476 24,004 .3143 N/A .3143070 PATRICK $1,868,573,620 $230,675,685 $222,990,292 $79,025,076 2,501 18,770 .2892 .2866 .2866071 PITTSYLVANIA $4,630,668,758 $992,581,688 N/A $157,896,368 8,961 63,644 .2475 N/A .2475072 POWHATAN $3,768,071,226 $714,500,138 N/A $259,048,779 4,424 27,567 .4230 N/A .4230073 PRINCE EDWARD $1,684,745,928 $285,230,086 N/A $280,851,800 2,459 23,004 .3265 N/A .3265074 PRINCE GEORGE $3,006,322,600 $632,869,943 N/A $134,668,790 6,171 35,813 .2513 N/A .2513075 PRINCE WILLIAM $47,023,200,683 $11,672,434,334 N/A $4,109,331,787 75,026 397,383 .3787 N/A .3787077 PULASKI $2,936,267,440 $535,032,497 N/A $291,214,848 4,571 35,181 .3052 N/A .3052078 RAPPAHANNOCK $2,288,501,916 $218,259,276 N/A $31,680,550 928 7,349 .8000 N/A .8000079 RICHMOND COUNTY $1,091,482,700 $176,117,908 $146,301,215 $56,072,123 1,213 9,365 .3831 .3599 .3599080 ROANOKE COUNTY $9,062,997,920 $2,355,442,647 N/A $890,021,337 14,474 92,253 .3657 N/A .3657081 ROCKBRIDGE $3,254,944,382 $387,933,057 N/A $217,744,946 2,510 22,498 .4903 N/A .4903082 ROCKINGHAM $9,390,464,650 $1,536,569,388 N/A $421,254,549 11,348 75,656 .3675 N/A .3675083 RUSSELL $2,015,005,479 $396,484,086 N/A $157,889,960 4,046 28,883 .2430 N/A .2430084 SCOTT $1,152,134,993 $322,409,373 $299,350,737 $120,653,864 3,753 23,117 .1890 .1831 .1831085 SHENANDOAH $5,111,900,588 $770,847,634 N/A $313,123,017 6,002 41,834 .3706 N/A .3706086 SMYTH $1,951,418,489 $436,266,742 N/A $187,575,308 4,793 32,367 .2178 N/A .2178087 SOUTHAMPTON $2,090,405,125 $325,204,856 N/A $42,834,335 2,779 18,402 .3171 N/A .3171088 SPOTSYLVANIA $12,451,885,778 $3,139,133,057 N/A $1,347,926,498 23,710 120,234 .3326 N/A .3326089 STAFFORD $14,446,057,649 $3,527,044,546 N/A $879,152,862 26,648 125,435 .3305 N/A .3305090 SURRY $2,358,692,464 $128,139,517 N/A $33,281,244 930 7,074 .7642 N/A .7642091 SUSSEX $1,076,099,417 $150,230,747 N/A $62,290,109 1,209 12,305 .3375 N/A .3375092 TAZEWELL $2,796,301,917 $747,436,763 N/A $532,354,983 6,580 45,255 .2695 N/A .2695093 WARREN $4,327,090,288 $805,069,155 N/A $324,533,521 5,317 37,248 .3890 N/A .3890094 WASHINGTON $5,092,504,649 $1,054,009,850 $991,515,511 $601,650,200 7,243 54,689 .3610 .3533 .3533095 WESTMORELAND $2,165,391,499 $252,912,768 N/A $63,242,133 1,705 13,579 .4649 N/A .4649096 WISE $2,101,201,163 $602,762,392 $579,717,065 $312,327,420 6,499 41,767 .2076 .2045 .2045097 WYTHE $2,937,230,706 $427,972,454 N/A $315,705,752 4,207 29,281 .3204 N/A .3204098 YORK $9,306,338,041 $1,719,821,887 N/A $897,426,613 12,533 64,933 .4049 N/A .4049101 ALEXANDRIA $34,731,703,145 $6,392,001,579 N/A $1,959,188,772 11,422 132,167 .8000 N/A .8000102 BRISTOL $1,162,401,288 $402,847,706 $247,992,426 $339,817,504 2,244 17,919 .3845 .3190 .3190103 BUENA VISTA $395,276,225 $84,557,412 N/A $31,178,785 1,122 6,649 .1895 N/A .1895104 CHARLOTTESVILLE $5,296,972,302 $1,136,668,368 N/A $820,895,379 3,756 43,237 .6861 N/A .6861106 COLONIAL HEIGHTS $1,878,936,038 $349,193,991 N/A $638,768,479 2,826 17,491 .4448 N/A .4448107 COVINGTON $324,378,882 $87,607,228 N/A $107,984,326 839 5,984 .2775 N/A .2775108 DANVILLE $2,439,340,231 $674,257,632 $600,551,929 $701,641,565 6,145 43,596 .2767 .2653 .2653109 FALLS CHURCH $3,377,115,687 $688,911,012 $646,179,358 $218,311,076 2,006 12,054 .8000 .8000 .8000110 FREDERICKSBURG $3,433,734,294 $589,780,829 $567,491,693 $814,014,930 2,793 23,353 .6577 .6511 .6511111 GALAX $459,600,137 $107,137,940 $99,787,621 $181,484,299 1,304 7,101 .2782 .2725 .2725112 HAMPTON $11,991,248,586 $2,273,229,613 N/A $1,192,612,862 20,744 139,233 .2912 N/A .2912

Attachment A to Superintendent's Memo #306-11
TRUE VALUE OF PROPERTY
VIRGINIA ADJUSTED GROSS INCOME (Including Nonresident AGI)
VIRGINIA ADJUSTED GROSS INCOME (Excluding Nonresident AGI*)
TAXABLE RETAIL SALES
MARCH 31, 2010 ADM
TOTAL POPULATION
Final 2012-2014
Composite Index
2012-2014 COMPOSITE INDEX OF LOCAL ABILITY-TO-PAY - Updated November 2011
INDICATORS OF ABILITY-TO-PAY (BASE YEAR: 2009)2012-2014 Composite
Index Calculated Excluding Nonresident
AGI*
2012-2014 Composite Index Calculated
Including Nonresident AGI
Div. Num.
Division
113 HARRISONBURG $3,864,792,097 $543,468,641 N/A $990,965,475 4,351 48,134 .4274 N/A .4274114 HOPEWELL $1,826,056,841 $318,897,646 N/A $161,920,930 3,919 22,331 .2376 N/A .2376115 LYNCHBURG $5,482,322,604 $1,233,981,712 N/A $1,170,583,027 8,196 75,204 .3727 N/A .3727116 MARTINSVILLE $765,932,891 $223,013,122 $204,220,871 $143,922,904 2,324 14,161 .2255 .2175 .2175117 NEWPORT NEWS $15,857,298,612 $3,027,524,100 N/A $1,933,222,912 28,610 181,218 .2934 N/A .2934118 NORFOLK $20,226,618,644 $3,543,226,880 $3,411,240,814 $2,597,753,733 31,176 243,957 .3137 .3102 .3102119 NORTON $247,018,914 $72,102,616 $67,529,301 $168,075,834 824 3,850 .3333 .3274 .3274120 PETERSBURG $2,024,371,748 $423,896,011 N/A $284,647,864 4,248 32,399 .2516 N/A .2516121 PORTSMOUTH $8,296,594,040 $1,494,212,369 $1,443,611,092 $626,320,512 14,225 96,282 .2786 .2755 .2755122 RADFORD $848,154,673 $193,880,549 N/A $68,827,715 1,505 16,064 .2630 N/A .2630123 RICHMOND CITY $21,666,019,298 $4,452,844,838 $4,236,467,749 $2,331,876,957 21,217 198,202 .4864 .4779 .4779124 ROANOKE CITY $7,779,986,317 $1,761,121,575 N/A $1,692,267,903 12,126 97,845 .3728 N/A .3728126 STAUNTON $2,021,564,873 $410,724,718 N/A $328,425,695 2,575 23,612 .3987 N/A .3987127 SUFFOLK $9,788,085,722 $1,824,207,423 N/A $632,874,977 13,801 82,616 .3530 N/A .3530128 VIRGINIA BEACH $57,971,850,185 $10,385,241,185 N/A $4,638,871,814 69,225 437,275 .4110 N/A .4110130 WAYNESBORO $2,049,167,044 $355,696,831 N/A $400,782,416 3,007 20,923 .3690 N/A .3690131 WILLIAMSBURG $1,892,953,323 $313,416,809 $302,223,962 $321,601,815 829 13,758 .8000 .8000 .8000132 WINCHESTER $3,140,250,612 $554,106,552 N/A $663,353,859 3,745 26,072 .4645 N/A .4645134 FAIRFAX CITY $5,450,502,664 $986,325,562 $921,412,262 $824,717,046 2,905 22,683 .8000 .8000 .8000135 FRANKLIN CITY $674,910,269 $143,733,838 $132,099,372 $149,254,304 1,186 8,480 .3367 .3276 .3276136 CHESAPEAKE $26,673,450,787 $4,933,749,242 N/A $2,897,360,063 38,853 219,795 .3678 N/A .3678137 LEXINGTON $598,342,763 $171,398,865 N/A $67,426,969 626 7,007 .5059 N/A .5059138 EMPORIA $402,531,437 $81,086,984 $68,258,342 $124,365,555 998 5,899 .2726 .2594 .2594139 SALEM $2,222,148,328 $543,674,972 N/A $460,591,278 3,914 24,829 .3628 N/A .3628140 BEDFORD CITY $488,879,863 $98,244,908 N/A $76,221,744 828 6,256 .3132 N/A .3132142 POQUOSON $1,678,150,362 $371,654,683 N/A $43,129,623 2,379 12,113 .3816 N/A .3816143 MANASSAS $4,181,575,904 $909,391,011 N/A $437,952,932 6,592 37,414 .3599 N/A .3599144 MANASSAS PARK $903,304,124 $321,026,365 N/A $116,646,726 2,614 13,764 .2600 N/A .2600202 COLONIAL BEACH $493,252,132 $70,795,858 N/A $17,702,867 593 3,801 .3527 N/A .3527207 WEST POINT $402,727,065 $70,566,032 N/A $15,313,625 777 3,156 .2838 N/A .2838
STATE TOTALS $1,078,950,112,391 $213,068,248,249 $85,771,912,427 1,204,422 7,928,779
Data Sources:True Value of Property, Virginia Adjusted Gross Income, and Taxable Retail Sales - Virginia Department of TaxationMarch 31, 2010 Average Daily Membership (ADM) - Virginia Department of EducationTotal Population - Weldon Cooper Center for Public Serivce, UVA; US Census
*For divisions that qualify for the exclusion of nonresident AGI. Pursuant to Item 132, Paragraph A.4.b of Chapter 890, 2011 Acts of Assembly, "any locality whose total calendar year [2009] Virginia Adjusted Gross Income is comprised of at least 3 percent or more by nonresidents of Virginia, such nonresident income shall be excluded in computing the composite index of ability-to-pay."
Downloadable Excel and PDF files containing the 2012-2014 composite index for each school division are available on the Department of Education Web site at: http://www.doe.virginia.gov/school_finance/budget/compositeindex_local_abilitypay/index.shtml