fundamentals in biophotonics week4 - lben | epfl · fundamentals in biophotonics molecules,...
TRANSCRIPT

Fundamentals in Biophotonics
Molecules, Absorption, Emission and Stimulated emission
Aleksandra [email protected]
EPFL – Ecole Polytechnique Federale de LausanneBioengineering Institute IBI
28. 03. 2013

Vibrational States
•A vibrational energy mode can also be excited.•Thermal excitation of a vibrational mode can occur.•It is also possible to stimulate vibrations in molecules with light.
Vibrational motion: a simple harmonic oscillator
Assume that the two atoms are point masses connected by a massless spring with simple harmonic motion.
The simple harmonic oscillator accurately describes a diatomic molecule, as well as more complex molecules.

Vibrational States
• The energy levels are those of a quantum‐mechanical oscillator
12( )vibrE n n is called the vibrational quantum number.
Don’t confuse it for n, the principal quantum number of the electronic state.
Vibrational-transition selection rule:
n = ±1
The only spectral line is !
However, deviations from a perfect parabolic potential allow other transitions, called overtones, but they’re much weaker.

Vibrational frequencies for various bonds
• Different bonds have different vibrational frequencies (which are also affected by other nearby atoms).
Notice that bonds containing Hydrogen vibrate faster because H is lighter.
Wavenumber (cm-1)
← Higher energy (frequency)
Unlike the energy levels of the hydrogen atom and the rotating diatomic molecule, the vibrational energy levels of the diatomic molecule are equally spaced. In practice, however, the potential‐energy curves for most molecules become anharmonic as the energy increases, resulting in a diminution of energy‐level separations as 0 increases. In the course of undergoing a vibrational transition, the molecule may simultaneously alter its rotational state, so that both 0 and t change; this is characterized by a vibrational‐rotational spectrum.

Water vibrations‐vibrating triatomic molecules
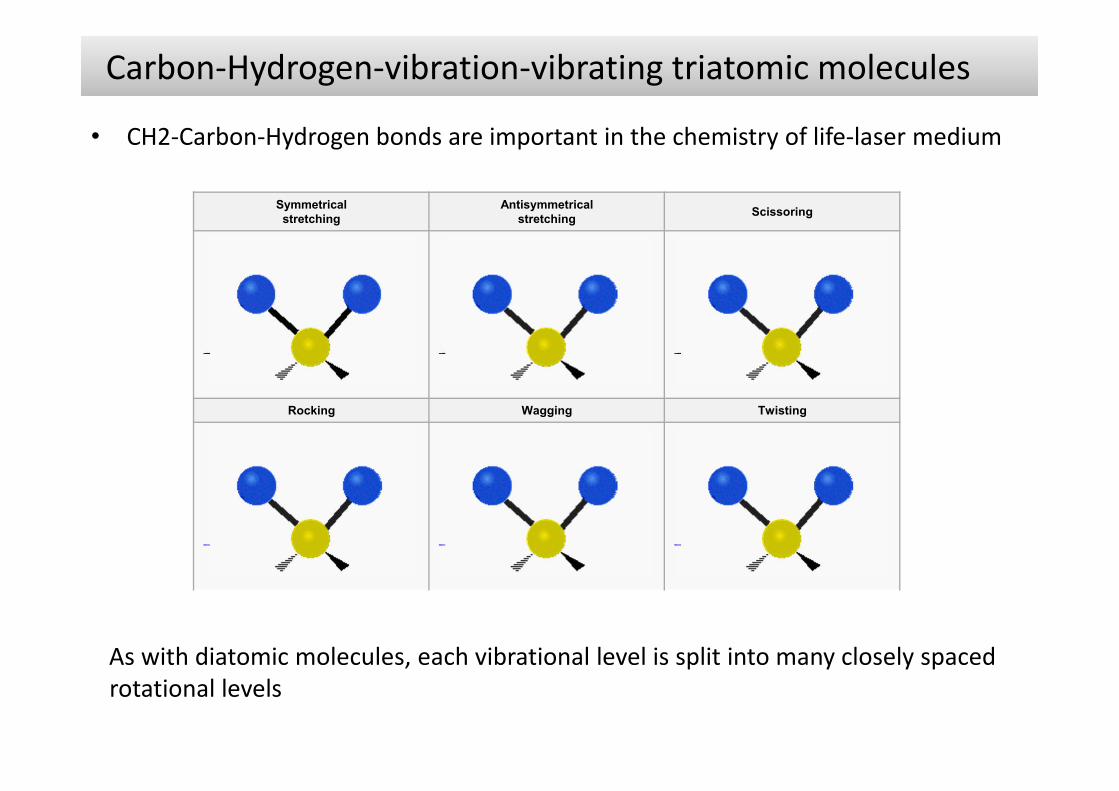
Carbon‐Hydrogen‐vibration‐vibrating triatomic molecules
• CH2‐Carbon‐Hydrogen bonds are important in the chemistry of life‐laser medium
As with diatomic molecules, each vibrational level is split into many closely spaced rotational levels
Symmetricalstretching
Antisymmetricalstretching Scissoring
Rocking Wagging Twisting

Rotational states
• Consider diatomic molecules
•A diatomic molecule may be thought of as two atoms held together with a massless, rigid rod (rigid rotator model).
•In a purely rotational system, the kinetic energy is expressed in terms of the angular momentum L and rotational inertia I. I
LErot 2
2
•L is quantized
•The energy levels are
•Erot varies only as a function of the quantum number ℓ.
)1( L2 ( 1)
2rotEI

Rotational states
• The energy separations of rotational energy levels typically lie in the range 10 ‐4
10 ‐2 eV, corresponding to photons in the microwave and far‐infrared regions ofthe spectrum.
• The energy spacing between successive rotational energy levels increases withincreasing quantum rotational number, in contrast to the spacing betweensuccessive electronic energy levels of the hydrogen atom, which decrease withincreasing quantum number
• Diatomic molecules with identical nuclei (such as N 2 ) have no permanentelectric dipole moment; they therefore do not exhibit pure rotational spectra.

Vibration and Rotation Combined
• It’s possible to excite rotational and vibrational modes simultaneously.• Total energy of a simple vibration‐rotation system:
• Vibrational energies are spaced at regular intervals.
• Transitions from ℓ +1 to ℓ :• Photons will have
energies at regular intervals (plus the vibrational energy difference):
2 ( 1) 12 2rot vibrE E E n
I
2
2 22 2
( 1)( 2) ( 1)2
3 2 ( 1)2
phEI
I I

Vibration and Rotation Combined
• E increases linearly with ℓ.• Many transitions are forbidden by
the selection rules that requires ℓ = ±1 and n = ±1
• The emission (and absorption) spectrum spacing varies with ℓ.
• The higher the starting energy level, the greater the photon energy.
• Vibrational energies are greater than rotational energies. For a diatomic molecule, this energy difference results in band structure.
• The line strengths depend on populations of the states and the vibrational selection rules

Vibration and Rotation Combined
• In the absorption spectrum of HCl, the spacing between the peaks can be used to compute the rotational inertia I.
• The missing peak in the center • corresponds to the forbidden • Dℓ = 0 transition.
n = 0n = 3 n = 2 n = 1
Wavelength →
ni nf = 1
ℓi ℓf > ℓi ℓf <
ni nf = 1

Motion frequencies in atoms and molecules
• Electrons vibrate in their motion around nuclei• High frequency: ~1014 ‐ 1017 cycles per second.
• Nuclei in molecules vibrate with respect to each other
• Intermediate frequency: ~1011 – 1013 cycles per second.
• Nuclei in molecules rotate• Low frequency: ~109 ‐ 1010 cycles per second.

Including electronic energy levels
• A typical large molecule’s energy levels
Ground electronic state
1st excited electronic state
2nd excited electronic state
Ene
rgy
Transition
Lowest vibrational and rotational level of this electronic “manifold”
Excited vibrational and rotational level
There are many other complications, such as spin-orbit coupling, nuclear spin, etc., which split levels.
E = Eelectonic + Evibrational + Erotational
As a result, molecules generally have very complex spectra.

Studying Vibrations and Rotations
• Fourier transform infrared (FTIR) spectroscopy• The Fourier transform of the output intensity vs.
delay of a Michelson Interferometer is the spectrum
Delay
Raman scattering:If a photon of energy greater than E is absorbed by a molecule, a scattered photon with ±E additional (or less) energy may be emitted.The angular momentum selection rule becomes Δℓ = ±2.
E
Input lightOutput light

Dye Molecule
• Organic dyes are large and complex molecules. As a result, they may undergo elec‐tronic, vibrational, and rotational transitions, and typically have a vast array of energy levels.
• Levels exist in both singlet (S) and triplet (T) states s. Singlet states have an excited electron whose spin lies antiparallel to that of the remainder of the dye molecule; triplet states have parallel spins.
• At left is a schematic illustration of a laser transition between two singlet manifolds with slightly different configurations, as indicated by their horizontal offset. Vibrational and rotational energy levels are represented by thick and thin lines, respectively.

Dye Molecule
• The differences between energy levels correspond to wavelengths that cover broad regions of the optical and ultraviolet.
• This particular dye is sometimes used as a lasing medium in the yellow region of the spectrum
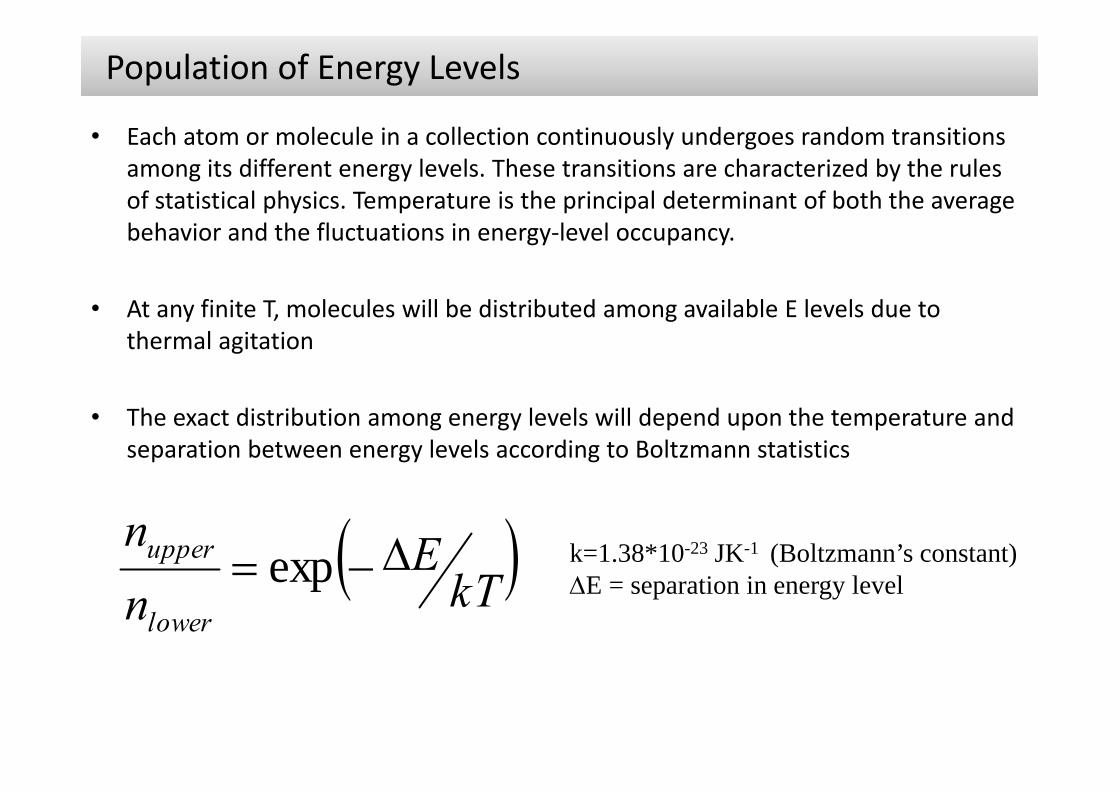
Population of Energy Levels
• Each atom or molecule in a collection continuously undergoes random transitions among its different energy levels. These transitions are characterized by the rules of statistical physics. Temperature is the principal determinant of both the average behavior and the fluctuations in energy‐level occupancy.
• At any finite T, molecules will be distributed among available E levels due to thermal agitation
• The exact distribution among energy levels will depend upon the temperature and separation between energy levels according to Boltzmann statistics
kTE
nn
lower
upper exp k=1.38*10-23 JK-1 (Boltzmann’s constant)E = separation in energy level

Population of Energy Levels‐Boltzmann distribution
• The Boltzmann distribution provides the probability that energy level Em of an arbitrary atom is occupied; it is an exponentially decreasing function of Em.
The occupation probability P( Em) is a exponentially decreasing function of Em
The divisions of energy are taken to be distinguishable if they involve different energy states, and all possible divisions of the total energy are assumed to occur with equal probability. If one of the entities takes a large share of the total energy, less is available for the remaining constituents so there are fewer possible divisions. Consequently, large energies are less probable than small energies.
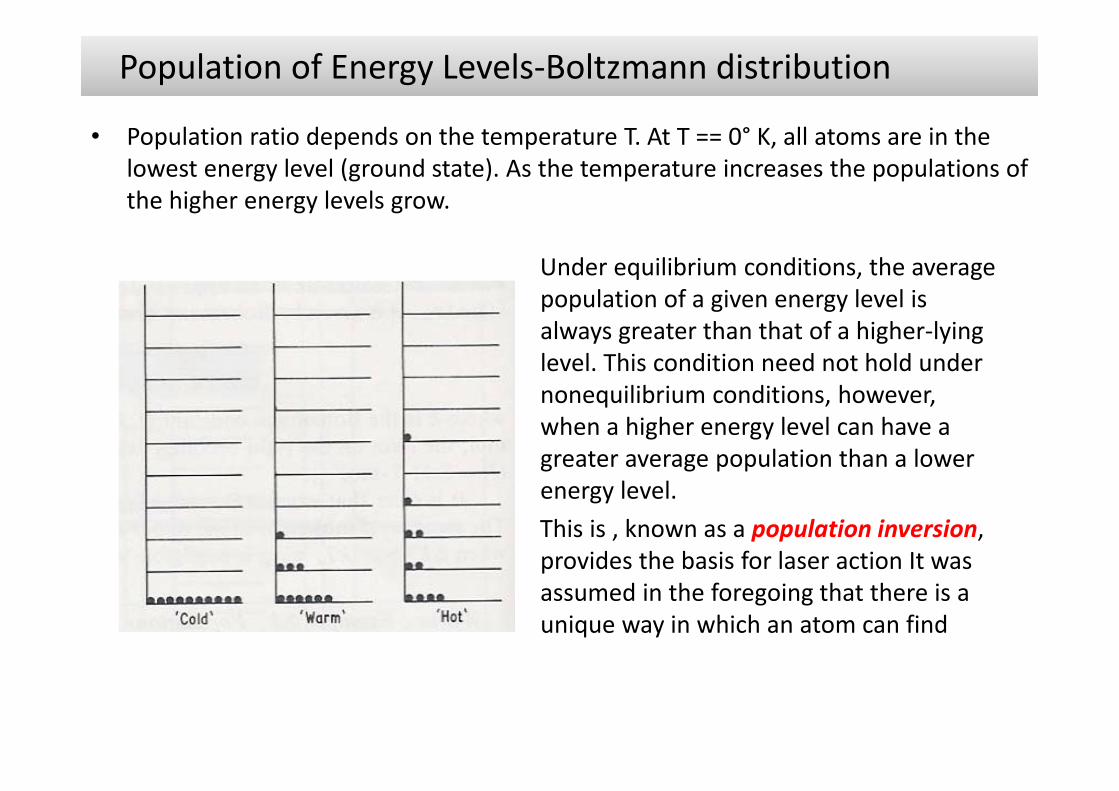
Population of Energy Levels‐Boltzmann distribution
• Population ratio depends on the temperature T. At T == 0° K, all atoms are in the lowest energy level (ground state). As the temperature increases the populations of the higher energy levels grow.
Under equilibrium conditions, the average population of a given energy level is always greater than that of a higher‐lying level. This condition need not hold under nonequilibrium conditions, however, when a higher energy level can have a greater average population than a lower energy level. This is , known as a population inversion, provides the basis for laser action It was assumed in the foregoing that there is a unique way in which an atom can find

Interactions of Photons with Atoms
• An atom may emit (create) or absorb (annihilate) a photon by undergoing downward or upward transitions between its energy levels, conserving energy in the process.
• Three forms of interaction are possible ‐ spontaneous emission, absorption, and stimulated emission.
• Associated with each of these processes is a rate of change of population of the lower and upper levels. Labeling the upper (lower) state energy as E2 (E1), and the number of atoms per unit volume in the upper (lower) state as N2 (N1), we can write rates of change of populations associated with each of the three processes
• Spontaneous emission –
Spontaneous emission of a photon into the mode of frequency v by an atomic transition from energy level 2 to energy level 1
The function (v) is a function of v centered about the atomic resonance frequency Vo; it is known as the transition cross section.

Spontaneous emission
where A is the spontaneous emission rate, also known as the “Einstein A‐coefficient”. sp the spontaneous lifetime and A = 1/sp.
• The term "probability density" signifies that the probability of an emission taking • place in an incremental time interval between t and t + t is simply Psp t. Because
it is a probability density, Psp can have a numerical value greater than 1 s‐1, although, of course, Psp t must always be smaller than 1.
• Thus, if there are a large number N of such atoms, a fraction of approximately N=(Psp t)N atoms will undergo the transition within the time interval t.
1sp
sp
A p

Absorption
• If the atom is initially in the lower energy level and the radiation mode contains a • photon, the photon may be annihilated and the atom concomitantly raised to the
upper energy level This process, which is induced by the photon, is called absorption. It can occur only when the mode contains a photon.
The probability density for the absorption of a photon from a given mode of frequency , in a cavity of volume V, is governed by the same law that governs spontaneous emission into that mode.
() is a function of centered about the atomic resonance frequency o; it is known as the transition cross section.
If there are n photons in the mode, the probability density that the atom absorbs one photon is n times greater since the events are mutually exclusive, i.e.,
Absorption of One Photon from a Mode with n Photons

Stimulated Emission
• If the atom is in the upper energy level and the mode contains a photon, the atom may be induced to emit another photon into the same mode. This process is known as stimulated emission. It is the inverse of absorption. The presence of a photon in a mode of specified frequency, propagation direction, and polarization stimulates the emission of a duplicate ("clone") photon with precisely the same characteristics as the original Stimulated emission is a process
whereby a photon of energy hvstimulates the atom to emit a clone photon as it undergoes a downward transition.
If the mode originally carries n photons, the probability density that the atom is stimulated to emit an additional photon is, as in the case of absorption,

The Lineshape Function
• The transition cross section () characterizes the interaction of the atom with the • radiation.
Its area which has units of cm2Hz, is called the transition strength or oscillator strength and represents the strength of the interaction.Its shape governs the relative magnitude of the interaction with photons of different frequencies.
the lineshape function g()= ()/S has units of Hz‐1 and unity area
The lineshape function g() is centered about the resonance frequency , where () is largest, and drops sharply as v deviates from ,. Transitions are therefore most likely for photons of frequency =,

Transition Linewidth
• The width of the function g() is known as the transition linewidth. The linewidth is usually defined as the full width of the function g() at half its maximum value (FWHM)
• Since the area of g() is unity, its width is inversely proportional to its central value:
An atom may spontaneously emit a photon into anyone (but only one) of the many optical modes with frequencies =,
Total Spontaneous Emission into All Modes
(We discussed probability density Psp for spontaneous emission into a specific mode of frequency (without regard to whether the mode contains photons).

Total Spontaneous Emission into All Modes
• The density of modes for a three‐dimensional cavity increases quadratically as
The overall probability density for spontaneous emission into all modes
The probability density for spontaneous emission into all modes is therefore given by the probability density for spontaneous emission into each mode, weighted by the modal density.
Since modes at each frequency have an isotropic distribution of directions, each with two polarizations, we must determine the average transition cross section a () . If is the angle between the dipole moment of the atom and the field direction, we obtain

Spontaneous lifetime
• We define a time constant tsp , known as the spontaneous lifetime of the 2 1 transition
the transition strength S can be determined from an experimental measurement of the spontaneous lifetime tsp
Typically, t sp 10‐8 s for atomic transitions such as the first excited state of atomic hydrogen; however, tsp can vary over a large range, from subpicoseconds to minutes.
Relation Between Transition Cross Section and Spontaneous Lifetime
Relations are identical for stimulated emission‐effective stimulated emission

Einstein coefficients
• Although Einstein carried out an important analysis of the energy exchange between atoms and radiation that permitted him to obtain general expressions for the probability densities of spontaneous and stimulated transitions
• For stimulated emission
where B21 is the stimulated emission rate, or “Einstein B‐coefficient” for transitions from state 2 to state 1.
is the electromagnetic spectral energy density(energy per unit volume in the range {, +d}).If we have a monochromatic field, it is simpler to use the irradiance I at frequency and the stimulated emission cross section, 21().
For absorption
( )d

Einstein coefficients
• We can track all of this in a rate equation for a two‐level system:
Now if the total atomic density is N, then N1 + N2 = N, and since N is constant, then
Level scheme showing absorption and emission cross‐sections, as well as the Einstein A coefficient

Relationship between A and B coefficients
• In thermal equilibrium, the populations of the levels are related by a Boltzmann factor

Relationship between A and B coefficients

Relationship between A and B coefficients

Degeneracy of levels
where we have chosen to set B = B21 Similarly, we can write for the stimulated emission cross section

Absorption/Transmittance;
© Thomson/Brooks Cole
Tunable Laser (x ) Sample
Detector
I0 (x )
L
It(x ) = I0 (x ) e-L
= absorption coefficientIt(x )

Absorption/Transmittance;
• Net absorption depends on the difference between the populations of the energy levels
• The more populated the ground state, the more intense the net absorption is• Two factors that influence absorption are the energy level spacing and the
temperature• UV Visible absorption spectroscopy involves transitions between electronic energy
levels
Electron transition rules
Energy is absorbed by transitions induced between different electronic energy states of a moleculeTransition occurs only if there is an induced dipole momentResonance condition; the frequency of radiation must be equal to the frequency of the dipole
E=h

Franck Condon principle
• Electronic transitions can terminate in different vibrational and rotational states, resulting in broad electronic absorption/emission bands. There are no simple selection rules here, but the Franck‐Condon principle states that the vibrational coordinate should not change during a transition, (see below). Since the electrons have highest probability of being at the extreme positions of their excursions, this controls which transitions are most possible, which strongly affects the shape of the absorption band.
Allowed

Franck Condon principle
• The time for an electronic transition is: t=1/ =/c ~ 10‐15 s (at 420 nm)
• Franck Condon principle: electronic transitions occur so rapidly that during the transition the nuclei are static
• Thus, all electronic transitions are vertical (internuclear distance doesn’t change)
• As the optical transition becomes less vertical the absorption spectra shift due to the change in the Franck‐Condon patterns.
• With enough of these transitions the absorption spectrum looks more like a smooth curve rather than a line

Franck Condon principle
• Due to the Franck‐Condon principle and the tendency for molecules to relax to the• bottom of the vibration bands, the emission spectrum is shifted to longer
wavelengths than the absorption spectrum, and the emission band usually looks like a mirror image of the absorption band

Lifetime broadening
• A molecule spends only a short amount of time in its excited state, which defines the lifetime, t, of the state.
• If a molecule changes states at a rate of 1/t, then the energy levels become blurred and the corresponding spread in the energy levels around E is (Heisenberg uncertainty principle
• Doppler broadening– With the thermal motion of the atoms, those atoms traveling toward the
detector with a velocity v will have transition frequencies which differ from those of atoms at rest by the Doppler shift.
E
– o=frequency for atom at rest– mo=atomic mass
o
oDoppler
mkTc 2ln2
2

Potential energy curves for molecular oxygen

Biological chromophores
1. The peptide bonds and amino acids in proteins• The p electrons of the peptide group are delocalized over the carbon, nitrogen, and
oxygen atoms. The n‐* transition is typically observed at 210‐220 nm, while the main ‐* transition occurs at ~190 nm.
• Aromatic side chains contribute to absorption at > 230 nm
2. Purine and pyrimidine bases in nucleic acids and their derivatives