fund performance rankings · 2019-11-27 · move a fund to a different category as its holdings...
TRANSCRIPT

SIMPLIFY YOUR INVESTING WITH SMI’SPERSONAL PORTFOLIO TRACKER
While this Fund Performance Rankings report containseverything needed to manually track and Upgrade funds withina retirement plan, we understand that it can be a labor intensiveprocess to do this, especially if your plan offers a wide selectionof fund choices. To simplify the investing lives of those with401(k)s and other company retirement plans, we created theonline Personal Portfolio Tracker.
This tool, available to all SMI members, vastly simplifiesUpgrading within a retirement plan by generating a personalreport customized to include only the funds available throughyour specific retirement plan. Every month, a single clickprovides a report showing all of the funds available toyou—sorted by risk category and ranked by momentum withintheir peer group. No more wading through the FPR pageslooking for your funds. Instead, you can see instantly if anyupgrades are required within your plan each month, and if so,which available funds are the most attractive Upgradingcandidates.
The Tracker allows multiple portfolios to be tracked in asingle account, so households with multiple retirement planscan track them all from a single web membership account (forexample, a husband and wife with separate 401(k)s). Thecombination of receiving new Upgrading rankings on yourretirement plan funds every month plus having the informationpresented in a fast, easy-to-utilize format makes the Tracker aphenomenal tool for those households managing companyretirement plan investments. The Personal Portfolio Tracker canalso be used for regular accounts and IRAs as well. If you haven’tused it yet, take it for a test drive atwww.soundmindinvesting.com/tracker.
USING THE FUND DIRECTORYThe fund directory at the end of this Fund Performance
Rankings report lists in bold type all of the funds currentlyranked in the top quartile of the five stock-risk categories usedin our Stock Upgrading strategy. If you are Upgrading, you canfind your funds quickly in the directory andimmediately see if they need to be replaced.If a fund you currently own is listed in boldthere, that means it was still in the top quartileas of the date of this report and there’s no needto replace it. If it’s no longer in bold, it’stime to investigate possible replacement optionsin that particular risk category. Using the funddirectory first can be a major time saver.
INVESTING WITH SMALLER AMOUNTSStarting an investing program doesn’t have
to be difficult. By making a few basic decisionsand taking a few easy steps, you can begin asuccessful investing program. Search for “Howto Start Investing With SMI If Your Portfolio IsSmall” on our website (May 2019 issue).
HOW FUNDS ARE SELECTED FOR INCLUSIONIN THESE PERFORMANCE RANKINGS
Obviously, only a fraction of the 23,000+ mutual fundslisted in Morningstar (our source for the performance data)can be included in these Fund Performance Rankings. Becauseone of SMI’s goals is to help investors keep their costs down,we do not include funds with front- or deferred loads (whichprimarily go to pay commissions to the professional whosells the fund). In the FPR, we include only no-load funds andETFs. (ETFs are purchased like stocks—usually for free butsome brokers add a small commission charge. For more onbuying ETFs, see the “How to Buy or Sell” section below.)
A WORD ABOUT FUND NAMES.Often there is a slight difference in the formal name of a
fund and the way that fund is listed in the FPR. Usually this isdue to Morningstar using an abbreviation for space reasons.Examples: “Opp” is often substituted for “Opportunity,” “Intl”for “International,” “Gro” for “Growth,” “Val” for “Value,” andso on. You can often verify if a fund listed is the one you’relooking for by comparing their ticker symbols (althoughdifferent share classes for the same fund will have differenttickers).
A WORD ABOUT “INDEX” FUNDS.As indexing has increased in popularity, so has the
number of index funds. We found more than 50 listed inMorningstar based on the S&P 500 index alone. Since all ofthese funds have the same goal—to replicate the total returnof the S&P 500 index—you wouldn’t expect to find muchdifference in their per- formance results. What differencesthere are stem primarily from the fact that some chargehigher management fees than others. Because they’re allsimilar, there’s no reason to include all of them in the FPR. Ifyours isn’t listed and you want to know roughly how it’sdoing, use the Vanguard 500 fund as a proxy.
HOW TO BUY OR SELL AN EXCHANGE-TRADED FUNDThe good news: using ETFs isn’t hard.
The bad news: there is a slight adjustmentto be made if you haven’t used thembefore, as is often the case with somethingunfamiliar. To help ease that process, here’sa short explanation.
In essence, Exchange-Traded Funds(ETFs) represent a subclass of mutualfunds—they are similar to mutual funds inmany ways, but also different in some keyways. One main difference is how theytrade. Whereas mutual funds are priced atthe end of each day, ETFs are pricedthroughout the day, therefore trading likestocks. The other key difference is howETFs are bought and sold. Here are the keysteps.
Fund Performance RankingsFUND PERFORMANCE DATA FOR PERIODS ENDING 10/31/2019
TABLE OF CONTENTS
SMI Risk Categories 3
Column Heading Definitions 4
Bond Fund Rankings 5
Hybrid Fund Rankings 10
Stock Fund Rankings 14
Fund Directory 37
Page 1Fund Performance Rankings | SoundMindInvesting.com

• Go to your broker’s Web site. Open the stock and ETFtrading page, rather than the usual mutual funds tradingpage.
• Get a price quote. Each broker’s process is different, butthere’s likely a “Quote” or “Symbol” box availablesomewhere on the screen. Entering the ticker symbol shouldproduce a quote that shows the price at which the last tradetook place.
• Determine how many shares to buy. Let’s say I have $5,000to invest in an ETF and the quoted “Ask” price is $60.46. Iwould divide $5,000 by $60.46. This results in an answer of82.7 shares, so I’ll round down to 82 shares. I enter that inthe “number of shares” field. (Brokerage websites typicallyhave dollars-to-shares calculators on their order pages.)
• Choose the type of order. Choices are normally “Market”(the trade will be filled right away at the next available price),“Limit” (the trade will be made at a specified price, or better,within a specified time frame), or some variation of “Stop”(the trade will be made when the security’s price surpasses acertain point).
In most cases, a market order is fine, but at times when themarket is particularly volatile, a limit order may serve you better.For more, search for “Recent Market Correction Exposes ETFVulnerabilities” on the SMI website.
The major brokerage firms have done away with chargingcommissions to buy and sell exchange-traded funds, so ETFstoday are less expensive than investing in a comparabletransaction-fee traditional mutual fund.
HOW THE FUNDS ARE ARRANGEDThe funds are separated into three major sections: bond
funds, hybrid funds (that invest in both stocks and bonds), andstock funds. Within each section, there are multiple riskcategories, defined by the portfolio strategies of the funds inthat category. Each risk-category grouping has a heading at thetop that describes the nature of the funds in that category.
A key factor in how the funds are broken down into thevarious risk groups is the “Morningstar Category.” Each of the23,000+ funds tracked by Morningstar is assigned to one ofMorningstar’s 100+ categories based on the fund’s portfolioholdings over the past three years. (Over time, Morningstar maymove a fund to a different category as its holdings change.) Weuse the Morningstar Category label as our starting point, buthave combined some categories to better fit with SMI’sterminology.
UNDERSTANDING SMI’S USE OF PERFORMANCEMOMENTUM
When assessing an investment’s track record, the firstquestion to be answered is “Which period of time are weevaluating?” Last month? Last year? The last full market cycle?The answer to this question has more influence on the outcome of afund’s ranking than any other single factor.
Most financial magazines use quite lengthy time frames whenmeasuring performance and compiling their ratings. Forbes,Bloomberg Businessweek, and Consumer Reports all use periods ofat least five years. This is much longer than is either necessary orbeneficial. SMI typically looks only at the past 12 months, givinggreater weight to the more recent months.
Look at it this way. As the baseball season hits the midwaymark, who do you think is more likely to win the leaguepennant—the team that has done the best over the past fiveyears, the team that won last year, or the team that has been themost dominant this year and is currently leading the league? Insports, the teams that have been strongest of late are the morelikely winners in the coming months. The same is true in theworld of stock mutual funds, and the momentum calculation isone good way to identify the contenders for the performancetitle.
SMI’s momentum score itself is easy to calculate—simply addup a fund’s most recent 3-month, 6-month, and
12-month performance. Notice that the most recent threemonth’s performance is reflected in all three of these statistics.The past three-months represent 100% of the first number, 50%of the second number, and 25% of the final number. In this way, afund’s more-recent performance is given greater weight. Statedanother way, momentum counts each fund’s most recent three-month performance three times more than it does the 12thmonth back. This formula takes into account both assumptionsmentioned earlier: that results older than 12 months aren’t veryrelevant, and that more recent months should be weighted moreheavily than distant months.
Applying the momentum rankings within each SMI riskcategory, and thereby rating a fund only against other funds ofthe same type, is an important part of the process. Doing soassures that we stay reasonably diversified, and don’t end upowning a portfolio of funds all invested in similar types of stocks.
IMPORTANT NOTE ABOUT BOND FUNDSSMI’s Bond Upgrading strategy uses a different momentum
formula than what is described above. We do this because we’reselecting from among different bond peer groups. This isdifferent from our approach to stock funds, where themomentum comparisons are made within each fund’s peergroup. While the bond funds in this FPR are ranked using thesame 3+6+12 month performance score as the stock funds, wehave less confidence that an upgrading approach within bondcategories is going to be worthwhile. In many cases, there isn’tenough performance variation within these bond peer groups tomake trading among the various funds worthwhile.
DISCLAIMERMorningstar is the industry leader in providing statistics and
analysis of the mutual fund industry. All the data in this reporthas been provided to SMI by Morningstar, and is not warrantedto be accurate, complete or timely. SMI is not responsible forany errors and/or omissions. You are encouraged to review afund’s prospectus for additional important information.
Help Getting Started
Fund Performance Rankings
Page 2Fund Performance Rankings | SoundMindInvesting.com

The funds ranked in this Fund Performance Rankings report are divided into three main sections and more than 70 risk categories. Theserisk categories are groupings of funds which have similar investments, styles, and risk profiles. This allows you to “compare apples toapples” when evaluating a fund’s attractiveness in relation to its peers.
Below is a listing of the risk categories. The number preceding each is a code that SMI uses internally to sort and rank the funds. In this FPRreport, the performance rankings of categories are listed in the order shown below, beginning with the Short-Term Government Bond Fundrankings first and concluding with Foreign Emerging Markets Stock ETFs last.
Bond Section
101 Short-Term Government Bond Funds102 Short-Term Government Bond ETFs105 Short-Term Corporate Bond Funds106 Short-Term Corporate Bond ETFs109 GNMA Mortgage-Backed Bond Funds110 GNMA Mortgage-Backed Bond ETFs113 Intermediate-Term Government Funds114 Intermediate-Term Government Bond ETFs117 Intermediate-Term Corporate Bond Funds118 Intermediate-Term Corporate Bond ETFs121 Long-Term Government Bond Funds122 Long-Term Government Bond ETFs125 Long-Term Corporate Bond Funds126 Long-Term Corporate Bond ETFs129 Inflation-Protected Bond Funds130 Inflation-Protected Bond ETFs133 High-Yield Bond Funds134 High-Yield Bond ETFs137 Nontraditional Bond Funds141 World Bond Funds142 World Bond ETFs145 Emerging Markets Bond Funds146 Emerging Markets Bond ETFs
Hybrid Section
160 Retirement Income Funds161 Conservative Allocation Funds162 Moderate Allocation Funds163 Aggressive Allocation Funds164 Tactical Allocation Funds165 World Allocation Funds166 Convertible Bond Funds170 Target-Date 2000-2010 Funds171 Target-Date 2011-2015 Funds172 Target-Date 2016-2020 Funds173 Target-Date 2021-2025 Funds174 Target-Date 2026-2030 Funds175 Target-Date 2031-2035 Funds176 Target-Date 2036-2040 Funds177 Target-Date 2041-2045 Funds178 Target-Date 2046-2050 Funds
Stock Section
201 SMI Stock Risk Category 1: Large/Value Funds202 SMI Stock Risk Category 1: Large/Value ETFs203 SMI Stock Risk Category 2: Large/Growth Funds204 SMI Stock Risk Category 2: Large/Growth ETFs205 SMI Stock Risk Category 3: Small/Value Funds206 SMI Stock Risk Category 3: Small/Value ETFs207 SMI Stock Risk Category 4: Small/Growth Funds208 SMI Stock Risk Category 4: Small/Growth ETFs209 SMI Stock Risk Category 5: Foreign Funds210 SMI Stock Risk Category 5: Foreign ETFs
221 Precious Metals Sector Funds222 Precious Metals Sector ETFs225 Real Estate Sector Funds226 Real Estate Sector ETFs229 Energy & Natural Resources Sector Funds230 Energy & Natural Resources Sector ETFs233 Technology Sector Funds234 Technology Sector ETFs237 Communications & Utilities Sector Funds238 Communications & Utilities Sector ETFs241 Consumer Sector Funds242 Consumer Sector ETFs245 Health & Biotech Sector Funds246 Health & Biotech Sector ETFs249 Financial Sector Funds250 Financial Sector ETFs253 Industrials Sector Funds254 Industrials Sector ETFs
277 Market Neutral Funds278 Bear-Market Funds
280 World Stock Funds that Invest Globally281 World Stock ETFs that Invest Globally285 Foreign Regional Stock Funds286 Foreign Regional Stock ETFs291 Foreign Emerging Markets Stock Funds292 Foreign Emerging Markets Stock ETFs
SMI Risk Categories
Fund Performance Rankings
Page 3Fund Performance Rankings | SoundMindInvesting.com

MOM: Momentum is a measure of a fund’s performanceconsistency over the past year. It is the sum of a fund’s mostrecent 3-month, 6-month, and 12-month returns, and is SMI’spreferred stat for assessing the current attractiveness of a fundrelative to its peers.
PERFORMANCE: These columns show the total return for therecent periods shown. This is after all fund expenses have beendeducted, and takes both the gains/losses in share price as wellas the yield (see below) into account.
REL RISK: A “relative-risk” score of 1.0 means a stock fund hasexhibited the same degree of volatility as the S&P 500 over thepast three years. Scores higher than 1.0 indicate greatervolatility. (Ex: a fund with a relative-risk score of 1.4 means thefund was 1.4 times, or 40%, more volatile than the market.) Pricevolatility, while not the same as risk, is often used as a riskindicator. Scores for bond funds are based on their relationshipto a bond index rather than the S&P 500, and hybrid funds arecompared to a balanced-fund index.
CURRENT YIELD: This reflects the dividend or interest incomereceived over the past 12 months as a percentage of the fund’scurrent price. (Ex: if you receive $1 per share per year from afund priced at $20 per share, the current yield is 5%.) This doesnot reflect any gains or losses you may have due to the fund’sshare price rising or falling.
P/E RATIO: The price-to-earnings ratio is the average p/e of allthe securities in a stock fund portfolio. This plays a part indetermining whether the fund is classified as “value” (lower p/e)or “growth” (higher p/e).
MEDIAN MARKET CAPITALIZATION: This is a measure of theaverage market value of the companies in a stock fund portfolio,and helps determines whether a fund is placed in the “small-company” (aka “small-cap”) or “large-company” (aka “large-cap”)categories. The data is shown in millions of dollars of theaverage market value (Ex: 64,320 million or 64.32 billion).
NUMBER OF HOLDINGS: This is the number of differentsecurities in a portfolio. It can be a measure of portfoliorisk—the lower the figure, the more concentrated the fund is in afew companies or issues, and the more the fund may besusceptible to market fluctuations in these few holdings.However, some funds invest in ETFs and other funds, where asingle holding can represent hundreds of securities, not just one.Accordingly, the number of holdings should be used inconjunction with Rel Risk to more accurately gauge the likelyvolatility.
NET ASSETS: This is the value of all the holdings in the portfolio,expressed in millions of dollars.
EXPENSE RATIO: Operating expenses are charged by all mutualfunds, whether load or no-load. An expense ratio of 1.42%means that you’re paying $14.20 annually for every $1,000 ofaccount value. This amount is pro-rated daily against the fund’snet asset value. The fund performance numbers in this reporthave already taken these expenses into account.
TICKER SYMBOL: This is the code assigned to each fund by thebrokerage industry. Use this code when buying/selling to assurethat you are not misunderstood.
AVERAGE DURATION: This appears only on the bond-fundspages. Duration is a measure of the portfolio’s expected reactionto a change in interest rates. The longer you have to wait until abond reaches maturity, the longer you’re vulnerable to interest-rate risk. To shorten the wait (and reduce the risk), a fund cansimply buy bonds that were issued many years ago and are nowonly a few years from their maturity. The shorter the maturity,the less volatile a bond’s price will be. Likewise, the shorter theaverage maturity of all the individual bonds held by a bond fund,the less volatile that fund’s price will be. The duration of a bondfund can tell you roughly how much its value is likely to changein response to a change in interest rates. For every percentagepoint (1%) change in interest rates, the value of the fund’s bondportfolio will move in the opposite direction by a percentageroughly equal to the fund’s duration. For more, search for“Duration: A Simple Way To Gauge Bond Risk” on the SMIwebsite.
PERCENT INVESTING: This appears only on the hybrid-fundspages. Because hybrid funds own both stocks and bonds, aportfolio breakdown of how much of the portfolio is invested ineach can be helpful in determining risk. Generally speaking, thehigher the percentage invested in stocks, the higher the risk.
Column Heading Definitions
Fund Performance Rankings
Page 4Fund Performance Rankings | SoundMindInvesting.com

101 Short-Term Government Bond FundsLower-Risk Portfolios with Bonds of the Highest Quality and Short-Term Average Maturities
Shelton US Government Securities Direct 13.5 5.6% 0.1% 1.6% 4.0% 7.9% 1.5% 0.83 1.4% na 26 19 0.75 CAUSXNorthern Short-Intermediate US Govt 9.6 4.3% 0.2% 1.3% 2.8% 5.5% 1.3% 0.48 2.0% 2.7 13 56 0.42 NSIUXFidelity® Limited Term Government 9.3 3.9% 0.3% 1.2% 2.7% 5.5% 1.5% 0.47 1.8% 2.6 211 337 0.45 FFXSXVanguard Short-Term Federal Inv 8.8 4.0% 0.3% 1.1% 2.5% 5.2% 1.7% 0.39 2.3% 2.4 551 4,796 0.20 VSGBXVanguard Short-Term Treasury Inv 8.0 3.5% 0.3% 1.0% 2.2% 4.8% 1.5% 0.36 2.5% 2.4 89 8,816 0.20 VFISXVanguard Short-Term Treasury Idx Admiral 7.7 3.4% 0.3% 1.0% 2.1% 4.6% 1.6% 0.30 2.3% 1.9 94 8,090 0.07 VSBSXAmerican Century Short-Term Govt Inv 6.3 2.9% 0.2% 0.7% 1.8% 3.8% 1.3% 0.27 1.9% 1.9 118 187 0.55 TWUSXAmerican Century Zero Coupon 2020 Inv 5.9 2.6% 0.3% 0.7% 1.6% 3.6% 0.7% 0.45 4.0% 1.0 17 136 0.55 BTTTXThrift Savings Plan G Fund 4.0 2.2% 0.1% 0.5% 1.0% 2.5% 2.5% na na na na na 0.03 THRIFTG
102 Short-Term Government Bond ETFsLower-Risk Portfolios with Bonds of the Highest Quality and Short-Term Average Maturities
iShares Agency Bond ETF 13.7 5.7% 0.1% 1.8% 4.0% 7.9% 2.5% 0.70 2.4% 4.1 100 490 0.20 AGZVanguard Short-Term Treasury ETF 7.8 3.3% 0.4% 1.0% 2.2% 4.6% 1.6% 0.30 2.3% 1.9 94 8,090 0.07 VGSHSchwab Short-Term US Treasury ETF™ 7.8 3.3% 0.3% 1.0% 2.2% 4.6% 1.6% 0.30 2.3% 1.9 87 5,215 0.06 SCHOiShares 1-3 Year Treasury Bond ETF 7.5 3.3% 0.3% 1.0% 2.1% 4.5% 1.5% 0.30 2.1% 1.9 93 17,546 0.15 SHYPIMCO 1-3 Year US Treasury ETF 7.5 3.2% 0.3% 0.9% 2.1% 4.4% 1.5% 0.29 2.1% 1.9 28 51 0.15 TUZFranklin Liberty Short Dur US Govt ETF 5.9 2.4% 0.4% 0.8% 1.7% 3.5% 1.6% 0.15 3.0% 1.1 339 147 0.25 FTSD
105 Short-Term Corporate Bond FundsLower-Risk Portfolios with Bonds of Generally Good Quality and Short-Term Average Maturities
New Covenant Income 14.2 6.9% 0.4% 1.5% 4.0% 8.7% 2.5% 0.68 2.4% na 831 329 0.95 NCICXMadison High Quality Bond Y 10.6 4.6% 0.3% 1.3% 2.9% 6.4% 1.8% 0.53 1.9% 2.6 47 90 0.49 MIIBXVanguard Short-Term Investment-Grade Inv 10.3 5.4% 0.3% 1.2% 2.9% 6.3% 2.5% 0.40 2.8% 2.5 1937 61,262 0.20 VFSTXWilliam Blair Income N 10.2 5.8% 0.4% 1.2% 2.9% 6.2% 1.9% 0.44 3.2% 3.1 105 62 0.85 WBRRXVanguard Short-Term Bond Index Inv 10.2 4.7% 0.3% 1.2% 2.9% 6.1% 2.0% 0.44 2.2% 2.7 2448 49,677 0.15 VBISXCavanal Hill Moderate Duration Investor 10.1 4.8% 0.2% 1.1% 2.8% 6.2% 2.2% 0.53 2.3% 3.6 172 29 0.74 APFBXMetropolitan West Low Duration Bd M 8.7 4.1% 0.4% 1.2% 2.4% 5.2% 2.1% 0.29 2.5% 1.9 453 2,005 0.62 MWLDXBrown Advisory Strategic Bond Inv 8.7 5.7% 0.2% 1.2% 2.3% 5.1% 3.1% 0.36 3.5% 1.5 208 222 0.66 BATBXUSAA Short-Term Bond 8.3 4.5% 0.4% 1.0% 2.2% 5.1% 2.5% 0.31 2.7% 1.7 565 3,009 0.53 USSBXCavanal Hill Limited Duration Investor 8.3 4.0% 0.3% 1.1% 2.4% 4.8% 2.0% 0.32 2.2% 2.3 239 118 0.80 APSTXT. Rowe Price Short-Term Bond 8.2 4.1% 0.4% 1.0% 2.4% 4.8% 2.2% 0.26 2.5% 1.9 920 5,463 0.44 PRWBXFidelity® Short-Term Bond 8.1 4.0% 0.4% 1.1% 2.2% 4.7% 2.0% 0.27 2.1% 1.8 477 5,214 0.45 FSHBXFirst Western Short Duration Bond 8.0 4.0% 0.4% 1.0% 2.2% 4.8% 2.5% 0.24 2.8% na 199 105 0.60 FWSBXHomestead Short-Term Bond 8.0 4.0% 0.3% 1.2% 2.4% 4.4% 2.3% 0.27 1.9% na 273 554 0.77 HOSBXInvesco Short Term Bond C 7.9 4.4% 0.3% 1.1% 2.3% 4.6% 1.9% 0.30 2.6% 2.0 350 1,545 1.00 STBCXFPA New Income 7.5 3.7% 0.3% 1.0% 2.1% 4.4% 3.0% 0.19 3.0% 1.8 451 7,418 0.50 FPNIXPayden Low Duration Fund 7.4 3.8% 0.3% 1.0% 2.1% 4.4% 2.0% 0.25 2.4% 1.9 325 1,521 0.43 PYSBXAmerican Century Short Duration Inv 7.2 3.8% 0.3% 0.9% 2.0% 4.3% 2.1% 0.26 2.7% 1.9 333 442 0.59 ACSNXAzzad Wise Capital 7.2 4.5% 0.2% 0.7% 2.0% 4.4% 2.3% 0.37 1.8% na 219 153 1.29 WISEXJanus Henderson Short-Term Bond T 7.1 4.0% 0.2% 0.9% 1.8% 4.4% 1.8% 0.27 2.3% 1.5 148 1,207 0.69 JASBX
106 Short-Term Corporate Bond ETFsLower-Risk Portfolios with Bonds of Generally Good Quality and Short-Term Average Maturities
Vanguard Short-Term Corporate Bond ETF 12.4 6.6% 0.5% 1.6% 3.4% 7.4% 3.0% 0.46 2.9% 2.6 2263 31,215 0.07 VCSHiShares 0-5 Year Invmt Grade Corp Bd ETF 10.9 5.7% 0.4% 1.4% 3.0% 6.5% 2.8% 0.40 2.8% 2.2 1817 1,935 0.06 SLQDVanguard Short-Term Bond ETF 10.5 4.9% 0.4% 1.3% 3.0% 6.3% 2.1% 0.45 2.3% 2.7 2448 49,677 0.07 BSViShares Core 1-5 Year USD Bond ETF 10.3 5.2% 0.3% 1.1% 2.8% 6.4% 2.4% 0.42 2.8% 2.6 3896 2,852 0.06 ISTBPIMCO Enhanced Low Duration Active ETF 6.6 3.9% 0.3% 0.9% 1.9% 3.8% 2.4% 0.20 3.2% 1.9 667 421 0.79 LDUR
Bond Fund RankingsDATA FOR PERIODS ENDING 10/31/2019
----------------Performance----------------
MOMYTD
Return1 Mo
Return3 Mo
Return6 Mo
Return12 MoReturn
3 YrAvg
Return
3 YrRelRisk
CurrentYield(%)
AvgDuration
(Yrs)NumberHoldings
NetAssets
ExpRatio(%)
NasdaqTicker
Performance numbers reflect periods ending 10/31/2019. Funds shown in bold are the recommendations in the November 2019 issue for SMI’s two Basic strategies.Although gathered from reliable sources, data accuracy cannot be guaranteed.
Page 5Fund Performance Rankings | SoundMindInvesting.com

109 GNMA Mortgage-Backed Bond FundsAverage-Risk Portfolios that Invest in Home Mortgages Backed by the U.S. Government
American Century Ginnie Mae Inv 14.4 6.2% 0.1% 1.3% 4.2% 8.9% 2.0% 0.71 2.7% 2.8 400 1,051 0.55 BGNMXVanguard GNMA Inv 13.5 5.7% 0.3% 1.4% 3.7% 8.4% 2.2% 0.69 2.8% 2.0 15771 24,238 0.21 VFIIXFidelity® GNMA 12.6 5.6% 0.4% 1.2% 3.3% 8.2% 2.1% 0.65 2.4% 2.3 234 4,200 0.45 FGMNXT. Rowe Price GNMA 11.7 5.1% 0.3% 1.2% 3.2% 7.3% 1.9% 0.55 2.5% 2.8 894 1,323 0.59 PRGMXAMG Managers Amundi Intermediate Gov N 7.9 4.1% 0.1% -0.5% 1.9% 6.5% 1.2% 0.73 1.8% na 1 57 0.87 MGIDX
110 GNMA Mortgage-Backed Bond ETFsAverage-Risk Portfolios that Invest in Home Mortgages Backed by the U.S. Government
iShares MBS ETF 14.0 6.0% 0.3% 1.4% 3.8% 8.8% 2.4% 0.74 2.8% 2.2 1403 19,495 0.07 MBBVanguard Mortgage-Backed Secs ETF 13.7 5.8% 0.3% 1.4% 3.7% 8.6% 2.4% 0.71 2.9% 4.0 3081 11,822 0.07 VMBSiShares GNMA Bond ETF 13.3 5.8% 0.4% 1.1% 3.6% 8.6% 2.2% 0.71 2.7% 1.6 88 178 0.15 GNMA
113 Intermediate-Term Government FundsAverage-Risk Portfolios with Bonds of the Highest Quality and Medium-Term Average Maturities
T. Rowe Price US Treasury Interm 18.5 7.6% 0.3% 2.2% 5.4% 10.9% 2.2% 1.14 1.9% 5.8 89 656 0.36 PRTIXFidelity® Government Income 17.6 7.2% 0.1% 2.2% 5.2% 10.2% 2.4% 1.00 2.1% 5.4 548 2,783 0.45 FGOVXVanguard Interm-Term Treasury Inv 17.0 7.1% 0.2% 1.9% 4.9% 10.2% 2.2% 1.02 2.4% 5.3 127 6,212 0.20 VFITXAmerican Century Government Bond Inv 16.0 6.7% 0.0% 1.8% 4.7% 9.5% 2.3% 0.92 2.5% 4.9 213 733 0.47 CPTNXBrown Advisory Mortgage Securities Inv 15.3 7.0% 0.1% 1.7% 4.4% 9.2% 2.5% 0.80 2.3% 4.1 371 262 0.52 BIAZXUSAA Government Securities 13.6 5.9% 0.3% 1.4% 3.8% 8.4% 2.1% 0.71 2.4% 3.6 254 1,074 0.46 USGNXFidelity® Intermediate Government Income 12.7 5.3% 0.2% 1.5% 3.7% 7.5% 1.9% 0.70 1.9% 3.8 254 526 0.45 FSTGXCentre Active US Treasury Investor 5.5 1.3% 0.0% 0.5% 1.0% 4.0% 0.7% 0.65 1.7% na 18 35 1.10 DHTRX
114 Intermediate-Term Government Bond ETFsAverage-Risk Portfolios with Bonds of the Highest Quality and Medium-Term Average Maturities
iShares US Treasury Bond ETF 19.2 8.3% 0.0% 2.5% 5.8% 10.9% 2.5% 1.14 2.0% 6.5 133 14,828 0.15 GOVTVanguard Intmdt-Term Trs ETF 17.3 7.0% 0.3% 2.0% 5.0% 10.2% 2.4% 1.01 2.2% 5.2 119 7,450 0.07 VGITSchwab Intermediate-Term US Trs ETF™ 17.1 6.9% 0.3% 2.0% 5.0% 10.1% 2.4% 1.01 2.3% 5.2 108 4,649 0.06 SCHRiShares 3-7 Year Treasury Bond ETF 15.2 6.3% 0.3% 1.8% 4.4% 9.1% 2.2% 0.87 2.1% 4.5 85 9,326 0.15 IEI
117 Intermediate-Term Corporate Bond FundsAverage-Risk Portfolios with Bonds of Generally Good Quality and Medium-Term Average Maturities
Vanguard Interm-Term Bond Index Inv 22.4 10.6% 0.4% 2.6% 6.5% 13.3% 3.5% 1.18 2.6% 6.3 1861 34,618 0.15 VBIIXUSAA Income 20.3 10.7% 0.4% 2.4% 5.9% 11.9% 4.2% 0.97 3.2% 6.0 1074 8,537 0.52 USAIXFidelity® Investment Grade Bond 20.1 9.8% 0.5% 2.4% 5.7% 12.1% 3.7% 0.93 3.0% 5.4 929 5,564 0.45 FBNDXVanguard Interm-Term Invmt-Grade Inv 20.1 10.3% 0.5% 2.3% 5.7% 12.1% 3.7% 0.98 3.1% 5.5 1906 31,847 0.20 VFICXParnassus Fixed-Income 20.0 10.3% 0.2% 2.3% 5.9% 11.8% 3.3% 0.98 2.4% 6.4 88 234 0.68 PRFIXCarillon Reams Core Plus Bond Y 19.8 8.3% 0.2% 2.4% 5.5% 11.9% 3.0% 1.04 1.8% 5.9 92 642 0.80 SCPYXVanguard Total Bond Market II Idx Inv 19.7 8.8% 0.2% 2.4% 5.8% 11.5% 3.2% 1.01 2.7% 6.2 14141 189,972 0.09 VTBIXVanguard Total Bond Market Index Adm 19.6 8.9% 0.2% 2.4% 5.8% 11.5% 3.3% 1.00 2.7% 6.2 17498 244,963 0.05 VBTLXMetropolitan West Total Return Bd M 19.6 9.1% 0.4% 2.3% 5.7% 11.6% 3.3% 0.94 2.6% 5.8 1851 79,097 0.67 MWTRXThrift Savings Plan F Fund 19.5 10.8% 0.3% 2.3% 5.7% 11.5% 3.4% na na na na na 0.03 THRIFTFT. Rowe Price US Bond Enhanced Index 19.5 8.9% 0.2% 2.3% 5.8% 11.4% 3.3% 1.00 2.9% 5.8 1040 1,182 0.30 PBDIXVanguard Total Bond Market Index Inv 19.5 8.8% 0.2% 2.4% 5.7% 11.4% 3.2% 1.00 2.6% 6.2 17498 244,963 0.15 VBMFXNorthern Bond Index 19.4 8.8% 0.3% 2.3% 5.7% 11.4% 3.2% 0.99 2.8% 5.6 3383 2,854 0.15 NOBOXBNY Mellon Bond Market Index I 19.3 8.7% 0.2% 2.2% 5.7% 11.4% 3.1% 0.99 2.8% 5.8 2469 1,147 0.15 DBIRXNorthern Fixed Income 19.3 10.6% 0.2% 2.3% 5.7% 11.3% 3.4% 0.96 3.1% 5.6 269 834 0.45 NOFIXAberdeen Total Return Bond A 19.2 9.2% 0.2% 2.1% 5.4% 11.7% 3.1% 0.96 2.2% 5.7 177 182 0.69 BJBGXUSAA Intermediate-Term Bond 19.2 10.7% 0.5% 2.3% 5.5% 11.4% 4.5% 0.89 3.6% 5.8 658 3,822 0.59 USIBXDomini Impact Bond Investor 19.1 9.4% 0.2% 2.3% 5.6% 11.3% 3.2% 0.93 2.5% na 391 159 0.87 DSBFXJanus Henderson Flexible Bond T 18.9 9.2% 0.3% 2.4% 5.9% 10.7% 3.0% 0.89 2.9% 6.3 476 3,962 0.70 JAFIXT. Rowe Price New Income 18.9 9.1% 0.3% 2.2% 5.5% 11.3% 3.3% 0.94 2.9% 5.8 1536 24,736 0.52 PRCIXElfun Income 18.7 9.3% 0.3% 2.2% 5.3% 11.2% 3.3% 0.95 2.8% na 1150 236 0.35 EINFXSegall Bryant & Hamill Plus Bond Ret 18.6 9.0% 0.3% 2.1% 5.5% 10.9% 3.7% 0.90 3.3% 5.7 191 1,072 0.55 WTIBXFidelity® Total Bond Fund 18.4 9.7% 0.4% 2.1% 5.2% 11.1% 3.7% 0.86 3.3% 5.2 2688 26,072 0.45 FTBFXValue Line Core Bond 18.4 8.8% 0.3% 2.2% 5.5% 10.7% 2.8% 0.93 2.4% 5.8 233 54 0.90 VAGIX
----------------Performance----------------
MOMYTD
Return1 Mo
Return3 Mo
Return6 Mo
Return12 MoReturn
3 YrAvg
Return
3 YrRelRisk
CurrentYield(%)
AvgDuration
(Yrs)NumberHoldings
NetAssets
ExpRatio(%)
NasdaqTicker
Performance numbers reflect periods ending 10/31/2019. Funds shown in bold are the recommendations in the November 2019 issue for SMI’s two Basic strategies.Although gathered from reliable sources, data accuracy cannot be guaranteed.
Page 6Fund Performance Rankings | SoundMindInvesting.com

Commerce Bond 18.3 9.1% 0.3% 2.0% 5.4% 10.9% 3.7% 0.87 3.1% 5.6 458 1,185 0.66 CFBNXAmerican Century Core Plus Inv 18.0 9.2% 0.2% 2.0% 5.3% 10.7% 3.3% 0.92 3.0% 5.7 617 152 0.55 ACCNXDodge & Cox Income 17.3 9.3% 0.4% 2.0% 4.8% 10.4% 4.0% 0.70 3.1% 4.2 1079 62,935 0.42 DODIXFirst Western Fixed Income 15.5 7.6% 0.4% 1.9% 4.5% 9.1% 3.6% 0.68 2.8% na 166 80 0.60 FWFIXFidelity® Intermediate Bond 15.1 7.3% 0.5% 1.8% 4.4% 8.9% 2.8% 0.69 2.5% 4.0 648 2,713 0.45 FTHRXBrown Advisory Intermediate Income Adv 13.9 6.7% 0.4% 1.7% 4.0% 8.2% 2.4% 0.66 2.3% 3.9 133 146 0.82 BAIAX
118 Intermediate-Term Corporate Bond ETFsAverage-Risk Portfolios with Bonds of Generally Good Quality and Medium-Term Average Maturities
iShares iBoxx $ Invmt Grade Corp Bd ETF 30.5 16.2% 0.4% 3.6% 9.0% 17.9% 5.3% 1.48 3.3% 9.0 2083 34,602 0.15 LQDFidelity® Corporate Bond ETF 26.4 14.6% 0.5% 3.2% 7.5% 15.8% 4.9% 1.21 3.2% 7.5 348 144 0.36 FCORVanguard Interm-Term Corp Bd ETF 25.0 13.5% 0.7% 2.9% 7.2% 15.0% 4.7% 1.16 3.4% 6.2 1816 26,913 0.07 VCITVanguard Interm-Term Bond ETF 22.8 10.7% 0.4% 2.7% 6.6% 13.5% 3.5% 1.19 2.7% 6.3 1861 34,618 0.07 BIViShares Government/Credit Bond ETF 21.6 9.8% 0.1% 2.8% 6.4% 12.4% 3.4% 1.09 2.5% 6.8 2246 299 0.20 GBFVanguard Total Bond Market ETF 20.0 9.0% 0.3% 2.5% 5.8% 11.7% 3.3% 1.00 2.7% 6.2 17498 244,963 0.04 BNDiShares Core US Aggregate Bond ETF 19.3 8.5% 0.2% 2.4% 5.7% 11.3% 3.2% 0.97 2.7% 5.5 7615 65,539 0.05 AGGSchwab US Aggregate Bond ETF™ 19.3 8.8% 0.2% 2.3% 5.6% 11.3% 3.2% 0.98 2.8% 5.8 6054 7,085 0.04 SCHZiShares Core Total USD Bond Market ETF 18.7 9.0% 0.3% 2.2% 5.3% 11.3% 3.4% 0.90 3.0% 5.4 8615 4,069 0.06 IUSBFidelity® Total Bond ETF 18.5 9.4% 0.4% 2.2% 5.2% 11.1% 3.6% 0.87 2.9% 5.3 1157 874 0.36 FBNDPIMCO Active Bond ETF 17.3 8.5% 0.0% 1.7% 4.8% 10.8% 3.9% 0.89 3.4% 5.0 802 2,740 0.73 BONDiShares Intermediate Govt/Crdt Bd ETF 14.6 6.7% 0.4% 1.8% 4.2% 8.6% 2.5% 0.69 2.3% 3.9 3280 1,984 0.20 GVI
121 Long-Term Government Bond FundsAbove-Average-Risk Portfolios with Bonds of the Highest Quality and Long-Term Average Maturities
Wasatch-Hoisington US Treasury 60.3 22.1% -1.2% 8.4% 18.9% 33.0% 5.4% 4.19 1.8% 22.3 9 358 0.70 WHOSXT. Rowe Price US Treasury Long-Term 48.7 18.1% -1.0% 6.7% 15.2% 26.8% 4.9% 3.33 2.3% 18.5 76 5,207 0.30 PRULXVanguard Long-Term Treasury Inv 48.5 18.1% -1.1% 6.6% 15.1% 26.8% 4.9% 3.34 2.5% 17.4 61 3,917 0.20 VUSTXAmerican Century Zero Coupon 2025 Inv 20.2 8.3% 0.3% 2.2% 5.9% 12.1% 2.5% 1.43 3.4% 6.0 17 130 0.55 BTTRX
122 Long-Term Government Bond ETFsAbove-Average-Risk Portfolios with Bonds of the Highest Quality and Long-Term Average Maturities
PIMCO 25+ Year Zero Coupon US Trs ETF 77.6 28.0% -1.6% 10.9% 24.3% 42.4% 7.1% 5.27 2.2% 27.4 21 277 0.15 ZROZVanguard Extended Duration Trs ETF 67.9 24.5% -2.0% 9.2% 21.3% 37.4% 6.5% 4.78 2.4% 24.3 82 2,695 0.07 EDViShares 20+ Year Treasury Bond ETF 50.0 18.4% -1.1% 6.9% 15.6% 27.5% 5.1% 3.41 2.3% 18.0 38 17,200 0.15 TLTVanguard Long-Term Treasury ETF 49.0 18.2% -1.1% 6.6% 15.3% 27.2% 5.1% 3.33 2.4% 17.9 52 3,360 0.07 VGLTiShares 10-20 Year Treasury Bond ETF 34.7 13.2% -0.5% 4.2% 10.7% 19.8% 3.8% 2.18 2.2% 12.4 13 1,210 0.15 TLHInvesco 1-30 Laddered Treasury ETF 32.6 12.5% -0.4% 4.2% 10.2% 18.1% 3.6% 2.09 1.9% 11.4 29 181 0.25 PLWiShares 7-10 Year Treasury Bond ETF 24.7 9.8% 0.2% 2.9% 7.4% 14.4% 2.8% 1.53 2.2% 7.5 21 18,627 0.15 IEF
125 Long-Term Corporate Bond FundsAbove-Average-Risk Portfolios with Bonds of Generally Good Quality and Long-Term Average Maturities
Vanguard Long-Term Bond Index Investor 44.9 20.3% -0.2% 5.7% 13.8% 25.5% 6.3% 2.56 3.3% 15.7 2277 12,614 0.15 VBLTXVanguard Long-Term Investment-Grade Inv 43.0 20.9% 0.1% 5.0% 13.2% 24.8% 6.9% 2.33 3.6% 13.8 932 19,184 0.22 VWESX
126 Long-Term Corporate Bond ETFsAbove-Average-Risk Portfolios with Bonds of Generally Good Quality and Long-Term Average Maturities
Vanguard Long-Term Bond ETF 45.2 19.9% -0.3% 5.8% 13.8% 25.6% 6.4% 2.56 3.3% 15.7 2277 12,614 0.07 BLViShares Core 10+ Year USD Bond ETF 43.6 20.3% -0.2% 5.1% 13.4% 25.1% 6.5% 2.38 3.5% 15.0 1982 305 0.06 ILTBVanguard Long-Term Corporate Bd ETF 42.6 22.4% 0.3% 4.9% 12.9% 24.8% 7.3% 2.24 3.9% 14.3 2049 4,743 0.07 VCLT
129 Inflation-Protected Bond FundsAverage-Risk Portfolios that Invest in Bonds that Increase Coupon and/or Principal Payments at the Rate of Inflation
T. Rowe Price Inflation Protected Bd 14.6 8.0% 0.0% 1.4% 4.2% 9.1% 2.3% 0.99 0.8% 5.1 166 373 0.41 PRIPXSchwab® Treasury Infl Protected Secs Idx 14.4 7.8% 0.3% 1.2% 4.2% 8.9% 2.4% 0.96 2.3% 7.7 41 981 0.05 SWRSXVanguard Inflation-Protected Secs Inv 13.2 7.4% -0.1% 1.0% 3.8% 8.4% 2.1% 0.96 2.3% 7.8 43 28,061 0.20 VIPSXAmerican Century Inflation Adjs Bond Inv 12.6 7.3% -0.1% 0.9% 3.6% 8.1% 1.9% 0.96 2.0% 7.8 111 2,494 0.47 ACITXBNY Mellon Inflation Adjusted Sec Inv 8.9 5.3% 0.1% 0.5% 2.5% 5.9% 1.3% 0.68 1.3% 5.1 18 86 0.80 DIAVXVanguard Shrt-Term Infl-Prot Sec Idx Inv 6.3 3.9% 0.2% 0.5% 1.7% 4.0% 1.6% 0.33 1.9% 2.6 16 31,751 0.14 VTIPX
----------------Performance----------------
MOMYTD
Return1 Mo
Return3 Mo
Return6 Mo
Return12 MoReturn
3 YrAvg
Return
3 YrRelRisk
CurrentYield(%)
AvgDuration
(Yrs)NumberHoldings
NetAssets
ExpRatio(%)
NasdaqTicker
Performance numbers reflect periods ending 10/31/2019. Funds shown in bold are the recommendations in the November 2019 issue for SMI’s two Basic strategies.Although gathered from reliable sources, data accuracy cannot be guaranteed.
Page 7Fund Performance Rankings | SoundMindInvesting.com
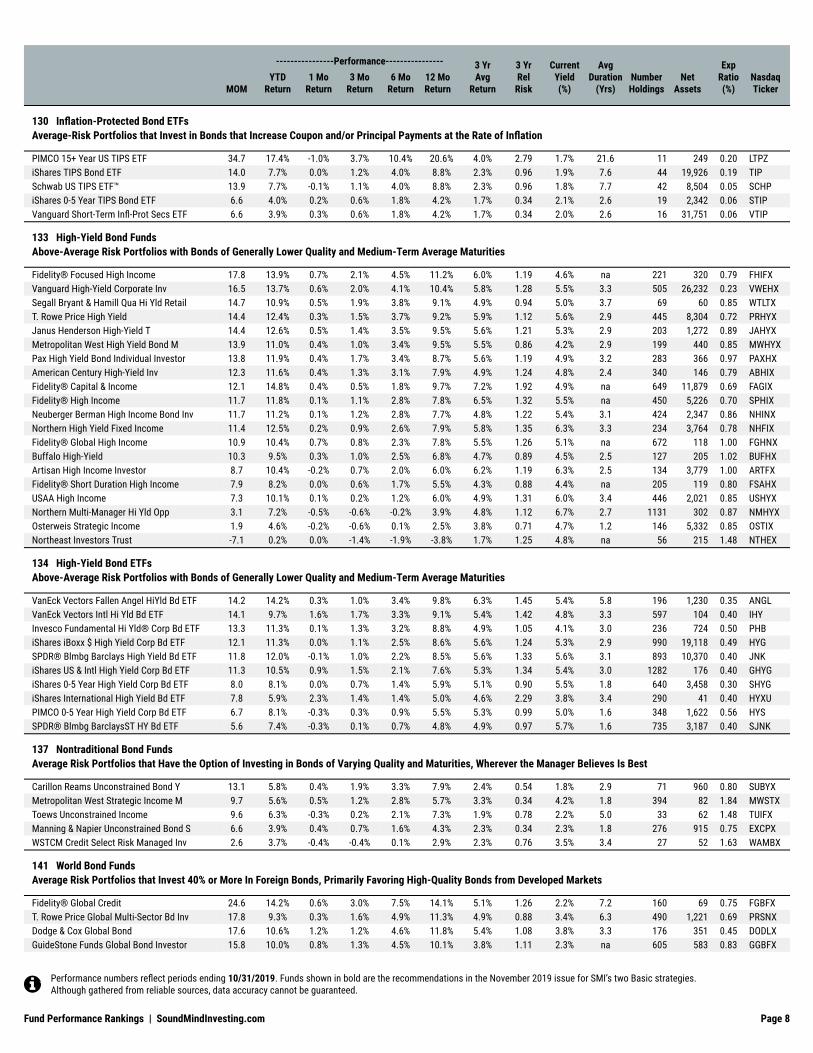
130 Inflation-Protected Bond ETFsAverage-Risk Portfolios that Invest in Bonds that Increase Coupon and/or Principal Payments at the Rate of Inflation
PIMCO 15+ Year US TIPS ETF 34.7 17.4% -1.0% 3.7% 10.4% 20.6% 4.0% 2.79 1.7% 21.6 11 249 0.20 LTPZiShares TIPS Bond ETF 14.0 7.7% 0.0% 1.2% 4.0% 8.8% 2.3% 0.96 1.9% 7.6 44 19,926 0.19 TIPSchwab US TIPS ETF™ 13.9 7.7% -0.1% 1.1% 4.0% 8.8% 2.3% 0.96 1.8% 7.7 42 8,504 0.05 SCHPiShares 0-5 Year TIPS Bond ETF 6.6 4.0% 0.2% 0.6% 1.8% 4.2% 1.7% 0.34 2.1% 2.6 19 2,342 0.06 STIPVanguard Short-Term Infl-Prot Secs ETF 6.6 3.9% 0.3% 0.6% 1.8% 4.2% 1.7% 0.34 2.0% 2.6 16 31,751 0.06 VTIP
133 High-Yield Bond FundsAbove-Average Risk Portfolios with Bonds of Generally Lower Quality and Medium-Term Average Maturities
Fidelity® Focused High Income 17.8 13.9% 0.7% 2.1% 4.5% 11.2% 6.0% 1.19 4.6% na 221 320 0.79 FHIFXVanguard High-Yield Corporate Inv 16.5 13.7% 0.6% 2.0% 4.1% 10.4% 5.8% 1.28 5.5% 3.3 505 26,232 0.23 VWEHXSegall Bryant & Hamill Qua Hi Yld Retail 14.7 10.9% 0.5% 1.9% 3.8% 9.1% 4.9% 0.94 5.0% 3.7 69 60 0.85 WTLTXT. Rowe Price High Yield 14.4 12.4% 0.3% 1.5% 3.7% 9.2% 5.9% 1.12 5.6% 2.9 445 8,304 0.72 PRHYXJanus Henderson High-Yield T 14.4 12.6% 0.5% 1.4% 3.5% 9.5% 5.6% 1.21 5.3% 2.9 203 1,272 0.89 JAHYXMetropolitan West High Yield Bond M 13.9 11.0% 0.4% 1.0% 3.4% 9.5% 5.5% 0.86 4.2% 2.9 199 440 0.85 MWHYXPax High Yield Bond Individual Investor 13.8 11.9% 0.4% 1.7% 3.4% 8.7% 5.6% 1.19 4.9% 3.2 283 366 0.97 PAXHXAmerican Century High-Yield Inv 12.3 11.6% 0.4% 1.3% 3.1% 7.9% 4.9% 1.24 4.8% 2.4 340 146 0.79 ABHIXFidelity® Capital & Income 12.1 14.8% 0.4% 0.5% 1.8% 9.7% 7.2% 1.92 4.9% na 649 11,879 0.69 FAGIXFidelity® High Income 11.7 11.8% 0.1% 1.1% 2.8% 7.8% 6.5% 1.32 5.5% na 450 5,226 0.70 SPHIXNeuberger Berman High Income Bond Inv 11.7 11.2% 0.1% 1.2% 2.8% 7.7% 4.8% 1.22 5.4% 3.1 424 2,347 0.86 NHINXNorthern High Yield Fixed Income 11.4 12.5% 0.2% 0.9% 2.6% 7.9% 5.8% 1.35 6.3% 3.3 234 3,764 0.78 NHFIXFidelity® Global High Income 10.9 10.4% 0.7% 0.8% 2.3% 7.8% 5.5% 1.26 5.1% na 672 118 1.00 FGHNXBuffalo High-Yield 10.3 9.5% 0.3% 1.0% 2.5% 6.8% 4.7% 0.89 4.5% 2.5 127 205 1.02 BUFHXArtisan High Income Investor 8.7 10.4% -0.2% 0.7% 2.0% 6.0% 6.2% 1.19 6.3% 2.5 134 3,779 1.00 ARTFXFidelity® Short Duration High Income 7.9 8.2% 0.0% 0.6% 1.7% 5.5% 4.3% 0.88 4.4% na 205 119 0.80 FSAHXUSAA High Income 7.3 10.1% 0.1% 0.2% 1.2% 6.0% 4.9% 1.31 6.0% 3.4 446 2,021 0.85 USHYXNorthern Multi-Manager Hi Yld Opp 3.1 7.2% -0.5% -0.6% -0.2% 3.9% 4.8% 1.12 6.7% 2.7 1131 302 0.87 NMHYXOsterweis Strategic Income 1.9 4.6% -0.2% -0.6% 0.1% 2.5% 3.8% 0.71 4.7% 1.2 146 5,332 0.85 OSTIXNortheast Investors Trust -7.1 0.2% 0.0% -1.4% -1.9% -3.8% 1.7% 1.25 4.8% na 56 215 1.48 NTHEX
134 High-Yield Bond ETFsAbove-Average Risk Portfolios with Bonds of Generally Lower Quality and Medium-Term Average Maturities
VanEck Vectors Fallen Angel HiYld Bd ETF 14.2 14.2% 0.3% 1.0% 3.4% 9.8% 6.3% 1.45 5.4% 5.8 196 1,230 0.35 ANGLVanEck Vectors Intl Hi Yld Bd ETF 14.1 9.7% 1.6% 1.7% 3.3% 9.1% 5.4% 1.42 4.8% 3.3 597 104 0.40 IHYInvesco Fundamental Hi Yld® Corp Bd ETF 13.3 11.3% 0.1% 1.3% 3.2% 8.8% 4.9% 1.05 4.1% 3.0 236 724 0.50 PHBiShares iBoxx $ High Yield Corp Bd ETF 12.1 11.3% 0.0% 1.1% 2.5% 8.6% 5.6% 1.24 5.3% 2.9 990 19,118 0.49 HYGSPDR® Blmbg Barclays High Yield Bd ETF 11.8 12.0% -0.1% 1.0% 2.2% 8.5% 5.6% 1.33 5.6% 3.1 893 10,370 0.40 JNKiShares US & Intl High Yield Corp Bd ETF 11.3 10.5% 0.9% 1.5% 2.1% 7.6% 5.3% 1.34 5.4% 3.0 1282 176 0.40 GHYGiShares 0-5 Year High Yield Corp Bd ETF 8.0 8.1% 0.0% 0.7% 1.4% 5.9% 5.1% 0.90 5.5% 1.8 640 3,458 0.30 SHYGiShares International High Yield Bd ETF 7.8 5.9% 2.3% 1.4% 1.4% 5.0% 4.6% 2.29 3.8% 3.4 290 41 0.40 HYXUPIMCO 0-5 Year High Yield Corp Bd ETF 6.7 8.1% -0.3% 0.3% 0.9% 5.5% 5.3% 0.99 5.0% 1.6 348 1,622 0.56 HYSSPDR® Blmbg BarclaysST HY Bd ETF 5.6 7.4% -0.3% 0.1% 0.7% 4.8% 4.9% 0.97 5.7% 1.6 735 3,187 0.40 SJNK
137 Nontraditional Bond FundsAverage Risk Portfolios that Have the Option of Investing in Bonds of Varying Quality and Maturities, Wherever the Manager Believes Is Best
Carillon Reams Unconstrained Bond Y 13.1 5.8% 0.4% 1.9% 3.3% 7.9% 2.4% 0.54 1.8% 2.9 71 960 0.80 SUBYXMetropolitan West Strategic Income M 9.7 5.6% 0.5% 1.2% 2.8% 5.7% 3.3% 0.34 4.2% 1.8 394 82 1.84 MWSTXToews Unconstrained Income 9.6 6.3% -0.3% 0.2% 2.1% 7.3% 1.9% 0.78 2.2% 5.0 33 62 1.48 TUIFXManning & Napier Unconstrained Bond S 6.6 3.9% 0.4% 0.7% 1.6% 4.3% 2.3% 0.34 2.3% 1.8 276 915 0.75 EXCPXWSTCM Credit Select Risk Managed Inv 2.6 3.7% -0.4% -0.4% 0.1% 2.9% 2.3% 0.76 3.5% 3.4 27 52 1.63 WAMBX
141 World Bond FundsAverage Risk Portfolios that Invest 40% or More In Foreign Bonds, Primarily Favoring High-Quality Bonds from Developed Markets
Fidelity® Global Credit 24.6 14.2% 0.6% 3.0% 7.5% 14.1% 5.1% 1.26 2.2% 7.2 160 69 0.75 FGBFXT. Rowe Price Global Multi-Sector Bd Inv 17.8 9.3% 0.3% 1.6% 4.9% 11.3% 4.9% 0.88 3.4% 6.3 490 1,221 0.69 PRSNXDodge & Cox Global Bond 17.6 10.6% 1.2% 1.2% 4.6% 11.8% 5.4% 1.08 3.8% 3.3 176 351 0.45 DODLXGuideStone Funds Global Bond Investor 15.8 10.0% 0.8% 1.3% 4.5% 10.1% 3.8% 1.11 2.3% na 605 583 0.83 GGBFX
----------------Performance----------------
MOMYTD
Return1 Mo
Return3 Mo
Return6 Mo
Return12 MoReturn
3 YrAvg
Return
3 YrRelRisk
CurrentYield(%)
AvgDuration
(Yrs)NumberHoldings
NetAssets
ExpRatio(%)
NasdaqTicker
Performance numbers reflect periods ending 10/31/2019. Funds shown in bold are the recommendations in the November 2019 issue for SMI’s two Basic strategies.Although gathered from reliable sources, data accuracy cannot be guaranteed.
Page 8Fund Performance Rankings | SoundMindInvesting.com
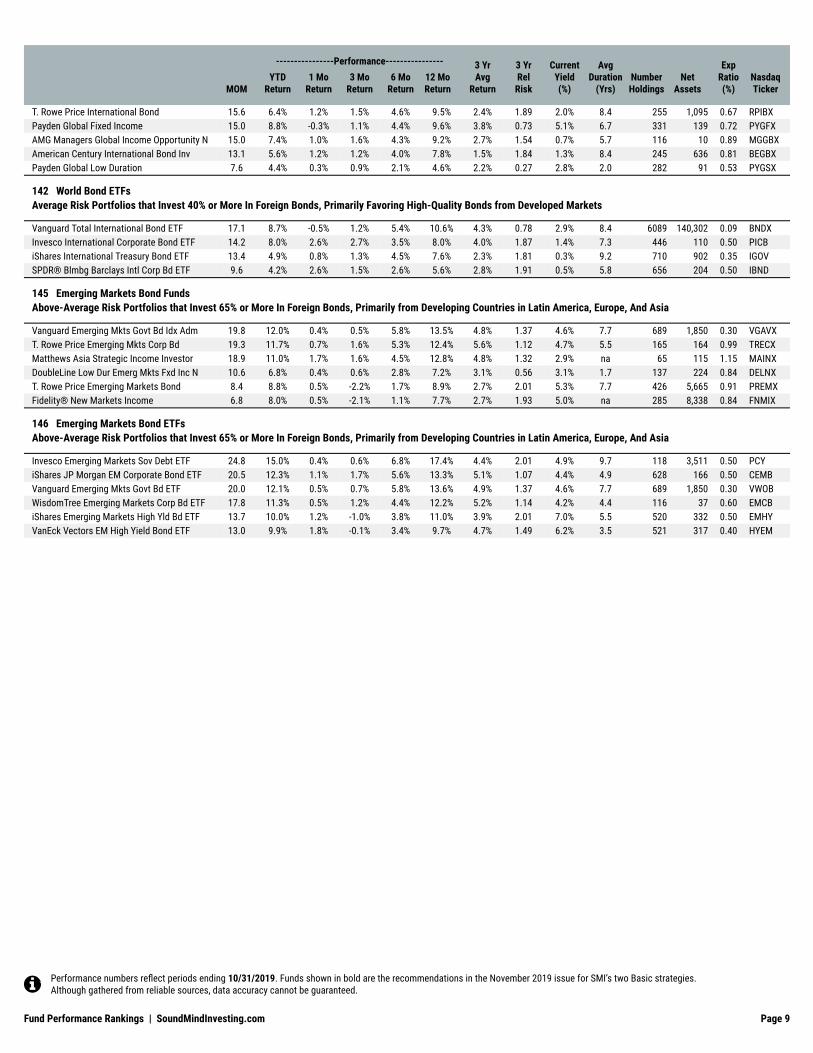
T. Rowe Price International Bond 15.6 6.4% 1.2% 1.5% 4.6% 9.5% 2.4% 1.89 2.0% 8.4 255 1,095 0.67 RPIBXPayden Global Fixed Income 15.0 8.8% -0.3% 1.1% 4.4% 9.6% 3.8% 0.73 5.1% 6.7 331 139 0.72 PYGFXAMG Managers Global Income Opportunity N 15.0 7.4% 1.0% 1.6% 4.3% 9.2% 2.7% 1.54 0.7% 5.7 116 10 0.89 MGGBXAmerican Century International Bond Inv 13.1 5.6% 1.2% 1.2% 4.0% 7.8% 1.5% 1.84 1.3% 8.4 245 636 0.81 BEGBXPayden Global Low Duration 7.6 4.4% 0.3% 0.9% 2.1% 4.6% 2.2% 0.27 2.8% 2.0 282 91 0.53 PYGSX
142 World Bond ETFsAverage Risk Portfolios that Invest 40% or More In Foreign Bonds, Primarily Favoring High-Quality Bonds from Developed Markets
Vanguard Total International Bond ETF 17.1 8.7% -0.5% 1.2% 5.4% 10.6% 4.3% 0.78 2.9% 8.4 6089 140,302 0.09 BNDXInvesco International Corporate Bond ETF 14.2 8.0% 2.6% 2.7% 3.5% 8.0% 4.0% 1.87 1.4% 7.3 446 110 0.50 PICBiShares International Treasury Bond ETF 13.4 4.9% 0.8% 1.3% 4.5% 7.6% 2.3% 1.81 0.3% 9.2 710 902 0.35 IGOVSPDR® Blmbg Barclays Intl Corp Bd ETF 9.6 4.2% 2.6% 1.5% 2.6% 5.6% 2.8% 1.91 0.5% 5.8 656 204 0.50 IBND
145 Emerging Markets Bond FundsAbove-Average Risk Portfolios that Invest 65% or More In Foreign Bonds, Primarily from Developing Countries in Latin America, Europe, And Asia
Vanguard Emerging Mkts Govt Bd Idx Adm 19.8 12.0% 0.4% 0.5% 5.8% 13.5% 4.8% 1.37 4.6% 7.7 689 1,850 0.30 VGAVXT. Rowe Price Emerging Mkts Corp Bd 19.3 11.7% 0.7% 1.6% 5.3% 12.4% 5.6% 1.12 4.7% 5.5 165 164 0.99 TRECXMatthews Asia Strategic Income Investor 18.9 11.0% 1.7% 1.6% 4.5% 12.8% 4.8% 1.32 2.9% na 65 115 1.15 MAINXDoubleLine Low Dur Emerg Mkts Fxd Inc N 10.6 6.8% 0.4% 0.6% 2.8% 7.2% 3.1% 0.56 3.1% 1.7 137 224 0.84 DELNXT. Rowe Price Emerging Markets Bond 8.4 8.8% 0.5% -2.2% 1.7% 8.9% 2.7% 2.01 5.3% 7.7 426 5,665 0.91 PREMXFidelity® New Markets Income 6.8 8.0% 0.5% -2.1% 1.1% 7.7% 2.7% 1.93 5.0% na 285 8,338 0.84 FNMIX
146 Emerging Markets Bond ETFsAbove-Average Risk Portfolios that Invest 65% or More In Foreign Bonds, Primarily from Developing Countries in Latin America, Europe, And Asia
Invesco Emerging Markets Sov Debt ETF 24.8 15.0% 0.4% 0.6% 6.8% 17.4% 4.4% 2.01 4.9% 9.7 118 3,511 0.50 PCYiShares JP Morgan EM Corporate Bond ETF 20.5 12.3% 1.1% 1.7% 5.6% 13.3% 5.1% 1.07 4.4% 4.9 628 166 0.50 CEMBVanguard Emerging Mkts Govt Bd ETF 20.0 12.1% 0.5% 0.7% 5.8% 13.6% 4.9% 1.37 4.6% 7.7 689 1,850 0.30 VWOBWisdomTree Emerging Markets Corp Bd ETF 17.8 11.3% 0.5% 1.2% 4.4% 12.2% 5.2% 1.14 4.2% 4.4 116 37 0.60 EMCBiShares Emerging Markets High Yld Bd ETF 13.7 10.0% 1.2% -1.0% 3.8% 11.0% 3.9% 2.01 7.0% 5.5 520 332 0.50 EMHYVanEck Vectors EM High Yield Bond ETF 13.0 9.9% 1.8% -0.1% 3.4% 9.7% 4.7% 1.49 6.2% 3.5 521 317 0.40 HYEM
----------------Performance----------------
MOMYTD
Return1 Mo
Return3 Mo
Return6 Mo
Return12 MoReturn
3 YrAvg
Return
3 YrRelRisk
CurrentYield(%)
AvgDuration
(Yrs)NumberHoldings
NetAssets
ExpRatio(%)
NasdaqTicker
Performance numbers reflect periods ending 10/31/2019. Funds shown in bold are the recommendations in the November 2019 issue for SMI’s two Basic strategies.Although gathered from reliable sources, data accuracy cannot be guaranteed.
Page 9Fund Performance Rankings | SoundMindInvesting.com

160 Retirement Income FundsLower-Risk Hybrid Portfolios that Provide a Mix of Stocks, Bonds, and Cash to Provide Investors with Steady Income Throughout Retirement
Vanguard Target Retirement Income Inv 16.7 11.2% 0.8% 2.0% 4.2% 10.5% 5.8% 0.50 2.5% 18% 69% 0% 17,099 0.12 VTINXManning & Napier Target Income K 16.3 11.4% 0.8% 1.8% 4.2% 10.3% 5.3% 0.54 1.7% 21% 71% na 78 0.90 MTDKXFidelity Freedom® Index Income Investor 15.8 9.4% 0.6% 2.0% 4.1% 9.7% 5.0% 0.37 2.1% 12% 66% 0% 504 0.12 FIKFXFidelity Freedom® Income 14.5 9.0% 0.8% 1.8% 3.7% 9.0% 5.0% 0.39 1.9% 7% 56% -2% 3,390 0.47 FFFAXAmerican Century One Choice In Ret Inv 14.4 12.8% 0.9% 1.5% 3.2% 9.8% 6.5% 0.75 2.4% 33% 43% 0% 1,486 0.77 ARTOXThrift Savings Plan L Income 8.2 4.7% 0.7% 1.1% 1.9% 5.2% 4.7% na na na na na na 0.03 LINCOME
161 Conservative Allocation FundsLower-Risk Hybrid Portfolios that Typically Have 20%-50% of Assets in Equities and 80%-50% of Assets in Fixed Income and Cash
Vanguard Wellesley® Income Inv 22.7 14.4% 0.6% 2.9% 6.0% 13.8% 7.3% 0.61 2.8% 30% 58% na 58,559 0.23 VWINXVanguard LifeStrategy Income Inv 18.8 11.0% 0.5% 2.2% 5.1% 11.6% 5.3% 0.41 2.7% 12% 78% 0% 4,714 0.11 VASIXVanguard LifeStrategy Cnsrv Gr Inv 18.8 13.1% 1.0% 2.3% 4.6% 11.9% 6.9% 0.63 2.5% 24% 59% 0% 10,473 0.12 VSCGXManning & Napier Pro-Blend Mod Term S 18.4 13.2% 0.8% 1.9% 4.7% 11.9% 6.1% 0.70 1.2% 25% 61% 0% 390 1.04 EXBAXUSAA Growth and Tax Strategy 17.5 14.5% 1.0% 1.7% 4.0% 11.9% 8.7% 0.80 2.2% 47% 52% na 593 0.61 USBLXWeitz Balanced Fund - Investor 17.3 15.1% 0.6% 1.7% 3.3% 12.3% 8.4% 0.78 0.9% 37% 48% na 140 0.85 WBALXGuideStone Funds Balanced Allc Inv 17.3 14.1% 1.5% 2.0% 3.5% 11.7% 7.0% 0.83 3.7% 28% 51% 0% 1,583 1.02 GGIZXUSAA Cornerstone Conservative 16.8 10.7% 0.7% 2.0% 4.3% 10.5% 4.9% 0.46 2.9% 11% 75% 0% 208 0.63 USCCXManning & Napier Pro-Blend Cnsrv Term S 16.6 11.2% 0.7% 1.9% 4.4% 10.4% 5.5% 0.51 1.6% 22% 71% na 910 0.87 EXDAXSchwab MarketTrack Conservative 16.5 12.3% 1.2% 2.2% 4.0% 10.3% 6.2% 0.65 2.1% 30% 53% 0% 262 0.49 SWCGXPermanent Portfolio Permanent I 16.2 12.9% 1.3% 1.3% 3.7% 11.2% 5.2% 0.93 0.7% 35% 31% 29% 1,913 0.84 PRPFXVanguard Tax-Managed Balanced Adm 16.2 14.1% 1.1% 1.3% 3.5% 11.4% 8.8% 0.79 2.1% 48% 52% na 5,519 0.09 VTMFXUSAA Cornerstone Moderate 16.1 12.2% 1.3% 2.4% 3.7% 10.0% 6.1% 0.79 2.0% 26% 47% 0% 1,208 1.10 USBSXUSAA Cornerstone Moderately Cnsrv 15.9 10.9% 0.9% 2.2% 3.9% 9.8% 5.2% 0.65 2.1% 19% 56% 0% 235 0.99 UCMCXFidelity Asset Manager® 50% 15.7 13.9% 1.4% 2.0% 3.5% 10.3% 7.5% 0.88 1.8% 34% 36% 1% 9,382 0.65 FASMXNew Covenant Balanced Income 15.7 11.9% 1.0% 1.7% 3.7% 10.3% 6.2% 0.62 1.8% 32% 59% na 78 0.97 NCBIXFidelity Asset Manager® 40% 15.4 12.3% 1.1% 1.9% 3.6% 9.9% 6.6% 0.72 2.0% 27% 41% 1% 1,837 0.55 FFANXAmerican Century One Choice Cnsrv Inv 15.1 13.1% 0.9% 1.5% 3.5% 10.2% 6.4% 0.77 2.3% 32% 47% 0% 1,264 0.81 AOCIXAmerican Century Strat Allc: Cnsrv Inv 15.1 13.1% 0.9% 1.7% 3.3% 10.2% 6.3% 0.77 1.6% 28% 55% 0% 406 0.88 TWSCXTCW Conservative Allocation I 14.9 12.6% 0.7% 1.0% 3.4% 10.5% 5.8% 0.66 1.7% 30% 56% 0% 30 0.98 TGPCXFidelity Asset Manager® 30% 14.7 10.8% 0.9% 1.8% 3.6% 9.3% 5.6% 0.56 2.1% 21% 45% 1% 1,796 0.54 FTANXT. Rowe Price Retirement Balanced 14.7 11.9% 1.1% 1.5% 3.2% 9.9% 6.4% 0.65 1.8% 26% 57% 0% 2,158 0.51 TRRIXTIAA-CREF Lifestyle Conservative Retail 14.6 12.4% 1.1% 1.6% 3.3% 9.8% 6.4% 0.72 2.3% 27% 56% -0% 303 0.73 TSCLXT. Rowe Price Personal Strat Inc 14.5 11.9% 0.8% 1.1% 3.1% 10.3% 7.1% 0.67 2.3% 24% 46% 5% 2,320 0.62 PRSIXAmerican Century One Choice VryCnsrv Inv 14.1 10.3% 0.6% 1.4% 3.6% 9.1% 4.7% 0.47 2.3% 23% 66% 0% 436 0.71 AONIXFidelity Asset Manager® 20% 13.7 8.9% 0.7% 1.8% 3.5% 8.4% 4.6% 0.41 2.2% 13% 46% 1% 5,156 0.53 FASIXTIAA-CREF Lifestyle Income Retail 13.2 9.1% 0.6% 1.4% 3.3% 8.5% 4.5% 0.40 2.4% 14% 75% -0% 78 0.70 TSILXAmerican Century Multi-Asset Rl Ret Inv 12.6 12.7% 0.8% 0.9% 2.3% 9.3% 6.4% 0.88 2.6% 37% 37% 1% 12 0.93 ASIOXMeeder Conservative Allocation Retail 12.0 8.2% 0.6% 1.0% 3.1% 7.8% 5.2% 0.57 1.9% 23% 68% 0% 137 1.74 FLRUXAve Maria Bond 11.6 7.1% 0.6% 1.4% 2.9% 7.3% 4.0% 0.30 1.8% 16% 72% na 382 0.50 AVEFXGuideStone Funds Conservative Allc Inv 11.5 8.8% 0.9% 1.4% 2.4% 7.7% 4.6% 0.47 2.9% 16% 83% 0% 525 0.95 GFIZXBerwyn Income 11.5 8.1% 0.5% 1.5% 2.8% 7.2% 4.0% 0.44 3.2% 29% 65% na 1,016 0.64 BERIXJames Balanced: Golden Rainbow R 9.0 9.6% 0.7% 1.6% 2.4% 5.0% 2.5% 0.85 1.2% 42% 47% 1% 931 1.08 GLRBXFidelity® Strategic Real Return 8.7 9.1% 0.3% 1.3% 2.2% 5.2% 3.3% 0.57 2.8% 13% 55% 25% 367 0.83 FSRRXSMI 50/40/10 7.8 10.5% 1.0% 1.5% 2.7% 3.6% 7.0% 1.28 0.7% 56% 18% 0% 61 1.57 SMILX
162 Moderate Allocation FundsAverage-Risk Hybrid Portfolios that Typically Have 50%-70% of Assets in Equities and 50%-30% of Assets in Fixed Income and Cash
Value Line Asset Allocation Investor 24.4 21.6% 0.4% 0.6% 5.5% 18.3% 13.1% 1.09 0.3% 58% 29% na 937 1.07 VLAAXVanguard Wellington™ Inv 24.2 18.1% 1.4% 3.5% 6.1% 14.6% 11.0% 0.98 2.4% 52% 32% na 108,980 0.25 VWELXT. Rowe Price Capital Appreciation 21.9 19.5% 1.2% 1.1% 4.2% 16.6% 12.1% 1.02 2.0% 56% 23% na 36,514 0.71 PRWCX
Hybrid Fund RankingsDATA FOR PERIODS ENDING 10/31/2019
----------------Performance----------------
MOMYTD
Return1 Mo
Return3 Mo
Return6 Mo
Return12 MoReturn
3 YrAvg
Return
3 YrRelRisk
CurrentYield(%)
%InvestStocks
%InvestBonds
%InvestOther
NetAssets
ExpRatio(%)
NasdaqTicker
Performance numbers reflect periods ending 10/31/2019. Funds shown in bold are the recommendations in the November 2019 issue for SMI’s two Basic strategies.Although gathered from reliable sources, data accuracy cannot be guaranteed.
Page 10Fund Performance Rankings | SoundMindInvesting.com

Pax Balanced Individual Investor 20.9 16.4% 1.6% 2.9% 4.8% 13.1% 8.5% 0.99 1.5% 46% 37% 0% 1,849 0.91 PAXWXJanus Henderson Balanced T 20.5 17.1% 0.8% 2.3% 4.9% 13.3% 13.0% 0.98 1.7% 61% 35% na 18,248 0.82 JABAXVanguard Balanced Index Inv 19.4 17.1% 1.4% 2.1% 4.4% 13.0% 10.0% 1.00 2.0% 59% 39% na 43,209 0.18 VBINXGreen Century Balanced 19.0 17.0% 0.5% 1.1% 4.0% 13.9% 9.7% 0.99 0.4% 63% 30% 0% 282 1.48 GCBLXVanguard STAR Inv 18.9 16.8% 2.0% 2.3% 3.8% 12.7% 9.9% 1.09 2.2% 40% 35% 0% 22,225 0.31 VGSTXVanguard LifeStrategy Moderate Gr Inv 18.5 15.3% 1.5% 2.4% 3.9% 12.2% 8.6% 0.93 2.4% 36% 39% 0% 17,282 0.13 VSMGXT. Rowe Price Balanced 18.4 16.2% 1.5% 2.3% 3.6% 12.6% 9.7% 1.03 2.0% 41% 34% 0% 4,490 0.58 RPBAXElfun Diversified 18.0 15.3% 1.8% 2.4% 3.8% 11.9% 8.3% 0.99 2.2% 30% 32% 0% 197 0.33 ELDFXFidelity® Balanced 17.7 18.3% 2.0% 2.1% 3.5% 12.2% 10.7% 1.20 1.7% 61% 31% 0% 34,007 0.53 FBALXMairs & Power Balanced Inv 17.3 15.1% 0.8% 1.2% 3.9% 12.2% 8.9% 1.07 2.2% 62% 35% na 904 0.72 MAPOXAmerican Century Balanced Inv 16.9 15.8% 1.1% 1.4% 3.7% 11.8% 9.0% 1.01 1.4% 55% 41% na 909 0.91 TWBIXNew Covenant Balanced Growth 16.8 15.6% 1.5% 1.8% 3.5% 11.5% 9.0% 1.03 1.2% 56% 36% na 298 0.95 NCBGXSit Balanced 16.6 15.8% 1.5% 1.4% 3.3% 11.9% 10.5% 1.08 1.3% 58% 35% 0% 35 1.03 SIBAXT. Rowe Price Personal Strat Bal 16.5 14.9% 1.1% 1.4% 3.1% 12.0% 9.2% 0.96 1.8% 37% 34% 5% 2,488 0.73 TRPBXAmerican Century Strat Allc: Mod Inv 16.4 16.1% 1.4% 1.7% 3.1% 11.6% 8.3% 1.06 1.5% 40% 37% 0% 870 0.88 TWSMXTIAA-CREF Managed Allc Retail 16.2 15.7% 1.6% 1.8% 3.3% 11.1% 8.4% 1.04 2.3% 41% 37% -0% 879 0.64 TIMRXFidelity Asset Manager® 60% 16.0 15.4% 1.7% 2.0% 3.4% 10.7% 8.4% 1.04 1.4% 40% 31% 1% 3,091 0.72 FSANXTIAA-CREF Lifestyle Moderate Retail 16.0 15.7% 1.6% 1.7% 3.2% 11.0% 8.3% 1.05 2.2% 41% 37% -0% 520 0.77 TSMLXFidelity Asset Manager® 70% 15.8 16.6% 1.8% 2.0% 3.0% 10.7% 9.3% 1.21 1.3% 47% 22% 1% 5,342 0.71 FASGXAmerican Century One Choice Mod Inv 15.8 15.7% 1.4% 1.6% 3.0% 11.1% 8.2% 1.06 2.1% 43% 31% 0% 1,896 0.90 AOMIXOsterweis Strategic Investment 15.7 17.4% 0.4% 0.6% 3.4% 11.8% 8.6% 1.13 2.3% 51% 26% 1% 134 1.20 OSTVXSchwab MarketTrack Balanced 15.6 14.4% 1.6% 2.1% 3.3% 10.1% 8.0% 0.98 2.0% 44% 34% 0% 549 0.50 SWBGXUSAA Cornerstone Moderately Agrsv 15.3 12.8% 1.5% 2.4% 3.3% 9.7% 6.5% 0.93 1.1% 31% 39% 0% 2,894 1.08 USCRXSchwab Balanced 15.3 15.8% 1.5% 1.1% 3.0% 11.2% 9.5% 1.07 2.2% 57% 36% na 528 0.50 SWOBXFidelity® Puritan® 14.2 15.7% 1.8% 1.4% 2.8% 9.9% 10.2% 1.19 1.5% 58% 32% 0% 26,856 0.53 FPURXAMG Chicago Equity Partners Balanced N 13.3 13.2% 0.8% 1.4% 3.5% 8.4% 9.2% 0.99 1.4% 51% 45% na 269 1.09 MBEAXDodge & Cox Balanced 11.5 13.7% 1.8% 1.3% 2.3% 8.0% 9.4% 1.23 2.1% 57% 32% na 15,266 0.53 DODBXOakmark Equity And Income Investor 10.5 14.4% 1.5% 0.8% 1.4% 8.4% 8.3% 1.34 1.5% 54% 29% na 11,962 0.78 OAKBXGreenspring 10.5 16.9% 0.9% 0.2% 2.6% 7.8% 6.9% 1.45 1.7% 62% 22% na 196 1.02 GRSPXHennessy Total Return Investor 9.1 9.7% 0.3% 0.0% 1.2% 7.9% 8.4% 1.00 1.7% 70% na na 73 1.96 HDOGXFPA Crescent 5.9 14.3% 0.7% -0.8% -1.2% 8.0% 7.1% 1.37 1.1% 48% 5% -3% 13,671 1.18 FPACXIntrepid Capital Investor -7.0 4.1% 0.5% -0.8% -3.0% -3.2% 0.1% 1.05 1.9% 58% 27% na 114 1.41 ICMBX
163 Aggressive Allocation FundsAbove-Average-Risk Hybrid Portfolios that Typically Have 70%-90% of Assets in Equities and 30%-10% of Assets in Fixed Income and Cash
Manning & Napier Pro-Blend Max Term S 19.8 20.8% 1.2% 1.5% 4.1% 14.2% 11.5% 1.41 0.3% 62% 15% 0% 378 1.08 EXHAXFidelity® Strategic Dividend & Income® 18.8 17.9% 1.1% 2.4% 4.1% 12.3% 9.3% 1.11 2.3% 59% 7% na 4,982 0.72 FSDIXFidelity® Four-in-One Index 18.8 19.0% 2.2% 2.4% 3.7% 12.7% 11.2% 1.33 1.9% 60% 14% 0% 6,490 0.11 FFNOXVanguard LifeStrategy Growth Inv 18.1 17.4% 2.1% 2.4% 3.3% 12.3% 10.2% 1.24 2.3% 48% 20% 0% 15,906 0.14 VASGXT. Rowe Price Personal Strat Gr 17.4 17.5% 1.5% 1.5% 2.9% 13.0% 11.1% 1.26 1.3% 50% 16% 4% 2,980 0.79 TRSGXGuideStone Funds Growth Allocation Inv 17.2 17.2% 2.1% 2.1% 2.6% 12.5% 9.2% 1.28 3.3% 43% 23% 0% 1,221 1.12 GCOZXAmerican Century Strat Allc: Agrsv Inv 17.1 18.6% 1.6% 1.8% 2.9% 12.4% 9.9% 1.32 1.1% 51% 23% 0% 758 0.88 TWSAXFundX Upgrader 16.7 21.0% 1.4% 0.6% 2.3% 13.8% 12.6% 1.71 0.0% 91% 0% 0% 214 1.89 FUNDXAmerican Century One Choice Agrsv Inv 16.7 18.2% 1.7% 1.7% 2.9% 12.1% 9.8% 1.31 2.0% 52% 19% 0% 926 0.97 AOGIXFidelity Asset Manager® 85% 15.9 18.7% 2.2% 1.9% 2.8% 11.1% 10.6% 1.46 1.1% 56% 12% 1% 2,563 0.73 FAMRXUSAA Cornerstone Aggressive 15.0 14.8% 1.9% 2.5% 2.9% 9.6% 7.7% 1.23 1.4% 45% 19% 0% 377 1.21 UCAGXTIAA-CREF Lifestyle Growth Retail 15.0 17.8% 2.0% 1.6% 2.5% 10.8% 9.8% 1.37 2.3% 54% 18% -0% 269 0.81 TSGLXSchwab MarketTrack Growth 14.6 16.5% 2.1% 2.1% 2.6% 9.9% 9.7% 1.33 1.9% 59% 15% 0% 829 0.51 SWHGXMeeder Dynamic Allocation Retail 13.4 17.3% 2.1% 1.9% 2.3% 9.2% 10.8% 1.57 0.7% 76% 5% 0% 196 1.55 FLDGXCAN SLIM Select Growth 7.8 13.5% 0.7% -0.1% 1.5% 6.4% 8.9% 1.43 0.0% 72% 17% na 44 1.43 CANGXBuffalo Flexible Income 5.8 13.0% -0.4% 0.6% -0.2% 5.4% 8.0% 1.54 1.8% 82% 2% na 587 1.01 BUFBXValue Line Capital Appreciation Investor -0.9 14.7% 1.3% -4.8% -4.7% 8.6% 11.5% 1.90 0.0% 80% 13% na 433 1.12 VALIX
164 Tactical Allocation FundsAbove-Average-Risk Hybrid Portfolios that Actively Shift Allocations between Asset Classes (Mainly Stocks and Bonds) on a Frequent Basis
Hussman Strategic Total Return 24.4 10.0% 1.6% 2.6% 7.5% 14.2% 3.6% 0.65 1.3% 11% 48% 1% 222 0.78 HSTRXFundX Conservative Upgrader 16.2 15.7% 0.6% 1.7% 3.8% 10.7% 9.2% 1.11 0.4% 51% 39% 0% 99 1.99 RELAXSMI Dynamic Allocation 15.8 10.2% 0.8% 3.8% 6.0% 6.0% 4.6% 0.96 1.4% 33% 37% 0% 116 1.32 SMIDXHancock Horizon Diversified Income Instl 15.1 14.3% 0.8% 2.8% 3.4% 9.0% 4.5% 0.84 4.1% 49% 40% 0% 39 0.97 HHIIXUSAA Managed Allocation 13.2 13.8% 0.8% 2.3% 3.4% 7.5% 3.3% 1.35 0.9% 25% 74% na 734 0.76 UMAFX
----------------Performance----------------
MOMYTD
Return1 Mo
Return3 Mo
Return6 Mo
Return12 MoReturn
3 YrAvg
Return
3 YrRelRisk
CurrentYield(%)
%InvestStocks
%InvestBonds
%InvestOther
NetAssets
ExpRatio(%)
NasdaqTicker
Performance numbers reflect periods ending 10/31/2019. Funds shown in bold are the recommendations in the November 2019 issue for SMI’s two Basic strategies.Although gathered from reliable sources, data accuracy cannot be guaranteed.
Page 11Fund Performance Rankings | SoundMindInvesting.com

Meeder Balanced Retail 10.1 8.0% 1.1% 1.1% 2.4% 6.5% 7.2% 0.92 1.0% 54% 29% 0% 397 1.62 FLDFXMeeder Muirfield Retail 7.9 7.6% 1.6% 1.1% 1.6% 5.2% 9.2% 1.30 0.7% 78% na na 662 1.37 FLMFXHorizon Active Asset Allocation Investor 7.3 14.7% 2.2% 1.0% -0.1% 6.4% 9.7% 1.75 0.6% 80% 0% 0% 547 1.44 AAANXGabelli Global Rising Income and Div AAA 1.4 9.4% 1.6% 0.3% -1.7% 2.8% 5.4% 1.47 0.8% 39% na na 51 1.67 GAGCXIssachar N 1.0 -0.5% -0.2% 0.3% 1.9% -1.2% 0.9% 0.68 0.3% 0% 69% 145% 11 1.97 LIONX
165 World Allocation FundsAbove-Average-Risk Hybrid Portfolios that Invest at Least 40% of Assets Outside the U.S., Primarily in Canada, Japan, and Europe
T. Rowe Price Global Allocation 15.8 14.8% 1.5% 1.5% 3.0% 11.3% 8.0% 0.99 1.7% 25% 33% 10% 754 0.94 RPGAXAppleseed Investor 12.5 6.0% 2.6% 5.9% 1.5% 5.2% 6.3% 1.37 0.1% 17% 6% 15% 154 1.35 APPLXT. Rowe Price Real Assets 11.5 14.0% 1.1% 1.4% 1.4% 8.7% 4.5% 1.47 2.3% 48% 0% 0% 3,133 0.81 PRAFXMeeder Global Allocation Retail 9.9 7.7% 2.1% 2.2% 2.1% 5.6% 7.8% 1.21 0.7% 46% 9% 0% 53 1.77 FLFGX
166 Convertible Bond FundsAbove-Average-Risk Hybrid Portfolios that Invest in Convertible Bonds and Convertible Preferred Stocks
Fidelity® Convertible Securities 20.4 20.5% 2.0% 0.1% 4.0% 16.3% 9.9% 1.16 1.5% 8% na na 1,544 0.46 FCVSXHarbor Convertible Securities Instl 10.8 13.8% 1.6% -0.9% 1.4% 10.4% 7.3% 0.93 1.5% na 1% na 142 0.78 HACSX
170 Target-Date 2000-2010 FundsAverage-Risk Hybrid Portfolios that Adjust Return and Risk Levels Suitable for Investors Who Plan to Retire in the Years 2000-2010
Schwab Target 2010 16.3 12.1% 1.1% 2.0% 3.9% 10.4% 6.2% 0.61 2.4% 25% 56% 0% 51 0.33 SWBRXT. Rowe Price Retirement 2010 15.9 12.7% 1.1% 1.6% 3.6% 10.7% 6.9% 0.68 2.1% 27% 56% 0% 3,955 0.53 TRRAXT. Rowe Price Retirement 2005 15.7 12.0% 1.0% 1.5% 3.7% 10.5% 6.4% 0.61 2.2% 24% 61% 0% 1,335 0.53 TRRFXFidelity Freedom® 2010 15.6 11.4% 1.3% 2.0% 3.7% 10.0% 6.8% 0.62 1.9% 17% 47% -2% 5,685 0.52 FFFCXFidelity Freedom® 2005 15.3 10.2% 1.1% 2.0% 3.8% 9.5% 6.0% 0.50 1.9% 11% 52% -2% 994 0.48 FFFVXTIAA-CREF Lifecycle 2010 Retirement 15.0 12.3% 1.0% 1.6% 3.4% 10.0% 6.9% 0.68 2.2% 24% 56% 5% 1,203 0.62 TCLEX
171 Target-Date 2011-2015 FundsAverage-Risk Hybrid Portfolios that Adjust Return and Risk Levels Suitable for Investors Who Plan to Retire in the Years 2011-2015
Vanguard Target Retirement 2015 Inv 17.0 12.3% 1.0% 2.0% 4.1% 10.9% 7.0% 0.63 2.3% 22% 61% 0% 15,723 0.13 VTXVXSchwab Target 2015 16.2 12.4% 1.2% 1.9% 3.8% 10.5% 6.4% 0.65 2.4% 26% 54% 0% 81 0.35 SWGRXT. Rowe Price Retirement 2015 16.1 13.5% 1.1% 1.6% 3.5% 11.0% 7.7% 0.78 2.0% 31% 50% 0% 6,220 0.56 TRRGXFidelity Freedom® 2015 15.9 12.6% 1.6% 2.0% 3.5% 10.4% 7.6% 0.76 1.8% 22% 41% -2% 8,546 0.56 FFVFXTIAA-CREF Lifecycle 2015 Retirement 15.3 13.0% 1.1% 1.6% 3.4% 10.3% 7.3% 0.77 2.1% 28% 52% 5% 1,801 0.63 TCLIX
172 Target-Date 2016-2020 FundsAverage-Risk Hybrid Portfolios that Adjust Return and Risk Levels Suitable for Investors Who Plan to Retire in the Years 2016-2020
Vanguard Target Retirement 2020 Inv 17.8 14.2% 1.4% 2.3% 3.9% 11.6% 8.1% 0.82 2.2% 31% 48% 0% 33,145 0.13 VTWNXT. Rowe Price Retirement 2020 16.6 14.9% 1.3% 1.6% 3.4% 11.7% 8.6% 0.93 1.9% 37% 41% 0% 17,782 0.59 TRRBXFidelity Freedom® 2020 16.3 13.6% 1.8% 2.1% 3.5% 10.7% 8.2% 0.87 1.7% 26% 36% -2% 26,970 0.60 FFFDXSchwab Target 2020 16.3 13.2% 1.3% 2.0% 3.7% 10.6% 7.4% 0.75 2.3% 29% 50% 0% 549 0.41 SWCRXTIAA-CREF Lifecycle 2020 Retirement 15.5 13.9% 1.3% 1.7% 3.4% 10.5% 8.0% 0.86 2.0% 32% 46% 5% 3,765 0.64 TCLTXAmerican Century One Choice 2020 Inv 14.5 12.9% 0.9% 1.5% 3.2% 9.9% 6.7% 0.77 2.5% 33% 43% 0% 1,610 0.77 ARBVXThrift Savings Plan L 2020 9.1 5.2% 0.8% 1.2% 2.0% 5.9% 6.4% na na na na na na 0.03 L2020
173 Target-Date 2021-2025 FundsAbove-Average-Risk Hybrid Portfolios that Adjust Return and Risk Levels Suitable for Investors Who Plan to Retire in the Years 2021-2025
Vanguard Target Retirement 2025 Inv 18.4 15.5% 1.6% 2.3% 3.9% 12.2% 8.9% 0.96 2.2% 36% 38% 0% 44,957 0.13 VTTVXT. Rowe Price Retirement 2025 16.9 15.9% 1.4% 1.6% 3.2% 12.0% 9.4% 1.05 1.7% 42% 33% 0% 16,946 0.63 TRRHXFidelity Freedom® 2025 16.6 14.5% 1.9% 2.2% 3.4% 11.0% 8.7% 0.96 1.6% 30% 32% -2% 27,958 0.65 FFTWXSchwab Target 2025 16.0 14.6% 1.6% 1.9% 3.3% 10.8% 8.3% 0.96 2.3% 37% 39% 0% 581 0.50 SWHRXTIAA-CREF Lifecycle 2025 Retirement 15.6 15.0% 1.5% 1.7% 3.2% 10.7% 8.7% 1.00 1.9% 38% 38% 5% 4,666 0.66 TCLFXAmerican Century One Choice 2025 Inv 15.2 13.9% 1.0% 1.6% 3.2% 10.4% 7.2% 0.85 2.4% 36% 41% 0% 2,580 0.79 ARWIX
174 Target-Date 2026-2030 FundsAbove-Average-Risk Hybrid Portfolios that Adjust Return and Risk Levels Suitable for Investors Who Plan to Retire in the Years 2026-2030
Vanguard Target Retirement 2030 Inv 18.4 16.3% 1.8% 2.4% 3.7% 12.3% 9.6% 1.08 2.1% 41% 31% 0% 39,966 0.14 VTHRXFidelity Freedom® 2030 16.9 16.0% 2.3% 2.3% 3.2% 11.4% 9.9% 1.15 1.5% 36% 25% -1% 33,146 0.69 FFFEX
----------------Performance----------------
MOMYTD
Return1 Mo
Return3 Mo
Return6 Mo
Return12 MoReturn
3 YrAvg
Return
3 YrRelRisk
CurrentYield(%)
%InvestStocks
%InvestBonds
%InvestOther
NetAssets
ExpRatio(%)
NasdaqTicker
Performance numbers reflect periods ending 10/31/2019. Funds shown in bold are the recommendations in the November 2019 issue for SMI’s two Basic strategies.Although gathered from reliable sources, data accuracy cannot be guaranteed.
Page 12Fund Performance Rankings | SoundMindInvesting.com

T. Rowe Price Retirement 2030 16.9 16.9% 1.4% 1.5% 3.0% 12.4% 10.1% 1.16 1.6% 46% 25% 0% 21,549 0.66 TRRCXSchwab Target 2030 15.9 15.7% 1.8% 1.9% 3.0% 10.9% 9.0% 1.12 2.3% 43% 30% 0% 1,009 0.57 SWDRXAmerican Century One Choice 2030 Inv 15.9 14.8% 1.2% 1.6% 3.3% 10.9% 7.8% 0.93 2.4% 39% 38% 0% 2,238 0.81 ARCVXTIAA-CREF Lifecycle 2030 Retirement 15.3 16.0% 1.6% 1.7% 2.9% 10.8% 9.4% 1.14 1.8% 44% 29% 5% 4,693 0.67 TCLNXThrift Savings Plan L 2030 14.1 8.2% 1.7% 2.0% 2.8% 9.3% 9.0% na na na na na na 0.03 L2030
175 Target-Date 2031-2035 FundsAbove-Average-Risk Hybrid Portfolios that Adjust Return and Risk Levels Suitable for Investors Who Plan to Retire in the Years 2031-2035
Vanguard Target Retirement 2035 Inv 18.2 17.1% 2.0% 2.5% 3.4% 12.3% 10.2% 1.20 2.1% 45% 24% 0% 37,999 0.14 VTTHXT. Rowe Price Retirement 2035 16.9 17.6% 1.5% 1.5% 2.9% 12.6% 10.6% 1.26 1.4% 50% 19% 0% 13,325 0.68 TRRJXFidelity Freedom® 2035 16.3 17.3% 2.6% 2.4% 2.7% 11.2% 10.7% 1.36 1.4% 43% 12% -1% 23,108 0.73 FFTHXAmerican Century One Choice 2035 Inv 16.2 15.7% 1.3% 1.7% 3.2% 11.2% 8.3% 1.04 2.2% 42% 32% 0% 2,354 0.84 ARYIXSchwab Target 2035 15.5 16.5% 2.0% 1.9% 2.7% 10.9% 9.4% 1.25 2.2% 47% 23% 0% 487 0.62 SWIRXTIAA-CREF Lifecycle 2035 Retirement 15.5 17.2% 1.9% 1.8% 2.8% 10.9% 10.1% 1.28 1.7% 50% 20% 5% 4,768 0.68 TCLRX
176 Target-Date 2036-2040 FundsAbove-Average-Risk Hybrid Portfolios that Adjust Return and Risk Levels Suitable for Investors Who Plan to Retire in the Years 2036-2040
Vanguard Target Retirement 2040 Inv 18.1 17.9% 2.2% 2.5% 3.2% 12.4% 10.8% 1.32 2.0% 50% 16% 0% 29,801 0.14 VFORXT. Rowe Price Retirement 2040 16.8 18.2% 1.6% 1.4% 2.6% 12.8% 11.0% 1.34 1.3% 54% 14% 0% 15,212 0.70 TRRDXAmerican Century One Choice 2040 Inv 16.3 16.6% 1.4% 1.7% 3.1% 11.6% 9.0% 1.14 2.3% 46% 26% 0% 1,733 0.86 ARDVXThrift Savings Plan L 2040 15.7 9.2% 2.0% 2.2% 3.1% 10.4% 10.1% na na na na na na 0.03 L2040Fidelity Freedom® 2040 15.6 17.6% 2.8% 2.3% 2.4% 11.0% 10.6% 1.43 1.4% 47% 6% -1% 23,199 0.75 FFFFXSchwab Target 2040 15.1 17.1% 2.2% 1.8% 2.3% 10.9% 9.9% 1.36 2.2% 51% 17% 0% 1,023 0.67 SWERXTIAA-CREF Lifecycle 2040 Retirement 15.0 18.1% 2.1% 1.7% 2.4% 10.9% 10.7% 1.43 1.6% 56% 12% 5% 5,659 0.69 TCLOX
177 Target-Date 2041-2045 FundsAbove-Average-Risk Hybrid Portfolios that Adjust Return and Risk Levels Suitable for Investors Who Plan to Retire in the Years 2041-2045
Vanguard Target Retirement 2045 Inv 17.9 18.4% 2.4% 2.5% 3.0% 12.4% 11.0% 1.40 2.0% 53% 10% 0% 27,446 0.15 VTIVXAmerican Century One Choice 2045 Inv 16.7 17.5% 1.6% 1.8% 3.1% 11.9% 9.5% 1.24 2.1% 50% 23% 0% 1,668 0.89 AROIXT. Rowe Price Retirement 2045 16.7 18.5% 1.6% 1.4% 2.5% 12.8% 11.1% 1.39 1.3% 56% 10% 0% 8,793 0.71 TRRKXFidelity Freedom® 2045 15.7 17.6% 2.8% 2.3% 2.4% 11.0% 10.6% 1.44 1.4% 47% 6% -1% 14,542 0.75 FFFGXTIAA-CREF Lifecycle 2045 Institutional 14.9 18.9% 2.2% 1.7% 2.2% 11.0% 11.2% 1.53 2.3% 61% 5% 5% 3,308 0.45 TTFIXSchwab Target 2045 14.9 17.6% 2.3% 1.8% 2.1% 10.9% 10.1% 1.45 2.2% 54% 12% 0% 164 0.71 SWMRX
178 Target-Date 2046-2050 FundsAbove-Average-Risk Hybrid Portfolios that Adjust Return and Risk Levels Suitable for Investors Who Plan to Retire in the Years 2046-2050
Vanguard Target Retirement 2050 Inv 17.8 18.4% 2.3% 2.5% 3.0% 12.4% 11.0% 1.41 2.1% 53% 10% 0% 20,137 0.15 VFIFXAmerican Century One Choice 2050 Inv 17.1 18.4% 1.7% 1.8% 3.0% 12.3% 10.0% 1.32 2.1% 54% 19% 0% 1,147 0.92 ARFVXThrift Savings Plan L 2050 17.0 10.0% 2.2% 2.4% 3.2% 11.4% 11.1% na na na na na na 0.03 L2050T. Rowe Price Retirement 2050 16.6 18.5% 1.6% 1.4% 2.5% 12.8% 11.1% 1.39 1.2% 56% 10% 0% 7,514 0.71 TRRMXFidelity Freedom® 2050 15.6 17.6% 2.8% 2.3% 2.4% 10.9% 10.6% 1.43 1.4% 47% 6% -1% 12,633 0.75 FFFHXTIAA-CREF Lifecycle 2050 Institutional 14.9 19.1% 2.3% 1.7% 2.2% 11.0% 11.3% 1.56 2.3% 62% 4% 5% 2,264 0.45 TFTIXSchwab Target 2050 14.6 17.8% 2.4% 1.7% 2.0% 10.9% 10.2% 1.50 2.2% 56% 9% 0% 164 0.73 SWNRX
----------------Performance----------------
MOMYTD
Return1 Mo
Return3 Mo
Return6 Mo
Return12 MoReturn
3 YrAvg
Return
3 YrRelRisk
CurrentYield(%)
%InvestStocks
%InvestBonds
%InvestOther
NetAssets
ExpRatio(%)
NasdaqTicker
Performance numbers reflect periods ending 10/31/2019. Funds shown in bold are the recommendations in the November 2019 issue for SMI’s two Basic strategies.Although gathered from reliable sources, data accuracy cannot be guaranteed.
Page 13Fund Performance Rankings | SoundMindInvesting.com

201 SMI Stock Risk Category 1: Large/Value FundsBelow-Average-Risk Stock Funds that Invest Primarily In Larger-Sized U.S. Companies Using a Value-Oriented Strategy
Copley 33.5 20.0% 0.7% 6.6% 8.5% 18.4% 16.7% 0.98 0.0% 21.28 62,075 31 103 2.71 COPLXVulcan Value Partners 29.2 30.2% 5.1% 3.2% 7.8% 18.2% 14.4% 1.22 0.4% 23.64 52,228 29 1,430 1.08 VVPLXMatthew 25 29.1 36.3% 1.6% 4.8% 5.4% 18.9% 16.9% 1.45 0.4% 13.93 35,765 30 368 1.10 MXXVXFairholme 27.2 27.9% 0.4% -1.2% 4.3% 24.1% 4.6% 1.83 1.7% 58.14 1,027 40 1,075 1.00 FAIRXVanguard Dividend Growth Inv 26.4 24.5% -0.6% 1.0% 6.0% 19.3% 15.8% 0.85 1.7% 23.20 116,273 45 39,535 0.22 VDIGXDana Large Cap Equity Investor 26.0 25.9% 2.8% 4.0% 6.7% 15.3% 15.5% 1.00 1.3% 17.48 83,982 62 135 0.98 DLCEXT. Rowe Price Dividend Growth 25.9 23.7% 0.7% 1.9% 5.8% 18.2% 15.1% 0.83 1.3% 22.37 93,460 105 13,577 0.64 PRDGXMarathon Value Portfolio 24.5 23.4% 1.3% 2.3% 4.9% 17.2% 13.2% 1.01 0.6% 21.37 46,031 65 63 1.10 MVPFXNicholas Equity Income I 24.3 23.3% 0.5% 2.3% 6.4% 15.6% 12.1% 0.92 1.2% 20.33 48,644 68 390 0.73 NSEIXMeehan Focus 23.8 23.5% 3.0% 4.4% 4.3% 15.2% 14.4% 1.16 0.5% 17.01 136,666 36 69 1.02 MEFOXCommerce Value 22.6 18.5% 0.9% 3.1% 4.9% 14.7% 12.0% 0.92 2.3% 16.42 78,376 46 294 0.71 CFVLXScharf Institutional 22.4 19.7% 1.7% 4.1% 5.1% 13.2% 10.6% 0.87 0.1% 22.37 71,454 32 369 1.00 LOGIXCutler Equity 22.1 18.5% 1.3% 3.0% 4.4% 14.8% 11.9% 0.98 1.5% 19.08 126,880 35 161 1.15 CALEXCambiar Opportunity Inv 21.2 23.9% 2.2% 2.6% 5.3% 13.3% 10.1% 1.14 1.0% 14.64 59,955 35 236 0.85 CAMOXAmana Income Investor 21.0 17.1% 2.5% 3.5% 2.3% 15.2% 12.1% 0.99 1.1% 20.88 68,419 45 1,363 1.06 AMANXAmerican Century Equity Income Inv 20.9 19.0% 0.4% 1.9% 4.7% 14.4% 10.9% 0.76 2.0% 18.98 64,573 112 12,620 0.92 TWEIXVanguard 500 Index Admiral 20.9 23.1% 2.2% 2.4% 4.1% 14.3% 14.9% 1.00 1.9% 20.33 111,215 516 503,580 0.04 VFIAXThrift Savings Plan C Fund 20.9 12.0% 2.2% 2.4% 4.1% 14.3% 14.9% na na na na na na 0.03 THRIFTCTETON Westwood Equity AAA 20.7 20.6% 0.3% 2.3% 5.8% 12.6% 13.1% 0.93 0.6% 18.59 91,432 47 57 1.60 WESWXBrown Advisory Equity Income Inv 20.2 23.0% 1.5% 2.2% 3.9% 14.1% 13.3% 0.89 1.4% 19.53 113,026 43 92 0.96 BIADXTocqueville 20.2 21.3% 1.6% 2.3% 3.1% 14.9% 12.3% 0.99 0.8% 20.12 109,913 60 290 1.25 TOCQXVanguard Equity-Income Inv 20.1 18.9% 1.3% 3.0% 3.9% 13.1% 12.3% 0.90 2.5% 17.04 93,651 216 37,110 0.27 VEIPXHaverford Quality Growth Stock 20.0 23.8% 2.1% 3.0% 4.5% 12.5% 13.0% 1.03 1.2% 20.79 148,171 34 222 0.82 HAVGXFidelity® Equity-Income 19.9 20.7% 1.5% 3.3% 3.9% 12.7% 10.4% 0.96 1.7% 16.75 106,604 109 6,113 0.61 FEQIXHomestead Value 19.8 19.1% 2.9% 2.0% 3.3% 14.5% 13.7% 1.09 1.5% 18.18 90,317 45 977 0.60 HOVLXColumbia Contrarian Core Inst 19.3 24.1% 1.9% 1.9% 3.7% 13.7% 12.6% 1.05 1.0% 20.20 138,363 78 10,029 0.77 SMGIXVanguard Capital Value Inv 19.2 22.8% 2.3% 3.5% 4.3% 11.5% 9.1% 1.22 2.2% 15.13 25,353 81 811 0.29 VCVLXShelton Core Value Direct 19.2 20.5% 2.0% 3.1% 4.1% 12.0% 9.2% 0.91 3.8% 16.13 87,569 130 158 0.78 EQTIXQuartileAve Maria Rising Dividend 18.9 21.7% 0.5% 0.8% 2.9% 15.3% 13.2% 1.07 1.2% 19.38 43,182 38 934 0.94 AVEDXAmerican Funds Washington Mutual F1 18.8 18.4% 1.5% 2.2% 3.7% 12.9% 13.8% 0.86 1.7% 19.38 112,000 163 124,490 0.64 WSHFXHuber Capital Equity Income Investor 18.8 26.4% 2.0% 2.3% 4.5% 12.0% 12.2% 1.15 1.1% 16.45 77,656 34 50 1.39 HULIXMairs & Power Growth Inv 18.8 20.2% 1.7% 1.4% 3.3% 14.0% 12.4% 1.03 1.3% 21.93 43,028 57 4,533 0.64 MPGFXState Farm Growth 18.7 19.3% 1.7% 2.2% 3.7% 12.9% 12.0% 0.88 2.4% 19.53 128,387 73 5,402 0.12 STFGXVanguard PRIMECAP Core Inv 18.5 19.6% 3.4% 2.7% 3.8% 12.0% 15.4% 1.16 1.1% 17.54 62,947 153 10,968 0.46 VPCCXPax ESG Beta Quality Individual Investor 18.5 19.8% 1.2% 2.1% 3.7% 12.7% 13.6% 0.93 1.5% 17.33 71,147 158 229 0.90 PXWGXNew Covenant Growth 18.1 21.7% 2.2% 1.9% 3.2% 13.0% 13.3% 1.04 1.0% 19.72 85,172 796 455 0.97 NCGFXVanguard Windsor™ Inv 18.0 20.8% 2.5% 3.0% 3.4% 11.6% 11.0% 1.14 1.8% 14.68 39,538 135 19,196 0.31 VWNDXVanguard Growth & Income Inv 18.0 21.6% 2.0% 2.1% 3.4% 12.5% 14.1% 1.01 1.5% 20.20 91,155 1225 11,440 0.33 VQNPXAmerican Funds American Mutual F1 17.7 15.7% 0.5% 2.4% 3.9% 11.3% 12.0% 0.75 1.9% 19.76 95,121 170 60,669 0.67 AMFFXParnassus Endeavor Investor 17.4 25.0% 3.2% 2.1% 2.0% 13.3% 12.3% 1.49 1.3% 13.61 31,733 29 3,837 0.95 PARWXPin Oak Equity 17.3 20.8% 1.7% 1.7% 2.8% 12.8% 13.3% 1.10 0.8% 16.98 44,147 38 239 0.95 POGSXFidelity® Mega Cap Stock 17.2 21.7% 3.7% 3.6% 3.5% 10.1% 12.4% 1.04 1.9% 18.08 169,776 77 1,909 0.65 FGRTXUSAA Income Stock 17.1 17.6% 0.4% 2.0% 3.0% 12.0% 11.1% 0.86 2.1% 17.61 80,890 139 2,841 0.76 USISXT. Rowe Price Value 16.9 19.8% -0.8% 0.8% 3.0% 13.0% 10.9% 0.92 1.4% 21.37 71,682 103 24,953 0.78 TRVLXMulti-Manager Value Strategies A 16.8 20.8% 1.6% 1.8% 3.3% 11.7% 12.4% 1.05 1.2% 16.00 84,705 376 3,222 0.99 CDEIXGuideStone Funds Value Equity Investor 16.8 20.2% 1.1% 2.2% 3.5% 11.1% 10.3% 1.10 1.4% 16.67 51,809 297 1,192 0.87 GVEZXVanguard Windsor™ II Inv 16.8 20.9% 2.5% 2.5% 3.5% 10.8% 11.5% 1.06 2.1% 16.61 88,364 275 46,141 0.33 VWNFXEdgar Lomax Value 16.7 16.4% 0.4% 3.1% 4.5% 9.1% 12.9% 0.89 1.9% 16.56 123,356 54 122 0.70 LOMAXJanus Henderson Growth And Income T 16.6 18.4% 0.0% 1.2% 3.0% 12.4% 15.9% 0.95 1.7% 18.35 100,999 67 6,309 0.87 JAGIX
Stock Fund RankingsDATA FOR PERIODS ENDING 10/31/2019
----------------Performance----------------
MOMYTD
Return1 Mo
Return3 Mo
Return6 Mo
Return12 MoReturn
3 YrAvg
Return
3 YrRelRisk
CurrentYield(%)
P/ERatio
MedianMarketCapital
NumberHoldings
NetAssets
ExpRatio(%)
NasdaqTicker
Performance numbers reflect periods ending 10/31/2019. Funds shown in bold are the recommendations in the November 2019 issue for SMI’s two Basic strategies.Although gathered from reliable sources, data accuracy cannot be guaranteed.
Page 14Fund Performance Rankings | SoundMindInvesting.com

Schwab Core Equity 16.4 21.8% 2.3% 1.4% 2.9% 12.0% 13.2% 1.03 1.1% 17.83 73,528 138 2,208 0.73 SWANXAMG River Road Dividend All Cap Value N 16.3 17.9% 0.9% 2.8% 3.3% 10.1% 8.9% 1.01 2.3% 16.86 31,455 58 621 1.11 ARDEXPRIMECAP Odyssey Stock 16.2 19.3% 3.3% 2.4% 2.7% 11.2% 14.4% 1.18 1.0% 16.05 53,796 120 10,543 0.66 POSKXIndex Funds S&P 500® Equal Weight NoLoad 15.8 21.4% 1.3% 1.1% 2.0% 12.6% 12.3% 1.08 1.5% 18.66 27,208 507 46 0.25 INDEXNorthern Large Cap Value 15.6 18.9% 1.5% 2.5% 2.9% 10.3% 10.4% 1.11 1.4% 15.72 53,031 140 74 0.58 NOLVXMedian 19.1% 1.6% 1.9% 2.9% 11.0% 11.7%Fidelity® Growth & Income 15.4 21.3% 3.4% 3.2% 2.9% 9.3% 11.6% 1.10 1.7% 17.33 93,847 183 6,486 0.61 FGRIXSmead Value Investor 15.4 17.9% 0.8% 1.9% 4.0% 9.5% 15.0% 1.01 0.0% 14.77 75,945 27 1,262 1.26 SMVLXAl Frank Inv 15.3 18.0% 2.5% 2.8% 2.8% 9.6% 12.0% 1.20 1.0% 14.60 40,067 86 78 1.49 VALUXFidelity® Equity Dividend Income 15.2 18.8% 1.3% 2.6% 2.6% 10.0% 9.5% 0.99 2.2% 15.38 43,906 103 4,991 0.62 FEQTXFMI Large Cap 15.2 17.9% 0.8% 0.6% 1.8% 12.8% 13.2% 0.89 1.2% 18.32 54,548 32 5,054 0.80 FMIHXSelected American Shares D 15.1 22.8% 2.1% 2.0% 1.5% 11.7% 11.5% 1.24 0.9% 16.29 99,661 47 1,886 0.65 SLADXArtisan Value Investor 15.0 23.1% 2.8% 2.8% 3.0% 9.2% 9.6% 1.26 0.7% 14.25 61,118 42 409 1.02 ARTLXBNY Mellon Disciplined Stock Fund 15.0 20.5% 1.5% 1.5% 2.5% 11.0% 13.3% 1.09 1.0% 15.95 69,695 68 592 1.00 DDSTXT. Rowe Price Equity Income 14.9 19.1% 0.6% 1.6% 2.7% 10.6% 10.7% 1.03 2.2% 16.05 61,595 119 20,623 0.64 PRFDXFidelity® Large Cap Stock 14.6 22.0% 3.8% 3.2% 2.5% 8.9% 12.3% 1.15 1.6% 17.21 89,145 144 2,406 0.63 FLCSXFort Pitt Capital Total Return 14.2 18.7% -1.5% -0.4% 1.0% 13.6% 14.4% 1.10 0.9% 19.76 59,743 30 76 1.24 FPCGXFidelity® Dividend Growth 14.1 19.6% 4.6% 2.3% 2.2% 9.6% 11.7% 1.08 1.8% 13.89 66,296 81 7,110 0.50 FDGFXFidelity® Export and Multinational 14.0 19.1% 4.7% 2.4% 2.4% 9.2% 11.9% 1.10 1.7% 13.81 68,246 79 1,662 0.74 FEXPXClipper 14.0 22.2% 2.3% 2.1% 1.3% 10.6% 10.5% 1.24 0.3% 17.30 109,000 29 1,121 0.71 CFIMXCullen High Dividend Equity Retail 14.0 13.9% 1.0% 2.4% 2.6% 9.0% 9.9% 0.82 1.9% 17.01 102,339 41 1,582 1.01 CHDEXTCW Relative Value Dividend Apprec N 13.8 19.9% 0.4% -0.2% 3.0% 11.0% 7.3% 1.17 1.9% 16.05 57,745 46 317 0.95 TGIGXCoho Relative Value Equity Advisor 13.6 14.1% 2.6% 3.5% 3.2% 7.0% 10.8% 0.93 1.5% 18.69 57,327 30 596 0.95 COHOXCastle Focus Investor 13.5 13.2% 0.1% 1.0% 3.4% 9.1% 7.0% 0.58 0.5% 22.08 44,903 25 116 1.40 MOATXColumbia Select Large Cap Equity Inst 13.3 20.3% 1.5% 0.2% 1.3% 11.7% 14.0% 1.04 1.2% 17.79 101,782 65 722 0.55 NSEPXFidelity® Stk Selec Lg Cp Val 13.1 17.8% 1.0% 1.5% 1.8% 9.9% 9.0% 1.02 1.4% 16.37 49,421 139 495 0.68 FSLVXAMG Yacktman Focused N 12.9 13.1% 1.5% 1.3% 1.0% 10.7% 12.5% 0.70 1.3% 14.16 71,844 41 3,758 1.27 YAFFXFidelity® Value Discovery 12.8 16.3% 1.7% 1.4% 3.0% 8.3% 9.4% 0.91 1.8% 15.46 49,801 101 2,469 0.60 FVDFXAmerican Century Income and Growth Inv 12.4 17.7% 1.9% 1.4% 1.9% 9.1% 11.7% 1.03 1.7% 17.04 89,697 114 2,243 0.67 BIGRXHennessy Cornerstone Large Growth Inv 12.0 18.3% 2.2% 1.7% 2.4% 7.8% 10.6% 1.24 0.7% 12.76 34,762 51 137 1.24 HFLGXJPMorgan Large Cap Value A 11.9 18.9% 2.3% 2.3% 1.6% 7.9% 10.3% 1.29 1.1% 16.08 40,706 99 1,620 0.93 OLVAXThompson LargeCap 11.8 22.4% 3.2% 0.9% 0.4% 10.6% 11.2% 1.30 0.7% 15.46 50,867 78 128 1.03 THPGXUSAA Value 11.6 18.4% 1.6% 1.8% 0.7% 9.1% 9.1% 1.18 1.1% 15.63 44,444 181 1,189 0.96 UVALXSchwab Dividend Equity 11.2 18.0% 0.9% 0.9% 1.5% 8.8% 9.4% 1.06 1.5% 15.02 39,754 151 863 0.88 SWDSXAMG Yacktman I 11.1 12.0% 1.3% 0.7% 1.2% 9.2% 11.8% 0.63 1.7% 15.27 80,644 48 8,412 0.75 YACKXGabelli Asset AAA 10.2 15.8% 1.3% 0.5% 0.6% 9.2% 10.5% 0.97 0.3% 19.27 20,467 438 2,275 1.35 GABAXGreen Owl Intrinsic Value 9.9 20.8% 1.8% -0.5% 0.1% 10.3% 12.5% 1.26 0.3% 16.18 49,009 45 86 1.10 GOWLXUSA Mutuals Vice Investor 9.8 19.9% 1.7% -0.1% -2.1% 12.0% 5.5% 1.20 0.3% 19.69 34,379 39 146 1.49 VICEXAuxier Focus Inv 9.4 13.4% 2.1% 0.8% 1.6% 7.0% 9.8% 0.89 1.3% 17.54 90,021 110 236 0.94 AUXFXWhite Oak Select Growth 9.3 16.2% 1.9% -0.1% -1.3% 10.7% 14.3% 1.20 0.6% 19.76 106,071 28 364 0.93 WOGSXFidelity® Blue Chip Value 8.8 13.6% 2.8% 1.2% 2.4% 5.1% 9.0% 0.93 1.6% 15.53 50,591 41 479 0.65 FBCVXWilshire Large Company Value Invmt 8.8 16.3% 1.2% 0.9% 1.3% 6.6% 9.0% 1.10 1.4% 15.67 47,997 289 194 1.24 DTLVXHennessy Cornerstone Value Investor 8.2 13.7% 1.2% 2.5% 0.5% 5.2% 9.3% 1.01 2.1% 14.35 91,531 53 268 1.22 HFCVXTCW Relative Value Large Cap N 7.9 18.4% 0.6% -0.8% 0.8% 7.9% 7.4% 1.30 1.3% 15.20 42,639 50 152 0.95 TGDVXDodge & Cox Stock 7.5 16.1% 2.4% 0.4% 0.5% 6.5% 12.3% 1.17 1.7% 15.08 64,489 70 70,639 0.52 DODGXMatrix Advisors Value 7.4 18.4% 1.1% 0.0% -0.8% 8.1% 8.6% 1.21 1.2% 13.76 84,598 36 55 0.99 MAVFXBarrett Opportunity 7.2 12.8% 1.4% -0.3% 0.3% 7.2% 10.2% 1.04 0.8% 17.67 71,160 30 61 1.14 SAOPXSound Shore Investor 7.1 16.8% 2.5% -0.1% -0.3% 7.6% 7.8% 1.14 1.0% 14.81 51,687 37 1,614 0.90 SSHFXVanguard US Value Inv 7.1 14.7% 1.4% 0.6% 1.2% 5.4% 9.3% 1.12 2.0% 14.73 31,416 243 1,451 0.22 VUVLXBecker Value Equity Retail 6.2 15.9% 1.2% 0.6% 0.9% 4.6% 7.8% 1.18 1.9% 15.29 55,331 52 291 0.78 BVEFXInvesco Exchange 5.8 14.2% 1.9% -1.4% -0.3% 7.5% 8.6% 0.96 1.9% 20.70 54,786 37 60 0.54 ACEHXTorray 5.5 13.9% 0.7% -1.9% -0.4% 7.8% 6.7% 1.00 1.5% 13.44 78,558 30 406 1.08 TORYXOakmark Investor 5.3 17.7% 3.2% -0.3% -1.4% 7.0% 10.6% 1.31 0.6% 12.97 55,005 58 17,003 0.85 OAKMXAriel Focus Investor 5.2 18.7% 2.2% 0.5% 0.1% 4.6% 9.3% 1.34 1.0% 12.79 16,389 32 59 1.00 ARFFXVoya Corporate Leaders Trust B 4.2 15.1% 0.9% -1.8% -2.4% 8.5% 11.4% 1.12 1.9% 18.12 123,829 23 808 0.59 LEXCXHeartland Select Value Investor 2.9 12.2% 0.3% 0.0% -1.8% 4.7% 10.3% 1.10 1.1% 16.18 16,724 52 204 1.20 HRSVXMuhlenkamp 2.3 8.7% 1.5% -0.4% -0.4% 3.1% 5.7% 0.92 0.3% 16.37 30,625 38 184 1.13 MUHLXOakmark Select Investor 0.3 17.7% 2.8% -1.5% -2.9% 4.7% 4.2% 1.49 0.2% 12.64 34,556 25 4,735 0.97 OAKLXCGM Realty -5.7 5.6% -0.3% 1.3% -4.2% -2.8% 6.5% 1.13 2.3% 18.55 13,360 22 611 0.98 CGMRXLongleaf Partners -11.6 9.2% 3.7% -1.6% -3.7% -6.4% 1.7% 1.30 2.0% 13.04 21,241 18 1,902 0.79 LLPFXCGM Focus -18.5 -10.8% 1.1% 7.1% -2.0% -23.5% -0.8% 1.50 0.4% 17.92 49,899 33 469 2.45 CGMFX
----------------Performance----------------
MOMYTD
Return1 Mo
Return3 Mo
Return6 Mo
Return12 MoReturn
3 YrAvg
Return
3 YrRelRisk
CurrentYield(%)
P/ERatio
MedianMarketCapital
NumberHoldings
NetAssets
ExpRatio(%)
NasdaqTicker
Performance numbers reflect periods ending 10/31/2019. Funds shown in bold are the recommendations in the November 2019 issue for SMI’s two Basic strategies.Although gathered from reliable sources, data accuracy cannot be guaranteed.
Page 15Fund Performance Rankings | SoundMindInvesting.com
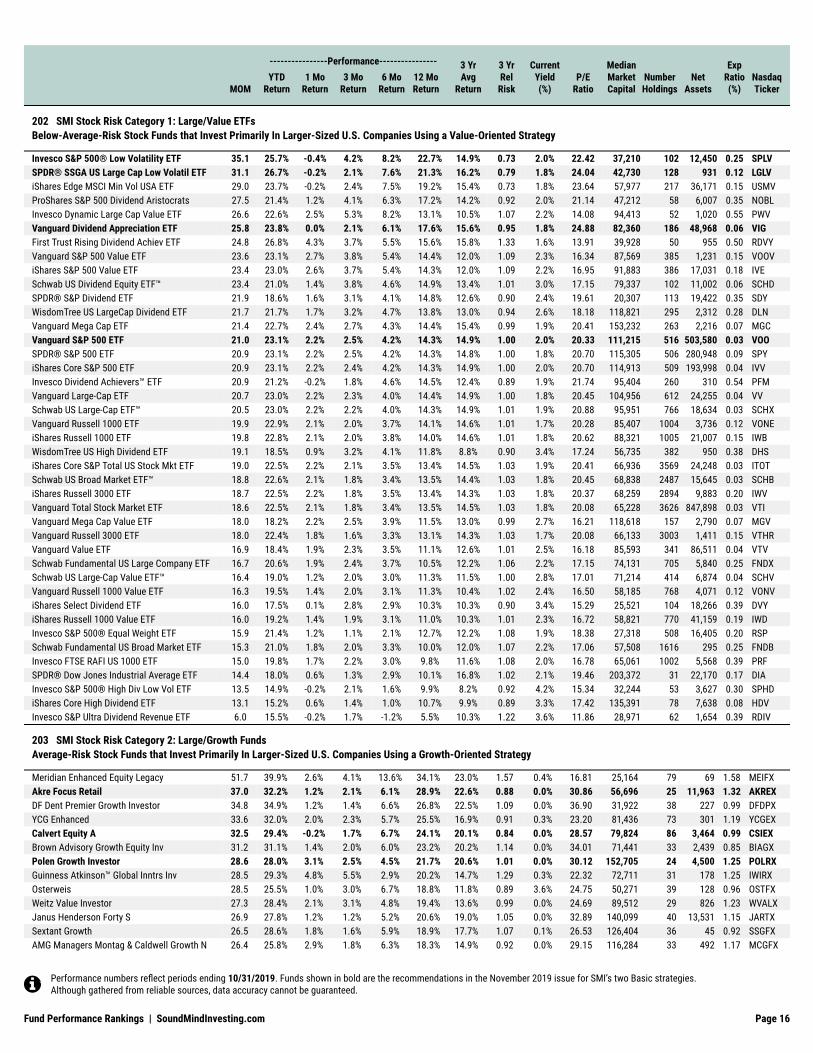
202 SMI Stock Risk Category 1: Large/Value ETFsBelow-Average-Risk Stock Funds that Invest Primarily In Larger-Sized U.S. Companies Using a Value-Oriented Strategy
Invesco S&P 500® Low Volatility ETF 35.1 25.7% -0.4% 4.2% 8.2% 22.7% 14.9% 0.73 2.0% 22.42 37,210 102 12,450 0.25 SPLVSPDR® SSGA US Large Cap Low Volatil ETF 31.1 26.7% -0.2% 2.1% 7.6% 21.3% 16.2% 0.79 1.8% 24.04 42,730 128 931 0.12 LGLViShares Edge MSCI Min Vol USA ETF 29.0 23.7% -0.2% 2.4% 7.5% 19.2% 15.4% 0.73 1.8% 23.64 57,977 217 36,171 0.15 USMVProShares S&P 500 Dividend Aristocrats 27.5 21.4% 1.2% 4.1% 6.3% 17.2% 14.2% 0.92 2.0% 21.14 47,212 58 6,007 0.35 NOBLInvesco Dynamic Large Cap Value ETF 26.6 22.6% 2.5% 5.3% 8.2% 13.1% 10.5% 1.07 2.2% 14.08 94,413 52 1,020 0.55 PWVVanguard Dividend Appreciation ETF 25.8 23.8% 0.0% 2.1% 6.1% 17.6% 15.6% 0.95 1.8% 24.88 82,360 186 48,968 0.06 VIGFirst Trust Rising Dividend Achiev ETF 24.8 26.8% 4.3% 3.7% 5.5% 15.6% 15.8% 1.33 1.6% 13.91 39,928 50 955 0.50 RDVYVanguard S&P 500 Value ETF 23.6 23.1% 2.7% 3.8% 5.4% 14.4% 12.0% 1.09 2.3% 16.34 87,569 385 1,231 0.15 VOOViShares S&P 500 Value ETF 23.4 23.0% 2.6% 3.7% 5.4% 14.3% 12.0% 1.09 2.2% 16.95 91,883 386 17,031 0.18 IVESchwab US Dividend Equity ETF™ 23.4 21.0% 1.4% 3.8% 4.6% 14.9% 13.4% 1.01 3.0% 17.15 79,337 102 11,002 0.06 SCHDSPDR® S&P Dividend ETF 21.9 18.6% 1.6% 3.1% 4.1% 14.8% 12.6% 0.90 2.4% 19.61 20,307 113 19,422 0.35 SDYWisdomTree US LargeCap Dividend ETF 21.7 21.7% 1.7% 3.2% 4.7% 13.8% 13.0% 0.94 2.6% 18.18 118,821 295 2,312 0.28 DLNVanguard Mega Cap ETF 21.4 22.7% 2.4% 2.7% 4.3% 14.4% 15.4% 0.99 1.9% 20.41 153,232 263 2,216 0.07 MGCVanguard S&P 500 ETF 21.0 23.1% 2.2% 2.5% 4.2% 14.3% 14.9% 1.00 2.0% 20.33 111,215 516 503,580 0.03 VOOSPDR® S&P 500 ETF 20.9 23.1% 2.2% 2.5% 4.2% 14.3% 14.8% 1.00 1.8% 20.70 115,305 506 280,948 0.09 SPYiShares Core S&P 500 ETF 20.9 23.1% 2.2% 2.4% 4.2% 14.3% 14.9% 1.00 2.0% 20.70 114,913 509 193,998 0.04 IVVInvesco Dividend Achievers™ ETF 20.9 21.2% -0.2% 1.8% 4.6% 14.5% 12.4% 0.89 1.9% 21.74 95,404 260 310 0.54 PFMVanguard Large-Cap ETF 20.7 23.0% 2.2% 2.3% 4.0% 14.4% 14.9% 1.00 1.8% 20.45 104,956 612 24,255 0.04 VVSchwab US Large-Cap ETF™ 20.5 23.0% 2.2% 2.2% 4.0% 14.3% 14.9% 1.01 1.9% 20.88 95,951 766 18,634 0.03 SCHXVanguard Russell 1000 ETF 19.9 22.9% 2.1% 2.0% 3.7% 14.1% 14.6% 1.01 1.7% 20.28 85,407 1004 3,736 0.12 VONEiShares Russell 1000 ETF 19.8 22.8% 2.1% 2.0% 3.8% 14.0% 14.6% 1.01 1.8% 20.62 88,321 1005 21,007 0.15 IWBWisdomTree US High Dividend ETF 19.1 18.5% 0.9% 3.2% 4.1% 11.8% 8.8% 0.90 3.4% 17.24 56,735 382 950 0.38 DHSiShares Core S&P Total US Stock Mkt ETF 19.0 22.5% 2.2% 2.1% 3.5% 13.4% 14.5% 1.03 1.9% 20.41 66,936 3569 24,248 0.03 ITOTSchwab US Broad Market ETF™ 18.8 22.6% 2.1% 1.8% 3.4% 13.5% 14.4% 1.03 1.8% 20.45 68,838 2487 15,645 0.03 SCHBiShares Russell 3000 ETF 18.7 22.5% 2.2% 1.8% 3.5% 13.4% 14.3% 1.03 1.8% 20.37 68,259 2894 9,883 0.20 IWVVanguard Total Stock Market ETF 18.6 22.5% 2.1% 1.8% 3.4% 13.5% 14.5% 1.03 1.8% 20.08 65,228 3626 847,898 0.03 VTIVanguard Mega Cap Value ETF 18.0 18.2% 2.2% 2.5% 3.9% 11.5% 13.0% 0.99 2.7% 16.21 118,618 157 2,790 0.07 MGVVanguard Russell 3000 ETF 18.0 22.4% 1.8% 1.6% 3.3% 13.1% 14.3% 1.03 1.7% 20.08 66,133 3003 1,411 0.15 VTHRVanguard Value ETF 16.9 18.4% 1.9% 2.3% 3.5% 11.1% 12.6% 1.01 2.5% 16.18 85,593 341 86,511 0.04 VTVSchwab Fundamental US Large Company ETF 16.7 20.6% 1.9% 2.4% 3.7% 10.5% 12.2% 1.06 2.2% 17.15 74,131 705 5,840 0.25 FNDXSchwab US Large-Cap Value ETF™ 16.4 19.0% 1.2% 2.0% 3.0% 11.3% 11.5% 1.00 2.8% 17.01 71,214 414 6,874 0.04 SCHVVanguard Russell 1000 Value ETF 16.3 19.5% 1.4% 2.0% 3.1% 11.3% 10.4% 1.02 2.4% 16.50 58,185 768 4,071 0.12 VONViShares Select Dividend ETF 16.0 17.5% 0.1% 2.8% 2.9% 10.3% 10.3% 0.90 3.4% 15.29 25,521 104 18,266 0.39 DVYiShares Russell 1000 Value ETF 16.0 19.2% 1.4% 1.9% 3.1% 11.0% 10.3% 1.01 2.3% 16.72 58,821 770 41,159 0.19 IWDInvesco S&P 500® Equal Weight ETF 15.9 21.4% 1.2% 1.1% 2.1% 12.7% 12.2% 1.08 1.9% 18.38 27,318 508 16,405 0.20 RSPSchwab Fundamental US Broad Market ETF 15.3 21.0% 1.8% 2.0% 3.3% 10.0% 12.0% 1.07 2.2% 17.06 57,508 1616 295 0.25 FNDBInvesco FTSE RAFI US 1000 ETF 15.0 19.8% 1.7% 2.2% 3.0% 9.8% 11.6% 1.08 2.0% 16.78 65,061 1002 5,568 0.39 PRFSPDR® Dow Jones Industrial Average ETF 14.4 18.0% 0.6% 1.3% 2.9% 10.1% 16.8% 1.02 2.1% 19.46 203,372 31 22,170 0.17 DIAInvesco S&P 500® High Div Low Vol ETF 13.5 14.9% -0.2% 2.1% 1.6% 9.9% 8.2% 0.92 4.2% 15.34 32,244 53 3,627 0.30 SPHDiShares Core High Dividend ETF 13.1 15.2% 0.6% 1.4% 1.0% 10.7% 9.9% 0.89 3.3% 17.42 135,391 78 7,638 0.08 HDVInvesco S&P Ultra Dividend Revenue ETF 6.0 15.5% -0.2% 1.7% -1.2% 5.5% 10.3% 1.22 3.6% 11.86 28,971 62 1,654 0.39 RDIV
203 SMI Stock Risk Category 2: Large/Growth FundsAverage-Risk Stock Funds that Invest Primarily In Larger-Sized U.S. Companies Using a Growth-Oriented Strategy
Meridian Enhanced Equity Legacy 51.7 39.9% 2.6% 4.1% 13.6% 34.1% 23.0% 1.57 0.4% 16.81 25,164 79 69 1.58 MEIFXAkre Focus Retail 37.0 32.2% 1.2% 2.1% 6.1% 28.9% 22.6% 0.88 0.0% 30.86 56,696 25 11,963 1.32 AKREXDF Dent Premier Growth Investor 34.8 34.9% 1.2% 1.4% 6.6% 26.8% 22.5% 1.09 0.0% 36.90 31,922 38 227 0.99 DFDPXYCG Enhanced 33.6 32.0% 2.0% 2.3% 5.7% 25.5% 16.9% 0.91 0.3% 23.20 81,436 73 301 1.19 YCGEXCalvert Equity A 32.5 29.4% -0.2% 1.7% 6.7% 24.1% 20.1% 0.84 0.0% 28.57 79,824 86 3,464 0.99 CSIEXBrown Advisory Growth Equity Inv 31.2 31.1% 1.4% 2.0% 6.0% 23.2% 20.2% 1.14 0.0% 34.01 71,441 33 2,439 0.85 BIAGXPolen Growth Investor 28.6 28.0% 3.1% 2.5% 4.5% 21.7% 20.6% 1.01 0.0% 30.12 152,705 24 4,500 1.25 POLRXGuinness Atkinson™ Global Inntrs Inv 28.5 29.3% 4.8% 5.5% 2.9% 20.2% 14.7% 1.29 0.3% 22.32 72,711 31 178 1.25 IWIRXOsterweis 28.5 25.5% 1.0% 3.0% 6.7% 18.8% 11.8% 0.89 3.6% 24.75 50,271 39 128 0.96 OSTFXWeitz Value Investor 27.3 28.4% 2.1% 3.1% 4.8% 19.4% 13.6% 0.99 0.0% 24.69 89,512 29 826 1.23 WVALXJanus Henderson Forty S 26.9 27.8% 1.2% 1.2% 5.2% 20.6% 19.0% 1.05 0.0% 32.89 140,099 40 13,531 1.15 JARTXSextant Growth 26.5 28.6% 1.8% 1.6% 5.9% 18.9% 17.7% 1.07 0.1% 26.53 126,404 36 45 0.92 SSGFXAMG Managers Montag & Caldwell Growth N 26.4 25.8% 2.9% 1.8% 6.3% 18.3% 14.9% 0.92 0.0% 29.15 116,284 33 492 1.17 MCGFX
----------------Performance----------------
MOMYTD
Return1 Mo
Return3 Mo
Return6 Mo
Return12 MoReturn
3 YrAvg
Return
3 YrRelRisk
CurrentYield(%)
P/ERatio
MedianMarketCapital
NumberHoldings
NetAssets
ExpRatio(%)
NasdaqTicker
Performance numbers reflect periods ending 10/31/2019. Funds shown in bold are the recommendations in the November 2019 issue for SMI’s two Basic strategies.Although gathered from reliable sources, data accuracy cannot be guaranteed.
Page 16Fund Performance Rankings | SoundMindInvesting.com

Commerce Growth 26.4 27.7% 1.8% 1.9% 5.4% 19.1% 18.5% 0.98 0.6% 26.67 103,831 72 169 0.77 CFGRXAve Maria Growth 26.2 28.7% 0.2% 0.2% 4.4% 21.6% 18.8% 0.99 0.2% 28.57 39,408 37 794 0.97 AVEGXGovernment Street Equity 25.5 24.8% 2.4% 4.4% 5.8% 15.3% 14.5% 0.96 0.9% 22.47 118,673 56 60 0.89 GVEQXNicholas 24.7 25.7% 2.1% 1.7% 4.8% 18.2% 14.5% 0.95 0.5% 24.10 78,403 64 2,856 0.72 NICSXFidelity® 24.6 25.1% 2.8% 3.0% 6.2% 15.5% 14.8% 1.00 0.9% 22.37 154,921 105 4,376 0.50 FFIDXManning & Napier Equity Series S 24.6 25.4% 2.1% 2.8% 4.9% 16.9% 15.6% 0.99 0.0% 24.04 70,208 65 64 1.05 EXEYXDavenport Core 23.8 25.6% 0.7% 1.5% 4.6% 17.8% 13.9% 0.99 0.5% 23.53 114,388 47 576 0.89 DAVPXParnassus Core Equity Investor 23.3 23.4% 0.3% 0.7% 4.8% 17.8% 14.8% 0.89 0.7% 24.81 77,687 40 17,936 0.87 PRBLXBNY Mellon Appreciation Investor 23.0 25.6% 2.0% 1.9% 4.2% 16.9% 15.4% 0.93 0.9% 22.62 203,522 51 1,655 0.90 DGAGXDomini Impact Equity Investor 23.0 23.6% 2.6% 2.6% 4.8% 15.6% 11.3% 1.01 0.6% 20.79 96,646 323 780 1.06 DSEFXBrown Advisory Flexible Equity Inv 22.5 26.1% 3.3% 2.5% 4.2% 15.8% 16.9% 1.08 0.2% 20.08 126,449 46 510 0.73 BIAFXLazard US Equity Concentrated Open 22.5 24.9% -0.5% -0.5% 4.9% 18.1% 11.1% 0.98 1.0% 26.18 61,015 22 1,281 1.04 LEVOXAmana Growth Investor 22.5 24.8% 1.8% 2.3% 2.6% 17.6% 19.4% 1.01 0.4% 25.00 69,461 34 2,136 1.03 AMAGXBuffalo Large Cap 22.4 24.4% 2.2% 1.8% 3.7% 17.0% 16.1% 1.01 0.3% 28.57 110,353 52 83 0.94 BUFEXGreen Century Equity Individual Investor 22.4 22.8% 2.1% 1.7% 3.8% 16.9% 14.7% 0.99 0.5% 22.08 97,619 364 313 1.25 GCEQXBuffalo Growth 22.1 25.1% 1.8% -0.1% 3.1% 19.1% 16.4% 1.03 0.0% 31.85 104,871 54 179 0.92 BUFGXQuartileT. Rowe Price New America Growth 22.0 25.3% 2.6% 0.9% 3.8% 17.3% 19.9% 1.12 0.2% 27.47 100,122 82 5,362 0.79 PRWAXBrown Advisory Sustainable Growth Adv 21.9 26.4% 0.4% -0.5% 2.5% 19.9% 18.7% 1.03 0.0% 35.34 70,530 34 1,740 1.13 BAWAXWeitz Partners Value Investor 21.7 27.6% 2.5% 2.3% 3.6% 15.8% 9.2% 1.16 0.0% 25.38 25,138 36 598 1.25 WPVLXPayson Total Return 21.7 23.2% 3.5% 3.1% 4.6% 14.0% 15.4% 0.97 0.6% 22.52 168,492 38 122 0.89 PBFDXT. Rowe Price Tax-Efficient Equity 21.6 27.4% 2.2% -0.5% 3.0% 19.1% 18.8% 1.10 0.1% 27.55 41,054 368 513 0.77 PREFXPear Tree Quality Ordinary 21.6 23.2% 3.0% 2.3% 5.4% 13.9% 16.3% 0.95 0.5% 21.60 192,867 47 137 1.25 USBOXFidelity® Trend 21.4 25.7% 2.9% 1.0% 4.7% 15.8% 17.3% 1.12 0.2% 31.65 89,554 151 1,955 0.67 FTRNXT. Rowe Price U.S. Equity Research 21.3 24.0% 2.3% 2.4% 4.1% 14.9% 15.2% 1.01 1.0% 20.88 109,138 251 1,793 0.50 PRCOXGAMCO Growth AAA 20.6 25.6% 1.9% 1.5% 3.5% 15.5% 18.9% 1.10 0.0% 32.89 176,094 44 710 1.40 GABGXT. Rowe Price Growth & Income 20.4 21.8% 1.5% 1.2% 4.4% 14.8% 13.3% 0.91 1.2% 22.08 112,837 66 2,183 0.65 PRGIXProvident Trust Strategy 20.2 19.9% 2.7% 2.2% 4.5% 13.5% 17.6% 0.88 0.3% 21.14 117,328 18 190 1.01 PROVXT. Rowe Price US Large-Cap Core 20.2 21.7% 1.4% 1.2% 4.3% 14.7% 13.1% 0.91 1.0% 22.08 112,874 66 592 0.75 TRULXColumbia Large Cap Growth Inst 20.1 26.0% 3.0% 1.2% 3.3% 15.6% 16.4% 1.18 0.0% 24.75 124,767 69 3,576 0.80 GEGTXFidelity® Independence 19.9 24.6% 1.3% 1.2% 4.0% 14.6% 15.2% 1.08 0.5% 31.55 97,834 93 3,696 0.50 FDFFXAMG Managers Brandywine Blue I 19.8 27.0% 2.1% 0.4% 2.7% 16.8% 16.9% 1.20 0.0% 30.21 50,499 42 186 1.16 BLUEXJensen Quality Growth J 19.4 20.9% 1.4% 1.7% 3.5% 14.2% 16.3% 0.91 0.9% 22.37 142,645 30 8,280 0.87 JENSXFidelity® Growth Discovery 19.3 24.1% 3.1% 1.1% 2.4% 15.8% 18.9% 1.11 0.1% 31.35 121,154 121 2,089 0.77 FDSVXSit Large Cap Growth 19.1 23.6% 2.6% 1.2% 3.1% 14.8% 16.3% 1.07 0.3% 24.21 156,180 67 117 1.00 SNIGXNorth Country Equity Growth 19.0 22.3% 3.7% 2.7% 4.3% 11.9% 15.0% 1.06 0.3% 22.27 188,053 80 133 1.03 NCEGXTCW Select Equities N 18.9 26.5% 2.4% -0.6% 0.7% 18.7% 18.3% 1.16 0.0% 36.63 91,116 33 900 1.00 TGCNXFPA US Value 18.6 25.2% 3.5% 1.3% 2.7% 14.7% 9.9% 1.16 0.0% 23.36 221,855 60 69 1.20 FPPFXFidelity® OTC 18.3 27.3% 3.7% 1.8% 2.5% 14.0% 20.4% 1.26 0.0% 25.91 123,040 261 19,478 0.89 FOCPXGuideStone Funds Growth Equity Investor 18.2 24.9% 1.9% -0.6% 0.7% 18.1% 17.6% 1.18 0.0% 28.82 110,935 109 1,613 0.98 GGEZXMonetta Core Growth 18.1 23.3% 2.9% 1.5% 3.5% 13.1% 15.1% 1.04 0.2% 22.37 180,936 19 82 1.20 MYIFXJanus Henderson Research T 18.0 25.3% 2.0% 0.3% 1.9% 15.8% 16.1% 1.08 0.2% 27.55 104,752 84 14,479 0.83 JAMRXSequoia 17.7 23.4% 1.3% 0.5% 0.6% 16.6% 15.1% 0.97 0.0% 24.27 47,154 28 3,930 1.00 SEQUXMarsico Focus 17.6 23.2% 2.2% 0.6% 1.0% 16.0% 17.6% 1.22 0.0% 33.00 207,008 24 563 1.14 MFOCXMedian 23.4% 2.1% 0.8% 2.7% 14.7% 15.4%Baron Opportunity Retail 17.3 27.6% 3.8% -2.0% 1.5% 17.8% 23.8% 1.32 0.0% 40.32 29,182 65 401 1.37 BIOPXAB FlexFee US Thematic Advisor 16.9 23.1% 0.7% -0.9% 1.5% 16.4% na na 0.5% 27.78 50,140 51 95 0.43 FFTYXMarsico Growth 16.9 24.1% 1.6% 0.1% 1.3% 15.5% 17.1% 1.14 0.0% 33.44 161,633 33 260 1.44 MGRIXFidelity® Disciplined Equity 16.9 23.0% 2.3% 0.8% 4.1% 12.0% 12.0% 1.01 1.3% 26.25 99,153 135 1,281 0.53 FDEQXVanguard US Growth Investor 16.8 23.8% 2.5% -0.4% 1.7% 15.5% 17.7% 1.13 0.3% 30.77 87,943 265 25,724 0.38 VWUSXVanguard PRIMECAP Inv 16.6 18.6% 4.0% 2.6% 3.3% 10.8% 16.7% 1.16 1.0% 17.79 83,908 141 65,231 0.38 VPMCXFidelity® Capital Appreciation 16.4 21.8% 2.7% 1.1% 3.1% 12.2% 14.8% 1.04 0.7% 27.78 78,077 115 5,532 0.54 FDCAXBaron Fifth Avenue Growth Retail 16.4 25.8% 0.9% -2.4% 2.0% 16.7% 20.5% 1.23 0.0% 38.46 82,234 36 311 1.00 BFTHXAmerican Century Equity Growth Inv 16.3 21.4% 1.6% 0.9% 2.7% 12.7% 13.3% 1.04 1.0% 21.01 94,411 128 2,725 0.67 BEQGXVanguard Diversified Equity Inv 16.1 22.5% 2.2% 0.9% 2.4% 12.8% 14.4% 1.08 1.0% 20.00 46,669 7 1,789 0.36 VDEQXBNY Mellon Large Cap Securities Inc 16.0 19.7% 2.1% 1.0% 2.7% 12.2% 13.9% 0.95 1.2% 22.47 128,201 43 1,280 0.71 DREVXMulti-Manager Growth Strategies A 15.9 23.9% 3.1% -0.6% 0.2% 16.3% 15.2% 1.23 0.0% 27.78 97,231 221 2,194 0.99 CSLGXAmerican Century Disciplined Growth Inv 15.8 22.7% 2.1% 0.8% 2.7% 12.3% 15.0% 1.08 0.2% 25.84 116,765 96 478 1.01 ADSIXBridges Investment 15.7 23.0% 2.7% 0.8% 2.5% 12.4% 14.9% 1.06 0.5% 21.79 152,860 49 188 0.79 BRGIXFidelity® Stock Selec All Cp 15.6 22.7% 2.3% 1.2% 2.7% 11.7% 13.8% 1.09 0.7% 19.92 59,575 548 8,370 0.63 FDSSXLaudus US Large Cap Growth 15.4 23.1% 1.8% -1.1% 0.8% 15.8% 18.7% 1.17 0.0% 36.90 113,725 55 2,223 0.75 LGILX
----------------Performance----------------
MOMYTD
Return1 Mo
Return3 Mo
Return6 Mo
Return12 MoReturn
3 YrAvg
Return
3 YrRelRisk
CurrentYield(%)
P/ERatio
MedianMarketCapital
NumberHoldings
NetAssets
ExpRatio(%)
NasdaqTicker
Performance numbers reflect periods ending 10/31/2019. Funds shown in bold are the recommendations in the November 2019 issue for SMI’s two Basic strategies.Although gathered from reliable sources, data accuracy cannot be guaranteed.
Page 17Fund Performance Rankings | SoundMindInvesting.com

Schwab Large-Cap Growth 15.4 22.4% 2.6% 1.1% 2.2% 12.2% 14.5% 1.11 0.4% 22.68 109,516 122 182 0.99 SWLSXAmerican Funds Fundamental Invs F1 15.4 18.4% 3.0% 2.1% 1.9% 11.3% 12.7% 0.97 1.5% 19.84 102,351 269 104,395 0.67 AFIFXFidelity® Growth Company 15.3 25.4% 3.9% 0.8% 1.6% 12.9% 19.9% 1.32 0.0% 27.40 72,711 417 41,307 0.85 FDGRXParnassus 15.1 21.9% -0.2% -1.4% 3.0% 13.5% 11.7% 1.06 1.0% 23.53 40,307 38 948 0.85 PARNXT. Rowe Price Spectrum Growth 14.7 19.3% 1.8% 0.9% 1.6% 12.2% 12.0% 0.96 1.1% 19.76 41,575 13 3,674 0.77 PRSGXT. Rowe Price Growth Stock 14.0 21.4% 2.2% -0.8% 0.6% 14.3% 17.5% 1.14 0.2% 28.90 135,171 80 54,983 0.66 PRGFXFidelity® Focused Stock 13.9 21.7% 2.1% -1.6% 0.5% 15.1% 18.8% 1.14 0.1% 28.09 169,244 40 2,954 0.82 FTQGXFidelity® Leveraged Company Stock 13.7 24.8% 3.2% -0.2% -0.3% 14.3% 10.4% 1.31 0.0% 22.99 33,359 70 2,199 0.78 FLVCXFidelity® Blue Chip Growth 13.6 22.0% 4.1% -0.5% -0.1% 14.3% 19.3% 1.20 0.0% 27.03 117,466 331 27,252 0.80 FBGRXT. Rowe Price Blue Chip Growth 13.5 21.1% 1.9% -1.2% 0.3% 14.4% 19.4% 1.18 0.0% 29.33 139,519 129 65,392 0.70 TRBCXHarbor Capital Appreciation Inv 13.5 21.9% 3.1% 0.3% 0.0% 13.2% 17.7% 1.23 0.0% 33.56 151,518 60 30,079 1.03 HCAIXAmerican Funds Growth Portfolio F1 13.5 18.1% 2.7% 1.0% 1.1% 11.4% 12.2% 0.97 0.8% 20.41 58,514 7 8,734 0.76 GWPFXHomestead Growth 13.3 19.5% 2.4% -0.4% 0.8% 12.9% 20.6% 1.13 0.1% 28.33 141,030 70 232 0.86 HNASXColumbia Select Large Cap Growth Inst 13.1 26.0% 5.1% -1.2% -1.4% 15.7% 16.0% 1.49 0.0% 30.58 72,806 33 2,181 0.82 UMLGXFundX Aggressive Upgrader 13.1 19.4% 1.9% -0.1% 3.1% 10.1% 9.5% 1.02 0.0% 26.81 43,412 22 36 2.08 HOTFXBMO Large-Cap Growth Y 12.9 20.2% 1.8% 0.3% 1.6% 11.1% 16.9% 1.07 0.3% 23.04 76,945 68 474 0.79 MASTXVanguard Capital Opportunity Inv 12.7 17.7% 4.5% 1.7% 1.3% 9.6% 16.4% 1.26 0.6% 18.55 42,478 158 16,900 0.43 VHCOXFidelity® Contrafund® 12.6 21.1% 2.8% -0.6% 0.8% 12.4% 16.6% 1.14 0.0% 27.03 154,040 311 116,340 0.82 FCNTXAmerican Funds Growth Fund of Amer F1 12.6 18.8% 3.2% 0.5% 0.6% 11.5% 14.6% 1.07 0.5% 23.31 92,962 335 193,523 0.68 GFAFXMonetta 12.5 19.6% 2.6% -0.2% 2.3% 10.4% 13.8% 1.09 0.0% 23.98 162,978 35 60 1.39 MONTXThe Investment House Growth 12.4 24.3% 1.7% -1.3% 0.7% 13.1% 17.1% 1.24 0.0% 27.03 125,427 47 129 1.43 TIHGXAmerican Funds New Economy F1 12.4 17.7% 2.7% -0.3% -0.6% 13.3% 15.4% 1.07 0.4% 21.14 56,406 203 21,575 0.83 ANFFXRiverPark Large Growth Retail 12.0 23.8% 0.9% -2.0% 0.5% 13.5% 17.0% 1.10 0.0% 29.50 86,887 43 54 1.23 RPXFXBNY Mellon Growth and Income , Inc. 12.0 20.3% 1.4% 0.2% 0.8% 11.1% 13.6% 1.09 0.9% 19.72 79,128 123 886 0.89 DGRIXChase Growth N 11.5 19.4% 0.6% -0.2% 2.4% 9.3% 13.6% 0.96 0.0% 26.18 59,644 38 70 1.26 CHASXWesMark Growth 11.2 19.4% 2.1% 0.1% 0.5% 10.6% 13.2% 1.05 0.2% 24.75 116,568 46 329 1.14 WMKGXAmerican Funds AMCAP F1 10.0 16.5% 2.5% -0.1% 0.1% 10.0% 13.2% 1.02 0.4% 23.92 63,984 203 67,517 0.74 AMPFXAmerican Funds Invmt Co of Amer F1 9.8 15.5% 1.7% 0.8% 0.4% 8.6% 10.7% 0.92 1.7% 20.53 114,752 186 98,922 0.66 AICFXWilshire Large Company Growth Invmt 9.4 19.7% 2.0% -1.5% -1.4% 12.3% 14.2% 1.14 0.0% 28.82 104,251 196 206 1.31 DTLGXKinetics Internet No Load 9.3 26.3% 0.4% -7.4% 4.3% 12.4% 14.0% 1.59 0.0% 27.78 13,124 41 122 1.84 WWWFXTouchstone Sands Capital Select Growth Z 8.9 22.3% 2.1% -4.0% -3.7% 16.6% 18.3% 1.46 0.0% 40.16 101,969 31 1,698 1.42 PTSGXAmerican Beacon Bridgeway Lg Cp Gr Instl 8.7 21.7% 2.9% -1.9% 0.1% 10.5% 15.6% 1.19 0.3% 21.19 47,826 79 191 0.81 BRLGXGerstein Fisher Multi-Factor Growth Eq 8.4 17.3% 3.7% 0.1% 0.7% 7.5% 14.0% 1.17 0.5% 18.25 58,033 268 275 1.00 GFMGXUSAA Growth 7.7 18.8% 1.7% -2.7% -2.7% 13.1% 14.0% 1.12 0.3% 29.76 90,966 91 2,654 0.92 USAAXPRIMECAP Odyssey Growth 4.4 14.3% 4.0% -0.6% -0.7% 5.8% 15.2% 1.39 0.3% 16.89 29,344 150 12,702 0.65 POGRXUSAA Growth & Income 3.5 14.7% 0.9% -0.6% -2.2% 6.2% 10.7% 1.10 1.1% 21.32 79,128 179 1,828 0.88 USGRXReynolds Blue Chip Growth 1.9 17.4% 2.3% -2.2% -2.4% 6.5% 12.8% 1.26 0.0% 24.21 101,617 300 60 1.96 RBCGXCentre American Select Equity Inv 1.0 11.1% 1.7% -0.9% -2.3% 4.2% 10.4% 0.91 0.0% 21.32 141,790 38 108 1.45 DHAMXUSAA Aggressive Growth -1.6 14.8% 1.7% -3.5% -4.6% 6.4% 14.3% 1.19 0.2% 31.95 76,346 63 1,555 0.75 USAUXMorgan Stanley Insight A -3.4 22.3% 0.7% -12.4% -5.4% 14.4% 24.7% 1.51 0.0% na 25,541 47 1,878 1.15 CPOAXValue Line Larger Companies Focused Inv -10.8 11.8% 1.2% -7.9% -8.8% 5.9% 14.1% 1.43 0.0% 27.93 50,644 41 269 1.15 VALLX
204 SMI Stock Risk Category 2: Large/Growth ETFsAverage-Risk Stock Funds that Invest Primarily In Larger-Sized U.S. Companies Using a Growth-Oriented Strategy
Invesco S&P 500 GARP ETF 31.3 29.2% 4.1% 2.8% 7.2% 21.3% 22.0% 1.19 0.9% 15.06 31,591 78 331 0.35 SPGPInvesco QQQ Trust 24.9 28.5% 4.4% 3.3% 4.4% 17.1% 20.1% 1.23 0.8% 25.06 218,444 104 81,151 0.20 QQQVanguard Growth ETF 24.8 28.0% 2.6% 2.3% 4.7% 17.9% 17.4% 1.08 1.0% 28.09 130,425 283 94,988 0.04 VUGVanguard Mega Cap Growth ETF 24.6 27.7% 2.6% 2.7% 4.9% 17.0% 18.0% 1.09 0.7% 27.78 202,542 115 4,731 0.07 MGKSchwab US Large-Cap Growth ETF™ 24.4 26.6% 3.2% 2.5% 4.9% 16.9% 18.4% 1.07 1.1% 26.88 129,505 355 8,504 0.04 SCHGiShares Russell Top 200 Growth ETF 24.3 26.2% 3.1% 2.9% 4.9% 16.5% 19.3% 1.09 1.2% 26.60 237,054 133 1,576 0.20 IWYVanguard Russell 1000 Growth ETF 23.4 26.5% 2.7% 2.0% 4.4% 17.0% 18.8% 1.09 0.9% 25.97 125,134 534 6,142 0.12 VONGiShares Russell 1000 Growth ETF 23.3 26.4% 2.8% 2.0% 4.4% 16.8% 18.7% 1.09 1.0% 26.46 132,228 534 46,477 0.19 IWFFirst Trust NASDAQ-100 Equal Wtd ETF 23.2 26.5% 3.7% 1.7% 2.4% 19.1% 15.9% 1.22 0.5% 23.47 43,628 104 821 0.60 QQEWiShares MSCI KLD 400 Social ETF 22.4 23.1% 2.0% 1.9% 3.8% 16.7% 14.7% 1.00 1.5% 21.79 91,254 406 1,668 0.25 DSIiShares Edge MSCI USA Quality Factor ETF 21.1 24.7% 2.2% 2.3% 3.7% 15.2% 14.7% 1.01 1.7% 20.83 83,632 129 13,834 0.15 QUALInvesco S&P 500® Top 50 ETF 20.5 23.3% 3.0% 2.9% 3.9% 13.8% 15.6% 1.00 1.7% 21.93 341,822 53 869 0.20 XLGFidelity® NASDAQ Composite Tr Stk ETF 19.7 26.4% 3.8% 1.6% 3.0% 15.1% 18.0% 1.19 1.1% 22.88 77,775 991 2,089 0.21 ONEQiShares Edge MSCI USA Momentum Fctr ETF 18.8 21.2% 0.7% -0.2% 5.4% 13.6% 18.1% 1.02 1.5% 28.82 90,621 128 8,891 0.15 MTUMSPDR® Portfolio S&P 500 Growth ETF 18.8 23.1% 1.8% 1.4% 3.1% 14.3% 17.1% 1.01 1.4% 25.64 141,279 298 5,010 0.04 SPYGiShares Morningstar Large-Cap Growth ETF 18.6 23.4% 1.8% 0.2% 2.6% 15.9% 18.9% 1.08 0.6% 30.77 123,183 77 1,146 0.25 JKE
----------------Performance----------------
MOMYTD
Return1 Mo
Return3 Mo
Return6 Mo
Return12 MoReturn
3 YrAvg
Return
3 YrRelRisk
CurrentYield(%)
P/ERatio
MedianMarketCapital
NumberHoldings
NetAssets
ExpRatio(%)
NasdaqTicker
Performance numbers reflect periods ending 10/31/2019. Funds shown in bold are the recommendations in the November 2019 issue for SMI’s two Basic strategies.Although gathered from reliable sources, data accuracy cannot be guaranteed.
Page 18Fund Performance Rankings | SoundMindInvesting.com

Vanguard S&P 500 Growth ETF 18.5 23.1% 1.8% 1.3% 3.0% 14.2% 17.1% 1.01 1.2% 25.51 137,749 299 2,910 0.15 VOOGiShares S&P 500 Growth ETF 18.4 22.9% 1.7% 1.3% 3.0% 14.1% 17.0% 1.01 1.4% 25.58 141,109 301 23,742 0.18 IVWInvesco S&P 500® Pure Growth ETF 11.2 20.4% 0.6% -0.7% 0.5% 11.4% 13.9% 1.11 0.8% 24.10 35,027 106 2,640 0.35 RPGInvesco Dynamic Large Cap Growth ETF 8.7 17.5% 0.3% -1.2% -0.3% 10.1% 16.9% 1.05 0.9% 27.62 107,992 51 696 0.55 PWB
205 SMI Stock Risk Category 3: Small/Value FundsAbove-Average-Risk Stock Funds that Invest Primarily In Small-to-Medium-Sized U.S. Companies Using a Value-Oriented Strategy
Touchstone Mid Cap Z 37.9 31.3% 1.4% 4.5% 8.1% 25.3% 18.1% 1.03 0.1% 21.55 11,873 32 1,803 1.21 TMCTXWeitz Hickory 30.7 32.0% 3.4% 5.1% 6.1% 19.5% 8.6% 1.13 0.0% 22.94 6,926 37 240 1.27 WEHIXSterling Capital Stratton MdCp Val Instl 22.8 22.4% 1.9% 4.1% 4.4% 14.3% 11.6% 1.09 0.4% 17.70 10,632 54 64 0.96 STRGXVanguard Selected Value Inv 18.5 22.8% 1.6% 2.2% 3.7% 12.6% 9.2% 1.26 1.7% 16.03 8,768 126 7,893 0.36 VASVXCambiar Small Cap Inv 18.4 23.8% 2.5% 2.9% 3.4% 12.2% 9.0% 1.44 0.1% 16.45 2,802 49 86 0.97 CAMSXCambiar SMID Investor 18.0 22.8% 1.1% 1.1% 1.2% 15.6% 14.1% 1.18 0.5% 17.39 7,884 41 59 0.85 CAMMXHuber Capital Small Cap Value Inv 16.6 25.9% 4.7% 2.2% 6.4% 8.0% 8.9% 1.53 0.2% 13.59 1,857 38 42 1.76 HUSIXAMG River Road Small-Mid Cap Value N 16.3 24.3% 3.8% 1.8% 2.6% 11.8% 14.8% 1.15 0.0% 17.57 3,298 64 176 1.34 ARSMXRoyce Dividend Value Svc 16.2 22.2% 3.0% 1.1% 2.1% 13.1% 10.9% 1.27 0.5% 17.24 4,603 86 105 1.34 RYDVXProspector Opportunity 16.0 19.5% -0.7% -0.4% 2.9% 13.6% 12.3% 0.96 0.8% 19.46 7,269 77 137 1.26 POPFXVulcan Value Partners Small Cap 15.4 22.3% 0.9% 0.4% 0.6% 14.4% 8.6% 1.40 0.6% 14.25 2,668 29 497 1.26 VVPSXFidelity® Value Strategies 15.0 24.6% 1.5% 1.0% 1.3% 12.7% 9.5% 1.22 0.9% 15.95 13,575 80 853 0.63 FSLSXFidelity® Mid-Cap Stock 14.7 19.5% 1.4% 0.6% 3.2% 10.9% 11.8% 0.91 0.8% 18.59 8,771 169 7,133 0.73 FMCSXSegall Bryant & Hamill MidCp ValDiv Ret 14.3 20.2% -0.3% 1.4% 2.6% 10.3% 6.4% 1.10 1.1% 16.92 9,350 57 75 0.99 WTMCXAllianzGI NFJ Mid-Cap Value A 14.3 21.4% 0.3% 0.9% 2.2% 11.1% 12.1% 1.18 1.0% 18.02 15,894 126 1,393 0.99 PQNAXCrawford Small Cap Dividend 14.0 17.6% 1.8% 1.9% 1.5% 10.6% 11.7% 1.21 1.2% 21.41 2,325 72 247 0.99 CDOFXFidelity® Small Cap Discovery 14.0 20.9% 1.8% 2.6% 0.4% 11.0% 8.9% 1.27 0.9% 10.27 2,804 78 2,829 0.61 FSCRXMonteagle Opportunity Equity Inv 13.9 19.6% 0.7% 0.5% 0.9% 12.5% 8.7% 1.13 0.7% 18.48 5,698 81 34 1.54 HEQFXAMG River Road Small Cap Value N 13.3 21.6% 3.0% 0.5% 2.0% 10.9% 13.0% 1.11 0.0% 16.69 1,732 65 416 1.37 ARSVXQueens Road Small Cap Value 13.0 12.5% 4.1% 3.2% 0.3% 9.5% 7.1% 1.12 0.1% 16.56 2,205 45 133 1.18 QRSVXColumbia Select Mid Cap Value Instl 12.8 22.5% -0.6% -0.2% 0.5% 12.5% 9.5% 1.13 0.8% 16.21 16,357 47 1,561 0.92 NAMAXSeven Canyons Strategic Income Investor 12.5 16.5% 3.5% 2.0% 2.5% 8.0% 8.6% 0.90 3.3% 14.49 11,554 78 35 1.43 WASIXAMG SouthernSun Small Cap N 11.7 23.6% 2.9% 2.2% -0.4% 9.9% 6.2% 1.58 0.0% 21.93 3,017 23 155 1.22 SSSFXQuartileFMI Common Stock 11.5 20.1% 0.5% -1.6% -1.1% 14.3% 11.5% 1.08 0.3% 18.90 4,810 37 1,011 0.99 FMIMXBrown Advisory Sm-Cp Fundamental Val Inv 11.5 19.8% 1.7% 2.9% 1.4% 7.2% 10.2% 1.26 0.6% 17.01 1,855 69 1,003 1.37 BIAUXFidelity® Low-Priced Stock 11.1 15.4% 3.2% 2.1% 2.1% 6.9% 9.6% 0.95 1.8% 12.61 8,481 799 28,913 0.52 FLPSXCornerCap Small-Cap Value Investor 10.7 20.1% 2.1% 1.2% 1.5% 7.9% 9.1% 1.46 0.3% 15.24 1,766 227 127 1.30 CSCVXAMG Managers Skyline Special Equities N 10.5 21.8% 3.9% 2.4% 0.4% 7.7% 8.2% 1.68 0.0% 15.65 2,078 62 494 1.18 SKSEXSterling Capital Stratton SmCp Val Instl 10.0 17.1% 1.7% 1.5% 0.9% 7.7% 9.0% 1.36 0.4% 16.78 4,467 50 990 1.02 STSCXFidelity® Value 9.6 21.7% 1.5% 0.4% -0.1% 9.3% 7.9% 1.31 1.0% 15.20 8,896 216 6,854 0.59 FDVLXBoston Partners Small Cap Value II Inv 9.4 20.0% 1.5% 1.1% 1.8% 6.6% 8.1% 1.39 0.2% 13.89 2,276 147 585 1.35 BPSCXT. Rowe Price Small-Cap Value 8.7 19.5% 1.1% 0.1% 1.0% 7.6% 11.4% 1.30 0.3% 17.33 2,234 293 10,099 0.85 PRSVXVanguard Explorer Value Inv 8.1 18.4% 0.6% 1.2% 0.2% 6.7% 9.6% 1.30 1.0% 15.58 2,983 110 672 0.56 VEVFXNorthern Small Cap Value 7.0 17.1% 2.2% 1.2% 0.4% 5.4% 7.9% 1.41 0.7% 15.20 2,084 518 3,115 1.00 NOSGXVanguard Strategic Equity Inv 6.9 19.2% 1.5% -0.1% -0.1% 7.1% 10.6% 1.30 1.1% 16.10 6,599 323 7,145 0.17 VSEQXUSAA Small Cap Stock 6.5 19.3% 2.5% -0.4% -0.1% 6.9% 10.6% 1.40 0.2% 16.16 2,158 586 1,578 1.10 USCAXReinhart Mid Cap PMV Adv 6.5 18.7% 1.1% 1.0% -0.7% 6.2% 7.8% 1.26 0.5% 16.81 10,091 39 232 1.06 RPMVXFidelity® Small Cap Value 6.3 16.0% 1.4% 1.3% 0.2% 4.9% 7.6% 1.23 0.8% 15.36 2,609 83 2,077 0.66 FCPVXHeartland Value Plus Investor 6.2 18.2% 0.3% -0.3% 1.3% 5.2% 10.7% 1.58 1.0% 18.66 1,484 47 340 1.18 HRVIXPax Small Cap Individual Investor 6.1 15.9% 0.2% -1.1% -0.9% 8.1% 5.4% 1.07 0.9% 16.53 2,111 57 418 1.18 PXSCXKirr Marbach Partners Value 6.1 20.7% 0.6% 0.4% -0.3% 6.0% 7.5% 1.31 0.0% 18.08 9,603 45 68 1.45 KMVAXCRM Small Cap Value Inv 5.9 20.2% 0.6% -0.8% -1.0% 7.8% 10.3% 1.36 0.2% 20.45 2,041 47 324 1.16 CRMSXCarillon Scout Mid Cap I 5.9 16.4% 1.2% -0.9% -1.6% 8.4% 12.8% 1.16 0.5% 20.53 12,170 139 2,851 0.98 UMBMXNorthern Small Cap Core 5.2 16.7% 2.2% -0.3% -0.3% 5.8% 10.4% 1.32 0.6% 18.28 1,988 1474 481 0.65 NSGRXParadigm Value 4.9 14.0% 1.7% 0.5% -0.8% 5.2% 12.8% 1.33 0.0% 20.16 2,307 60 55 1.51 PVFAXMedian 16.6% 1.5% 0.4% -0.3% 5.5% 8.6%Fidelity® Mid Cap Value 4.7 15.6% 0.8% 0.5% -1.0% 5.3% 5.9% 1.23 1.9% 13.04 11,051 88 1,671 0.53 FSMVXMairs & Power Small Cap 4.5 15.0% 2.5% -0.7% -0.3% 5.5% 9.5% 1.40 0.6% 17.24 2,321 53 431 1.04 MSCFXMiller Opportunity A 4.3 21.2% 7.4% 2.7% 0.9% 0.8% 14.4% 2.05 0.0% 11.25 13,380 40 1,574 1.40 LGOAXGoodHaven 4.2 10.6% 0.8% 1.2% 0.9% 2.2% 2.8% 0.84 1.2% 13.42 10,925 30 95 1.10 GOODXRoyce Opportunity Svc 4.0 18.6% 2.0% 1.8% 0.2% 2.1% 10.4% 1.70 0.0% 14.33 828 257 922 1.49 RYOFXWasatch Small Cap Value 4.0 17.0% 1.5% -1.1% -1.0% 6.2% 12.0% 1.27 0.0% 16.67 2,365 56 873 1.20 WMCVX
----------------Performance----------------
MOMYTD
Return1 Mo
Return3 Mo
Return6 Mo
Return12 MoReturn
3 YrAvg
Return
3 YrRelRisk
CurrentYield(%)
P/ERatio
MedianMarketCapital
NumberHoldings
NetAssets
ExpRatio(%)
NasdaqTicker
Performance numbers reflect periods ending 10/31/2019. Funds shown in bold are the recommendations in the November 2019 issue for SMI’s two Basic strategies.Although gathered from reliable sources, data accuracy cannot be guaranteed.
Page 19Fund Performance Rankings | SoundMindInvesting.com
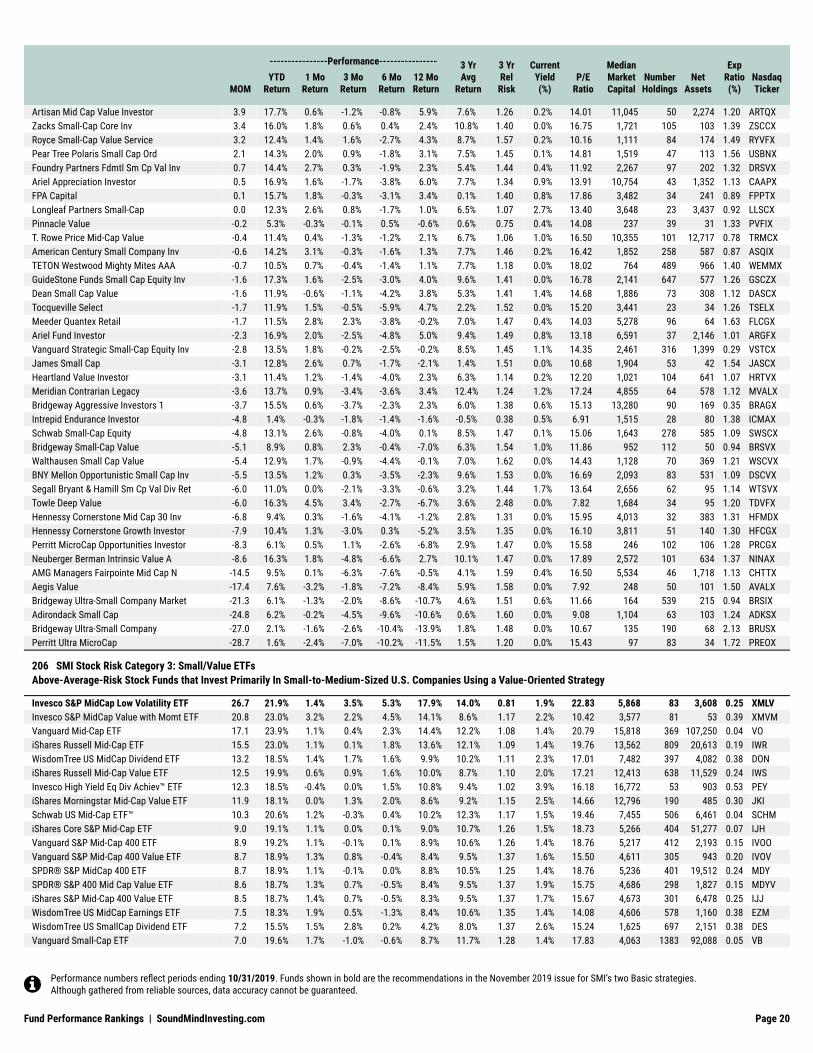
Artisan Mid Cap Value Investor 3.9 17.7% 0.6% -1.2% -0.8% 5.9% 7.6% 1.26 0.2% 14.01 11,045 50 2,274 1.20 ARTQXZacks Small-Cap Core Inv 3.4 16.0% 1.8% 0.6% 0.4% 2.4% 10.8% 1.40 0.0% 16.75 1,721 105 103 1.39 ZSCCXRoyce Small-Cap Value Service 3.2 12.4% 1.4% 1.6% -2.7% 4.3% 8.7% 1.57 0.2% 10.16 1,111 84 174 1.49 RYVFXPear Tree Polaris Small Cap Ord 2.1 14.3% 2.0% 0.9% -1.8% 3.1% 7.5% 1.45 0.1% 14.81 1,519 47 113 1.56 USBNXFoundry Partners Fdmtl Sm Cp Val Inv 0.7 14.4% 2.7% 0.3% -1.9% 2.3% 5.4% 1.44 0.4% 11.92 2,267 97 202 1.32 DRSVXAriel Appreciation Investor 0.5 16.9% 1.6% -1.7% -3.8% 6.0% 7.7% 1.34 0.9% 13.91 10,754 43 1,352 1.13 CAAPXFPA Capital 0.1 15.7% 1.8% -0.3% -3.1% 3.4% 0.1% 1.40 0.8% 17.86 3,482 34 241 0.89 FPPTXLongleaf Partners Small-Cap 0.0 12.3% 2.6% 0.8% -1.7% 1.0% 6.5% 1.07 2.7% 13.40 3,648 23 3,437 0.92 LLSCXPinnacle Value -0.2 5.3% -0.3% -0.1% 0.5% -0.6% 0.6% 0.75 0.4% 14.08 237 39 31 1.33 PVFIXT. Rowe Price Mid-Cap Value -0.4 11.4% 0.4% -1.3% -1.2% 2.1% 6.7% 1.06 1.0% 16.50 10,355 101 12,717 0.78 TRMCXAmerican Century Small Company Inv -0.6 14.2% 3.1% -0.3% -1.6% 1.3% 7.7% 1.46 0.2% 16.42 1,852 258 587 0.87 ASQIXTETON Westwood Mighty Mites AAA -0.7 10.5% 0.7% -0.4% -1.4% 1.1% 7.7% 1.18 0.0% 18.02 764 489 966 1.40 WEMMXGuideStone Funds Small Cap Equity Inv -1.6 17.3% 1.6% -2.5% -3.0% 4.0% 9.6% 1.41 0.0% 16.78 2,141 647 577 1.26 GSCZXDean Small Cap Value -1.6 11.9% -0.6% -1.1% -4.2% 3.8% 5.3% 1.41 1.4% 14.68 1,886 73 308 1.12 DASCXTocqueville Select -1.7 11.9% 1.5% -0.5% -5.9% 4.7% 2.2% 1.52 0.0% 15.20 3,441 23 34 1.26 TSELXMeeder Quantex Retail -1.7 11.5% 2.8% 2.3% -3.8% -0.2% 7.0% 1.47 0.4% 14.03 5,278 96 64 1.63 FLCGXAriel Fund Investor -2.3 16.9% 2.0% -2.5% -4.8% 5.0% 9.4% 1.49 0.8% 13.18 6,591 37 2,146 1.01 ARGFXVanguard Strategic Small-Cap Equity Inv -2.8 13.5% 1.8% -0.2% -2.5% -0.2% 8.5% 1.45 1.1% 14.35 2,461 316 1,399 0.29 VSTCXJames Small Cap -3.1 12.8% 2.6% 0.7% -1.7% -2.1% 1.4% 1.51 0.0% 10.68 1,904 53 42 1.54 JASCXHeartland Value Investor -3.1 11.4% 1.2% -1.4% -4.0% 2.3% 6.3% 1.14 0.2% 12.20 1,021 104 641 1.07 HRTVXMeridian Contrarian Legacy -3.6 13.7% 0.9% -3.4% -3.6% 3.4% 12.4% 1.24 1.2% 17.24 4,855 64 578 1.12 MVALXBridgeway Aggressive Investors 1 -3.7 15.5% 0.6% -3.7% -2.3% 2.3% 6.0% 1.38 0.6% 15.13 13,280 90 169 0.35 BRAGXIntrepid Endurance Investor -4.8 1.4% -0.3% -1.8% -1.4% -1.6% -0.5% 0.38 0.5% 6.91 1,515 28 80 1.38 ICMAXSchwab Small-Cap Equity -4.8 13.1% 2.6% -0.8% -4.0% 0.1% 8.5% 1.47 0.1% 15.06 1,643 278 585 1.09 SWSCXBridgeway Small-Cap Value -5.1 8.9% 0.8% 2.3% -0.4% -7.0% 6.3% 1.54 1.0% 11.86 952 112 50 0.94 BRSVXWalthausen Small Cap Value -5.4 12.9% 1.7% -0.9% -4.4% -0.1% 7.0% 1.62 0.0% 14.43 1,128 70 369 1.21 WSCVXBNY Mellon Opportunistic Small Cap Inv -5.5 13.5% 1.2% 0.3% -3.5% -2.3% 9.6% 1.53 0.0% 16.69 2,093 83 531 1.09 DSCVXSegall Bryant & Hamill Sm Cp Val Div Ret -6.0 11.0% 0.0% -2.1% -3.3% -0.6% 3.2% 1.44 1.7% 13.64 2,656 62 95 1.14 WTSVXTowle Deep Value -6.0 16.3% 4.5% 3.4% -2.7% -6.7% 3.6% 2.48 0.0% 7.82 1,684 34 95 1.20 TDVFXHennessy Cornerstone Mid Cap 30 Inv -6.8 9.4% 0.3% -1.6% -4.1% -1.2% 2.8% 1.31 0.0% 15.95 4,013 32 383 1.31 HFMDXHennessy Cornerstone Growth Investor -7.9 10.4% 1.3% -3.0% 0.3% -5.2% 3.5% 1.35 0.0% 16.10 3,811 51 140 1.30 HFCGXPerritt MicroCap Opportunities Investor -8.3 6.1% 0.5% 1.1% -2.6% -6.8% 2.9% 1.47 0.0% 15.58 246 102 106 1.28 PRCGXNeuberger Berman Intrinsic Value A -8.6 16.3% 1.8% -4.8% -6.6% 2.7% 10.1% 1.47 0.0% 17.89 2,572 101 634 1.37 NINAXAMG Managers Fairpointe Mid Cap N -14.5 9.5% 0.1% -6.3% -7.6% -0.5% 4.1% 1.59 0.4% 16.50 5,534 46 1,718 1.13 CHTTXAegis Value -17.4 7.6% -3.2% -1.8% -7.2% -8.4% 5.9% 1.58 0.0% 7.92 248 50 101 1.50 AVALXBridgeway Ultra-Small Company Market -21.3 6.1% -1.3% -2.0% -8.6% -10.7% 4.6% 1.51 0.6% 11.66 164 539 215 0.94 BRSIXAdirondack Small Cap -24.8 6.2% -0.2% -4.5% -9.6% -10.6% 0.6% 1.60 0.0% 9.08 1,104 63 103 1.24 ADKSXBridgeway Ultra-Small Company -27.0 2.1% -1.6% -2.6% -10.4% -13.9% 1.8% 1.48 0.0% 10.67 135 190 68 2.13 BRUSXPerritt Ultra MicroCap -28.7 1.6% -2.4% -7.0% -10.2% -11.5% 1.5% 1.20 0.0% 15.43 97 83 34 1.72 PREOX
206 SMI Stock Risk Category 3: Small/Value ETFsAbove-Average-Risk Stock Funds that Invest Primarily In Small-to-Medium-Sized U.S. Companies Using a Value-Oriented Strategy
Invesco S&P MidCap Low Volatility ETF 26.7 21.9% 1.4% 3.5% 5.3% 17.9% 14.0% 0.81 1.9% 22.83 5,868 83 3,608 0.25 XMLVInvesco S&P MidCap Value with Momt ETF 20.8 23.0% 3.2% 2.2% 4.5% 14.1% 8.6% 1.17 2.2% 10.42 3,577 81 53 0.39 XMVMVanguard Mid-Cap ETF 17.1 23.9% 1.1% 0.4% 2.3% 14.4% 12.2% 1.08 1.4% 20.79 15,818 369 107,250 0.04 VOiShares Russell Mid-Cap ETF 15.5 23.0% 1.1% 0.1% 1.8% 13.6% 12.1% 1.09 1.4% 19.76 13,562 809 20,613 0.19 IWRWisdomTree US MidCap Dividend ETF 13.2 18.5% 1.4% 1.7% 1.6% 9.9% 10.2% 1.11 2.3% 17.01 7,482 397 4,082 0.38 DONiShares Russell Mid-Cap Value ETF 12.5 19.9% 0.6% 0.9% 1.6% 10.0% 8.7% 1.10 2.0% 17.21 12,413 638 11,529 0.24 IWSInvesco High Yield Eq Div Achiev™ ETF 12.3 18.5% -0.4% 0.0% 1.5% 10.8% 9.4% 1.02 3.9% 16.18 16,772 53 903 0.53 PEYiShares Morningstar Mid-Cap Value ETF 11.9 18.1% 0.0% 1.3% 2.0% 8.6% 9.2% 1.15 2.5% 14.66 12,796 190 485 0.30 JKISchwab US Mid-Cap ETF™ 10.3 20.6% 1.2% -0.3% 0.4% 10.2% 12.3% 1.17 1.5% 19.46 7,455 506 6,461 0.04 SCHMiShares Core S&P Mid-Cap ETF 9.0 19.1% 1.1% 0.0% 0.1% 9.0% 10.7% 1.26 1.5% 18.73 5,266 404 51,277 0.07 IJHVanguard S&P Mid-Cap 400 ETF 8.9 19.2% 1.1% -0.1% 0.1% 8.9% 10.6% 1.26 1.4% 18.76 5,217 412 2,193 0.15 IVOOVanguard S&P Mid-Cap 400 Value ETF 8.7 18.9% 1.3% 0.8% -0.4% 8.4% 9.5% 1.37 1.6% 15.50 4,611 305 943 0.20 IVOVSPDR® S&P MidCap 400 ETF 8.7 18.9% 1.1% -0.1% 0.0% 8.8% 10.5% 1.25 1.4% 18.76 5,236 401 19,512 0.24 MDYSPDR® S&P 400 Mid Cap Value ETF 8.6 18.7% 1.3% 0.7% -0.5% 8.4% 9.5% 1.37 1.9% 15.75 4,686 298 1,827 0.15 MDYViShares S&P Mid-Cap 400 Value ETF 8.5 18.7% 1.4% 0.7% -0.5% 8.3% 9.5% 1.37 1.7% 15.67 4,673 301 6,478 0.25 IJJWisdomTree US MidCap Earnings ETF 7.5 18.3% 1.9% 0.5% -1.3% 8.4% 10.6% 1.35 1.4% 14.08 4,606 578 1,160 0.38 EZMWisdomTree US SmallCap Dividend ETF 7.2 15.5% 1.5% 2.8% 0.2% 4.2% 8.0% 1.37 2.6% 15.24 1,625 697 2,151 0.38 DESVanguard Small-Cap ETF 7.0 19.6% 1.7% -1.0% -0.6% 8.7% 11.7% 1.28 1.4% 17.83 4,063 1383 92,088 0.05 VB
----------------Performance----------------
MOMYTD
Return1 Mo
Return3 Mo
Return6 Mo
Return12 MoReturn
3 YrAvg
Return
3 YrRelRisk
CurrentYield(%)
P/ERatio
MedianMarketCapital
NumberHoldings
NetAssets
ExpRatio(%)
NasdaqTicker
Performance numbers reflect periods ending 10/31/2019. Funds shown in bold are the recommendations in the November 2019 issue for SMI’s two Basic strategies.Although gathered from reliable sources, data accuracy cannot be guaranteed.
Page 20Fund Performance Rankings | SoundMindInvesting.com

Alpha Architect US Quantitative Val ETF 6.7 18.6% 5.2% 3.6% -1.1% 4.3% 10.5% 1.64 1.8% 11.53 13,640 41 99 0.49 QVALSchwab Fundamental US Small Company ETF 6.6 18.1% 1.7% 0.9% 0.1% 5.6% 10.0% 1.34 1.5% 16.10 2,826 915 3,687 0.25 FNDASPDR® S&P 600 Small Cap Value ETF 6.3 17.5% 2.0% 2.2% 0.3% 3.8% 10.2% 1.55 1.8% 14.77 1,477 449 2,341 0.15 SLYViShares S&P Small-Cap 600 Value ETF 6.0 17.5% 2.0% 2.2% 0.3% 3.6% 10.1% 1.56 1.5% 14.68 1,477 456 6,503 0.25 IJSVanguard S&P Small-Cap 600 Value ETF 5.8 17.6% 1.8% 2.0% 0.1% 3.7% 10.3% 1.56 1.6% 15.15 1,459 453 456 0.20 VIOVVanguard Small-Cap Value ETF 4.7 16.6% 1.8% 0.0% -1.1% 5.7% 9.0% 1.32 2.0% 14.47 3,684 862 31,199 0.07 VBRiShares Russell 2000 Value ETF 4.1 15.4% 2.5% 1.7% -0.6% 3.0% 8.4% 1.45 1.9% 13.62 1,592 1395 9,599 0.24 IWNiShares Core S&P Small-Cap ETF 3.7 15.8% 2.0% 0.6% -0.2% 3.3% 11.7% 1.47 1.4% 16.81 1,641 607 45,848 0.07 IJRSchwab US Small-Cap ETF™ 3.7 18.5% 2.1% -1.3% -1.1% 6.1% 10.5% 1.36 1.5% 16.64 2,535 1739 8,597 0.04 SCHAVanguard Russell 2000 ETF 3.7 17.5% 2.7% -0.3% -1.0% 5.0% 11.0% 1.40 1.3% 16.92 1,776 2029 2,453 0.15 VTWOVanguard S&P Small-Cap 600 ETF 3.7 15.7% 2.0% 0.7% -0.2% 3.2% 11.7% 1.47 1.1% 17.33 1,638 609 2,315 0.15 VIOOVanguard Russell 2000 Value ETF 3.6 15.3% 1.6% 1.3% -0.7% 2.9% 8.4% 1.45 1.7% 13.72 1,554 1417 429 0.20 VTWViShares Russell 2000 ETF 3.5 17.2% 2.7% -0.3% -1.1% 5.0% 10.9% 1.40 1.3% 16.89 1,826 1997 45,403 0.19 IWMSPDR® S&P 600 Small Cap ETF 3.4 15.5% 2.0% 0.5% -0.2% 3.1% 11.6% 1.47 1.4% 16.81 1,646 603 1,335 0.15 SLYWisdomTree US SmallCap Earnings ETF 1.2 14.9% 2.3% 1.7% -2.7% 2.2% 11.6% 1.59 1.4% 11.45 1,183 838 811 0.38 EESiShares Morningstar Small-Cap Value ETF -6.0 12.3% 1.6% -0.8% -4.2% -1.0% 5.0% 1.50 2.4% 12.08 3,166 244 407 0.30 JKLiShares Micro-Cap ETF -8.6 10.7% 2.6% -1.6% -3.8% -3.2% 8.2% 1.46 1.1% 13.28 439 1395 817 0.60 IWC
207 SMI Stock Risk Category 4: Small/Growth FundsAbove-Average-Risk Stock Funds that Invest Primarily In Small-to-Medium-Sized U.S. Companies Using a Growth-Oriented Strategy
Needham Growth Retail 39.7 33.2% 4.0% 4.8% 9.7% 25.2% 11.7% 1.20 0.0% 20.66 7,710 67 105 2.76 NEEGXHennessy Focus Investor 37.5 30.6% 1.9% 4.5% 8.9% 24.2% 13.5% 0.95 0.0% 18.73 16,445 18 1,851 1.48 HFCSXValue Line Mid Cap Focused 32.4 30.1% 0.0% 0.9% 6.7% 24.8% 19.1% 0.96 0.0% 32.68 14,750 45 442 1.18 VLIFXValue Line Premier Growth 31.5 30.5% 0.6% 0.7% 6.1% 24.7% 18.3% 0.98 0.0% 33.78 36,321 65 479 1.20 VALSXDF Dent Midcap Growth Investor 30.8 33.2% 0.5% 0.5% 5.4% 24.9% 21.1% 1.10 0.0% 36.23 14,336 33 177 0.98 DFDMXJanus Henderson Contrarian T 28.5 31.7% 1.3% 1.0% 4.6% 22.9% 13.2% 1.29 0.2% 20.04 15,783 43 2,919 0.74 JSVAXBuffalo Mid Cap 27.6 31.6% 1.0% 0.0% 3.5% 24.1% 13.4% 1.14 0.0% 28.09 16,024 64 168 1.02 BUFMXFAM Value Investor 26.2 24.2% 1.6% 2.5% 5.8% 17.9% 14.1% 1.02 0.1% 21.10 20,305 36 1,390 1.19 FAMVXFidelity® Growth Strategies 25.4 28.2% 2.3% -0.3% 5.7% 20.0% 14.1% 1.03 0.6% 29.41 20,770 108 2,945 0.59 FDEGXBaron Growth Retail 25.3 32.9% 2.9% 1.3% 3.1% 20.9% 19.8% 1.29 0.0% 31.35 8,616 60 6,954 1.29 BGRFXFAM Dividend Focus Fund Investor 23.6 25.5% 0.5% 0.1% 3.5% 19.9% 15.9% 1.02 0.6% 24.81 16,118 32 419 1.24 FAMEXT. Rowe Price Diversified Mid Cap Gr 23.4 29.2% 1.7% -1.0% 3.4% 21.1% 17.8% 1.11 0.3% 25.51 14,681 312 1,660 0.83 PRDMXJanus Henderson Enterprise T 22.5 27.3% -0.2% -0.9% 3.7% 19.7% 18.4% 1.04 0.1% 25.45 14,496 84 21,618 0.91 JAENXCommerce MidCap Growth 22.2 28.2% 0.6% -0.8% 3.2% 19.8% 16.4% 1.00 0.4% 26.25 12,327 83 225 0.84 CFAGXBaron Asset Retail 22.0 30.8% 1.4% -1.8% 3.3% 20.6% 19.6% 1.16 0.0% 35.84 16,798 59 4,385 1.30 BARAXBaron Partners Retail 21.5 29.0% 4.7% -1.0% 6.2% 16.4% 21.3% 1.40 0.0% 28.82 14,248 31 2,434 2.03 BPTRXFAM Small Cap Investor 21.0 21.6% 1.8% 3.3% 7.6% 10.1% 9.5% 1.18 0.0% 19.92 1,904 27 191 1.29 FAMFXT. Rowe Price Small-Cap Stock 20.3 26.5% 1.7% 0.1% 4.3% 15.9% 16.3% 1.20 0.0% 22.83 3,329 264 10,123 0.89 OTCFXParnassus Mid-Cap 19.4 23.1% -1.1% -0.6% 3.4% 16.5% 12.1% 0.91 0.6% 25.71 13,696 42 4,212 0.99 PARMXColumbia Mid Cap Growth Inst 17.4 26.4% 2.6% -1.0% 0.7% 17.7% 15.0% 1.15 0.0% 27.86 11,961 64 1,669 0.92 CLSPXArtisan Mid Cap Investor 16.9 30.4% 1.2% -5.3% 2.5% 19.7% 15.0% 1.24 0.0% 36.63 18,061 71 5,059 1.18 ARTMXT. Rowe Price New Horizons 16.7 28.4% 1.6% -3.2% 3.1% 16.8% 22.3% 1.17 0.0% 32.79 8,893 161 26,408 0.77 PRNHXBuffalo Discovery 16.6 25.9% -0.2% -2.9% 1.2% 18.3% 14.7% 1.07 0.0% 36.36 15,506 84 1,745 1.02 BUFTXQuartileMarsico 21st Century 16.4 25.6% -0.6% -2.2% 2.2% 16.5% 17.7% 1.10 0.0% 34.60 14,804 54 274 1.42 MXXIXT. Rowe Price Mid-Cap Growth 16.3 23.6% 0.2% -2.1% 2.5% 15.9% 16.4% 1.04 0.1% 26.18 14,852 134 33,348 0.75 RPMGXAzzad Ethical 15.9 23.2% 1.8% -1.6% 1.0% 16.6% 14.8% 1.18 0.0% 26.32 13,429 165 90 0.99 ADJEXDF Dent Small Cap Growth Investor 15.9 27.5% 1.3% -2.5% 1.6% 16.8% 14.8% 1.17 0.0% 36.76 3,677 49 19 1.05 DFDSXFidelity® Stock Selector Small Cap 15.0 22.5% 3.3% 0.6% 2.4% 11.9% 11.7% 1.28 0.2% 19.38 3,088 231 1,029 0.68 FDSCXWasatch Micro Cap 14.6 27.2% 2.3% -1.4% 1.7% 14.3% 22.4% 1.37 0.0% 25.25 952 74 495 1.65 WMICXFidelity® Small Cap Stock 13.8 22.6% 1.8% 0.6% 1.9% 11.3% 11.0% 1.22 0.3% 19.16 2,156 176 1,458 0.67 FSLCXT. Rowe Price QM US Small-Cap Gr Eq 13.1 24.0% 1.4% -0.9% 2.2% 11.9% 15.0% 1.25 0.0% 24.57 4,442 283 8,104 0.80 PRDSXBuffalo Small Cap 12.4 29.5% 3.8% -1.3% 0.4% 13.4% 18.0% 1.60 0.0% 27.32 2,371 79 525 1.01 BUFSXArtisan Small Cap Investor 12.4 29.5% 1.8% -4.5% 0.9% 16.1% 19.2% 1.44 0.0% 36.90 4,562 67 1,837 1.21 ARTSXBuffalo Emerging Opportunities 12.2 23.1% 3.4% -1.1% 0.4% 12.9% 17.8% 1.25 0.0% 31.35 1,233 70 88 1.49 BUFOXBaron Focused Growth Retail 12.0 17.0% 3.8% -0.3% 2.0% 10.3% 16.6% 1.20 0.0% 29.85 9,404 19 236 1.35 BFGFXChamplain Mid Cap Adv 12.0 20.0% 1.2% -1.4% -0.7% 14.2% 16.0% 1.03 0.0% 25.58 11,523 66 3,671 1.15 CIPMXValue Line Small Cap Opportunities Inv 11.7 20.7% 1.0% -2.0% 1.0% 12.7% 14.2% 1.16 0.0% 25.97 3,490 143 458 1.21 VLEOXWasatch Core Growth 11.3 24.2% 1.4% -1.4% 0.3% 12.4% 16.3% 1.29 0.0% 27.62 4,217 59 2,361 1.18 WGROXAMG GW&K Small Cap Core N 10.8 22.3% 1.4% -0.5% 2.9% 8.3% 11.2% 1.26 0.0% 21.55 2,994 78 440 1.28 GWETX
----------------Performance----------------
MOMYTD
Return1 Mo
Return3 Mo
Return6 Mo
Return12 MoReturn
3 YrAvg
Return
3 YrRelRisk
CurrentYield(%)
P/ERatio
MedianMarketCapital
NumberHoldings
NetAssets
ExpRatio(%)
NasdaqTicker
Performance numbers reflect periods ending 10/31/2019. Funds shown in bold are the recommendations in the November 2019 issue for SMI’s two Basic strategies.Although gathered from reliable sources, data accuracy cannot be guaranteed.
Page 21Fund Performance Rankings | SoundMindInvesting.com

American Beacon Stephens Mid-Cap Gr Inv 9.2 22.7% 1.0% -3.3% -0.5% 13.0% 18.5% 1.21 0.0% 32.79 14,878 93 330 1.25 STMGXVanguard Mid Cap Growth Inv 9.2 24.9% 0.8% -3.3% -1.1% 13.6% 15.2% 1.18 0.3% 29.41 14,559 155 4,536 0.36 VMGRXTocqueville Opportunity 9.1 30.9% 2.5% -6.8% -1.0% 16.9% 18.9% 1.69 0.0% 38.91 17,620 197 84 1.27 TOPPXWasatch Ultra Growth 9.0 21.7% 1.1% -1.8% -2.9% 13.7% 22.1% 1.42 0.0% 29.59 2,406 87 655 1.25 WAMCXSit Mid Cap Growth 8.8 22.3% 1.5% -2.7% -1.1% 12.7% 12.2% 1.20 0.0% 24.27 13,123 82 164 1.25 NBNGXFidelity® Small Cap Growth 8.7 24.6% 1.3% -3.2% 1.2% 10.7% 17.9% 1.31 0.0% 24.27 4,044 185 3,824 1.05 FCPGXMedian 22.3% 1.6% -2.0% -0.6% 11.6% 15.0%Wasatch Small Cap Growth Investor 8.2 26.1% 0.7% -5.4% -0.8% 14.4% 17.6% 1.37 0.0% 28.74 3,550 72 1,715 1.20 WAAEXBaron Small Cap Retail 8.1 26.4% 2.8% -2.2% -2.0% 12.3% 16.0% 1.37 0.0% 38.61 5,749 74 3,955 1.30 BSCFXVanguard Explorer Inv 7.5 21.6% 1.4% -2.2% -0.5% 10.2% 16.2% 1.31 0.3% 22.52 4,896 583 16,088 0.46 VEXPXThrift Savings Plan S Fund 7.4 7.0% 1.9% -1.3% -0.3% 9.1% 12.2% na na na na na na 0.03 THRIFTSVanguard Extended Market Index Admiral 7.4 19.8% 1.9% -1.3% -0.3% 9.0% 12.1% 1.25 1.2% 18.73 4,525 3304 70,402 0.07 VEXAXWasatch Micro Cap Value 6.9 19.6% 2.5% -2.1% -0.6% 9.6% 14.3% 1.15 0.5% 20.70 614 99 253 1.74 WAMVXChamplain Small Company Adv 6.9 19.4% 1.8% -0.5% -0.6% 8.1% 12.4% 1.26 0.0% 24.15 2,756 71 2,042 1.30 CIPSXMFAM Mid Cap Growth Inv 6.4 19.5% 1.6% -3.1% -1.3% 10.7% 14.2% 1.34 0.0% 29.33 8,617 33 267 1.12 TMFGXAMG Managers Brandywine I 6.0 20.9% 2.7% -2.5% -2.2% 10.8% 15.0% 1.28 0.0% 29.15 24,380 57 804 1.10 BRWIXBrown Advisory Small-Cap Growth Inv 5.8 24.8% 0.5% -5.9% -1.3% 13.0% 12.9% 1.21 0.3% 28.99 4,433 78 1,371 1.15 BIASXJanus Henderson Venture T 5.7 22.3% 1.4% -2.7% -1.7% 10.0% 14.1% 1.26 0.0% 24.33 3,801 119 3,426 0.91 JAVTXMadison Small Cap Y 3.8 18.8% 2.9% 1.4% -1.3% 3.7% 7.9% 1.34 0.0% 18.02 3,149 60 271 1.23 BVAOXFiera Capital Small/Mid-Cap Growth Instl 3.8 20.9% 2.8% -4.2% -2.1% 10.1% 13.7% 1.34 0.0% 24.10 7,221 70 179 1.05 APSGXJanus Henderson Triton T 2.6 20.7% -0.6% -4.8% -1.7% 9.1% 15.6% 1.25 0.0% 24.10 5,119 118 11,574 0.91 JATTXSit Small Cap Growth 2.6 21.4% 1.6% -3.8% -2.3% 8.7% 10.9% 1.35 0.0% 23.47 5,854 85 97 1.50 SSMGXEventide Gilead N 2.2 23.7% 2.1% -6.6% -5.1% 14.0% 19.0% 1.38 0.0% na 8,952 64 2,397 1.39 ETGLXMeridian Growth Legacy 1.0 17.9% 0.7% -1.0% -2.5% 4.5% 13.9% 1.23 0.1% 20.49 3,558 95 2,197 0.85 MERDXAMG Managers Brandywine Advisors MC Gr N 0.9 19.7% 3.7% -3.1% -3.8% 7.9% 12.4% 1.34 0.0% 25.91 8,896 45 147 1.13 BWAFXDelaware Smid Cap Growth A 0.4 27.9% 2.2% -8.1% -1.5% 9.9% 20.5% 1.79 0.0% 44.44 5,534 40 1,738 1.12 DFCIXBaron Discovery Retail 0.0 19.2% 3.7% -1.1% -3.4% 4.5% 19.7% 1.63 0.0% na 1,717 67 557 1.35 BDFFXMulti-Manager Small Cap Eq Strat A -0.3 15.7% 1.4% -1.9% -2.6% 4.2% 10.5% 1.40 0.0% 15.97 2,150 672 1,777 1.34 CSCEXBrown Capital Mgmt Small Co Inv -0.3 21.9% -1.5% -7.5% -3.6% 10.9% 18.0% 1.60 0.0% 45.05 4,394 40 5,237 1.26 BCSIXAMG Managers Special Equity N -1.0 19.2% 2.4% -5.9% -1.7% 6.6% 15.0% 1.41 0.0% 25.91 2,516 355 209 1.37 MGSEXWesMark Small Company Growth -1.2 12.7% 2.4% -2.0% -4.4% 5.3% 6.9% 1.42 0.0% 18.76 2,886 63 94 1.26 WMKSXDriehaus Micro Cap Growth -1.4 20.3% 4.9% -6.2% -1.1% 5.9% 19.6% 1.63 0.0% na 1,216 120 238 1.44 DMCRXConestoga Small Cap Investors -1.6 16.9% -1.6% -5.9% -2.8% 7.2% 18.8% 1.36 0.0% 32.15 2,641 52 2,631 1.10 CCASXHomestead Small Company Stock -2.0 16.8% 1.5% -1.1% -1.7% 0.8% 4.2% 1.55 0.4% 19.61 2,266 57 358 0.99 HSCSXPRIMECAP Odyssey Aggressive Growth -3.2 13.5% 3.5% -4.8% -3.1% 4.7% 14.8% 1.56 0.1% 16.26 11,778 174 10,109 0.64 POAGXQuantified Market Leaders Investor -3.3 13.9% 3.7% -1.7% -3.2% 1.7% 9.2% 1.46 1.1% 19.49 44,570 14 160 1.73 QMLFXNeuberger Berman Small Cap Growth A -3.5 22.7% 2.1% -8.8% -6.6% 11.9% 20.9% 1.40 0.0% 26.95 2,926 96 217 1.27 NSNAXAve Maria Value -4.0 15.0% -1.9% -5.4% -4.1% 5.5% 9.9% 1.02 0.0% 16.98 8,553 43 240 1.10 AVEMXWilliam Blair Small Cap Growth N -4.1 15.4% -0.1% -3.7% -3.8% 3.3% 16.2% 1.30 0.0% 22.37 2,180 83 665 1.50 WBSNXCarillon Scout Small Cap I -4.6 15.3% 1.6% -4.3% -4.9% 4.6% 17.2% 1.53 0.0% 24.51 2,384 74 326 0.92 UMBHXRoyce Smaller-Companies Growth Svc -6.2 17.0% 3.0% -5.7% -2.8% 2.3% 11.6% 1.41 0.0% 30.58 1,417 107 259 1.49 RYVPXAlger Small Cap Focus A -7.1 17.3% -0.8% -11.1% -2.6% 6.6% 22.1% 1.61 0.0% 50.76 4,540 51 3,766 1.18 AOFAXAmerican Century Adaptive Small Cap Inv -7.8 8.7% 3.4% -0.8% -4.2% -2.8% 4.4% 1.15 0.9% 13.99 1,724 141 37 1.16 ACMNXAmerican Beacon Stephens Sm Cp Gr Inv -10.1 15.5% -0.2% -7.7% -5.4% 2.9% 14.6% 1.42 0.0% 29.24 3,562 93 390 1.31 STSGXBridgeway Small-Cap Growth -10.7 8.6% 4.8% -1.4% -4.4% -4.9% 9.3% 1.56 0.4% 13.16 1,210 100 36 0.94 BRSGXOberweis Micro-Cap -13.5 16.1% 3.6% -4.6% -8.6% -0.2% 13.9% 1.62 0.0% 20.49 794 78 76 1.57 OBMCXAMG Managers LMCG Small Cap Growth N -16.3 12.6% 1.2% -7.1% -9.9% 0.7% 11.8% 1.52 0.0% 26.39 2,695 60 45 1.31 ACWDXKinetics Market Opportunities No Load -16.7 13.0% -2.6% -10.2% -4.9% -1.6% 16.6% 1.38 0.0% 22.52 6,963 42 83 1.40 KMKNXKinetics Small Cap Opportunities No Load -20.0 12.6% -3.0% -9.6% -7.5% -2.9% 15.3% 1.31 0.0% 17.36 4,219 39 256 1.65 KSCOXHodges Small Cap Retail -23.1 10.9% -0.7% -7.0% -9.7% -6.4% 5.7% 1.71 0.0% 15.27 2,696 52 385 1.29 HDPSXKinetics Paradigm No Load -23.4 15.8% -3.6% -11.8% -8.3% -3.3% 14.2% 1.46 0.0% 18.90 8,027 62 726 1.64 WWNPXHodges Retail -30.5 15.3% -2.4% -8.1% -13.6% -8.7% -0.9% 2.11 0.0% 9.98 3,317 45 156 1.18 HDPMX
208 SMI Stock Risk Category 4: Small/Growth ETFsAbove-Average-Risk Stock Funds that Invest Primarily In Small-to-Medium-Sized U.S. Companies Using a Growth-Oriented Strategy
iShares Russell Mid-Cap Growth ETF 19.5 27.2% 1.9% -1.1% 2.0% 18.6% 16.6% 1.16 0.6% 25.91 15,555 407 10,818 0.24 IWPInvesco DWA Momentum ETF 18.4 26.1% 0.2% -1.0% 4.0% 15.4% 14.4% 1.12 0.3% 30.86 27,867 103 1,585 0.62 PDPiShares Morningstar Mid-Cap Growth ETF 14.9 26.8% 1.1% -3.7% 0.9% 17.7% 16.8% 1.18 0.2% 30.77 14,103 195 494 0.30 JKHVanguard Small-Cap Growth ETF 9.6 23.2% 1.5% -2.4% -0.2% 12.2% 15.0% 1.29 0.6% 26.53 4,585 625 24,175 0.07 VBKSPDR® S&P 400 Mid Cap Growth ETF 9.1 19.3% 0.9% -0.9% 0.5% 9.5% 11.5% 1.18 1.3% 23.09 5,947 245 1,638 0.15 MDYG
----------------Performance----------------
MOMYTD
Return1 Mo
Return3 Mo
Return6 Mo
Return12 MoReturn
3 YrAvg
Return
3 YrRelRisk
CurrentYield(%)
P/ERatio
MedianMarketCapital
NumberHoldings
NetAssets
ExpRatio(%)
NasdaqTicker
Performance numbers reflect periods ending 10/31/2019. Funds shown in bold are the recommendations in the November 2019 issue for SMI’s two Basic strategies.Although gathered from reliable sources, data accuracy cannot be guaranteed.
Page 22Fund Performance Rankings | SoundMindInvesting.com

iShares S&P Mid-Cap 400 Growth ETF 8.9 19.2% 1.0% -0.9% 0.5% 9.3% 11.4% 1.18 1.1% 22.88 5,927 248 7,287 0.24 IJKVanguard S&P Mid-Cap 400 Growth ETF 8.8 19.4% 0.9% -0.9% 0.5% 9.3% 11.4% 1.18 0.9% 23.15 5,869 251 954 0.20 IVOGVanguard Extended Market ETF 7.4 19.8% 2.0% -1.3% -0.3% 9.0% 12.1% 1.25 1.2% 18.73 4,525 3304 70,402 0.07 VXFVanguard Russell 2000 Growth ETF 2.7 18.9% 3.0% -2.3% -1.5% 6.5% 13.2% 1.41 0.7% 23.15 2,029 1186 772 0.20 VTWGiShares Russell 2000 Growth ETF 2.6 18.8% 3.0% -2.2% -1.6% 6.4% 13.3% 1.41 0.7% 23.36 2,089 1160 9,027 0.24 IWOSPDR® S&P 600 Small Cap Growth ETF 0.9 13.7% 2.1% -1.0% -0.8% 2.8% 13.0% 1.42 1.1% 19.80 1,846 341 1,876 0.15 SLYGiShares S&P Small-Cap 600 Growth ETF 0.9 13.7% 2.1% -0.9% -0.8% 2.6% 12.9% 1.42 1.0% 19.69 1,841 344 5,235 0.25 IJTVanguard S&P Small-Cap 600 Growth ETF 0.8 14.0% 2.0% -1.1% -0.8% 2.7% 13.0% 1.42 1.0% 20.33 1,844 338 397 0.20 VIOGiShares Morningstar Small-Cap Growth ETF 0.6 19.9% 2.4% -4.3% -2.7% 7.6% 14.5% 1.40 0.3% 31.45 3,474 249 211 0.30 JKKInvesco DWA SmallCap Momentum ETF -1.8 18.3% 2.8% -6.3% 0.9% 3.7% 13.5% 1.55 0.0% 22.47 1,278 203 224 0.60 DWASInvesco DWA NASDAQ Momentum ETF -4.4 23.9% 1.2% -11.6% -3.1% 10.4% 14.1% 1.54 0.0% 32.68 6,940 102 44 0.60 DWAQInvesco S&P MidCap 400® Pure Growth ETF -8.3 10.1% 2.0% -1.5% -4.8% -2.0% 7.2% 1.32 0.7% 20.24 4,941 87 398 0.35 RFGInvesco S&P SmallCap 600® Pure Gr ETF -17.2 4.4% 1.4% -3.5% -6.2% -7.6% 10.0% 1.57 0.7% 15.85 1,399 150 182 0.35 RZG
209 SMI Stock Risk Category 5: Foreign FundsAbove-Average-Risk Stock Portfolios that Invest More than 80% of Assets Outside the U.S. in Developed Markets, Typically in Europe and Japan
Wasatch International Opps Inv 34.5 27.3% 4.0% 4.6% 7.9% 22.0% 9.2% 1.10 0.0% 29.33 994 107 511 2.09 WAIOXFidelity® International Growth 33.5 26.2% 4.3% 4.9% 6.9% 21.7% 12.4% 0.96 0.7% 26.39 49,451 91 3,325 0.95 FIGFXFidelity® International Capital Apprec 30.3 25.7% 2.3% 2.4% 5.4% 22.5% 12.6% 0.99 0.4% 30.21 41,047 102 3,477 1.06 FIVFXArtisan International Investor 28.0 23.5% 3.1% 4.1% 7.0% 16.9% 11.5% 0.95 1.0% 20.88 49,151 82 10,561 1.18 ARTIXFidelity® Diversified International 26.8 22.2% 3.7% 4.8% 5.9% 16.0% 8.9% 0.96 1.1% 21.93 38,286 191 12,991 0.81 FDIVXSextant International 26.4 22.5% 1.5% 0.8% 4.2% 21.5% 13.8% 0.84 0.8% 22.57 43,661 34 111 1.05 SSIFXLazard Global Listed Infrastructure Open 25.7 19.7% 1.8% 4.1% 6.6% 15.1% 13.1% 0.77 6.5% 18.08 16,690 32 7,549 1.21 GLFOXMorgan Stanley Inst International Opp A 24.0 25.8% 4.3% 2.1% 0.5% 21.3% 17.3% 1.28 0.0% 35.21 18,889 57 1,641 1.34 MIOPXArtisan International Small-Mid Investor 22.9 26.1% 4.6% 3.4% 4.2% 15.3% 10.4% 1.13 0.0% 27.93 3,648 147 1,224 1.36 ARTJXFidelity® Overseas 21.7 21.1% 2.8% 3.4% 4.5% 13.8% 9.9% 0.95 1.3% 23.70 23,244 139 7,219 0.97 FOSFXCarillon Scout International I 21.3 20.0% 4.8% 5.8% 3.3% 12.2% 7.5% 1.06 3.2% 14.93 33,073 69 734 1.07 UMBWXAmerican Funds Intl Gr and Inc F1 21.2 18.9% 3.2% 3.4% 3.5% 14.2% 8.0% 0.94 2.1% 15.11 38,516 231 16,151 0.93 IGIFXDriehaus International Small Cap Growth 21.1 21.8% 4.1% 4.2% 6.1% 10.8% 11.1% 1.06 0.0% 23.26 3,592 107 257 1.23 DRIOXAberdeen Select International Eq A 21.1 17.8% 3.1% 4.5% 1.5% 15.0% 8.8% 1.06 0.8% 21.23 22,885 49 149 2.30 BJBIXBuffalo International 21.0 20.8% 3.5% 3.6% 3.7% 13.8% 12.1% 0.97 0.5% 24.45 30,166 89 404 1.06 BUFIXFidelity® International Small Cap Opp 21.0 19.2% 3.6% 5.0% 3.0% 13.0% 11.0% 0.97 0.9% 21.51 2,106 132 1,320 1.11 FSCOXFidelity® Total International Equity 20.9 19.8% 3.0% 3.2% 2.7% 15.0% 9.1% 0.98 0.8% 17.45 34,857 334 98 1.20 FTIEXQuartileFidelity® International Discovery 20.4 19.7% 3.6% 4.0% 4.1% 12.3% 8.6% 0.96 1.1% 21.88 31,130 163 9,073 0.88 FIGRXJanus Henderson Overseas T 19.9 17.9% 5.1% 5.7% 3.0% 11.3% 8.3% 1.12 0.9% 14.95 50,659 42 1,341 0.77 JAOSXAmerican Funds Europacific Growth F1 19.8 19.4% 3.4% 2.6% 2.5% 14.8% 9.0% 1.02 1.1% 18.05 44,148 322 166,748 0.87 AEGFXT. Rowe Price Overseas Stock 19.8 16.9% 4.3% 6.2% 3.1% 10.5% 8.5% 1.01 1.9% 15.11 35,573 158 17,635 0.81 TROSXThrift Savings Plan I Fund 19.7 11.6% 3.6% 4.7% 3.5% 11.5% 8.9% na na na na na na 0.03 THRIFTIT. Rowe Price International Stock 18.7 18.9% 3.0% 2.7% 1.6% 14.4% 8.8% 1.01 1.3% 18.73 34,459 130 15,193 0.81 PRITXMarsico International Opportunities 18.3 24.3% 2.2% 2.1% 3.0% 13.3% 11.4% 1.21 0.0% 21.79 44,053 72 54 1.50 MIOFXBaron International Growth Retail 18.2 22.4% 3.3% 2.1% 2.2% 14.0% 9.4% 1.05 0.0% 23.47 12,660 101 301 1.20 BIGFXCalamos International Growth A 17.9 21.2% 3.0% 1.5% 3.3% 13.1% 8.5% 1.16 0.0% 29.50 45,857 95 208 1.10 CIGRXFPA International Value 17.8 16.6% 2.8% 3.5% 2.1% 12.2% 10.6% 0.86 0.9% 24.33 11,049 29 255 1.29 FPIVXOakmark International Investor 17.5 17.9% 5.5% 7.1% 1.1% 9.3% 6.9% 1.34 1.7% 14.04 26,719 91 33,404 0.96 OAKIXHomestead International Equity 17.5 18.5% 3.5% 3.4% 2.4% 11.7% 9.4% 1.01 1.5% 18.62 52,548 61 77 0.99 HISIXUSAA International 17.2 16.6% 3.4% 4.0% 2.2% 11.1% 8.8% 0.94 1.4% 13.62 18,220 699 3,615 1.06 USIFXVanguard International Growth Inv 17.1 19.9% 4.3% 2.8% -0.1% 14.4% 12.9% 1.28 1.3% 21.79 57,124 132 37,437 0.45 VWIGXOakmark International Small Cap Investor 16.9 22.2% 4.2% 5.7% 0.4% 10.8% 6.9% 1.23 1.2% 15.13 2,600 68 1,519 1.36 OAKEXVanguard Total Intl Stock Index Admiral 16.6 15.3% 3.4% 3.8% 1.8% 11.1% 7.9% 0.96 2.9% 14.64 22,637 7452 397,751 0.11 VTIAXAllianzGI International Small-Cap A 16.2 18.1% 4.8% 7.0% 2.4% 6.9% 7.2% 1.20 0.2% 14.79 3,205 97 99 1.25 AOPAXMedian 17.3% 3.3% 3.4% 1.5% 10.8% 8.0%T. Rowe Price International Value Eq 16.2 14.8% 4.7% 6.0% 2.6% 7.6% 4.3% 1.00 2.2% 14.29 29,635 134 11,085 0.81 TRIGXArtisan International Value Investor 15.9 16.2% 2.3% 3.5% 1.6% 10.8% 7.3% 0.97 1.8% 16.00 34,188 64 14,268 1.24 ARTKXInvesco Intl Core Equity Investor 15.3 17.0% 3.3% 4.3% 1.2% 9.8% 4.6% 1.09 1.3% 15.13 33,641 75 69 1.12 IIBCXNorthern Active M International Equity 15.0 15.3% 3.3% 4.0% 2.1% 8.9% 8.5% 0.95 2.6% 14.90 20,727 455 890 0.85 NMIEXLongleaf Partners International 14.6 13.8% 6.0% 2.2% -0.8% 13.1% 9.7% 1.10 0.0% 12.72 9,035 21 1,346 1.15 LLINXWasatch International Growth Investor 14.3 20.6% 5.0% 3.5% 0.5% 10.3% 7.3% 1.22 0.0% 32.68 3,015 92 1,196 1.45 WAIGXT. Rowe Price International Discovery 14.1 17.3% 4.5% 2.9% 1.1% 10.1% 9.5% 1.01 0.5% 19.80 2,647 220 8,292 1.20 PRIDXSegall Bryant & Hamill Fdml Int'lSmCpRet 13.9 28.3% 3.0% -2.2% 0.7% 15.3% 8.7% 1.25 0.4% 26.88 1,257 97 34 1.25 WTIFX
----------------Performance----------------
MOMYTD
Return1 Mo
Return3 Mo
Return6 Mo
Return12 MoReturn
3 YrAvg
Return
3 YrRelRisk
CurrentYield(%)
P/ERatio
MedianMarketCapital
NumberHoldings
NetAssets
ExpRatio(%)
NasdaqTicker
Performance numbers reflect periods ending 10/31/2019. Funds shown in bold are the recommendations in the November 2019 issue for SMI’s two Basic strategies.Although gathered from reliable sources, data accuracy cannot be guaranteed.
Page 23Fund Performance Rankings | SoundMindInvesting.com
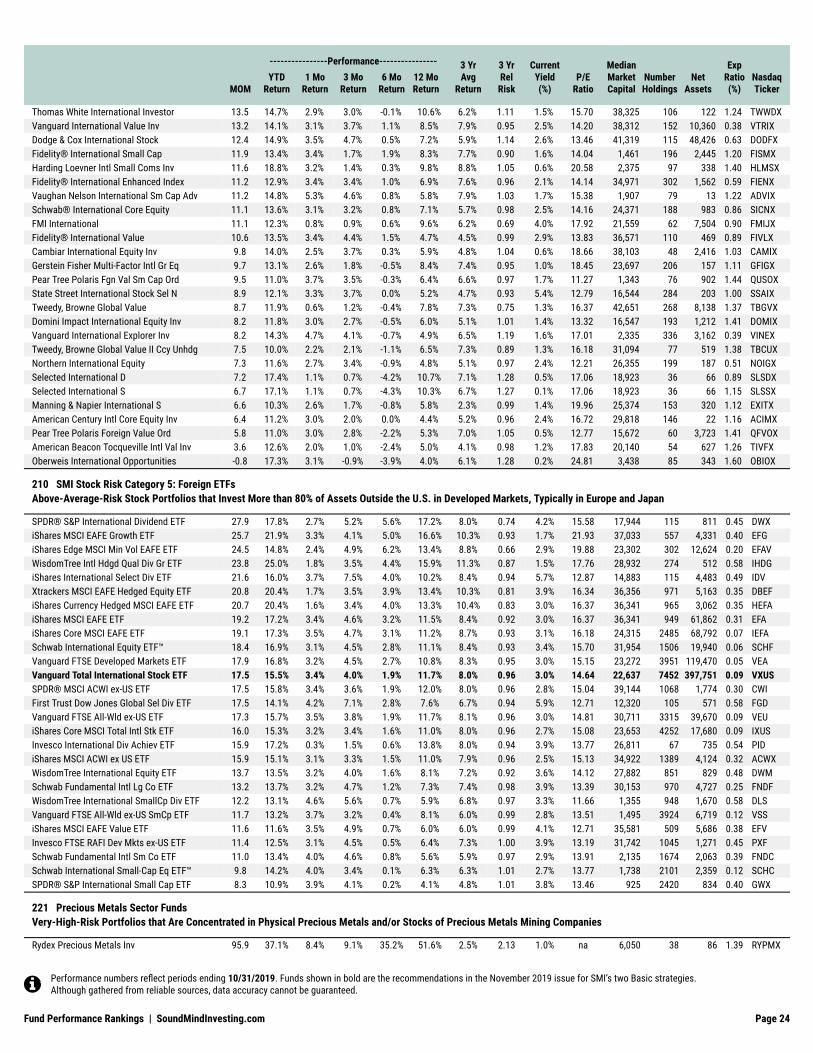
Thomas White International Investor 13.5 14.7% 2.9% 3.0% -0.1% 10.6% 6.2% 1.11 1.5% 15.70 38,325 106 122 1.24 TWWDXVanguard International Value Inv 13.2 14.1% 3.1% 3.7% 1.1% 8.5% 7.9% 0.95 2.5% 14.20 38,312 152 10,360 0.38 VTRIXDodge & Cox International Stock 12.4 14.9% 3.5% 4.7% 0.5% 7.2% 5.9% 1.14 2.6% 13.46 41,319 115 48,426 0.63 DODFXFidelity® International Small Cap 11.9 13.4% 3.4% 1.7% 1.9% 8.3% 7.7% 0.90 1.6% 14.04 1,461 196 2,445 1.20 FISMXHarding Loevner Intl Small Coms Inv 11.6 18.8% 3.2% 1.4% 0.3% 9.8% 8.8% 1.05 0.6% 20.58 2,375 97 338 1.40 HLMSXFidelity® International Enhanced Index 11.2 12.9% 3.4% 3.4% 1.0% 6.9% 7.6% 0.96 2.1% 14.14 34,971 302 1,562 0.59 FIENXVaughan Nelson International Sm Cap Adv 11.2 14.8% 5.3% 4.6% 0.8% 5.8% 7.9% 1.03 1.7% 15.38 1,907 79 13 1.22 ADVIXSchwab® International Core Equity 11.1 13.6% 3.1% 3.2% 0.8% 7.1% 5.7% 0.98 2.5% 14.16 24,371 188 983 0.86 SICNXFMI International 11.1 12.3% 0.8% 0.9% 0.6% 9.6% 6.2% 0.69 4.0% 17.92 21,559 62 7,504 0.90 FMIJXFidelity® International Value 10.6 13.5% 3.4% 4.4% 1.5% 4.7% 4.5% 0.99 2.9% 13.83 36,571 110 469 0.89 FIVLXCambiar International Equity Inv 9.8 14.0% 2.5% 3.7% 0.3% 5.9% 4.8% 1.04 0.6% 18.66 38,103 48 2,416 1.03 CAMIXGerstein Fisher Multi-Factor Intl Gr Eq 9.7 13.1% 2.6% 1.8% -0.5% 8.4% 7.4% 0.95 1.0% 18.45 23,697 206 157 1.11 GFIGXPear Tree Polaris Fgn Val Sm Cap Ord 9.5 11.0% 3.7% 3.5% -0.3% 6.4% 6.6% 0.97 1.7% 11.27 1,343 76 902 1.44 QUSOXState Street International Stock Sel N 8.9 12.1% 3.3% 3.7% 0.0% 5.2% 4.7% 0.93 5.4% 12.79 16,544 284 203 1.00 SSAIXTweedy, Browne Global Value 8.7 11.9% 0.6% 1.2% -0.4% 7.8% 7.3% 0.75 1.3% 16.37 42,651 268 8,138 1.37 TBGVXDomini Impact International Equity Inv 8.2 11.8% 3.0% 2.7% -0.5% 6.0% 5.1% 1.01 1.4% 13.32 16,547 193 1,212 1.41 DOMIXVanguard International Explorer Inv 8.2 14.3% 4.7% 4.1% -0.7% 4.9% 6.5% 1.19 1.6% 17.01 2,335 336 3,162 0.39 VINEXTweedy, Browne Global Value II Ccy Unhdg 7.5 10.0% 2.2% 2.1% -1.1% 6.5% 7.3% 0.89 1.3% 16.18 31,094 77 519 1.38 TBCUXNorthern International Equity 7.3 11.6% 2.7% 3.4% -0.9% 4.8% 5.1% 0.97 2.4% 12.21 26,355 199 187 0.51 NOIGXSelected International D 7.2 17.4% 1.1% 0.7% -4.2% 10.7% 7.1% 1.28 0.5% 17.06 18,923 36 66 0.89 SLSDXSelected International S 6.7 17.1% 1.1% 0.7% -4.3% 10.3% 6.7% 1.27 0.1% 17.06 18,923 36 66 1.15 SLSSXManning & Napier International S 6.6 10.3% 2.6% 1.7% -0.8% 5.8% 2.3% 0.99 1.4% 19.96 25,374 153 320 1.12 EXITXAmerican Century Intl Core Equity Inv 6.4 11.2% 3.0% 2.0% 0.0% 4.4% 5.2% 0.96 2.4% 16.72 29,818 146 22 1.16 ACIMXPear Tree Polaris Foreign Value Ord 5.8 11.0% 3.0% 2.8% -2.2% 5.3% 7.0% 1.05 0.5% 12.77 15,672 60 3,723 1.41 QFVOXAmerican Beacon Tocqueville Intl Val Inv 3.6 12.6% 2.0% 1.0% -2.4% 5.0% 4.1% 0.98 1.2% 17.83 20,140 54 627 1.26 TIVFXOberweis International Opportunities -0.8 17.3% 3.1% -0.9% -3.9% 4.0% 6.1% 1.28 0.2% 24.81 3,438 85 343 1.60 OBIOX
210 SMI Stock Risk Category 5: Foreign ETFsAbove-Average-Risk Stock Portfolios that Invest More than 80% of Assets Outside the U.S. in Developed Markets, Typically in Europe and Japan
SPDR® S&P International Dividend ETF 27.9 17.8% 2.7% 5.2% 5.6% 17.2% 8.0% 0.74 4.2% 15.58 17,944 115 811 0.45 DWXiShares MSCI EAFE Growth ETF 25.7 21.9% 3.3% 4.1% 5.0% 16.6% 10.3% 0.93 1.7% 21.93 37,033 557 4,331 0.40 EFGiShares Edge MSCI Min Vol EAFE ETF 24.5 14.8% 2.4% 4.9% 6.2% 13.4% 8.8% 0.66 2.9% 19.88 23,302 302 12,624 0.20 EFAVWisdomTree Intl Hdgd Qual Div Gr ETF 23.8 25.0% 1.8% 3.5% 4.4% 15.9% 11.3% 0.87 1.5% 17.76 28,932 274 512 0.58 IHDGiShares International Select Div ETF 21.6 16.0% 3.7% 7.5% 4.0% 10.2% 8.4% 0.94 5.7% 12.87 14,883 115 4,483 0.49 IDVXtrackers MSCI EAFE Hedged Equity ETF 20.8 20.4% 1.7% 3.5% 3.9% 13.4% 10.3% 0.81 3.9% 16.34 36,356 971 5,163 0.35 DBEFiShares Currency Hedged MSCI EAFE ETF 20.7 20.4% 1.6% 3.4% 4.0% 13.3% 10.4% 0.83 3.0% 16.37 36,341 965 3,062 0.35 HEFAiShares MSCI EAFE ETF 19.2 17.2% 3.4% 4.6% 3.2% 11.5% 8.4% 0.92 3.0% 16.37 36,341 949 61,862 0.31 EFAiShares Core MSCI EAFE ETF 19.1 17.3% 3.5% 4.7% 3.1% 11.2% 8.7% 0.93 3.1% 16.18 24,315 2485 68,792 0.07 IEFASchwab International Equity ETF™ 18.4 16.9% 3.1% 4.5% 2.8% 11.1% 8.4% 0.93 3.4% 15.70 31,954 1506 19,940 0.06 SCHFVanguard FTSE Developed Markets ETF 17.9 16.8% 3.2% 4.5% 2.7% 10.8% 8.3% 0.95 3.0% 15.15 23,272 3951 119,470 0.05 VEAVanguard Total International Stock ETF 17.5 15.5% 3.4% 4.0% 1.9% 11.7% 8.0% 0.96 3.0% 14.64 22,637 7452 397,751 0.09 VXUSSPDR® MSCI ACWI ex-US ETF 17.5 15.8% 3.4% 3.6% 1.9% 12.0% 8.0% 0.96 2.8% 15.04 39,144 1068 1,774 0.30 CWIFirst Trust Dow Jones Global Sel Div ETF 17.5 14.1% 4.2% 7.1% 2.8% 7.6% 6.7% 0.94 5.9% 12.71 12,320 105 571 0.58 FGDVanguard FTSE All-Wld ex-US ETF 17.3 15.7% 3.5% 3.8% 1.9% 11.7% 8.1% 0.96 3.0% 14.81 30,711 3315 39,670 0.09 VEUiShares Core MSCI Total Intl Stk ETF 16.0 15.3% 3.2% 3.4% 1.6% 11.0% 8.0% 0.96 2.7% 15.08 23,653 4252 17,680 0.09 IXUSInvesco International Div Achiev ETF 15.9 17.2% 0.3% 1.5% 0.6% 13.8% 8.0% 0.94 3.9% 13.77 26,811 67 735 0.54 PIDiShares MSCI ACWI ex US ETF 15.9 15.1% 3.1% 3.3% 1.5% 11.0% 7.9% 0.96 2.5% 15.13 34,922 1389 4,124 0.32 ACWXWisdomTree International Equity ETF 13.7 13.5% 3.2% 4.0% 1.6% 8.1% 7.2% 0.92 3.6% 14.12 27,882 851 829 0.48 DWMSchwab Fundamental Intl Lg Co ETF 13.2 13.7% 3.2% 4.7% 1.2% 7.3% 7.4% 0.98 3.9% 13.39 30,153 970 4,727 0.25 FNDFWisdomTree International SmallCp Div ETF 12.2 13.1% 4.6% 5.6% 0.7% 5.9% 6.8% 0.97 3.3% 11.66 1,355 948 1,670 0.58 DLSVanguard FTSE All-Wld ex-US SmCp ETF 11.7 13.2% 3.7% 3.2% 0.4% 8.1% 6.0% 0.99 2.8% 13.51 1,495 3924 6,719 0.12 VSSiShares MSCI EAFE Value ETF 11.6 11.6% 3.5% 4.9% 0.7% 6.0% 6.0% 0.99 4.1% 12.71 35,581 509 5,686 0.38 EFVInvesco FTSE RAFI Dev Mkts ex-US ETF 11.4 12.5% 3.1% 4.5% 0.5% 6.4% 7.3% 1.00 3.9% 13.19 31,742 1045 1,271 0.45 PXFSchwab Fundamental Intl Sm Co ETF 11.0 13.4% 4.0% 4.6% 0.8% 5.6% 5.9% 0.97 2.9% 13.91 2,135 1674 2,063 0.39 FNDCSchwab International Small-Cap Eq ETF™ 9.8 14.2% 4.0% 3.4% 0.1% 6.3% 6.3% 1.01 2.7% 13.77 1,738 2101 2,359 0.12 SCHCSPDR® S&P International Small Cap ETF 8.3 10.9% 3.9% 4.1% 0.2% 4.1% 4.8% 1.01 3.8% 13.46 925 2420 834 0.40 GWX
221 Precious Metals Sector FundsVery-High-Risk Portfolios that Are Concentrated in Physical Precious Metals and/or Stocks of Precious Metals Mining Companies
Rydex Precious Metals Inv 95.9 37.1% 8.4% 9.1% 35.2% 51.6% 2.5% 2.13 1.0% na 6,050 38 86 1.39 RYPMX
----------------Performance----------------
MOMYTD
Return1 Mo
Return3 Mo
Return6 Mo
Return12 MoReturn
3 YrAvg
Return
3 YrRelRisk
CurrentYield(%)
P/ERatio
MedianMarketCapital
NumberHoldings
NetAssets
ExpRatio(%)
NasdaqTicker
Performance numbers reflect periods ending 10/31/2019. Funds shown in bold are the recommendations in the November 2019 issue for SMI’s two Basic strategies.Although gathered from reliable sources, data accuracy cannot be guaranteed.
Page 24Fund Performance Rankings | SoundMindInvesting.com

USAA Precious Metals and Minerals 86.4 35.3% 5.8% 5.8% 31.8% 48.9% 3.4% 2.01 0.0% 31.15 6,129 70 596 1.27 USAGXAmerican Century Global Gold Inv 85.2 31.4% 4.4% 5.2% 33.0% 47.0% 4.5% 2.03 0.0% 34.48 7,283 57 505 0.68 BGEIXUS Global Investors Gld & Prec Mtls 83.4 35.7% 7.7% 4.6% 35.1% 43.7% 2.3% 2.19 1.3% 16.84 877 67 107 1.78 USERXGabelli Gold AAA 80.7 33.4% 4.9% 3.3% 31.8% 45.6% 0.7% 2.03 0.3% 39.22 4,488 62 274 1.55 GOLDXFirst Eagle Gold A 79.8 31.1% 3.9% 7.7% 29.4% 42.7% 1.2% 1.73 0.0% na 9,651 26 1,168 1.29 SGGDXFidelity® Select Gold 70.6 26.6% 2.9% 2.6% 27.6% 40.4% 1.1% 1.92 0.0% 38.76 8,314 35 1,744 0.86 FSAGXInvesco Gold & Precious Metals Invstor 63.3 25.9% 4.0% 3.2% 24.8% 35.3% -2.7% 1.88 0.0% na 2,610 51 213 1.49 FGLDXTocqueville Gold Fund 61.5 26.0% 3.8% 1.1% 26.8% 33.6% -0.5% 1.90 0.0% na 1,964 64 983 1.43 TGLDXUS Global Investors World Prec Mnral 30.3 13.7% -1.3% -0.6% 19.5% 11.4% -15.7% 2.00 15.4% na 71 139 73 1.54 UNWPX
222 Precious Metals Sector ETFsVery-High-Risk Portfolios that Are Concentrated in Physical Precious Metals and/or Stocks of Precious Metals Mining Companies
iShares MSCI Global Gold Miners ETF 110.9 42.9% 6.8% 9.7% 41.5% 59.7% 4.9% 2.14 0.8% na 8,811 43 304 0.39 RINGSprott Gold Miners ETF 94.7 38.0% 5.4% 4.7% 34.1% 56.0% 3.5% 2.26 0.4% 40.00 6,642 33 173 0.50 SGDMVanEck Vectors Gold Miners ETF 90.4 33.5% 5.4% 6.2% 34.8% 49.5% 5.3% 2.04 0.4% 34.01 8,034 48 11,480 0.53 GDXVanEck Vectors Junior Gold Miners ETF 82.3 29.8% 8.1% 4.5% 33.7% 44.2% 0.7% 2.25 0.4% 28.74 2,181 77 4,456 0.54 GDXJGlobal X Silver Miners ETF 69.7 21.8% 8.0% 11.4% 24.6% 33.7% -7.8% 2.04 1.3% na 3,614 29 510 0.65 SILSPDR® Gold MiniShares 48.8 17.7% 2.7% 7.0% 17.7% 24.1% na na 0.0% na na 1 1,113 0.18 GLDMGraniteShares Gold Trust 48.7 17.7% 2.3% 6.9% 17.6% 24.2% na na 0.0% na na 1 578 0.17 BARAberdeen Standard Phys SwissGold Shr ETF 48.6 17.7% 2.6% 7.0% 17.7% 23.9% 5.4% 0.90 0.0% na na 1 1,178 0.17 SGOLiShares Gold Trust 48.5 17.7% 2.6% 7.0% 17.7% 23.9% 5.5% 0.90 0.0% na na 1 17,063 0.25 IAUPerth Mint Physical Gold ETF 48.4 17.6% 2.5% 6.9% 17.6% 23.9% na na 0.0% na na 1 164 0.18 AAAUSPDR® Gold Shares 48.1 17.5% 2.6% 6.9% 17.5% 23.7% 5.3% 0.90 0.0% na na 1 43,616 0.40 GLD
225 Real Estate Sector FundsHigh-Risk Portfolios that Are Concentrated in real-estate investment trusts (REITs), companies that develop and manage real-estate properties
American Century Real Estate Inv 57.0 34.6% 3.8% 11.3% 15.5% 30.2% 10.8% 0.97 1.7% 37.04 13,914 40 1,007 1.15 REACXProFunds Real Estate UltraSector Inv 56.0 42.0% 1.0% 8.6% 13.6% 33.8% 13.3% 1.45 1.6% 29.24 17,483 118 50 1.78 REPIXCohen & Steers Realty Shares L 52.3 34.3% 1.3% 8.2% 13.9% 30.2% 11.8% 1.00 2.4% 36.76 16,795 44 4,331 0.88 CSRSXNeuberger Berman Real Estate Tr 50.9 33.3% 0.8% 8.1% 13.5% 29.4% 12.4% 0.94 1.6% 35.09 20,348 35 535 1.42 NBRFXAmerican Century Global Real Estate Inv 50.7 30.3% 3.8% 9.3% 12.8% 28.6% 11.0% 0.87 3.0% 19.96 10,011 75 77 1.10 ARYVXAberdeen Realty Income & Growth Instl 46.0 30.5% 1.7% 8.2% 11.8% 26.0% 10.9% 1.00 2.3% 31.45 15,890 45 75 1.00 AIGYXSterling Capital Stratton Rl Estt Instl 44.1 28.4% 1.8% 8.0% 11.5% 24.7% 11.3% 0.98 2.0% 34.84 13,906 42 105 0.82 STMDXGuideStone Funds Global Rl Est Secs Inv 41.3 25.3% 3.0% 8.3% 10.2% 22.8% 9.7% 0.83 2.0% 17.99 9,753 174 262 1.15 GREZXLazard US Realty Equity Open 40.3 30.2% 1.2% 6.7% 9.5% 24.2% 9.4% 0.96 1.2% 27.55 18,918 32 50 1.29 LREOXFidelity® Intl Real Estate 40.2 22.8% 4.1% 7.1% 10.1% 23.0% 12.3% 0.78 1.7% 12.08 3,706 74 584 1.02 FIREXFidelity® Real Estate Investment Port 39.7 27.8% 1.1% 6.9% 10.0% 22.7% 9.6% 0.98 2.2% 35.59 16,090 46 4,537 0.74 FRESXNorthern Multi-Manager Glbl Real Estate 37.6 24.3% 2.5% 7.1% 9.1% 21.3% 9.4% 0.79 3.4% 18.83 10,125 105 114 0.93 NMMGXSchwab Global Real Estate 37.5 25.2% 3.2% 6.3% 8.3% 22.9% 10.1% 0.90 3.6% 14.62 6,297 147 321 1.05 SWASXAberdeen International Rl Estt Eq Instl 37.4 23.0% 3.8% 6.7% 8.1% 22.6% 9.2% 1.01 2.9% 9.86 8,146 71 57 1.37 EGLRXAMG Managers CenterSquare Real Estate N 35.9 26.0% 1.1% 6.7% 8.8% 20.4% 9.0% 1.00 1.8% 29.76 13,779 52 237 1.12 MRESXRydex Real Estate H 33.1 24.7% 1.4% 6.5% 7.7% 18.8% 8.2% 1.00 0.6% 23.15 10,858 119 29 1.71 RYHRXT. Rowe Price Global Real Estate 30.3 21.7% 2.0% 6.0% 6.6% 17.7% 6.7% 0.85 2.2% 18.69 9,421 66 138 0.97 TRGRXT. Rowe Price Real Estate 28.1 23.6% 0.8% 4.9% 6.3% 16.9% 6.8% 1.00 2.5% 32.15 12,732 40 3,454 0.78 TRREXFidelity® Real Estate Income 26.7 17.4% 1.0% 3.9% 7.7% 15.1% 7.8% 0.43 4.3% 22.52 7,725 569 6,352 0.75 FRIFX
226 Real Estate Sector ETFsHigh-Risk Portfolios that Are Concentrated in real-estate investment trusts (REITs), companies that develop and manage real-estate properties
iShares Residential Real Estate Capd ETF 57.4 31.6% 1.1% 9.0% 16.4% 32.0% 12.9% 1.11 2.6% 33.56 15,332 50 609 0.48 REZInvesco Active US Real Estate 43.2 29.8% 1.6% 7.3% 11.3% 24.5% 11.5% 0.95 2.4% 32.47 17,314 82 117 0.35 PSRVanguard Real Estate ETF 42.4 29.6% 1.1% 6.9% 10.6% 24.9% 9.6% 1.02 3.1% 31.15 16,205 185 69,583 0.12 VNQiShares Global REIT ETF 40.8 26.1% 2.2% 8.2% 10.2% 22.5% 9.1% 0.87 3.6% 20.08 9,476 329 1,828 0.14 REETiShares US Real Estate ETF 40.2 28.6% 0.8% 6.2% 10.0% 24.1% 11.1% 0.96 2.6% 30.67 17,917 118 4,458 0.42 IYRFirst Trust S&P REIT ETF 39.4 26.8% 1.4% 7.4% 10.1% 22.0% 9.1% 1.03 2.6% 29.50 13,036 155 201 0.50 FRIiShares Cohen & Steers REIT ETF 39.0 27.5% -0.2% 5.3% 9.2% 24.6% 10.1% 0.98 2.4% 33.67 28,301 34 2,394 0.34 ICFSchwab US REIT ETF™ 36.2 25.9% 1.1% 6.3% 9.1% 20.8% 8.9% 1.01 2.7% 28.74 14,231 98 5,984 0.07 SCHHFirst Trust FTSE EN Dev Mkts Rel Est ETF 36.1 23.0% 2.2% 7.0% 8.7% 20.4% 8.9% 0.83 2.8% 17.54 10,088 351 60 0.60 FFRSPDR® Dow Jones REIT ETF 35.8 25.8% 1.1% 6.3% 9.0% 20.5% 8.7% 1.01 3.2% 28.74 14,232 96 2,689 0.25 RWRSPDR® Dow Jones International RelEst ETF 35.3 18.9% 3.7% 8.5% 8.5% 18.4% 7.5% 0.81 4.6% 13.33 7,312 138 2,244 0.59 RWXSPDR® Dow Jones Global Real Estate ETF 34.9 22.5% 2.3% 6.8% 8.8% 19.4% 8.1% 0.83 3.1% 19.23 10,655 233 2,228 0.50 RWO
----------------Performance----------------
MOMYTD
Return1 Mo
Return3 Mo
Return6 Mo
Return12 MoReturn
3 YrAvg
Return
3 YrRelRisk
CurrentYield(%)
P/ERatio
MedianMarketCapital
NumberHoldings
NetAssets
ExpRatio(%)
NasdaqTicker
Performance numbers reflect periods ending 10/31/2019. Funds shown in bold are the recommendations in the November 2019 issue for SMI’s two Basic strategies.Although gathered from reliable sources, data accuracy cannot be guaranteed.
Page 25Fund Performance Rankings | SoundMindInvesting.com

iShares International Dev Prpty ETF 33.6 18.7% 3.4% 7.3% 7.4% 19.0% 8.6% 0.83 4.1% 12.02 6,755 364 115 0.48 WPSiShares Europe Developed Real Estate ETF 33.1 18.4% 5.5% 12.5% 7.5% 13.0% 9.8% 1.04 4.0% 10.83 6,509 114 27 0.48 IFEUVanguard Global ex-US Real Est ETF 31.6 17.9% 3.9% 6.2% 5.6% 19.8% 9.1% 0.92 3.6% 10.72 6,203 691 6,826 0.12 VNQIiShares International Dev Real Est ETF 31.3 17.6% 3.1% 6.5% 6.4% 18.4% 8.7% 0.85 4.8% 12.47 7,494 234 392 0.48 IFGLFlexShares Glbl Quality Real Estate ETF 30.9 22.2% 2.3% 5.4% 6.9% 18.7% 8.4% 0.86 2.7% 16.13 9,595 178 376 0.45 GQREIQ US Real Estate Small Cap ETF 30.2 25.3% 3.2% 7.3% 8.1% 14.7% 6.7% 1.24 6.0% 13.44 2,029 79 66 0.70 ROOFCohen & Steers Global Realty Majors ETF 30.0 21.7% 0.8% 4.4% 6.3% 19.4% 8.4% 0.83 2.8% 19.38 20,755 79 53 0.55 GRIWisdomTree Global ex-US Real Estate ETF 23.7 16.2% 3.7% 4.2% 1.8% 17.7% 11.0% 1.03 6.2% 9.35 7,821 244 105 0.58 DRWInvesco KBW Premium Yield Eq REIT ETF 22.2 22.9% 1.2% 7.5% 7.6% 7.1% 4.4% 1.58 6.1% 21.93 1,442 31 317 0.35 KBWYiShares Mortgage Real Estate Capped ETF 16.1 15.5% 2.7% 2.5% 2.8% 10.8% 10.7% 1.06 8.6% 14.79 3,942 40 1,313 0.48 REMVanEck Vectors Mortgage REIT Income ETF 15.3 15.9% 2.8% 2.9% 2.7% 9.7% 10.3% 1.08 6.7% 14.86 3,562 27 203 0.42 MORT
229 Energy & Natural Resources Sector FundsHigh-Risk Portflios that Are Concentrated in Companies Engaged in the Energy, Chemicals, Minerals, and Forest Products Industries
ProFunds Consumer Goods UltraSector Inv 21.6 30.0% 0.4% 3.3% 4.5% 13.8% 7.0% 1.45 1.3% 20.12 58,838 114 8 1.78 CNPIXProFunds Biotechnology UltraSector Inv 16.1 8.1% 10.0% 8.1% 2.8% 5.2% 10.9% 2.35 0.0% 17.24 38,866 50 159 1.43 BIPIXProFunds Consumer Services Ultra Sec Inv 14.2 30.4% 1.4% -1.4% -0.6% 16.3% 21.3% 1.76 0.0% 24.10 102,098 172 49 1.52 CYPIXICON Natural Resources S 11.7 16.3% 1.3% 3.4% 3.4% 4.8% 7.8% 1.25 2.3% 17.73 13,796 35 62 1.50 ICBMXRydex Basic Materials Inv 9.2 14.6% 1.0% -0.4% 0.4% 9.2% 7.1% 1.28 0.4% 15.85 12,771 90 36 1.47 RYBIXProFunds Basic Materials UltraSector Inv -1.3 13.7% -0.4% -2.6% -3.3% 4.6% 7.8% 1.93 0.0% 15.65 25,691 55 5 1.63 BMPIXFidelity® Global Commodity Stock -3.8 8.5% 1.2% -1.5% -2.1% -0.2% 5.9% 1.25 1.9% 12.99 28,014 84 513 1.08 FFGCXFidelity® Select Materials -6.1 7.4% -0.2% -2.0% -6.1% 2.0% 3.4% 1.44 1.2% 18.25 19,210 32 860 0.79 FSDPXT. Rowe Price New Era -9.5 8.6% 0.4% -1.9% -5.3% -2.3% 2.3% 1.22 1.6% 17.18 19,964 120 3,512 0.69 PRNEXUS Global Investors Global Res -14.5 -0.9% 0.0% -5.3% -3.6% -5.7% -4.6% 1.07 4.8% 10.14 6,765 149 54 1.57 PSPFXColumbia Global Energy & Natrl Res Inst -15.5 6.3% -0.7% -2.7% -7.7% -5.0% 1.6% 1.40 2.8% 12.58 41,458 53 174 1.07 UMESXFidelity® Select Chemicals -18.5 1.8% -1.0% -4.5% -10.3% -3.6% 4.4% 1.58 1.6% 18.05 22,745 30 861 0.77 FSCHXFidelity® Select Natural Resources Port -19.0 8.6% -2.2% -4.3% -8.7% -5.9% -3.3% 1.70 1.1% 14.68 18,396 55 379 0.81 FNARXVanguard Energy Inv -22.1 5.8% -0.9% -3.7% -9.4% -9.0% -0.6% 1.48 2.6% 13.70 52,579 123 6,680 0.37 VGENXGuinness Atkinson Global Energy -30.6 3.4% -2.2% -4.4% -12.1% -14.0% -2.8% 1.77 1.7% 9.34 28,178 37 18 1.45 GAGEXICON Energy S -38.2 -1.6% -2.6% -6.0% -13.1% -19.1% -8.3% 1.87 0.5% 11.63 29,105 26 100 1.50 ICENXFidelity® Select Energy -40.4 0.6% -2.3% -7.8% -15.3% -17.3% -6.2% 1.98 1.6% 12.25 29,351 63 880 0.78 FSENXRydex Energy Inv -47.8 -2.7% -1.8% -8.7% -16.8% -22.3% -8.4% 2.01 0.8% 11.89 24,893 69 18 1.46 RYEIXProFunds UltraSector Oil & Gas Investor -55.1 -0.9% -3.8% -11.7% -19.8% -23.5% -8.9% 2.62 1.8% 14.90 67,009 71 12 1.56 ENPIXFidelity® Select Natural Gas -68.8 -10.5% -8.3% -15.2% -26.2% -27.4% -13.5% 2.05 0.0% 11.16 9,401 59 142 0.89 FSNGXFidelity® Select Energy Service Port -93.1 -17.2% -5.6% -19.6% -29.8% -43.7% -21.2% 2.77 1.5% 18.83 4,579 43 185 0.84 FSESX
230 Energy & Natural Resources Sector ETFsHigh-Risk Portflios that Are Concentrated in Companies Engaged in the Energy, Chemicals, Minerals, and Forest Products Industries
Materials Select Sector SPDR® ETF 15.7 17.0% 0.0% 0.3% 2.4% 13.1% 9.7% 1.17 2.1% 19.80 32,293 29 3,633 0.13 XLBVanEck Vectors Agribusiness ETF 14.6 17.4% 1.5% 0.2% 3.8% 10.6% 12.6% 0.97 1.4% 23.53 18,005 57 747 0.54 MOOInvesco S&P 500® Equal Weight Matrls ETF 13.0 16.9% 0.0% -0.8% 1.7% 12.0% 10.6% 1.26 2.0% 18.59 19,028 30 141 0.40 RTMVanguard Materials ETF 11.7 16.2% 0.4% 0.0% 1.0% 10.7% 8.8% 1.29 2.0% 17.61 19,840 120 2,462 0.10 VAWFidelity® MSCI Materials ETF 11.3 16.0% 0.4% -0.1% 0.9% 10.6% 8.7% 1.29 2.0% 18.25 19,617 122 198 0.08 FMATiShares Global Materials ETF 10.3 14.7% 2.2% 1.2% 0.1% 9.0% 9.0% 1.14 3.8% 16.39 26,865 126 182 0.46 MXIiShares Global Timber & Forestry ETF 8.1 12.4% 7.4% 9.5% 0.1% -1.5% 10.1% 1.62 3.1% 15.85 5,252 35 255 0.46 WOODInvesco MSCI Global Timber ETF 7.5 14.7% 6.0% 5.7% -0.2% 2.0% 7.0% 1.39 3.0% 15.17 6,337 88 140 0.55 CUTiShares US Basic Materials ETF 4.2 11.6% 0.0% -1.1% -0.8% 6.2% 7.8% 1.29 1.9% 17.33 26,132 50 361 0.42 IYMVanEck Vectors Natural Resources ETF 2.3 10.5% 1.1% -0.8% -1.3% 4.5% 6.9% 1.08 2.6% 14.20 23,994 316 68 0.50 HAPFirst Trust Materials AlphaDEX® ETF 2.0 13.6% 1.1% -1.6% -2.0% 5.6% 5.7% 1.55 1.6% 11.01 8,035 50 149 0.64 FXZFlexShares Mstar Glbl Upstrm Nat Res ETF -1.7 10.1% 0.8% -2.2% -2.8% 3.2% 7.5% 1.06 3.5% 13.83 30,085 163 5,673 0.46 GUNRiShares MSCI Global Agricltr Prdcrs ETF -2.9 7.5% 0.8% -2.4% -3.0% 2.4% 7.0% 1.07 2.0% 18.94 11,149 177 27 0.39 VEGIIQ Global Resources ETF -3.1 4.8% -0.3% -0.6% -2.3% -0.2% 1.0% 0.74 0.7% 12.56 19,390 242 146 0.77 GRESSPDR® S&P Global Natural Resources ETF -5.9 8.5% 1.9% -1.6% -3.7% -0.7% 7.0% 1.23 3.8% 13.23 32,270 107 1,117 0.40 GNRInvesco DWA Basic Materials Momentum ETF -8.2 10.7% -0.3% -3.2% -3.2% -1.8% 2.9% 1.57 1.4% 18.28 5,879 49 56 0.60 PYZiShares MSCI Global Mtls&Mng Prdcrs ETF -12.6 4.8% 3.0% -3.0% -8.2% -1.4% 8.3% 1.80 6.2% 9.64 16,138 222 220 0.39 PICKiShares North American Natural Res ETF -17.7 7.6% -1.3% -3.7% -7.6% -6.5% -2.6% 1.58 2.9% 13.64 35,394 120 544 0.46 IGEGlobal X Uranium ETF -19.3 -6.0% -1.2% -1.4% -9.5% -8.3% -0.1% 2.64 1.4% 11.38 3,687 35 194 0.69 URAiShares Global Energy ETF -20.2 5.3% -1.0% -3.8% -8.4% -8.0% 1.1% 1.45 4.0% 13.57 78,493 79 908 0.46 IXCiShares MSCI Global Energy Producers ETF -24.2 2.6% -0.7% -3.6% -9.9% -10.7% 2.8% 1.44 3.4% 11.59 68,537 247 48 0.39 FILLSPDR® S&P Metals and Mining ETF -24.7 2.6% 3.4% -5.6% -7.3% -11.8% 2.9% 2.29 2.6% 6.29 2,581 28 439 0.35 XME
----------------Performance----------------
MOMYTD
Return1 Mo
Return3 Mo
Return6 Mo
Return12 MoReturn
3 YrAvg
Return
3 YrRelRisk
CurrentYield(%)
P/ERatio
MedianMarketCapital
NumberHoldings
NetAssets
ExpRatio(%)
NasdaqTicker
Performance numbers reflect periods ending 10/31/2019. Funds shown in bold are the recommendations in the November 2019 issue for SMI’s two Basic strategies.Although gathered from reliable sources, data accuracy cannot be guaranteed.
Page 26Fund Performance Rankings | SoundMindInvesting.com

Global X Lithium & Battery Tech ETF -27.8 -6.9% 2.2% -3.7% -9.0% -15.0% 4.1% 1.62 3.6% 15.11 3,789 53 484 0.75 LITEnergy Select Sector SPDR® ETF -28.0 3.7% -2.1% -6.7% -10.7% -10.6% -2.5% 1.71 3.8% 13.77 75,123 29 10,872 0.13 XLEVanEck Vectors Steel ETF -32.2 -1.0% 1.7% -7.5% -10.6% -14.1% 4.5% 2.06 6.3% 6.83 8,466 27 57 0.56 SLXiShares US Energy ETF -32.9 2.0% -2.3% -7.1% -12.2% -13.6% -3.6% 1.75 3.4% 13.62 68,062 52 611 0.42 IYEVanguard Energy ETF -36.2 0.9% -2.6% -7.6% -13.4% -15.1% -4.1% 1.80 3.6% 12.95 53,948 137 3,627 0.10 VDEFidelity® MSCI Energy ETF -36.3 0.8% -2.5% -7.8% -13.4% -15.0% -4.3% 1.79 3.7% 12.56 57,189 132 425 0.08 FENYiShares US Oil & Gas Explor & Prod ETF -40.2 -0.3% -0.4% -5.8% -14.6% -19.8% -3.1% 2.12 2.1% 9.26 19,539 61 220 0.42 IEOInvesco S&P 500® Equal Weight Energy ETF -42.7 1.4% -3.1% -9.2% -16.0% -17.5% -7.0% 2.09 2.4% 12.12 21,758 30 133 0.40 RYEVanEck Vectors Rare Earth/Strat Mtls ETF -44.9 -8.5% -1.7% -9.7% -13.4% -21.7% -2.9% 2.32 13.5% 13.25 1,411 28 179 0.59 REMXInvesco DWA Energy Momentum ETF -55.0 -7.2% -0.6% -8.1% -17.8% -29.1% -11.4% 2.32 2.3% 7.02 7,105 42 38 0.60 PXIInvesco Dynamic Engy Explr & Prdtn ETF -71.6 -15.0% -3.5% -11.3% -24.6% -35.7% -9.4% 2.37 1.8% 6.43 5,368 32 29 0.63 PXEVanEck Vectors Unconvnt Oil & Gas ETF -73.2 -11.2% -6.9% -14.5% -27.6% -31.1% -15.9% 2.29 0.9% 8.12 11,018 40 18 0.54 FRAKFirst Trust Energy AlphaDEX® ETF -75.3 -17.3% -4.1% -12.7% -26.2% -36.4% -12.2% 2.28 1.9% 6.27 11,882 36 93 0.63 FXNSPDR® S&P Oil & Gas Explor & Prodtn ETF -87.4 -19.6% -5.5% -15.3% -31.3% -40.7% -15.0% 2.50 1.5% 4.35 5,258 61 1,975 0.35 XOPiShares US Oil Equipment & Services ETF -92.7 -16.3% -4.5% -20.6% -30.6% -41.5% -22.0% 2.95 2.5% na 7,084 38 87 0.42 IEZInvesco Dynamic Oil & Gas Services ETF -98.3 -18.6% -2.5% -20.2% -32.4% -45.6% -23.3% 2.88 0.7% na 2,778 32 11 0.63 PXJVanEck Vectors Oil Services ETF -100.7 -20.7% -5.3% -22.8% -33.2% -44.7% -25.0% 2.98 2.7% na 6,325 27 711 0.35 OIHFirst Trust Natural Gas ETF -101.8 -27.9% -9.0% -19.2% -37.1% -45.5% -23.1% 2.23 2.3% 5.00 2,804 32 84 0.60 FCGSPDR® S&P Oil & Gas Equipment&Svcs ETF -117.0 -25.1% -7.5% -27.2% -39.6% -50.2% -26.8% 3.38 1.4% na 2,317 36 166 0.35 XESInvesco S&P SmallCap Energy ETF -122.3 -29.4% -12.1% -26.9% -42.6% -52.8% -28.2% 3.17 0.0% 3.92 769 47 20 0.29 PSCE
233 Technology Sector FundsAbove-Average-Risk Portflios that Typically Are Concentrated in Semiconductor, Software, Networking, and Internet Companies
ProFunds Semiconductor UltraSector Inv 53.2 52.6% 9.0% 8.9% 5.8% 38.5% 30.0% 2.68 0.9% 17.95 69,173 36 72 1.44 SMPIXFidelity® Select Semiconductors 52.2 45.1% 6.4% 7.1% 6.5% 38.5% 22.9% 1.89 0.5% 18.69 31,013 45 3,603 0.73 FSELXProFunds Technology UltraSector Inv 33.9 49.3% 5.7% 3.0% 4.9% 26.0% 30.7% 2.01 0.0% 22.83 205,846 154 46 1.49 TEPIXT. Rowe Price Science & Tech 33.5 35.0% 4.8% 3.7% 3.9% 25.9% 19.6% 1.41 0.0% 23.92 72,531 36 6,457 0.79 PRSCXFidelity® Select Technology 31.5 36.7% 4.4% 3.9% 6.5% 21.1% 22.8% 1.43 0.1% 25.71 200,770 90 5,713 0.72 FSPTXFidelity® Select Software & IT Svcs Port 24.0 29.1% 2.0% 1.1% 2.7% 20.3% 22.1% 1.16 0.1% 28.57 140,787 68 7,332 0.72 FSCSXFidelity® Select Computers 23.8 26.4% 4.0% 6.9% 4.9% 11.9% 18.0% 1.33 0.9% 14.27 87,145 32 512 0.77 FDCPXFidelity® Select IT Services 21.5 33.4% 0.8% -3.0% 1.6% 22.9% 24.2% 1.18 0.0% 31.95 72,624 51 3,908 0.74 FBSOXRydex Technology Inv 20.0 29.4% 2.3% -0.6% 0.3% 20.2% 20.1% 1.32 0.0% 23.31 57,457 138 70 1.46 RYTIXICON Information Technology S 19.8 30.7% 1.9% 0.0% 3.3% 16.5% 16.3% 1.29 0.0% 23.64 63,209 34 57 1.41 ICTEXRed Oak Technology Select 18.9 26.1% 2.7% 0.7% 1.3% 16.9% 21.0% 1.17 0.7% 19.16 86,198 35 651 0.94 ROGSXInvesco Technology Investor 18.5 26.0% 4.0% 1.0% 2.5% 15.0% 18.8% 1.33 0.0% 30.67 123,698 52 989 1.11 FTCHXT. Rowe Price Global Technology 18.3 23.4% 2.0% -3.0% -4.6% 25.9% 16.4% 1.63 0.0% 31.15 99,378 42 4,572 0.91 PRGTXBerkshire Focus 17.5 30.8% 4.6% -3.0% -1.1% 21.6% 27.8% 1.76 0.0% 41.67 76,449 44 305 1.97 BFOCXBlack Oak Emerging Technology 13.9 22.0% 6.7% 4.2% -0.6% 10.4% 13.1% 1.36 0.0% 20.58 13,243 41 37 1.11 BOGSXUSAA Science & Technology 12.4 24.2% 3.9% -4.6% -1.9% 18.9% 16.9% 1.38 0.0% 29.24 15,201 236 1,389 1.06 USSCXFirsthand Technology Opportunities 7.0 24.7% 4.3% -4.6% -6.5% 18.1% 25.6% 1.62 0.0% 36.50 30,803 36 267 1.85 TEFQXRydex Internet Inv -2.8 18.8% 1.3% -5.3% -7.4% 9.9% 15.3% 1.40 0.0% 27.32 46,187 91 22 1.45 RYIIXJacob Internet Inv -8.5 17.0% -1.0% -9.0% -8.6% 9.1% 13.2% 1.37 0.0% na 4,636 35 46 2.43 JAMFXProFunds Internet UltraSector Inv -23.9 19.2% -1.3% -13.3% -15.5% 4.9% 24.0% 2.15 0.0% 31.65 44,016 46 169 1.42 INPIXFidelity® Select Comms Equip Port -25.7 4.2% -2.6% -9.4% -14.3% -1.9% 8.6% 1.27 0.4% 24.10 16,432 32 176 0.84 FSDCX
234 Technology Sector ETFsAbove-Average-Risk Portflios that Typically Are Concentrated in Semiconductor, Software, Networking, and Internet Companies
VanEck Vectors Semiconductor ETF 57.6 46.1% 7.0% 8.9% 9.7% 39.1% 24.8% 1.79 1.3% 23.09 68,344 26 1,432 0.35 SMHiShares PHLX Semiconductor ETF 54.1 44.6% 6.1% 7.5% 7.0% 39.6% 27.8% 1.86 1.2% 24.51 52,314 35 2,124 0.46 SOXXSPDR® S&P Semiconductor ETF 51.9 45.8% 4.5% 2.5% 8.8% 40.6% 23.6% 1.88 0.6% 27.78 11,476 36 411 0.35 XSDInvesco Dynamic Semiconductors ETF 42.7 38.8% 5.9% 4.9% 5.9% 31.9% 24.7% 2.05 0.7% 22.99 15,628 32 195 0.58 PSITechnology Select Sector SPDR® ETF 33.4 36.3% 3.9% 3.9% 7.0% 22.5% 22.6% 1.26 1.2% 24.33 244,884 69 24,870 0.13 XLKInvesco S&P SmallCap Info Tech ETF 33.2 32.1% 6.1% 5.1% 6.6% 21.5% 14.5% 1.59 0.3% 25.84 1,737 80 338 0.29 PSCTiShares Global Tech ETF 32.7 34.2% 3.9% 4.7% 6.7% 21.2% 21.7% 1.25 1.0% 23.04 186,147 132 3,056 0.46 IXNFirst Trust NASDAQ-100-Tech Sector ETF 32.0 33.7% 3.4% 2.7% 1.7% 27.6% 22.1% 1.48 0.7% 24.75 54,098 40 2,539 0.57 QTECVanguard Information Technology ETF 30.6 35.4% 3.8% 2.8% 5.5% 22.3% 24.6% 1.32 1.2% 23.87 141,793 327 25,511 0.10 VGTFidelity® MSCI Information Tech ETF 30.0 35.5% 3.7% 2.8% 5.4% 21.8% 23.5% 1.31 1.1% 24.63 153,217 319 2,793 0.08 FTECiShares US Technology ETF 27.9 33.5% 3.8% 2.7% 4.8% 20.5% 22.5% 1.33 0.8% 23.87 206,270 154 4,478 0.42 IYWInvesco S&P 500® Equal Weight Tech ETF 23.6 30.7% 2.2% 0.8% 1.6% 21.2% 21.5% 1.32 1.0% 22.12 35,053 71 1,725 0.40 RYTFirst Trust NASDAQ Technology Div ETF 23.4 25.0% 1.6% 2.0% 3.2% 18.2% 15.2% 1.15 2.4% 17.95 101,778 93 1,068 0.50 TDIV
----------------Performance----------------
MOMYTD
Return1 Mo
Return3 Mo
Return6 Mo
Return12 MoReturn
3 YrAvg
Return
3 YrRelRisk
CurrentYield(%)
P/ERatio
MedianMarketCapital
NumberHoldings
NetAssets
ExpRatio(%)
NasdaqTicker
Performance numbers reflect periods ending 10/31/2019. Funds shown in bold are the recommendations in the November 2019 issue for SMI’s two Basic strategies.Although gathered from reliable sources, data accuracy cannot be guaranteed.
Page 27Fund Performance Rankings | SoundMindInvesting.com

iShares Expanded Tech Sector ETF 22.9 31.0% 3.2% 0.7% 2.4% 19.8% 22.9% 1.33 0.5% 26.88 161,856 289 1,721 0.46 IGMInvesco DWA Technology Momentum ETF 16.7 35.7% 4.2% -8.8% -0.4% 26.0% 22.1% 1.71 0.0% 37.31 13,554 44 209 0.60 PTFInvesco Dynamic Software ETF 14.5 27.5% 1.3% -7.4% -2.0% 23.9% 26.1% 1.46 0.0% 33.44 10,640 32 477 0.58 PSJFirst Trust Technology AlphaDEX® ETF 13.6 26.8% 1.9% -4.1% -2.8% 20.4% 23.1% 1.52 0.5% 23.64 16,161 101 2,176 0.63 FXLSPDR® S&P Software & Services ETF 13.0 28.6% 2.6% -3.4% -2.8% 19.3% 21.8% 1.31 0.2% 30.86 5,773 159 216 0.35 XSWiShares Expanded Tech-Software Sect ETF 11.2 23.9% 1.4% -3.2% -3.1% 17.5% 24.2% 1.35 0.1% 32.47 40,507 97 2,803 0.46 IGVFirst Trust Cloud Computing ETF 4.9 19.2% 1.9% -1.9% -5.1% 11.9% 19.3% 1.11 1.0% 23.92 30,920 62 2,169 0.60 SKYYInvesco NASDAQ Internet ETF -3.1 19.8% 1.2% -5.5% -7.6% 10.1% 14.9% 1.56 0.0% 31.35 52,264 85 528 0.62 PNQIGlobal X Social Media ETF -3.4 15.4% -0.5% -5.9% -6.9% 9.4% 11.2% 1.51 0.0% 24.10 33,706 47 122 0.65 SOCLiShares North Amer Tech-Multimd Ntwk ETF -8.5 13.4% 0.4% -5.5% -9.7% 6.8% 10.5% 1.49 0.4% 27.17 6,752 24 85 0.46 IGNFirst Trust Dow Jones Internet ETF -11.8 14.7% -0.7% -8.5% -9.5% 6.1% 18.0% 1.42 0.0% 29.85 45,559 43 7,713 0.52 FDN
237 Communications & Utilities Sector FundsAverage-Risk Portflios that Are Concentrated in Cable Television, Wireless-Communications, Communications-Equipment, and Public Utilities
ProFunds Utilities UltraSector Inv 56.0 32.6% -1.5% 11.6% 13.8% 30.6% 15.9% 1.30 0.5% 23.09 28,947 53 34 1.69 UTPIXFidelity® Select Wireless 35.3 30.2% 4.8% 7.2% 9.2% 18.9% 15.5% 1.00 1.5% 20.49 94,144 51 317 0.83 FWRLXFidelity® Telecom and Utilities 32.4 20.5% -0.4% 6.8% 9.7% 15.8% 12.6% 0.74 2.5% 20.96 55,804 34 1,134 0.70 FIUIXFidelity® Select Utilities 31.6 20.0% -1.6% 6.6% 7.6% 17.4% 14.8% 0.79 1.2% 23.36 28,839 32 1,336 0.78 FSUTXICON Utilities S 30.4 19.7% -1.0% 5.2% 6.5% 18.7% 11.0% 0.82 2.5% 22.68 22,938 32 51 1.22 ICTUXRydex Utilities Inv 29.4 18.0% -1.7% 5.2% 6.4% 17.7% 11.1% 0.83 0.0% 24.10 20,593 57 103 1.47 RYUIXAmerican Century Utilities Inv 29.0 18.4% -0.2% 7.2% 8.1% 13.8% 8.3% 0.76 2.9% 19.92 41,475 45 412 0.67 BULIXGabelli Utilities AAA 22.8 16.9% -0.4% 3.5% 4.9% 14.5% 8.6% 0.73 2.2% 21.41 12,326 236 2,227 1.37 GABUXT. Rowe Price Comm & Tech Investor 20.6 26.2% 2.7% -0.5% 0.6% 20.5% 17.4% 1.23 0.2% 34.97 130,327 54 6,060 0.78 PRMTXFidelity® Select Communication Services 17.7 25.0% 2.6% 0.2% 1.5% 16.0% 13.5% 1.21 0.2% 21.74 138,925 48 612 0.82 FBMPXFidelity® Select Telecommunications Port 15.5 17.2% 2.4% 2.7% 6.7% 6.1% 5.8% 0.96 1.9% 19.16 39,454 35 298 0.84 FSTCXCommunication Services UltraSectorProInv 11.7 11.5% 2.9% -1.4% 5.8% 7.2% 14.3% 1.70 0.0% 15.34 195,505 9 8 1.78 WCPIXGabelli Global Content & Connect AAA 2.4 10.9% 1.7% -1.3% -0.9% 4.6% 3.7% 0.92 0.6% 16.58 23,164 165 78 1.73 GABTXProFunds Telecom UltraSector Inv 2.1 19.2% 2.8% -1.1% -3.1% 6.2% 0.6% 1.92 2.4% 19.92 45,388 47 1 1.78 TCPIX
238 Communications & Utilities Sector ETFsAverage-Risk Portflios that Are Concentrated in Cable Television, Wireless-Communications, Communications-Equipment, and Public Utilities
Utilities Select Sector SPDR® ETF 43.4 24.2% -0.8% 8.7% 11.2% 23.5% 12.8% 0.89 2.9% 23.98 39,072 29 11,144 0.13 XLUFidelity® MSCI Utilities ETF 41.9 23.5% -0.8% 8.2% 10.7% 23.1% 13.2% 0.86 2.7% 24.04 29,368 68 903 0.08 FUTYVanguard Utilities ETF 41.8 23.6% -0.9% 8.2% 10.6% 23.1% 13.2% 0.86 2.8% 24.45 29,249 70 5,606 0.10 VPUiShares US Utilities ETF 40.4 22.9% -0.9% 8.0% 10.2% 22.2% 12.5% 0.87 2.6% 23.92 32,101 52 951 0.42 IDUiShares Global Utilities ETF 40.4 21.2% 0.1% 7.9% 9.9% 22.6% 11.5% 0.85 3.0% 20.96 32,753 79 204 0.46 JXIInvesco S&P 500® Equal Weight Utilts ETF 37.7 21.2% -1.2% 7.1% 9.8% 20.7% 12.4% 0.78 2.5% 23.81 25,481 30 398 0.40 RYUInvesco DWA Utilities Momentum ETF 37.4 20.9% -1.4% 6.0% 8.6% 22.8% 13.4% 0.90 1.6% 25.91 12,674 38 246 0.60 PUIFirst Trust Utilities AlphaDEX® ETF 18.6 12.3% -0.3% 3.4% 5.4% 9.8% 7.2% 0.72 2.5% 18.35 21,965 35 1,288 0.63 FXUiShares Global Comm Services ETF 13.1 18.8% 2.4% 0.0% 0.7% 12.4% 3.6% 1.06 3.0% 19.46 145,831 89 236 0.46 IXPVanguard Communication Services ETF 11.7 21.3% 3.0% -0.1% 1.3% 10.5% 1.9% 1.10 0.9% 21.37 89,198 114 2,231 0.10 VOXFidelity® MSCI Communication ServicesETF 11.4 19.9% 2.6% -1.1% 0.5% 12.1% 9.4% 1.14 1.0% 21.98 90,628 112 452 0.08 FCOMiShares US Telecommunications ETF 6.8 15.0% 2.1% 0.0% -0.6% 7.5% 0.8% 1.21 1.7% 18.98 51,019 43 376 0.42 IYZInvesco S&P SmallCap Ult & Comnc Svc ETF -2.9 9.1% 0.4% -0.6% 0.5% -2.8% 8.9% 1.11 2.1% 31.95 1,628 25 44 0.29 PSCU
241 Consumer Sector FundsVary in Risk Depending on Whether the Portfolio Emphasizes Consumer Products/Services Where Demand Is Staple or Varies with Economic Cycle
Fidelity® Select Construction & Hsg Port 58.5 41.0% 2.5% 9.9% 13.0% 35.6% 17.4% 1.24 0.7% 23.64 25,532 40 414 0.80 FSHOXFidelity® Select Automotive Port 26.7 21.1% 5.3% 6.5% 7.1% 13.1% 11.0% 1.27 1.0% 11.83 26,380 35 38 0.97 FSAVXFidelity® Select Retailing 21.0 23.9% 1.7% 3.5% 2.1% 15.4% 18.7% 1.28 0.1% 24.81 81,130 39 3,128 0.76 FSRPXFidelity® Select Consumer Staples Port 19.9 25.7% 0.6% 2.6% 3.7% 13.7% 5.4% 1.04 2.4% 22.08 45,568 64 1,518 0.77 FDFAXFidelity® Select Consumer Discret Port 13.1 21.3% 0.2% 0.1% -0.5% 13.5% 14.9% 1.20 0.3% 25.97 71,153 78 455 0.78 FSCPXRydex Consumer Products Inv 10.8 16.7% -1.5% 1.1% 1.1% 8.6% 4.2% 0.93 1.2% 22.68 38,377 61 152 1.46 RYCIXRydex Retailing Inv 10.6 20.4% 1.6% 2.0% -0.2% 8.8% 10.6% 1.30 0.1% 21.01 40,780 71 10 1.45 RYRIXFidelity® Select Leisure 10.1 20.0% -2.8% -6.1% -0.1% 16.3% 15.3% 1.13 0.7% 26.11 34,514 35 498 0.76 FDLSXRydex Leisure Inv 5.4 20.5% 1.5% -1.8% -2.1% 9.3% 9.8% 1.12 0.7% 20.08 22,309 104 17 1.46 RYLIXICON Consumer Discretionary S -3.1 12.4% 1.1% 0.9% -6.4% 2.4% 2.7% 1.27 0.0% 23.70 38,042 22 20 1.60 ICCCX
242 Consumer Sector ETFs
----------------Performance----------------
MOMYTD
Return1 Mo
Return3 Mo
Return6 Mo
Return12 MoReturn
3 YrAvg
Return
3 YrRelRisk
CurrentYield(%)
P/ERatio
MedianMarketCapital
NumberHoldings
NetAssets
ExpRatio(%)
NasdaqTicker
Performance numbers reflect periods ending 10/31/2019. Funds shown in bold are the recommendations in the November 2019 issue for SMI’s two Basic strategies.Although gathered from reliable sources, data accuracy cannot be guaranteed.
Page 28Fund Performance Rankings | SoundMindInvesting.com

Vary in Risk Depending on Whether the Portfolio Emphasizes Consumer Products/Services Where Demand Is Staple or Varies with Economic Cycle
iShares US Home Construction ETF 77.0 49.3% 3.1% 14.9% 17.9% 44.1% 20.7% 1.53 0.5% 14.86 10,898 47 1,224 0.42 ITBSPDR® S&P Homebuilders ETF 57.7 41.1% 3.3% 9.6% 12.5% 35.5% 14.0% 1.39 1.0% 16.67 10,365 36 811 0.35 XHBVanEck Vectors Retail ETF 26.9 23.8% 1.6% 5.6% 7.4% 13.9% 17.4% 1.24 0.9% 24.04 116,243 26 86 0.35 RTHConsumer Staples Select Sector SPDR® ETF 25.3 22.8% -0.4% 3.5% 7.4% 14.4% 7.9% 0.98 2.6% 23.70 106,424 34 13,093 0.13 XLPFidelity® MSCI Consumer Staples ETF 22.8 22.1% -0.2% 3.2% 6.6% 13.0% 7.7% 0.96 2.5% 23.98 90,316 93 555 0.08 FSTAiShares Global Consumer Discr ETF 22.1 22.7% 2.2% 3.0% 3.2% 15.9% 13.4% 1.10 1.5% 18.32 62,953 165 222 0.46 RXIVanguard Consumer Staples ETF 21.5 21.1% -0.5% 3.1% 6.1% 12.3% 7.5% 0.95 2.5% 23.58 77,298 90 6,060 0.10 VDCiShares Global Consumer Staples ETF 19.3 19.8% -0.7% 2.1% 4.4% 12.8% 6.9% 0.86 2.4% 22.68 83,377 108 831 0.46 KXIConsumer Discret Sel Sect SPDR® ETF 18.1 23.3% 0.1% 0.4% 1.3% 16.3% 17.3% 1.21 1.3% 23.75 100,473 65 14,558 0.13 XLYiShares US Consumer Goods ETF 17.7 21.2% 0.2% 2.5% 4.0% 11.3% 6.7% 0.97 2.2% 21.14 59,673 109 482 0.42 IYKInvesco S&P 500® Eql Wt Cnsm Stapl ETF 17.4 21.2% -1.2% 2.8% 4.0% 10.7% 6.8% 0.99 2.3% 22.57 38,666 35 504 0.40 RHSiShares US Consumer Services ETF 15.9 22.3% 1.1% 0.3% 1.7% 14.0% 16.3% 1.16 0.8% 22.27 71,938 162 985 0.42 IYCVanguard Consumer Discretionary ETF 14.3 21.5% 0.7% 0.3% 0.7% 13.3% 15.4% 1.22 1.1% 23.09 59,509 299 3,325 0.10 VCRFidelity® MSCI Consumer Discret ETF 13.7 21.5% 0.9% 0.0% 0.5% 13.2% 16.1% 1.19 1.2% 23.81 69,364 292 757 0.08 FDISInvesco S&P 500® Equal Wt Cnsm Disc ETF 8.8 19.2% 1.3% 0.7% -1.0% 9.1% 9.1% 1.27 1.7% 15.95 19,019 66 108 0.40 RCDFirst Trust Cnsmr Staples AlphaDEX® ETF 8.2 13.9% -1.7% 4.0% 1.0% 3.2% 2.7% 1.02 1.5% 21.32 20,051 37 349 0.64 FXGFirst Trust Cnsmr Discret AlphaDEX® ETF 5.8 17.8% 2.5% -0.4% -1.6% 7.8% 9.0% 1.21 1.0% 14.35 12,358 119 360 0.64 FXDFirst Trust NASDAQ Global Auto ETF 5.1 9.9% 4.6% 5.5% -1.7% 1.3% 2.4% 1.26 3.1% 9.74 31,144 33 19 0.70 CARZInvesco Dynamic Food & Beverage ETF 4.5 14.9% -3.9% -1.0% -0.4% 5.9% 2.5% 0.95 1.1% 26.46 14,416 33 70 0.63 PBJInvesco S&P SmallCap Cnsmr Discret ETF -2.2 11.3% 0.7% 1.7% -3.0% -0.9% 10.7% 1.50 1.0% 13.48 1,521 96 22 0.29 PSCDInvesco DWA Consumer Staples Mom ETF -5.3 9.1% -1.7% -3.2% -2.2% 0.1% 9.8% 0.80 0.5% 25.71 11,481 32 165 0.60 PSLInvesco DWA Consumer Cyclicals Mom ETF -7.1 14.8% 1.6% -4.4% -5.6% 3.0% 10.1% 1.41 0.1% 23.15 13,772 41 55 0.60 PEZSPDR® S&P Retail ETF -9.9 6.5% 1.7% 1.8% -4.7% -7.0% 2.3% 1.54 1.6% 15.24 4,403 86 338 0.35 XRTInvesco Dynamic Leisure and Entmnt ETF -10.1 6.4% -0.7% -5.0% -5.4% 0.3% 5.7% 1.11 0.4% 16.67 9,082 32 54 0.63 PEJInvesco Dynamic Media ETF -12.6 11.9% 1.2% -7.6% -8.2% 3.1% 9.3% 1.27 0.4% 19.01 10,027 32 48 0.63 PBSInvesco S&P SmallCap Consumer Stapl ETF -17.2 6.3% -2.4% -2.4% -5.5% -9.3% 6.5% 1.33 1.8% 24.45 1,810 28 48 0.29 PSCC
245 Health & Biotech Sector FundsAverage-Risk Portflios that Invest in a Range of Health-Related Companies, Such as Pharmaceutical, Hospital, Nursing Home, and Biotech Firms
Fidelity® Select Pharmaceuticals Port 31.2 18.3% 5.4% 6.6% 10.8% 13.8% 11.2% 1.06 1.3% 24.51 69,376 62 721 0.80 FPHAXFidelity® Select Medical Tech and Devcs 21.9 19.1% 2.1% -0.6% 7.9% 14.6% 19.3% 1.29 0.0% 36.10 33,743 57 6,355 0.73 FSMEXVanguard Health Care Inv 21.3 12.4% 6.8% 4.9% 8.2% 8.2% 11.5% 1.11 1.0% 24.04 46,181 106 45,082 0.34 VGHCXKinetics Medical No Load 19.2 8.6% 5.6% 6.2% 4.9% 8.2% 8.9% 1.03 1.0% 18.90 79,283 34 16 1.39 MEDRXProFunds UltraSector Health Care Inv 18.6 13.1% 7.0% 4.0% 7.3% 7.2% 17.7% 1.62 0.0% 22.83 73,079 135 17 1.56 HCPIXLive Oak Health Sciences 18.3 11.0% 5.3% 7.2% 8.8% 2.4% 7.9% 1.16 0.7% 18.08 60,310 31 52 1.01 LOGSXFidelity® Select Health Care 17.4 14.8% 6.7% 1.3% 8.2% 7.9% 15.5% 1.32 0.1% 24.04 30,068 89 6,918 0.71 FSPHXSchwab Health Care 15.9 9.3% 4.3% 4.1% 5.3% 6.5% 12.1% 1.00 0.9% 21.19 71,895 95 773 0.80 SWHFXT. Rowe Price Health Sciences 11.9 15.6% 6.6% -0.3% 4.7% 7.6% 15.6% 1.38 0.0% 22.37 29,174 136 12,645 0.77 PRHSXRydex Health Care Inv 11.0 12.6% 4.5% 0.8% 3.9% 6.3% 13.0% 1.21 0.0% 22.57 35,679 115 31 1.46 RYHIXJanus Henderson Global Life Sciences T 10.4 14.5% 5.3% -0.9% 3.7% 7.6% 14.1% 1.17 0.0% 25.51 31,106 94 3,742 0.92 JAGLXRydex Biotechnology Inv 6.7 11.5% 6.8% 1.2% -0.3% 5.9% 10.9% 1.68 0.0% 17.42 17,261 53 176 1.46 RYOIXFidelity® Select Biotechnology 5.8 15.4% 7.5% -0.4% 0.5% 5.8% 11.0% 1.86 0.0% na 7,726 246 6,323 0.72 FBIOXFidelity® Select Health Care Svcs Port 2.9 4.1% 9.6% -1.1% 8.4% -4.4% 15.9% 1.52 0.1% 16.69 32,383 26 992 0.76 FSHCXICON Healthcare S -3.0 4.8% 6.1% 0.4% 0.6% -3.9% 8.7% 1.24 0.0% 20.12 35,177 34 60 1.45 ICHCXProFunds Pharmaceuticals UltraSector Inv -10.4 4.4% 6.3% 1.2% -4.1% -7.5% 1.7% 1.82 0.2% 22.94 48,931 48 4 1.78 PHPIX
246 Health & Biotech Sector ETFsAverage-Risk Portflios that Invest in a Range of Health-Related Companies, Such as Pharmaceutical, Hospital, Nursing Home, and Biotech Firms
iShares US Medical Devices ETF 34.0 24.9% 0.8% 1.2% 11.0% 21.8% 23.2% 1.20 0.3% 38.76 50,438 61 4,312 0.43 IHIiShares Global Healthcare ETF 24.8 14.1% 5.0% 5.5% 8.5% 10.8% 12.9% 0.95 1.8% 24.51 87,229 117 1,925 0.46 IXJHealth Care Select Sector SPDR® ETF 20.0 10.9% 5.1% 4.4% 7.0% 8.6% 13.8% 1.05 1.6% 22.99 93,989 62 18,368 0.13 XLVInvesco S&P 500® Equal Wt Hlth Care ETF 19.0 16.1% 4.7% 2.2% 6.4% 10.3% 13.2% 1.19 0.6% 24.21 36,815 63 732 0.40 RYHiShares US Healthcare ETF 16.9 10.7% 4.9% 3.4% 6.1% 7.5% 13.9% 1.08 1.9% 23.36 75,683 126 2,050 0.43 IYHVanguard Health Care ETF 16.2 11.3% 4.8% 2.7% 5.8% 7.7% 14.3% 1.09 2.0% 22.32 57,339 390 10,362 0.10 VHTFidelity® MSCI Health Care ETF 16.1 11.3% 4.8% 2.7% 5.8% 7.7% 14.3% 1.09 2.1% 23.20 60,049 370 1,510 0.08 FHLCVanEck Vectors Biotech ETF 9.0 14.2% 7.2% 0.2% 2.5% 6.3% 7.6% 1.63 0.4% 21.10 28,717 26 340 0.35 BBHVanEck Vectors Pharmaceutical ETF 6.7 10.0% 4.6% 3.7% 2.8% 0.1% 6.6% 1.19 2.0% 24.57 53,592 27 179 0.36 PPHiShares Nasdaq Biotechnology ETF 6.0 11.5% 7.9% 1.7% 1.0% 3.3% 8.1% 1.69 0.1% 18.28 14,617 223 6,843 0.47 IBB
----------------Performance----------------
MOMYTD
Return1 Mo
Return3 Mo
Return6 Mo
Return12 MoReturn
3 YrAvg
Return
3 YrRelRisk
CurrentYield(%)
P/ERatio
MedianMarketCapital
NumberHoldings
NetAssets
ExpRatio(%)
NasdaqTicker
Performance numbers reflect periods ending 10/31/2019. Funds shown in bold are the recommendations in the November 2019 issue for SMI’s two Basic strategies.Although gathered from reliable sources, data accuracy cannot be guaranteed.
Page 29Fund Performance Rankings | SoundMindInvesting.com
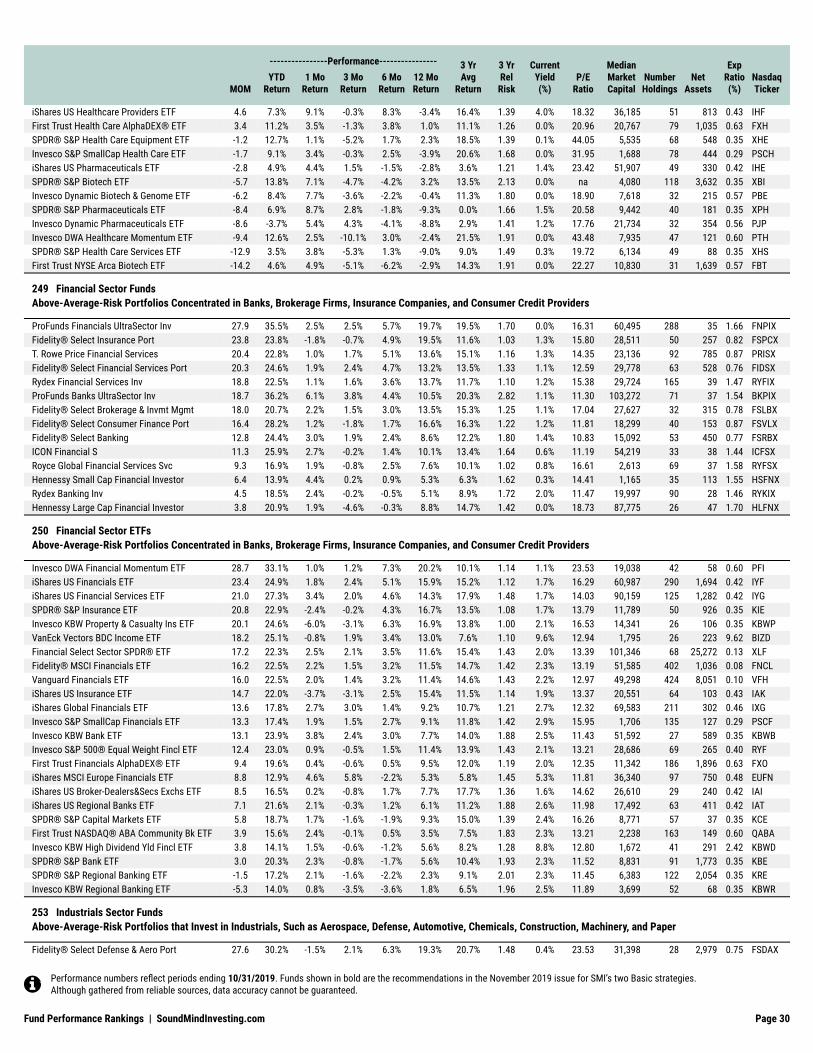
iShares US Healthcare Providers ETF 4.6 7.3% 9.1% -0.3% 8.3% -3.4% 16.4% 1.39 4.0% 18.32 36,185 51 813 0.43 IHFFirst Trust Health Care AlphaDEX® ETF 3.4 11.2% 3.5% -1.3% 3.8% 1.0% 11.1% 1.26 0.0% 20.96 20,767 79 1,035 0.63 FXHSPDR® S&P Health Care Equipment ETF -1.2 12.7% 1.1% -5.2% 1.7% 2.3% 18.5% 1.39 0.1% 44.05 5,535 68 548 0.35 XHEInvesco S&P SmallCap Health Care ETF -1.7 9.1% 3.4% -0.3% 2.5% -3.9% 20.6% 1.68 0.0% 31.95 1,688 78 444 0.29 PSCHiShares US Pharmaceuticals ETF -2.8 4.9% 4.4% 1.5% -1.5% -2.8% 3.6% 1.21 1.4% 23.42 51,907 49 330 0.42 IHESPDR® S&P Biotech ETF -5.7 13.8% 7.1% -4.7% -4.2% 3.2% 13.5% 2.13 0.0% na 4,080 118 3,632 0.35 XBIInvesco Dynamic Biotech & Genome ETF -6.2 8.4% 7.7% -3.6% -2.2% -0.4% 11.3% 1.80 0.0% 18.90 7,618 32 215 0.57 PBESPDR® S&P Pharmaceuticals ETF -8.4 6.9% 8.7% 2.8% -1.8% -9.3% 0.0% 1.66 1.5% 20.58 9,442 40 181 0.35 XPHInvesco Dynamic Pharmaceuticals ETF -8.6 -3.7% 5.4% 4.3% -4.1% -8.8% 2.9% 1.41 1.2% 17.76 21,734 32 354 0.56 PJPInvesco DWA Healthcare Momentum ETF -9.4 12.6% 2.5% -10.1% 3.0% -2.4% 21.5% 1.91 0.0% 43.48 7,935 47 121 0.60 PTHSPDR® S&P Health Care Services ETF -12.9 3.5% 3.8% -5.3% 1.3% -9.0% 9.0% 1.49 0.3% 19.72 6,134 49 88 0.35 XHSFirst Trust NYSE Arca Biotech ETF -14.2 4.6% 4.9% -5.1% -6.2% -2.9% 14.3% 1.91 0.0% 22.27 10,830 31 1,639 0.57 FBT
249 Financial Sector FundsAbove-Average-Risk Portfolios Concentrated in Banks, Brokerage Firms, Insurance Companies, and Consumer Credit Providers
ProFunds Financials UltraSector Inv 27.9 35.5% 2.5% 2.5% 5.7% 19.7% 19.5% 1.70 0.0% 16.31 60,495 288 35 1.66 FNPIXFidelity® Select Insurance Port 23.8 23.8% -1.8% -0.7% 4.9% 19.5% 11.6% 1.03 1.3% 15.80 28,511 50 257 0.82 FSPCXT. Rowe Price Financial Services 20.4 22.8% 1.0% 1.7% 5.1% 13.6% 15.1% 1.16 1.3% 14.35 23,136 92 785 0.87 PRISXFidelity® Select Financial Services Port 20.3 24.6% 1.9% 2.4% 4.7% 13.2% 13.5% 1.33 1.1% 12.59 29,778 63 528 0.76 FIDSXRydex Financial Services Inv 18.8 22.5% 1.1% 1.6% 3.6% 13.7% 11.7% 1.10 1.2% 15.38 29,724 165 39 1.47 RYFIXProFunds Banks UltraSector Inv 18.7 36.2% 6.1% 3.8% 4.4% 10.5% 20.3% 2.82 1.1% 11.30 103,272 71 37 1.54 BKPIXFidelity® Select Brokerage & Invmt Mgmt 18.0 20.7% 2.2% 1.5% 3.0% 13.5% 15.3% 1.25 1.1% 17.04 27,627 32 315 0.78 FSLBXFidelity® Select Consumer Finance Port 16.4 28.2% 1.2% -1.8% 1.7% 16.6% 16.3% 1.22 1.2% 11.81 18,299 40 153 0.87 FSVLXFidelity® Select Banking 12.8 24.4% 3.0% 1.9% 2.4% 8.6% 12.2% 1.80 1.4% 10.83 15,092 53 450 0.77 FSRBXICON Financial S 11.3 25.9% 2.7% -0.2% 1.4% 10.1% 13.4% 1.64 0.6% 11.19 54,219 33 38 1.44 ICFSXRoyce Global Financial Services Svc 9.3 16.9% 1.9% -0.8% 2.5% 7.6% 10.1% 1.02 0.8% 16.61 2,613 69 37 1.58 RYFSXHennessy Small Cap Financial Investor 6.4 13.9% 4.4% 0.2% 0.9% 5.3% 6.3% 1.62 0.3% 14.41 1,165 35 113 1.55 HSFNXRydex Banking Inv 4.5 18.5% 2.4% -0.2% -0.5% 5.1% 8.9% 1.72 2.0% 11.47 19,997 90 28 1.46 RYKIXHennessy Large Cap Financial Investor 3.8 20.9% 1.9% -4.6% -0.3% 8.8% 14.7% 1.42 0.0% 18.73 87,775 26 47 1.70 HLFNX
250 Financial Sector ETFsAbove-Average-Risk Portfolios Concentrated in Banks, Brokerage Firms, Insurance Companies, and Consumer Credit Providers
Invesco DWA Financial Momentum ETF 28.7 33.1% 1.0% 1.2% 7.3% 20.2% 10.1% 1.14 1.1% 23.53 19,038 42 58 0.60 PFIiShares US Financials ETF 23.4 24.9% 1.8% 2.4% 5.1% 15.9% 15.2% 1.12 1.7% 16.29 60,987 290 1,694 0.42 IYFiShares US Financial Services ETF 21.0 27.3% 3.4% 2.0% 4.6% 14.3% 17.9% 1.48 1.7% 14.03 90,159 125 1,282 0.42 IYGSPDR® S&P Insurance ETF 20.8 22.9% -2.4% -0.2% 4.3% 16.7% 13.5% 1.08 1.7% 13.79 11,789 50 926 0.35 KIEInvesco KBW Property & Casualty Ins ETF 20.1 24.6% -6.0% -3.1% 6.3% 16.9% 13.8% 1.00 2.1% 16.53 14,341 26 106 0.35 KBWPVanEck Vectors BDC Income ETF 18.2 25.1% -0.8% 1.9% 3.4% 13.0% 7.6% 1.10 9.6% 12.94 1,795 26 223 9.62 BIZDFinancial Select Sector SPDR® ETF 17.2 22.3% 2.5% 2.1% 3.5% 11.6% 15.4% 1.43 2.0% 13.39 101,346 68 25,272 0.13 XLFFidelity® MSCI Financials ETF 16.2 22.5% 2.2% 1.5% 3.2% 11.5% 14.7% 1.42 2.3% 13.19 51,585 402 1,036 0.08 FNCLVanguard Financials ETF 16.0 22.5% 2.0% 1.4% 3.2% 11.4% 14.6% 1.43 2.2% 12.97 49,298 424 8,051 0.10 VFHiShares US Insurance ETF 14.7 22.0% -3.7% -3.1% 2.5% 15.4% 11.5% 1.14 1.9% 13.37 20,551 64 103 0.43 IAKiShares Global Financials ETF 13.6 17.8% 2.7% 3.0% 1.4% 9.2% 10.7% 1.21 2.7% 12.32 69,583 211 302 0.46 IXGInvesco S&P SmallCap Financials ETF 13.3 17.4% 1.9% 1.5% 2.7% 9.1% 11.8% 1.42 2.9% 15.95 1,706 135 127 0.29 PSCFInvesco KBW Bank ETF 13.1 23.9% 3.8% 2.4% 3.0% 7.7% 14.0% 1.88 2.5% 11.43 51,592 27 589 0.35 KBWBInvesco S&P 500® Equal Weight Fincl ETF 12.4 23.0% 0.9% -0.5% 1.5% 11.4% 13.9% 1.43 2.1% 13.21 28,686 69 265 0.40 RYFFirst Trust Financials AlphaDEX® ETF 9.4 19.6% 0.4% -0.6% 0.5% 9.5% 12.0% 1.19 2.0% 12.35 11,342 186 1,896 0.63 FXOiShares MSCI Europe Financials ETF 8.8 12.9% 4.6% 5.8% -2.2% 5.3% 5.8% 1.45 5.3% 11.81 36,340 97 750 0.48 EUFNiShares US Broker-Dealers&Secs Exchs ETF 8.5 16.5% 0.2% -0.8% 1.7% 7.7% 17.7% 1.36 1.6% 14.62 26,610 29 240 0.42 IAIiShares US Regional Banks ETF 7.1 21.6% 2.1% -0.3% 1.2% 6.1% 11.2% 1.88 2.6% 11.98 17,492 63 411 0.42 IATSPDR® S&P Capital Markets ETF 5.8 18.7% 1.7% -1.6% -1.9% 9.3% 15.0% 1.39 2.4% 16.26 8,771 57 37 0.35 KCEFirst Trust NASDAQ® ABA Community Bk ETF 3.9 15.6% 2.4% -0.1% 0.5% 3.5% 7.5% 1.83 2.3% 13.21 2,238 163 149 0.60 QABAInvesco KBW High Dividend Yld Fincl ETF 3.8 14.1% 1.5% -0.6% -1.2% 5.6% 8.2% 1.28 8.8% 12.80 1,672 41 291 2.42 KBWDSPDR® S&P Bank ETF 3.0 20.3% 2.3% -0.8% -1.7% 5.6% 10.4% 1.93 2.3% 11.52 8,831 91 1,773 0.35 KBESPDR® S&P Regional Banking ETF -1.5 17.2% 2.1% -1.6% -2.2% 2.3% 9.1% 2.01 2.3% 11.45 6,383 122 2,054 0.35 KREInvesco KBW Regional Banking ETF -5.3 14.0% 0.8% -3.5% -3.6% 1.8% 6.5% 1.96 2.5% 11.89 3,699 52 68 0.35 KBWR
253 Industrials Sector FundsAbove-Average-Risk Portfolios that Invest in Industrials, Such as Aerospace, Defense, Automotive, Chemicals, Construction, Machinery, and Paper
Fidelity® Select Defense & Aero Port 27.6 30.2% -1.5% 2.1% 6.3% 19.3% 20.7% 1.48 0.4% 23.53 31,398 28 2,979 0.75 FSDAX
----------------Performance----------------
MOMYTD
Return1 Mo
Return3 Mo
Return6 Mo
Return12 MoReturn
3 YrAvg
Return
3 YrRelRisk
CurrentYield(%)
P/ERatio
MedianMarketCapital
NumberHoldings
NetAssets
ExpRatio(%)
NasdaqTicker
Performance numbers reflect periods ending 10/31/2019. Funds shown in bold are the recommendations in the November 2019 issue for SMI’s two Basic strategies.Although gathered from reliable sources, data accuracy cannot be guaranteed.
Page 30Fund Performance Rankings | SoundMindInvesting.com
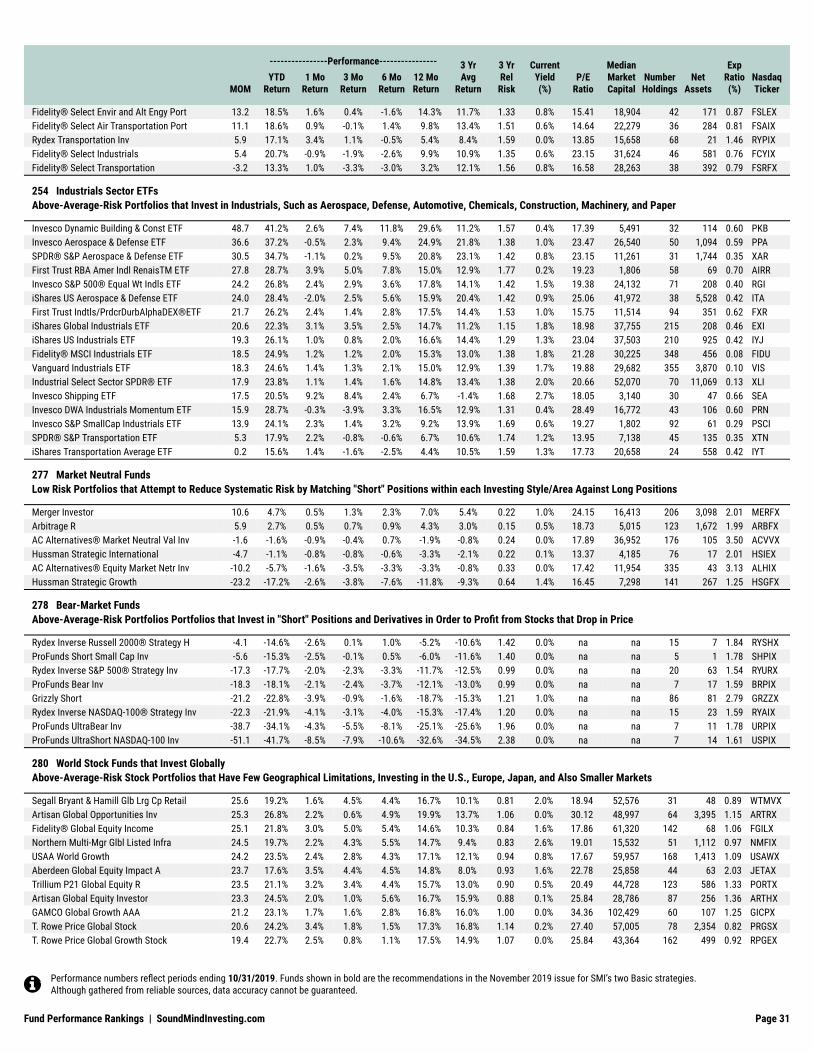
Fidelity® Select Envir and Alt Engy Port 13.2 18.5% 1.6% 0.4% -1.6% 14.3% 11.7% 1.33 0.8% 15.41 18,904 42 171 0.87 FSLEXFidelity® Select Air Transportation Port 11.1 18.6% 0.9% -0.1% 1.4% 9.8% 13.4% 1.51 0.6% 14.64 22,279 36 284 0.81 FSAIXRydex Transportation Inv 5.9 17.1% 3.4% 1.1% -0.5% 5.4% 8.4% 1.59 0.0% 13.85 15,658 68 21 1.46 RYPIXFidelity® Select Industrials 5.4 20.7% -0.9% -1.9% -2.6% 9.9% 10.9% 1.35 0.6% 23.15 31,624 46 581 0.76 FCYIXFidelity® Select Transportation -3.2 13.3% 1.0% -3.3% -3.0% 3.2% 12.1% 1.56 0.8% 16.58 28,263 38 392 0.79 FSRFX
254 Industrials Sector ETFsAbove-Average-Risk Portfolios that Invest in Industrials, Such as Aerospace, Defense, Automotive, Chemicals, Construction, Machinery, and Paper
Invesco Dynamic Building & Const ETF 48.7 41.2% 2.6% 7.4% 11.8% 29.6% 11.2% 1.57 0.4% 17.39 5,491 32 114 0.60 PKBInvesco Aerospace & Defense ETF 36.6 37.2% -0.5% 2.3% 9.4% 24.9% 21.8% 1.38 1.0% 23.47 26,540 50 1,094 0.59 PPASPDR® S&P Aerospace & Defense ETF 30.5 34.7% -1.1% 0.2% 9.5% 20.8% 23.1% 1.42 0.8% 23.15 11,261 31 1,744 0.35 XARFirst Trust RBA Amer Indl RenaisTM ETF 27.8 28.7% 3.9% 5.0% 7.8% 15.0% 12.9% 1.77 0.2% 19.23 1,806 58 69 0.70 AIRRInvesco S&P 500® Equal Wt Indls ETF 24.2 26.8% 2.4% 2.9% 3.6% 17.8% 14.1% 1.42 1.5% 19.38 24,132 71 208 0.40 RGIiShares US Aerospace & Defense ETF 24.0 28.4% -2.0% 2.5% 5.6% 15.9% 20.4% 1.42 0.9% 25.06 41,972 38 5,528 0.42 ITAFirst Trust Indtls/PrdcrDurbAlphaDEX®ETF 21.7 26.2% 2.4% 1.4% 2.8% 17.5% 14.4% 1.53 1.0% 15.75 11,514 94 351 0.62 FXRiShares Global Industrials ETF 20.6 22.3% 3.1% 3.5% 2.5% 14.7% 11.2% 1.15 1.8% 18.98 37,755 215 208 0.46 EXIiShares US Industrials ETF 19.3 26.1% 1.0% 0.8% 2.0% 16.6% 14.4% 1.29 1.3% 23.04 37,503 210 925 0.42 IYJFidelity® MSCI Industrials ETF 18.5 24.9% 1.2% 1.2% 2.0% 15.3% 13.0% 1.38 1.8% 21.28 30,225 348 456 0.08 FIDUVanguard Industrials ETF 18.3 24.6% 1.4% 1.3% 2.1% 15.0% 12.9% 1.39 1.7% 19.88 29,682 355 3,870 0.10 VISIndustrial Select Sector SPDR® ETF 17.9 23.8% 1.1% 1.4% 1.6% 14.8% 13.4% 1.38 2.0% 20.66 52,070 70 11,069 0.13 XLIInvesco Shipping ETF 17.5 20.5% 9.2% 8.4% 2.4% 6.7% -1.4% 1.68 2.7% 18.05 3,140 30 47 0.66 SEAInvesco DWA Industrials Momentum ETF 15.9 28.7% -0.3% -3.9% 3.3% 16.5% 12.9% 1.31 0.4% 28.49 16,772 43 106 0.60 PRNInvesco S&P SmallCap Industrials ETF 13.9 24.1% 2.3% 1.4% 3.2% 9.2% 13.9% 1.69 0.6% 19.27 1,802 92 61 0.29 PSCISPDR® S&P Transportation ETF 5.3 17.9% 2.2% -0.8% -0.6% 6.7% 10.6% 1.74 1.2% 13.95 7,138 45 135 0.35 XTNiShares Transportation Average ETF 0.2 15.6% 1.4% -1.6% -2.5% 4.4% 10.5% 1.59 1.3% 17.73 20,658 24 558 0.42 IYT
277 Market Neutral FundsLow Risk Portfolios that Attempt to Reduce Systematic Risk by Matching "Short" Positions within each Investing Style/Area Against Long Positions
Merger Investor 10.6 4.7% 0.5% 1.3% 2.3% 7.0% 5.4% 0.22 1.0% 24.15 16,413 206 3,098 2.01 MERFXArbitrage R 5.9 2.7% 0.5% 0.7% 0.9% 4.3% 3.0% 0.15 0.5% 18.73 5,015 123 1,672 1.99 ARBFXAC Alternatives® Market Neutral Val Inv -1.6 -1.6% -0.9% -0.4% 0.7% -1.9% -0.8% 0.24 0.0% 17.89 36,952 176 105 3.50 ACVVXHussman Strategic International -4.7 -1.1% -0.8% -0.8% -0.6% -3.3% -2.1% 0.22 0.1% 13.37 4,185 76 17 2.01 HSIEXAC Alternatives® Equity Market Netr Inv -10.2 -5.7% -1.6% -3.5% -3.3% -3.3% -0.8% 0.33 0.0% 17.42 11,954 335 43 3.13 ALHIXHussman Strategic Growth -23.2 -17.2% -2.6% -3.8% -7.6% -11.8% -9.3% 0.64 1.4% 16.45 7,298 141 267 1.25 HSGFX
278 Bear-Market FundsAbove-Average-Risk Portfolios Portfolios that Invest in "Short" Positions and Derivatives in Order to Profit from Stocks that Drop in Price
Rydex Inverse Russell 2000® Strategy H -4.1 -14.6% -2.6% 0.1% 1.0% -5.2% -10.6% 1.42 0.0% na na 15 7 1.84 RYSHXProFunds Short Small Cap Inv -5.6 -15.3% -2.5% -0.1% 0.5% -6.0% -11.6% 1.40 0.0% na na 5 1 1.78 SHPIXRydex Inverse S&P 500® Strategy Inv -17.3 -17.7% -2.0% -2.3% -3.3% -11.7% -12.5% 0.99 0.0% na na 20 63 1.54 RYURXProFunds Bear Inv -18.3 -18.1% -2.1% -2.4% -3.7% -12.1% -13.0% 0.99 0.0% na na 7 17 1.59 BRPIXGrizzly Short -21.2 -22.8% -3.9% -0.9% -1.6% -18.7% -15.3% 1.21 1.0% na na 86 81 2.79 GRZZXRydex Inverse NASDAQ-100® Strategy Inv -22.3 -21.9% -4.1% -3.1% -4.0% -15.3% -17.4% 1.20 0.0% na na 15 23 1.59 RYAIXProFunds UltraBear Inv -38.7 -34.1% -4.3% -5.5% -8.1% -25.1% -25.6% 1.96 0.0% na na 7 11 1.78 URPIXProFunds UltraShort NASDAQ-100 Inv -51.1 -41.7% -8.5% -7.9% -10.6% -32.6% -34.5% 2.38 0.0% na na 7 14 1.61 USPIX
280 World Stock Funds that Invest GloballyAbove-Average-Risk Stock Portfolios that Have Few Geographical Limitations, Investing in the U.S., Europe, Japan, and Also Smaller Markets
Segall Bryant & Hamill Glb Lrg Cp Retail 25.6 19.2% 1.6% 4.5% 4.4% 16.7% 10.1% 0.81 2.0% 18.94 52,576 31 48 0.89 WTMVXArtisan Global Opportunities Inv 25.3 26.8% 2.2% 0.6% 4.9% 19.9% 13.7% 1.06 0.0% 30.12 48,997 64 3,395 1.15 ARTRXFidelity® Global Equity Income 25.1 21.8% 3.0% 5.0% 5.4% 14.6% 10.3% 0.84 1.6% 17.86 61,320 142 68 1.06 FGILXNorthern Multi-Mgr Glbl Listed Infra 24.5 19.7% 2.2% 4.3% 5.5% 14.7% 9.4% 0.83 2.6% 19.01 15,532 51 1,112 0.97 NMFIXUSAA World Growth 24.2 23.5% 2.4% 2.8% 4.3% 17.1% 12.1% 0.94 0.8% 17.67 59,957 168 1,413 1.09 USAWXAberdeen Global Equity Impact A 23.7 17.6% 3.5% 4.4% 4.5% 14.8% 8.0% 0.93 1.6% 22.78 25,858 44 63 2.03 JETAXTrillium P21 Global Equity R 23.5 21.1% 3.2% 3.4% 4.4% 15.7% 13.0% 0.90 0.5% 20.49 44,728 123 586 1.33 PORTXArtisan Global Equity Investor 23.3 24.5% 2.0% 1.0% 5.6% 16.7% 15.9% 0.88 0.1% 25.84 28,786 87 256 1.36 ARTHXGAMCO Global Growth AAA 21.2 23.1% 1.7% 1.6% 2.8% 16.8% 16.0% 1.00 0.0% 34.36 102,429 60 107 1.25 GICPXT. Rowe Price Global Stock 20.6 24.2% 3.4% 1.8% 1.5% 17.3% 16.8% 1.14 0.2% 27.40 57,005 78 2,354 0.82 PRGSXT. Rowe Price Global Growth Stock 19.4 22.7% 2.5% 0.8% 1.1% 17.5% 14.9% 1.07 0.0% 25.84 43,364 162 499 0.92 RPGEX
----------------Performance----------------
MOMYTD
Return1 Mo
Return3 Mo
Return6 Mo
Return12 MoReturn
3 YrAvg
Return
3 YrRelRisk
CurrentYield(%)
P/ERatio
MedianMarketCapital
NumberHoldings
NetAssets
ExpRatio(%)
NasdaqTicker
Performance numbers reflect periods ending 10/31/2019. Funds shown in bold are the recommendations in the November 2019 issue for SMI’s two Basic strategies.Although gathered from reliable sources, data accuracy cannot be guaranteed.
Page 31Fund Performance Rankings | SoundMindInvesting.com

FPA Paramount 19.1 20.5% 3.2% 3.8% 2.5% 12.8% 12.9% 0.99 0.5% 21.83 25,270 42 168 1.29 FPRAXOakmark Global Select Investor 18.6 22.6% 5.5% 5.6% 2.0% 11.1% 7.3% 1.29 1.2% 13.39 52,103 26 1,914 1.12 OAKWXVanguard Global Equity Inv 18.4 20.3% 2.6% 1.5% 2.7% 14.1% 12.7% 0.95 1.3% 19.92 36,650 580 6,665 0.48 VHGEXOld Westbury Large Cap Strategies 16.8 18.5% 1.8% 0.9% 3.0% 12.9% 9.3% 0.90 0.9% 21.46 89,326 362 17,203 1.13 OWLSXWasatch Global Opportunities Investor 16.6 24.1% 2.6% -0.8% 0.3% 17.2% 15.0% 1.22 0.0% 30.96 3,861 82 129 1.55 WAGOXOakmark Global Investor 16.6 22.3% 4.5% 4.2% 1.4% 10.9% 10.4% 1.30 0.9% 14.64 36,682 49 1,796 1.15 OAKGXAve Maria World Equity 16.2 21.1% -1.0% -0.7% 2.1% 14.8% 10.2% 0.98 0.9% 18.21 55,006 41 70 1.26 AVEWXGuideStone Funds Aggressive Allc Inv 16.0 19.7% 2.6% 1.9% 1.5% 12.7% 11.3% 1.02 2.9% 18.25 44,251 10 1,046 1.19 GGBZXTweedy, Browne Worldwide Hi Div Yld Val 15.9 14.3% 2.7% 3.9% 2.8% 9.3% 11.1% 0.83 2.3% 15.36 73,206 33 152 1.38 TBHDXHarding Loevner Global Equity Advisor 15.4 19.6% 2.8% 2.2% 1.7% 11.6% 12.2% 1.06 0.1% 25.71 58,553 73 978 1.14 HLMGXFidelity® Worldwide 14.6 20.0% 2.6% 0.4% 1.5% 12.7% 14.1% 1.00 0.3% 25.00 80,048 265 2,347 0.94 FWWFXArtisan Global Value Investor 12.9 17.7% 2.5% 2.4% 1.2% 9.4% 8.7% 1.01 0.8% 16.78 53,521 59 3,076 1.28 ARTGXVanguard Global Capital Cycles Investor 12.9 15.1% 2.1% 2.4% 4.0% 6.5% -7.3% 1.51 0.0% 15.67 29,513 56 1,294 0.33 VGPMXMFAM Global Opps Investor 12.6 22.8% 0.8% -3.7% -1.6% 17.9% 15.6% 1.18 0.0% 27.55 26,413 62 485 1.06 FOOLXUSAA Cornerstone Equity 11.7 16.0% 2.1% 1.5% 1.1% 9.2% 9.0% 0.94 1.6% 15.85 26,825 16 217 0.67 UCEQXOld Westbury Small & Mid Cap Strategies 11.4 17.5% 2.1% 0.2% 1.8% 9.4% 7.8% 0.96 0.5% 20.58 3,646 6176 6,352 1.13 OWSMXPolaris Global Value 11.4 15.6% 2.7% 3.2% 0.4% 7.9% 9.1% 1.00 2.8% 13.12 17,755 86 465 0.99 PGVFXAdvisorOne CLS Global Diversified Eq N 11.4 13.5% 2.8% 1.4% 1.4% 8.6% 8.9% 0.89 1.8% 14.01 32,222 52 439 1.55 CLSAXPMC Diversified Equity 10.9 15.2% 2.4% 1.8% 1.5% 7.5% 9.1% 0.93 0.6% 14.71 23,495 1545 873 0.99 PMDEXDodge & Cox Global Stock 10.3 15.3% 3.2% 3.0% 0.3% 7.0% 9.2% 1.08 1.9% 13.50 47,345 125 9,741 0.62 DODWXWasatch Global Value Investor 10.1 12.2% 0.9% 3.1% 1.4% 5.7% 8.2% 0.88 2.1% 14.58 58,619 37 157 1.11 FMIEXAdvisorOne CLS Global Aggressive Eq N 8.8 14.2% 2.6% 1.1% 0.1% 7.6% 9.4% 1.00 1.5% 14.93 29,168 35 150 1.77 CLACXTweedy, Browne Value 8.1 11.7% 0.7% 0.6% -0.7% 8.3% 8.8% 0.78 1.0% 16.08 60,087 115 449 1.37 TWEBXSeven Canyons World Innovators Investor 7.4 13.3% 3.3% 1.3% -0.2% 6.3% 11.5% 0.96 0.0% 26.11 582 82 118 1.75 WAGTXLongleaf Partners Global 7.0 15.9% 5.8% 1.9% 1.0% 4.2% 7.6% 1.25 0.9% 13.99 21,767 19 292 1.20 LLGLXCambiar Global Ultra Focus Investor 6.9 21.9% 1.1% -0.9% -0.2% 8.0% 4.3% 1.42 0.8% 14.29 22,016 27 57 0.98 CAMAXMarsico Global 5.3 19.8% 1.8% -2.0% -1.0% 8.4% 16.5% 1.27 0.0% 29.15 97,472 34 229 1.45 MGLBXUSAA Capital Growth 5.2 14.1% 2.1% 1.0% -0.3% 4.6% 9.6% 1.04 1.4% 15.85 58,314 467 931 1.12 USCGXOberweis Global Opportunities Investor -1.8 16.7% 3.6% -2.4% -3.3% 4.0% 4.8% 1.38 0.0% 24.15 2,385 60 40 1.52 OBEGXThe Cook & Bynum -2.4 7.1% -2.6% -2.9% -4.2% 4.8% 1.4% 0.86 0.2% 24.21 28,437 13 115 1.49 COBYX
281 World Stock ETFs that Invest GloballyAbove-Average-Risk Stock Portfolios that Have Few Geographical Limitations, Investing in the U.S., Europe, Japan, and Also Smaller Markets
FlexShares STOXX Global Broad Infras ETF 30.6 22.5% 1.6% 4.5% 6.1% 20.0% 9.5% 0.77 2.3% 18.15 43,236 196 1,483 0.47 NFRAiShares Edge MSCI Min Vol Global ETF 28.0 19.0% 1.0% 4.0% 7.2% 16.9% 11.6% 0.63 2.1% 21.41 34,689 477 5,662 0.20 ACWVInvesco S&P Global Dividend Opps ETF 27.2 20.1% 1.3% 3.9% 5.4% 17.9% 10.6% 0.72 3.3% 15.63 23,899 111 30 0.64 LVLSPDR® S&P Global Dividend ETF 23.5 15.4% 2.9% 5.9% 4.5% 13.1% 8.3% 0.83 4.4% 15.17 12,684 118 294 0.40 WDIViShares Global 100 ETF 21.7 21.7% 3.0% 3.9% 4.4% 13.4% 13.9% 0.92 2.1% 19.38 233,324 119 2,089 0.40 IOOiShares MSCI Kokusai ETF 20.3 22.4% 2.6% 1.8% 4.2% 14.3% 12.7% 0.95 2.2% 19.31 77,004 1345 149 0.25 TOKiShares MSCI World ETF 19.0 21.0% 2.6% 2.5% 3.6% 13.0% 12.2% 0.93 2.1% 18.76 70,498 1231 802 0.24 URTHVanguard Total World Stock ETF 18.7 19.5% 2.8% 2.9% 2.9% 12.8% 11.4% 0.94 2.3% 17.30 42,196 8179 17,450 0.09 VTiShares MSCI ACWI ETF 18.3 19.6% 2.7% 2.7% 2.8% 12.7% 11.7% 0.93 2.0% 17.92 64,017 1465 10,925 0.32 ACWIJPMorgan Diversified Return Glbl Eq ETF 15.8 13.7% 2.1% 3.5% 2.4% 9.9% 8.2% 0.84 2.7% 15.24 16,072 593 142 0.29 JPGEWisdomTree Global High Dividend ETF 14.9 15.6% 1.8% 3.1% 2.2% 9.6% 7.8% 0.84 3.8% 13.37 46,465 752 94 0.58 DEWDB FI Enhanced Global High Yield ETN 14.2 10.0% 3.6% 10.0% 0.6% 3.6% 12.8% 1.23 0.0% na na na 4 0.10 FIEGSPDR® Global Dow ETF 11.3 15.3% 1.9% 1.5% 0.8% 9.0% 10.5% 0.97 2.9% 14.90 87,010 173 92 0.50 DGTGlobal X SuperDividend™ ETF 3.3 7.9% 2.3% 3.5% 1.1% -1.3% 2.0% 0.99 9.2% 10.15 2,479 113 936 0.58 SDIV
285 Foreign Regional Stock FundsAbove-Average-to-High-Risk Portfolios that Are Limited to One Geographic Region of the Globe or One Specific Country
Fidelity® Latin America 56.2 32.1% 6.6% 5.2% 18.9% 32.1% 10.4% 1.88 1.8% 15.50 4,517 28 579 1.07 FLATXMatthews China Small Companies 52.7 29.4% 6.3% 9.6% 8.1% 34.9% 15.8% 1.56 0.4% 14.64 1,562 54 86 1.50 MCSMXWasatch Emerging India Investor 42.2 12.2% 4.2% 9.1% 6.8% 26.3% 12.4% 1.42 0.0% 38.76 5,792 38 298 1.70 WAINXOberweis China Opportunities 34.0 28.8% 5.7% 5.8% 3.4% 24.9% 10.8% 1.65 0.0% 21.93 15,586 64 91 1.91 OBCHXFidelity® Emerging Asia 33.8 21.8% 4.6% 4.6% 2.2% 27.0% 12.6% 1.22 0.9% 19.57 45,331 77 1,051 1.02 FSEAXFidelity® Pacific Basin 32.9 24.1% 3.7% 5.3% 5.2% 22.4% 10.3% 1.12 0.6% 19.69 20,709 107 891 1.07 FPBFXFidelity® China Region 31.0 23.2% 5.0% 4.2% 1.1% 25.7% 13.0% 1.49 0.7% 14.99 44,544 89 1,218 0.96 FHKCXT. Rowe Price New Asia 29.9 18.8% 4.4% 5.3% 2.3% 22.2% 10.2% 1.22 1.2% 18.62 32,605 78 3,002 0.93 PRASXUS Global Investors Emerging Europe 29.3 21.0% 5.5% 2.7% 9.1% 17.5% 9.6% 1.23 0.0% 6.85 11,182 111 34 2.43 EUROXMatthews Asia Innovators Investor 28.0 20.0% 4.8% 2.9% 1.3% 23.8% 11.8% 1.44 0.3% 22.42 25,331 49 289 1.19 MATFX
----------------Performance----------------
MOMYTD
Return1 Mo
Return3 Mo
Return6 Mo
Return12 MoReturn
3 YrAvg
Return
3 YrRelRisk
CurrentYield(%)
P/ERatio
MedianMarketCapital
NumberHoldings
NetAssets
ExpRatio(%)
NasdaqTicker
Performance numbers reflect periods ending 10/31/2019. Funds shown in bold are the recommendations in the November 2019 issue for SMI’s two Basic strategies.Although gathered from reliable sources, data accuracy cannot be guaranteed.
Page 32Fund Performance Rankings | SoundMindInvesting.com

T. Rowe Price Emerging Europe 26.6 21.5% 5.8% 0.9% 7.7% 18.1% 9.7% 1.26 2.7% 6.96 17,118 41 161 1.42 TREMXMatthews Asia Small Companies Inv 26.2 15.9% 2.8% 4.9% 3.5% 17.9% 5.1% 1.02 0.4% 18.90 834 76 187 1.46 MSMLXFidelity® Japan 25.7 21.0% 3.8% 6.7% 7.0% 12.1% 8.8% 1.00 0.3% 14.81 11,292 102 757 1.05 FJPNXT. Rowe Price Japan 24.4 19.5% 4.2% 7.3% 6.1% 11.0% 9.8% 1.09 0.6% 18.55 9,045 76 797 0.95 PRJPXT. Rowe Price European Stock 24.0 20.3% 3.8% 5.2% 4.6% 14.2% 9.4% 1.04 2.2% 11.22 26,622 62 980 0.97 PRESXFidelity® Japan Smaller Companies 21.9 16.3% 3.8% 6.6% 7.1% 8.2% 8.5% 0.87 0.6% 12.82 2,150 86 686 0.94 FJSCXT. Rowe Price Latin America 21.5 15.9% 5.5% -0.7% 5.3% 16.9% 7.2% 1.72 1.3% 20.08 9,758 50 581 1.29 PRLAXMatthews Japan Investor 21.0 20.5% 3.8% 6.3% 4.1% 10.6% 5.7% 1.21 0.3% 18.73 10,019 57 2,449 0.91 MJFOXHennessy Japan Investor 20.1 14.2% 4.2% 6.2% 3.3% 10.6% 10.2% 1.02 0.0% 17.73 21,006 28 712 1.44 HJPNXMatthews Asia Growth Investor 18.4 19.3% 3.6% 2.5% 1.2% 14.7% 9.2% 1.26 0.1% 21.37 9,554 70 1,167 1.10 MPACXMatthews China Investor 17.9 21.4% 5.1% 0.6% -4.6% 22.0% 13.4% 1.78 1.4% 12.89 58,601 48 873 1.10 MCHFXHennessy Japan Small Cap Investor 17.0 14.6% 4.7% 4.3% 6.4% 6.3% 13.7% 1.01 0.0% 13.18 727 61 131 1.47 HJPSXMatthews Asian Growth & Inc Investor 15.3 12.4% 3.6% 1.0% 0.4% 13.9% 5.0% 0.86 1.7% 15.87 25,714 68 1,491 1.08 MACSXMatthews India Investor 14.6 0.6% 3.6% 5.8% -2.1% 11.0% 3.7% 1.32 0.0% 22.62 5,474 56 1,191 1.09 MINDXGuinness Atkinson China & Hong Kong 14.2 16.7% 6.2% 4.6% -3.9% 13.5% 9.8% 1.40 1.3% 10.54 12,489 34 64 1.54 ICHKXFidelity® Canada 13.1 19.3% -1.8% -0.3% 1.7% 11.7% 6.3% 0.98 1.1% 17.42 25,909 42 893 0.89 FICDXMatthews Asia Dividend Investor 12.9 8.4% 4.1% 4.0% 0.7% 8.3% 6.4% 0.99 1.5% 15.41 10,165 86 5,675 1.01 MAPIXFidelity® Europe 10.7 15.5% 3.9% 3.7% -0.6% 7.6% 7.2% 1.11 0.8% 17.01 15,546 77 898 0.96 FIEUXFidelity® Nordic 8.5 9.4% 2.9% 4.3% 0.3% 4.0% 6.5% 1.15 0.1% 16.67 8,992 43 262 0.98 FNORXMatthews Pacific Tiger Investor 4.1 4.4% 1.0% -0.6% -3.4% 8.1% 6.6% 0.96 0.7% 19.46 24,173 71 8,797 1.04 MAPTXMatthews China Dividend Investor 3.7 10.5% 1.6% -3.4% -5.7% 12.7% 9.8% 1.14 1.8% 14.08 6,778 54 369 1.15 MCDFXMatthews Korea Investor 0.4 -3.5% 3.0% 3.8% -3.9% 0.5% 1.5% 1.37 2.5% 12.08 5,063 39 149 1.14 MAKOXMatthews Emerging Asia Investor -12.1 -3.8% 2.9% -1.8% -7.9% -2.4% -1.9% 0.76 0.8% 9.81 742 71 383 1.48 MEASXT. Rowe Price Africa & Middle East -13.5 0.7% -0.2% -5.8% -10.9% 3.2% 5.1% 1.02 2.0% 13.77 6,992 57 117 1.36 TRAMX
286 Foreign Regional Stock ETFsAbove-Average-to-High-Risk Portfolios that Are Limited to One Geographic Region of the Globe or One Specific Country
iShares MSCI Russia Capped ETF 57.1 37.8% 7.3% 6.8% 18.7% 31.6% 17.5% 1.57 4.8% 5.72 33,952 29 710 0.59 ERUSGlobal X MSCI Greece ETF 50.2 43.5% 5.7% 2.1% 16.5% 31.6% 13.2% 1.90 2.1% 17.24 2,078 35 327 0.59 GREKGlobal X MSCI China Consumer Disc ETF 45.8 35.7% 9.4% 9.8% 2.4% 33.5% 15.7% 1.77 2.3% 18.87 20,972 59 159 0.65 CHIQiShares MSCI Taiwan Capped ETF 39.3 22.8% 6.8% 10.1% 8.3% 20.9% 10.2% 1.14 2.6% 16.45 20,571 98 3,241 0.59 EWTColumbia India Consumer ETF 36.9 -0.2% 6.8% 16.5% 6.8% 13.7% 7.3% 1.55 0.1% 34.97 11,019 25 110 0.75 INCOVanEck Vectors Russia ETF 35.9 28.4% 5.6% 2.4% 11.8% 21.7% 13.0% 1.48 4.0% 6.57 22,810 30 1,379 0.65 RSXiShares MSCI Italy Capped ETF 33.2 23.4% 4.7% 6.8% 5.6% 20.8% 12.5% 1.62 4.3% 12.36 27,408 30 269 0.47 EWIiShares MSCI Switzerland ETF 31.5 24.9% 2.3% 3.8% 8.8% 19.0% 12.5% 0.91 2.0% 23.36 66,334 45 1,149 0.47 EWLVanEck Vectors Brazil Small-Cap ETF 30.4 21.6% 5.0% -2.3% 10.7% 22.1% 13.8% 2.25 2.4% 18.52 1,587 70 87 0.60 BRFFirst Trust STOXX® European Sel Div ETF 29.3 17.7% 5.2% 10.2% 5.7% 13.5% 9.7% 0.95 4.9% 13.12 25,408 32 310 0.57 FDDVanEck Vectors ChinaAMC SME-ChiNext ETF 28.7 31.1% 4.7% 4.4% 0.1% 24.2% -5.1% 1.91 0.0% 27.40 9,512 104 29 0.65 CNXTiShares Edge MSCI Min Vol Japan ETF 26.8 11.7% 2.4% 8.8% 8.3% 9.7% 7.0% 0.67 1.4% 17.06 15,927 167 35 0.30 JPMVWisdomTree Germany Hedged Equity ETF 26.1 21.5% 5.5% 8.3% 4.8% 13.1% 8.6% 1.07 2.6% 16.10 43,001 81 45 0.48 DXGEiShares Currency Hedged MSCI Eurozn ETF 25.9 24.5% 1.9% 4.9% 4.4% 16.6% 10.8% 1.01 2.9% 17.39 42,274 256 964 0.50 HEZUiShares MSCI Netherlands ETF 25.5 24.6% 2.0% 3.7% 3.2% 18.5% 12.1% 1.14 2.7% 18.35 31,509 64 168 0.47 EWNiShares Edge MSCI Min Vol Europe ETF 24.6 16.8% 2.8% 5.0% 5.7% 14.0% 9.7% 0.82 3.1% 19.96 32,481 178 25 0.25 EUMVVanEck Vectors Russia Small-Cap ETF 24.5 24.9% 0.3% -2.0% 8.9% 17.6% 4.4% 1.45 3.6% 5.98 1,306 26 34 0.76 RSXJSPDR® EURO STOXX 50 ETF 24.2 20.7% 3.8% 5.6% 3.9% 14.7% 9.3% 1.21 2.8% 18.35 78,680 52 2,165 0.29 FEZiShares MSCI Japan Small-Cap ETF 24.1 16.5% 4.0% 8.4% 6.8% 8.9% 7.0% 0.97 2.3% 15.34 1,510 968 120 0.47 SCJiShares MSCI Japan ETF 23.6 16.8% 3.4% 8.0% 6.8% 8.8% 6.9% 0.89 1.5% 14.39 22,805 330 13,702 0.47 EWJiShares MSCI Brazil Capped ETF 23.6 18.2% 5.9% 0.2% 9.1% 14.2% 8.4% 2.29 2.5% 16.56 18,378 60 9,202 0.59 EWZXtrackers MSCI Germany Hedged Equity ETF 23.0 22.0% 4.3% 6.5% 4.1% 12.4% 7.8% 1.06 2.2% 17.57 46,013 73 19 0.45 DBGRiShares Currency Hedged MSCI Germany ETF 22.8 21.9% 3.9% 6.2% 3.9% 12.7% 7.9% 1.07 2.6% 17.64 45,954 70 167 0.53 HEWGWisdomTree Japan SmallCap Dividend ETF 22.1 13.8% 5.2% 9.6% 7.1% 5.4% 6.7% 0.98 2.0% 12.21 1,265 820 458 0.58 DFJiShares India 50 ETF 22.1 7.1% 2.4% 3.8% -1.0% 19.3% 8.8% 1.34 1.0% 21.83 37,968 58 782 0.94 INDYiShares MSCI Australia ETF 22.1 19.4% 1.3% 0.5% 5.6% 15.9% 8.9% 0.91 5.3% 17.73 26,675 75 1,524 0.47 EWAiShares MSCI France ETF 21.6 20.7% 3.6% 4.8% 3.6% 13.2% 11.8% 1.16 2.7% 19.69 50,668 84 1,135 0.47 EWQXtrackers MSCI Europe Hedged Equity ETF 21.4 22.0% 0.8% 2.7% 3.9% 14.8% 10.4% 0.84 3.3% 17.42 46,980 471 937 0.45 DBEUWisdomTree Europe Hedged Equity ETF 21.1 22.6% 1.1% 2.8% 2.3% 15.9% 10.2% 1.01 1.7% 16.23 44,879 128 3,469 0.58 HEDJiShares Core MSCI Pacific ETF 20.3 16.2% 3.1% 4.7% 4.5% 11.1% 7.8% 0.86 2.7% 14.68 15,939 813 1,089 0.09 IPACiShares MSCI India ETF 20.2 4.9% 3.2% 5.0% -1.5% 16.8% 7.2% 1.36 1.7% 20.62 27,753 87 5,345 0.68 INDAiShares MSCI Sweden ETF 19.8 15.2% 7.0% 7.9% 1.0% 10.9% 8.5% 1.28 3.1% 16.37 19,752 40 220 0.53 EWDFirst Trust United Kingdom AlphaDEX® ETF 19.6 20.3% 5.6% 7.2% 1.8% 10.6% 9.1% 1.17 3.1% 14.47 10,961 77 10 0.80 FKU
----------------Performance----------------
MOMYTD
Return1 Mo
Return3 Mo
Return6 Mo
Return12 MoReturn
3 YrAvg
Return
3 YrRelRisk
CurrentYield(%)
P/ERatio
MedianMarketCapital
NumberHoldings
NetAssets
ExpRatio(%)
NasdaqTicker
Performance numbers reflect periods ending 10/31/2019. Funds shown in bold are the recommendations in the November 2019 issue for SMI’s two Basic strategies.Although gathered from reliable sources, data accuracy cannot be guaranteed.
Page 33Fund Performance Rankings | SoundMindInvesting.com

Invesco India ETF 19.1 4.0% 3.6% 5.5% -1.6% 15.2% 7.4% 1.33 1.1% 19.49 22,968 128 133 0.82 PINiShares MSCI Eurozone ETF 19.1 18.4% 3.9% 5.0% 2.4% 11.7% 8.8% 1.18 3.0% 17.39 42,274 254 6,223 0.47 EZUGlobal X MSCI Colombia ETF 19.0 23.8% 6.0% 2.7% 1.3% 15.0% 3.8% 1.68 4.1% 12.06 6,637 28 74 0.61 GXGiShares MSCI Philippines ETF 18.7 10.8% 4.9% -0.5% 1.1% 18.1% 0.4% 1.19 0.7% 16.26 8,023 44 243 0.59 EPHEVanguard FTSE Europe ETF 18.6 17.9% 3.8% 4.7% 2.3% 11.5% 9.3% 1.03 3.4% 16.61 32,754 1333 19,016 0.09 VGKFirst Trust Chindia ETF 18.4 18.8% 6.5% 4.7% -3.9% 17.6% 7.9% 1.49 0.7% 15.92 26,524 51 110 0.59 FNIVanguard FTSE Pacific ETF 18.4 14.1% 3.2% 5.1% 3.5% 9.7% 7.3% 0.95 2.8% 13.64 14,300 2339 6,821 0.09 VPLiShares Core MSCI Europe ETF 18.3 18.0% 3.8% 4.8% 2.3% 11.3% 9.3% 1.03 3.3% 17.09 32,921 996 3,352 0.09 IEURXtrackers MSCI Japan Hedged Equity ETF 18.2 17.0% 3.6% 7.5% 4.5% 6.2% 9.5% 1.09 3.6% 14.41 22,762 333 351 0.45 DBJPiShares Europe ETF 18.2 17.6% 3.6% 4.5% 2.3% 11.5% 8.7% 1.03 3.2% 17.42 49,896 376 1,700 0.59 IEVXtrackers Harvest CSI 300 China A ETF 18.2 27.3% 3.1% 0.2% -3.7% 21.7% 5.2% 1.59 1.0% 13.37 26,909 317 1,774 0.65 ASHRiShares Currency Hedged MSCI Japan ETF 18.1 16.9% 3.6% 7.6% 4.5% 6.0% 9.7% 1.19 2.0% 14.39 22,805 331 351 0.48 HEWJiShares MSCI New Zealand ETF 18.0 15.8% 1.2% -3.5% 1.8% 19.7% 11.4% 1.04 3.0% 20.58 3,207 30 162 0.47 ENZLInvesco China Technology ETF 18.0 21.4% 4.4% 6.9% -6.5% 17.6% 7.8% 1.91 0.4% 22.68 24,427 103 538 0.70 CQQQVanEck Vectors ChinaAMC CSI 300 ETF 17.9 26.8% 3.7% 0.5% -3.9% 21.3% 4.8% 1.61 0.7% 13.39 27,052 303 67 0.60 PEKFirst Trust Switzerland AlphaDEX® ETF 17.6 17.8% 3.8% 3.7% 2.9% 11.0% 10.4% 1.02 2.2% 20.45 10,757 41 139 0.80 FSZSPDR® EURO STOXX Small Cap ETF 17.3 17.1% 4.4% 4.1% 1.4% 11.9% 10.8% 1.21 3.0% 15.38 7,210 103 18 0.46 SMEZiShares Asia/Pacific Dividend ETF 17.1 13.6% 1.7% 3.2% 2.9% 11.0% 4.0% 0.84 6.0% 15.08 6,177 43 33 0.49 DVYAWisdomTree Japan Hedged SmallCap Eq ETF 16.6 13.9% 5.4% 9.2% 4.5% 2.9% 9.8% 1.20 1.1% 12.11 1,262 819 60 0.58 DXJSiShares MSCI Germany ETF 15.9 15.7% 6.1% 6.5% 1.9% 7.6% 5.8% 1.24 2.6% 17.64 45,954 69 2,127 0.47 EWGiShares MSCI Denmark ETF 15.7 13.1% 3.1% 4.4% 0.0% 11.3% 8.2% 1.10 2.8% 19.46 17,080 50 32 0.53 EDENiShares MSCI Belgium Capped ETF 15.7 19.3% 1.3% 1.0% 2.0% 12.6% 5.1% 1.17 2.3% 16.21 11,529 48 51 0.47 EWKInvesco BLDRS Asia 50 ADR 14.8 13.4% 1.5% 4.3% 0.6% 9.9% 6.6% 1.16 2.4% 15.97 96,909 51 18 0.30 ADRAiShares MSCI Canada ETF 14.5 21.2% -0.4% 1.4% 1.7% 11.4% 6.6% 1.10 2.3% 13.46 31,331 96 2,809 0.47 EWCiShares MSCI Ireland ETF 14.2 18.2% 5.4% 6.6% 1.2% 6.5% 7.7% 1.02 1.6% 17.15 8,084 29 64 0.47 EIRLiShares MSCI Pacific ex Japan ETF 14.2 14.9% 2.6% -1.2% 0.0% 15.4% 8.4% 0.95 4.4% 15.63 26,709 160 2,352 0.48 EPPVanEck Vectors Israel ETF 14.1 20.4% 2.6% 0.8% 3.4% 9.8% 9.3% 1.16 0.6% 18.05 4,201 129 56 0.60 ISRAiShares Asia 50 ETF 14.0 11.4% 4.3% 2.5% -2.5% 14.0% 10.0% 1.32 2.4% 12.03 104,040 59 1,120 0.50 AIAiShares MSCI Mexico Capped ETF 13.8 9.8% 3.7% 7.4% -2.0% 8.4% -2.3% 1.84 2.8% 12.84 9,619 59 812 0.47 EWWFirst Trust Europe AlphaDEX® ETF 13.1 17.6% 3.7% 4.3% 0.9% 7.8% 9.9% 1.20 2.2% 11.76 10,405 206 494 0.80 FEPiShares MSCI Singapore Capped ETF 12.8 12.1% 4.8% 0.6% -1.4% 13.7% 10.0% 1.32 3.7% 12.79 15,738 32 545 0.47 EWSiShares MSCI Turkey ETF 12.7 3.3% -7.4% -5.2% 8.9% 9.1% -10.2% 2.89 2.7% 8.09 2,793 50 366 0.59 TURWisdomTree Japan Hedged Equity ETF 12.7 15.1% 4.4% 7.9% 2.7% 2.1% 7.9% 1.25 1.7% 13.04 17,919 470 2,665 0.48 DXJSPDR® S&P Emerging Asia Pacific ETF 11.9 11.4% 4.0% 1.6% -2.9% 13.2% 8.5% 1.17 2.1% 14.53 25,153 1274 473 0.49 GMFWisdomTree Europe SmallCap Dividend ETF 11.6 14.0% 5.4% 6.3% -0.5% 5.8% 7.2% 1.13 3.7% 12.76 1,259 434 551 0.58 DFEiShares MSCI All Country Asia ex Jpn ETF 10.9 9.8% 4.5% 2.1% -3.5% 12.3% 7.6% 1.22 1.9% 13.64 38,176 902 3,954 0.69 AAXJWisdomTree Asia Pacific ex-Japan ETF 10.4 11.1% 2.5% 0.9% -1.0% 10.5% 7.3% 0.97 3.8% 12.06 43,191 218 31 0.48 AXJLiShares MSCI Emerging Markets Asia ETF 10.3 9.3% 3.9% 2.9% -3.7% 11.2% 7.7% 1.22 1.9% 13.62 38,952 775 463 0.50 EEMAiShares MSCI Germany Small-Cap ETF 10.3 18.2% 5.3% 3.9% -0.7% 7.1% 12.1% 1.42 3.0% 13.19 2,641 115 34 0.59 EWGSKraneShares CSI China Internet ETF 9.8 19.8% 8.7% 6.4% -7.9% 11.3% 5.8% 2.16 0.0% 19.27 29,525 44 1,797 0.76 KWEBiShares MSCI Indonesia ETF 9.7 2.3% 2.0% -2.9% -2.8% 15.5% 0.0% 1.35 1.8% 15.34 10,364 81 472 0.59 EIDOXtrackers MSCI South Korea Hdg Eq ETF 9.6 6.6% 2.0% 5.0% -2.7% 7.3% 4.8% 1.20 2.8% 10.93 21,505 117 6 0.58 DBKOiShares MSCI United Kingdom ETF 9.2 13.7% 3.5% 3.1% -1.2% 7.2% 7.1% 1.00 4.5% 15.20 48,837 106 2,456 0.47 EWUVanEck Vectors Indonesia ETF 8.9 2.4% 2.7% -2.8% -3.4% 15.0% 0.1% 1.34 2.1% 16.00 9,645 45 41 0.57 IDXInvesco Golden Dragon China ETF 8.4 20.7% 6.7% 4.9% -9.7% 13.3% 7.1% 2.04 0.2% 18.94 19,374 69 192 0.70 PGJiShares MSCI Israel Capped ETF 7.7 15.7% 2.3% 1.1% -0.6% 7.3% 7.8% 1.29 0.4% 16.61 4,493 76 120 0.59 EISiShares MSCI Spain Capped ETF 7.7 8.1% 2.7% 4.2% -3.3% 6.7% 4.8% 1.41 3.2% 13.00 29,796 28 927 0.47 EWPWisdomTree India Earnings ETF 7.6 0.0% 3.0% 2.4% -5.4% 10.6% 5.3% 1.44 1.2% 13.39 14,723 309 1,098 0.85 EPIGlobal X MSCI Portugal ETF 7.3 9.0% 5.4% 4.6% -0.8% 3.6% 7.9% 1.23 7.3% 16.31 4,560 25 22 0.57 PGALiShares MSCI Austria Capped ETF 6.0 14.7% 6.4% 6.1% -0.8% 0.8% 10.8% 1.40 3.8% 10.68 6,095 32 65 0.47 EWOFirst Trust Japan AlphaDEX® ETF 6.0 5.0% 4.2% 5.7% 1.0% -0.7% 1.7% 1.01 1.9% 10.96 9,025 101 76 0.80 FJPGlobal X FTSE Nordic Region ETF 5.7 7.8% 1.3% 2.2% -2.2% 5.7% 6.9% 1.03 5.9% 17.64 34,400 33 18 0.58 GXFVanEck Vectors Vietnam ETF 5.4 10.0% -0.5% 0.3% -2.7% 7.9% 5.8% 1.26 0.9% 19.23 2,729 29 464 0.68 VNMiShares MSCI South Korea Capped ETF 4.7 0.1% 4.6% 6.4% -4.1% 2.5% 4.0% 1.55 1.3% 10.95 21,756 118 4,426 0.59 EWYiShares MSCI China ETF 4.2 11.8% 4.3% 0.0% -7.4% 11.6% 9.2% 1.61 1.5% 12.50 65,393 467 4,094 0.59 MCHISPDR® S&P China ETF 3.9 11.5% 3.9% -0.2% -7.2% 11.3% 8.9% 1.56 2.1% 12.50 44,273 747 1,220 0.59 GXCiShares Latin America 40 ETF 3.9 9.0% 4.8% 0.2% 0.1% 3.6% 4.8% 1.79 2.8% 15.06 33,605 48 1,810 0.48 ILFFirst Trust Germany AlphaDEX® ETF 3.7 12.8% 4.0% 2.3% -1.4% 2.8% 6.6% 1.32 2.3% 11.06 10,242 41 138 0.80 FGMiShares MSCI Hong Kong ETF 1.8 7.3% 4.8% -4.3% -8.6% 14.7% 6.9% 1.29 3.0% 13.32 33,608 54 1,721 0.48 EWHXtrackers Harvest CSI 500 CHN A SmCp ETF 0.9 14.0% 0.5% -0.6% -11.1% 12.6% -9.6% 1.71 0.0% 19.72 2,364 514 50 0.65 ASHSInvesco China Small Cap ETF 0.8 8.2% 3.8% -1.0% -8.4% 10.2% 5.0% 1.43 4.8% 9.20 2,712 320 59 0.75 HAO
----------------Performance----------------
MOMYTD
Return1 Mo
Return3 Mo
Return6 Mo
Return12 MoReturn
3 YrAvg
Return
3 YrRelRisk
CurrentYield(%)
P/ERatio
MedianMarketCapital
NumberHoldings
NetAssets
ExpRatio(%)
NasdaqTicker
Performance numbers reflect periods ending 10/31/2019. Funds shown in bold are the recommendations in the November 2019 issue for SMI’s two Basic strategies.Although gathered from reliable sources, data accuracy cannot be guaranteed.
Page 34Fund Performance Rankings | SoundMindInvesting.com

iShares China Large-Cap ETF 0.5 6.4% 3.4% 0.1% -6.6% 7.0% 6.5% 1.45 2.1% 8.39 94,202 56 4,603 0.74 FXIiShares MSCI Thailand Capped ETF -1.8 8.0% -0.8% -4.4% -1.3% 3.9% 9.6% 1.25 2.3% na na 120 505 0.59 THDGlobal X MSCI China Financials ETF -2.9 8.2% 4.2% -1.3% -9.7% 8.1% 7.7% 1.60 5.6% 7.05 60,195 90 61 0.65 CHIXiShares MSCI Peru ETF -3.1 1.5% 0.9% -1.4% -5.5% 3.8% 5.0% 1.15 2.3% 4.73 4,926 29 165 0.59 EPUFirst Trust AsiaPac ex-Jpn AlphaDEX® ETF -3.8 4.3% 1.2% -1.8% -5.5% 3.5% 1.9% 1.22 2.8% 10.40 9,140 106 26 0.80 FPAFirst Trust Hong Kong AlphaDEX® ETF -3.8 2.5% 4.8% -3.8% -7.6% 7.5% 2.8% 1.28 3.7% 9.12 9,756 44 4 0.80 FHKiShares MSCI India Small-Cap ETF -4.0 -6.8% 1.7% 2.4% -8.5% 2.1% -0.4% 1.82 0.6% 18.12 1,499 268 299 0.77 SMINiShares MSCI Poland ETF -4.1 -4.7% 6.1% -2.0% -5.6% 3.5% 7.6% 1.74 1.6% 11.83 4,933 38 291 0.63 EPOLiShares MSCI Qatar ETF -5.7 -1.6% 0.1% -0.4% -3.9% -1.4% 1.4% 1.45 4.3% 13.68 7,503 33 61 0.59 QATiShares MSCI South Africa ETF -6.6 0.8% 4.5% -4.0% -10.2% 7.6% -0.6% 1.74 4.8% 13.44 9,668 52 404 0.59 EZAVanEck Vectors Africa ETF -9.4 3.2% 1.7% -4.1% -8.0% 2.7% 1.8% 1.22 1.6% 11.47 6,298 87 55 0.78 AFKiShares MSCI Malaysia ETF -10.0 -3.8% 1.0% -2.7% -3.6% -3.7% 1.0% 0.98 3.6% 18.25 8,489 47 509 0.47 EWMGlobal X MSCI Norway ETF -14.7 3.8% 0.1% 0.7% -6.2% -9.2% 6.3% 1.24 7.7% 14.62 8,630 67 81 0.50 NORWiShares MSCI China Small-Cap ETF -15.4 2.3% 1.6% -4.2% -12.2% 1.0% 0.9% 1.24 6.1% 7.65 970 261 22 0.59 ECNSVanEck Vectors India Small-Cap ETF -35.8 -21.8% 1.7% 0.1% -20.7% -15.2% -11.6% 2.17 0.2% 13.89 947 175 130 0.83 SCIFiShares MSCI Chile Capped ETF -43.0 -15.0% -7.8% -10.2% -17.6% -15.1% -2.9% 1.88 2.4% 13.89 5,946 34 338 0.59 ECH
291 Foreign Emerging Markets Stock FundsHigh-Risk Portfolios that Invest At Least 50% of Their Assets in 20 or More “Emerging Market” Economies Around the World
Wasatch Emerging Markets Small Cap Inv 49.7 22.9% 7.6% 8.8% 8.8% 32.0% 7.0% 1.23 0.0% 25.77 3,158 58 397 1.95 WAEMXDriehaus Emerging Markets Small Cap Gr 36.1 24.6% 4.9% 3.7% 8.6% 23.7% 4.5% 1.10 0.0% 19.27 3,033 96 59 1.45 DRESXFidelity® Emerging Markets 31.7 24.0% 4.0% 3.2% 3.7% 24.9% 11.6% 1.20 0.7% 19.96 56,823 87 4,122 0.96 FEMKXWasatch Frontier Emerg Sm Countrs Inv 27.2 20.2% 4.4% 0.4% 5.2% 21.7% 3.5% 1.09 0.0% 18.35 4,244 42 63 2.17 WAFMXFiera Capital Emerging Markets Inv 26.2 18.3% 4.9% 4.1% 0.7% 21.4% 6.7% 1.22 0.0% 15.97 21,179 77 2,222 1.61 RIMIXDriehaus Emerging Markets Growth Inv 24.0 17.4% 4.4% 2.5% 3.4% 18.0% 9.8% 1.08 0.4% 17.95 35,765 111 1,740 1.39 DREGXPear Tree Axiom Emerging Mkts Wld Eq Ord 20.3 16.2% 4.9% 2.7% 2.1% 15.4% 5.4% 1.13 2.0% 17.92 50,095 136 93 1.51 QFFOXT. Rowe Price Emerging Markets Stock 20.1 17.0% 3.8% 1.7% 0.7% 17.8% 9.5% 1.26 0.5% 17.01 48,813 83 12,710 1.22 PRMSXFidelity® Emerging Markets Discovery 17.4 12.4% 2.7% 0.7% 0.9% 15.8% 5.6% 1.10 1.6% 14.73 2,915 200 307 1.22 FEDDXFidelity® EMEA 17.1 14.5% 4.4% 0.0% 1.4% 15.7% 9.1% 1.20 2.1% 9.19 10,552 80 107 1.34 FEMEXAB Emerging Markets 16.7 16.1% 4.4% 1.8% -0.3% 15.1% 4.8% 1.27 1.2% 11.57 17,285 207 1,197 1.03 SNEMXHarding Loevner Emerging Markets Advisor 15.6 16.6% 4.0% 0.9% -1.8% 16.5% 7.1% 1.26 0.8% 15.36 39,281 79 4,403 1.40 HLEMXFidelity® Total Emerg Mkts 14.7 13.1% 2.9% 0.3% 0.6% 13.8% 6.5% 0.96 2.2% 13.32 31,947 327 718 1.13 FTEMXVanguard Emerg Mkts Sel Stk Inv 13.7 12.6% 3.9% 1.3% -1.6% 14.0% 8.2% 1.18 2.3% 12.42 27,561 285 702 0.94 VMMSXUSAA Emerging Markets 13.6 13.1% 3.9% 1.9% -1.3% 13.0% 4.7% 1.18 1.1% 12.47 19,830 302 789 1.49 USEMXThomas White Emerging Markets Investor 11.2 13.0% 3.6% 1.3% -1.9% 11.8% 5.0% 1.26 1.2% 12.77 37,727 80 38 1.35 TWEMXNorthern Active M Emerging Market Equity 10.0 8.7% 3.2% 2.3% -0.6% 8.3% 6.1% 1.15 0.9% 14.58 32,192 375 600 1.10 NMMEXState Street Defensive Em Mkts Eq N 1.0 3.2% 1.7% -0.5% -2.4% 3.9% 4.2% 0.83 4.4% 11.36 11,375 148 52 1.25 SSEMX
292 Foreign Emerging Markets Stock ETFsHigh-Risk Portfolios that Invest At Least 50% of Their Assets in 20 or More “Emerging Market” Economies Around the World
Invesco DWA Emerging Markets Mom ETF 33.0 21.0% 6.3% 5.2% 8.9% 18.8% 7.2% 1.15 2.2% 19.16 7,780 110 173 0.90 PIEiShares Emerging Markets Infras ETF 25.0 10.1% 7.8% 3.9% 7.7% 13.5% 2.5% 1.05 2.6% 11.22 8,460 38 25 0.75 EMIFSchwab Emerging Markets Equity ETF™ 17.2 13.2% 5.3% 2.6% -0.2% 14.8% 7.4% 1.13 3.0% 13.30 30,809 1328 6,516 0.13 SCHEWisdomTree Emerging Mkts Qual Div Gr ETF 14.4 11.4% 3.4% 2.0% -2.1% 14.5% 4.8% 1.08 2.7% 11.45 13,509 277 71 0.32 DGRESchwab Fundamental Emerg Mkts Lg Co ETF 14.2 11.8% 4.8% 1.9% 1.6% 10.8% 8.0% 1.14 3.4% 8.89 32,522 290 2,834 0.39 FNDEInvesco BRIC ETF 14.1 15.5% 5.8% 1.4% -0.3% 13.1% 9.1% 1.27 2.7% 11.64 53,844 111 104 0.64 EEBiShares MSCI BRIC ETF 13.8 13.6% 4.7% 1.6% -2.3% 14.6% 9.5% 1.29 2.1% 12.52 48,273 502 176 0.67 BKFVanguard FTSE Emerging Markets ETF 13.5 12.2% 4.0% 1.5% -1.7% 13.7% 6.2% 1.12 2.7% 13.19 19,915 4214 88,643 0.12 VWOWisdomTree Emerging Markets High Div ETF 13.3 11.5% 4.0% 1.3% 0.3% 11.6% 8.8% 1.05 4.7% 7.92 14,847 508 2,257 0.63 DEMWisdomTree Emerging Markets SmCp Div ETF 13.2 12.2% 2.7% -0.3% -1.9% 15.4% 7.3% 1.14 4.0% 9.32 1,298 798 1,729 0.63 DGSSPDR® S&P Emerging Markets Small Cap ETF 12.1 10.0% 2.7% 0.2% 0.1% 11.9% 4.2% 1.01 2.9% 12.00 913 1925 536 0.65 EWXSPDR® MSCI Emerging Mkts StratcFacts ETF 11.7 9.8% 3.1% 2.1% -1.5% 11.1% 5.7% 1.00 2.9% 12.67 22,553 1067 203 0.30 QEMMXtrackers MSCI Em Mkts Hdg Eq ETF 11.6 9.5% 3.7% 3.0% -1.8% 10.4% 6.6% 0.94 3.4% 12.89 30,190 1254 113 0.65 DBEMColumbia Emerging Markets Consumer ETF 11.4 11.4% 3.4% 2.2% -2.1% 11.4% -1.7% 1.19 0.9% 22.99 30,387 61 249 0.59 ECONiShares Currency Hedged MSCI Em Mkts ETF 11.3 11.2% 3.1% 2.1% -1.9% 11.2% 7.2% 1.01 2.4% 12.92 32,234 1131 194 0.67 HEEMiShares Core MSCI Emerging Markets ETF 11.1 9.6% 4.4% 2.0% -2.2% 11.4% 6.9% 1.16 2.6% 12.87 22,316 2398 57,947 0.14 IEMGiShares MSCI Emerging Markets ETF 10.8 9.8% 4.2% 1.9% -2.3% 11.2% 6.8% 1.18 2.1% 12.92 32,234 1095 27,418 0.67 EEMInvesco BLDRS Emerging Markets 50 ADR 10.7 13.2% 5.0% 3.1% -1.9% 9.4% 6.4% 1.40 1.6% 19.16 96,915 51 231 0.30 ADREFirst Trust Emerging Mrkts AlphaDEX® ETF 9.7 9.5% 2.8% 0.7% 0.3% 8.6% 8.2% 1.26 3.5% 8.53 7,826 162 619 0.80 FEMSPDR® S&P Emerging Markets Dividend ETF 9.0 6.8% 3.0% -1.4% -0.9% 11.4% 7.0% 1.16 4.0% 10.70 11,607 130 435 0.49 EDIV
----------------Performance----------------
MOMYTD
Return1 Mo
Return3 Mo
Return6 Mo
Return12 MoReturn
3 YrAvg
Return
3 YrRelRisk
CurrentYield(%)
P/ERatio
MedianMarketCapital
NumberHoldings
NetAssets
ExpRatio(%)
NasdaqTicker
Performance numbers reflect periods ending 10/31/2019. Funds shown in bold are the recommendations in the November 2019 issue for SMI’s two Basic strategies.Although gathered from reliable sources, data accuracy cannot be guaranteed.
Page 35Fund Performance Rankings | SoundMindInvesting.com

Invesco FTSE RAFI Emerging Markets ETF 8.9 9.0% 4.2% 1.8% -1.0% 8.1% 7.0% 1.20 3.4% 9.28 34,259 381 1,372 0.50 PXHiShares Edge MSCI Min Vol Emerg Mkts ETF 8.4 5.6% 2.2% 1.0% -1.5% 9.0% 6.0% 0.83 2.5% 14.84 16,116 361 5,660 0.25 EEMViShares MSCI Emerging Markets Sm-Cp ETF 7.0 5.0% 3.4% 0.9% -2.7% 8.8% 2.7% 1.08 2.6% 12.59 1,095 1304 207 0.67 EEMSInvesco Frontier Markets ETF 6.4 13.5% 1.4% -4.8% 0.7% 10.5% 9.0% 1.07 1.7% 8.76 4,161 64 59 0.70 FRNiShares MSCI Frontier 100 ETF 6.3 11.1% 0.5% -4.7% 2.5% 8.6% 7.6% 0.97 3.9% 10.54 4,358 120 491 0.81 FMFlexShares Mstar EmgMkts FctTilt ETF 3.3 6.4% 3.3% 0.6% -5.3% 8.1% 4.1% 1.13 2.9% 9.66 8,889 2245 425 0.59 TLTEiShares Emerging Markets Dividend ETF 3.1 7.3% 2.1% -2.9% -2.0% 7.9% 7.4% 1.03 6.2% 8.06 3,974 117 653 0.49 DVYEInvesco S&P Emerging Markets Low Vol ETF 2.6 4.3% 1.7% -0.6% -2.3% 5.5% 5.4% 0.92 4.8% 11.76 9,928 217 343 0.29 EELVGlobal X Next Emerging & Frontier ETF -1.1 3.8% 0.5% -4.2% -2.0% 5.0% 2.8% 1.08 4.9% 14.41 9,982 215 18 0.55 EMFM
----------------Performance----------------
MOMYTD
Return1 Mo
Return3 Mo
Return6 Mo
Return12 MoReturn
3 YrAvg
Return
3 YrRelRisk
CurrentYield(%)
P/ERatio
MedianMarketCapital
NumberHoldings
NetAssets
ExpRatio(%)
NasdaqTicker
Performance numbers reflect periods ending 10/31/2019. Funds shown in bold are the recommendations in the November 2019 issue for SMI’s two Basic strategies.Although gathered from reliable sources, data accuracy cannot be guaranteed.
Page 36Fund Performance Rankings | SoundMindInvesting.com
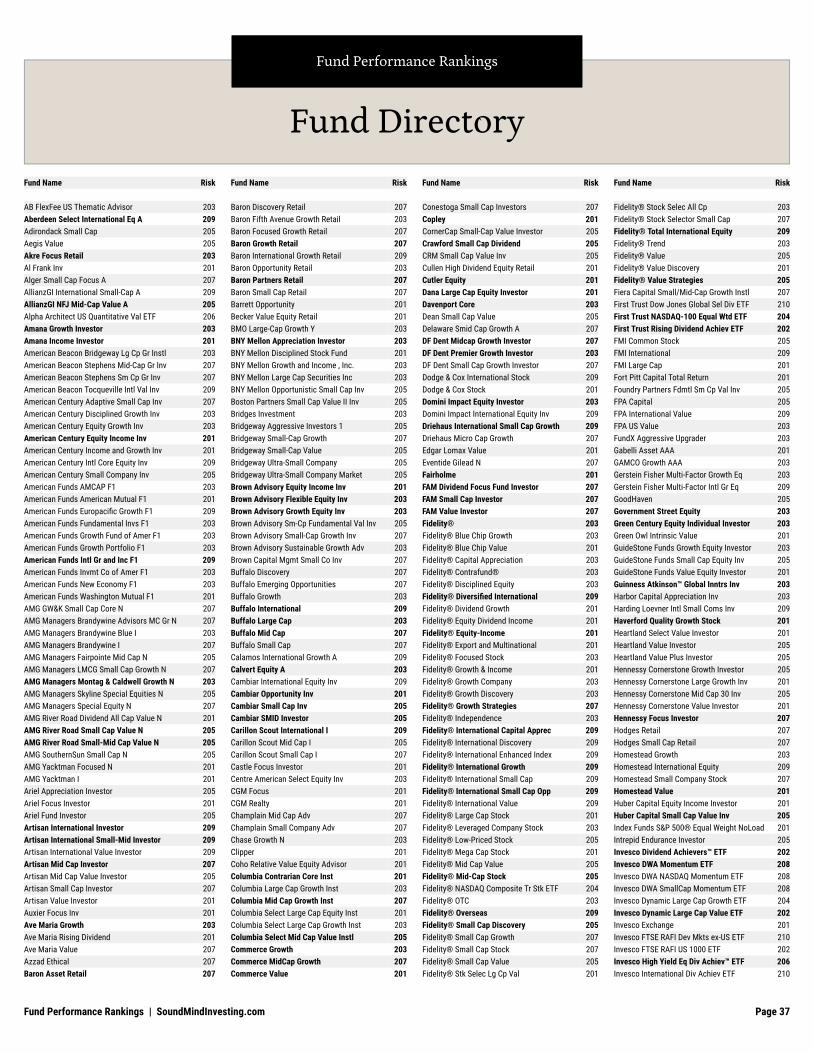
Fund Name Risk
AB FlexFee US Thematic Advisor 203Aberdeen Select International Eq A 209Adirondack Small Cap 205Aegis Value 205Akre Focus Retail 203Al Frank Inv 201Alger Small Cap Focus A 207AllianzGI International Small-Cap A 209AllianzGI NFJ Mid-Cap Value A 205Alpha Architect US Quantitative Val ETF 206Amana Growth Investor 203Amana Income Investor 201American Beacon Bridgeway Lg Cp Gr Instl 203American Beacon Stephens Mid-Cap Gr Inv 207American Beacon Stephens Sm Cp Gr Inv 207American Beacon Tocqueville Intl Val Inv 209American Century Adaptive Small Cap Inv 207American Century Disciplined Growth Inv 203American Century Equity Growth Inv 203American Century Equity Income Inv 201American Century Income and Growth Inv 201American Century Intl Core Equity Inv 209American Century Small Company Inv 205American Funds AMCAP F1 203American Funds American Mutual F1 201American Funds Europacific Growth F1 209American Funds Fundamental Invs F1 203American Funds Growth Fund of Amer F1 203American Funds Growth Portfolio F1 203American Funds Intl Gr and Inc F1 209American Funds Invmt Co of Amer F1 203American Funds New Economy F1 203American Funds Washington Mutual F1 201AMG GW&K Small Cap Core N 207AMG Managers Brandywine Advisors MC Gr N 207AMG Managers Brandywine Blue I 203AMG Managers Brandywine I 207AMG Managers Fairpointe Mid Cap N 205AMG Managers LMCG Small Cap Growth N 207AMG Managers Montag & Caldwell Growth N 203AMG Managers Skyline Special Equities N 205AMG Managers Special Equity N 207AMG River Road Dividend All Cap Value N 201AMG River Road Small Cap Value N 205AMG River Road Small-Mid Cap Value N 205AMG SouthernSun Small Cap N 205AMG Yacktman Focused N 201AMG Yacktman I 201Ariel Appreciation Investor 205Ariel Focus Investor 201Ariel Fund Investor 205Artisan International Investor 209Artisan International Small-Mid Investor 209Artisan International Value Investor 209Artisan Mid Cap Investor 207Artisan Mid Cap Value Investor 205Artisan Small Cap Investor 207Artisan Value Investor 201Auxier Focus Inv 201Ave Maria Growth 203Ave Maria Rising Dividend 201Ave Maria Value 207Azzad Ethical 207Baron Asset Retail 207
Fund Name Risk
Baron Discovery Retail 207Baron Fifth Avenue Growth Retail 203Baron Focused Growth Retail 207Baron Growth Retail 207Baron International Growth Retail 209Baron Opportunity Retail 203Baron Partners Retail 207Baron Small Cap Retail 207Barrett Opportunity 201Becker Value Equity Retail 201BMO Large-Cap Growth Y 203BNY Mellon Appreciation Investor 203BNY Mellon Disciplined Stock Fund 201BNY Mellon Growth and Income , Inc. 203BNY Mellon Large Cap Securities Inc 203BNY Mellon Opportunistic Small Cap Inv 205Boston Partners Small Cap Value II Inv 205Bridges Investment 203Bridgeway Aggressive Investors 1 205Bridgeway Small-Cap Growth 207Bridgeway Small-Cap Value 205Bridgeway Ultra-Small Company 205Bridgeway Ultra-Small Company Market 205Brown Advisory Equity Income Inv 201Brown Advisory Flexible Equity Inv 203Brown Advisory Growth Equity Inv 203Brown Advisory Sm-Cp Fundamental Val Inv 205Brown Advisory Small-Cap Growth Inv 207Brown Advisory Sustainable Growth Adv 203Brown Capital Mgmt Small Co Inv 207Buffalo Discovery 207Buffalo Emerging Opportunities 207Buffalo Growth 203Buffalo International 209Buffalo Large Cap 203Buffalo Mid Cap 207Buffalo Small Cap 207Calamos International Growth A 209Calvert Equity A 203Cambiar International Equity Inv 209Cambiar Opportunity Inv 201Cambiar Small Cap Inv 205Cambiar SMID Investor 205Carillon Scout International I 209Carillon Scout Mid Cap I 205Carillon Scout Small Cap I 207Castle Focus Investor 201Centre American Select Equity Inv 203CGM Focus 201CGM Realty 201Champlain Mid Cap Adv 207Champlain Small Company Adv 207Chase Growth N 203Clipper 201Coho Relative Value Equity Advisor 201Columbia Contrarian Core Inst 201Columbia Large Cap Growth Inst 203Columbia Mid Cap Growth Inst 207Columbia Select Large Cap Equity Inst 201Columbia Select Large Cap Growth Inst 203Columbia Select Mid Cap Value Instl 205Commerce Growth 203Commerce MidCap Growth 207Commerce Value 201
Fund Name Risk
Conestoga Small Cap Investors 207Copley 201CornerCap Small-Cap Value Investor 205Crawford Small Cap Dividend 205CRM Small Cap Value Inv 205Cullen High Dividend Equity Retail 201Cutler Equity 201Dana Large Cap Equity Investor 201Davenport Core 203Dean Small Cap Value 205Delaware Smid Cap Growth A 207DF Dent Midcap Growth Investor 207DF Dent Premier Growth Investor 203DF Dent Small Cap Growth Investor 207Dodge & Cox International Stock 209Dodge & Cox Stock 201Domini Impact Equity Investor 203Domini Impact International Equity Inv 209Driehaus International Small Cap Growth 209Driehaus Micro Cap Growth 207Edgar Lomax Value 201Eventide Gilead N 207Fairholme 201FAM Dividend Focus Fund Investor 207FAM Small Cap Investor 207FAM Value Investor 207Fidelity® 203Fidelity® Blue Chip Growth 203Fidelity® Blue Chip Value 201Fidelity® Capital Appreciation 203Fidelity® Contrafund® 203Fidelity® Disciplined Equity 203Fidelity® Diversified International 209Fidelity® Dividend Growth 201Fidelity® Equity Dividend Income 201Fidelity® Equity-Income 201Fidelity® Export and Multinational 201Fidelity® Focused Stock 203Fidelity® Growth & Income 201Fidelity® Growth Company 203Fidelity® Growth Discovery 203Fidelity® Growth Strategies 207Fidelity® Independence 203Fidelity® International Capital Apprec 209Fidelity® International Discovery 209Fidelity® International Enhanced Index 209Fidelity® International Growth 209Fidelity® International Small Cap 209Fidelity® International Small Cap Opp 209Fidelity® International Value 209Fidelity® Large Cap Stock 201Fidelity® Leveraged Company Stock 203Fidelity® Low-Priced Stock 205Fidelity® Mega Cap Stock 201Fidelity® Mid Cap Value 205Fidelity® Mid-Cap Stock 205Fidelity® NASDAQ Composite Tr Stk ETF 204Fidelity® OTC 203Fidelity® Overseas 209Fidelity® Small Cap Discovery 205Fidelity® Small Cap Growth 207Fidelity® Small Cap Stock 207Fidelity® Small Cap Value 205Fidelity® Stk Selec Lg Cp Val 201
Fund Name Risk
Fidelity® Stock Selec All Cp 203Fidelity® Stock Selector Small Cap 207Fidelity® Total International Equity 209Fidelity® Trend 203Fidelity® Value 205Fidelity® Value Discovery 201Fidelity® Value Strategies 205Fiera Capital Small/Mid-Cap Growth Instl 207First Trust Dow Jones Global Sel Div ETF 210First Trust NASDAQ-100 Equal Wtd ETF 204First Trust Rising Dividend Achiev ETF 202FMI Common Stock 205FMI International 209FMI Large Cap 201Fort Pitt Capital Total Return 201Foundry Partners Fdmtl Sm Cp Val Inv 205FPA Capital 205FPA International Value 209FPA US Value 203FundX Aggressive Upgrader 203Gabelli Asset AAA 201GAMCO Growth AAA 203Gerstein Fisher Multi-Factor Growth Eq 203Gerstein Fisher Multi-Factor Intl Gr Eq 209GoodHaven 205Government Street Equity 203Green Century Equity Individual Investor 203Green Owl Intrinsic Value 201GuideStone Funds Growth Equity Investor 203GuideStone Funds Small Cap Equity Inv 205GuideStone Funds Value Equity Investor 201Guinness Atkinson™ Global Inntrs Inv 203Harbor Capital Appreciation Inv 203Harding Loevner Intl Small Coms Inv 209Haverford Quality Growth Stock 201Heartland Select Value Investor 201Heartland Value Investor 205Heartland Value Plus Investor 205Hennessy Cornerstone Growth Investor 205Hennessy Cornerstone Large Growth Inv 201Hennessy Cornerstone Mid Cap 30 Inv 205Hennessy Cornerstone Value Investor 201Hennessy Focus Investor 207Hodges Retail 207Hodges Small Cap Retail 207Homestead Growth 203Homestead International Equity 209Homestead Small Company Stock 207Homestead Value 201Huber Capital Equity Income Investor 201Huber Capital Small Cap Value Inv 205Index Funds S&P 500® Equal Weight NoLoad 201Intrepid Endurance Investor 205Invesco Dividend Achievers™ ETF 202Invesco DWA Momentum ETF 208Invesco DWA NASDAQ Momentum ETF 208Invesco DWA SmallCap Momentum ETF 208Invesco Dynamic Large Cap Growth ETF 204Invesco Dynamic Large Cap Value ETF 202Invesco Exchange 201Invesco FTSE RAFI Dev Mkts ex-US ETF 210Invesco FTSE RAFI US 1000 ETF 202Invesco High Yield Eq Div Achiev™ ETF 206Invesco International Div Achiev ETF 210
Fund Directory
Fund Performance Rankings
Page 37Fund Performance Rankings | SoundMindInvesting.com

Fund Name Risk
Invesco Intl Core Equity Investor 209Invesco QQQ Trust 204Invesco S&P 500 GARP ETF 204Invesco S&P 500® Equal Weight ETF 202Invesco S&P 500® High Div Low Vol ETF 202Invesco S&P 500® Low Volatility ETF 202Invesco S&P 500® Pure Growth ETF 204Invesco S&P 500® Top 50 ETF 204Invesco S&P MidCap 400® Pure Growth ETF 208Invesco S&P MidCap Low Volatility ETF 206Invesco S&P MidCap Value with Momt ETF 206Invesco S&P SmallCap 600® Pure Gr ETF 208Invesco S&P Ultra Dividend Revenue ETF 202iShares Core High Dividend ETF 202iShares Core MSCI EAFE ETF 210iShares Core MSCI Total Intl Stk ETF 210iShares Core S&P 500 ETF 202iShares Core S&P Mid-Cap ETF 206iShares Core S&P Small-Cap ETF 206iShares Core S&P Total US Stock Mkt ETF 202iShares Currency Hedged MSCI EAFE ETF 210iShares Edge MSCI Min Vol EAFE ETF 210iShares Edge MSCI Min Vol USA ETF 202iShares Edge MSCI USA Momentum Fctr ETF 204iShares Edge MSCI USA Quality Factor ETF 204iShares International Select Div ETF 210iShares Micro-Cap ETF 206iShares Morningstar Large-Cap Growth ETF 204iShares Morningstar Mid-Cap Growth ETF 208iShares Morningstar Mid-Cap Value ETF 206iShares Morningstar Small-Cap Growth ETF 208iShares Morningstar Small-Cap Value ETF 206iShares MSCI ACWI ex US ETF 210iShares MSCI EAFE ETF 210iShares MSCI EAFE Growth ETF 210iShares MSCI EAFE Value ETF 210iShares MSCI KLD 400 Social ETF 204iShares Russell 1000 ETF 202iShares Russell 1000 Growth ETF 204iShares Russell 1000 Value ETF 202iShares Russell 2000 ETF 206iShares Russell 2000 Growth ETF 208iShares Russell 2000 Value ETF 206iShares Russell 3000 ETF 202iShares Russell Mid-Cap ETF 206iShares Russell Mid-Cap Growth ETF 208iShares Russell Mid-Cap Value ETF 206iShares Russell Top 200 Growth ETF 204iShares S&P 500 Growth ETF 204iShares S&P 500 Value ETF 202iShares S&P Mid-Cap 400 Growth ETF 208iShares S&P Mid-Cap 400 Value ETF 206iShares S&P Small-Cap 600 Growth ETF 208iShares S&P Small-Cap 600 Value ETF 206iShares Select Dividend ETF 202James Small Cap 205Janus Henderson Contrarian T 207Janus Henderson Enterprise T 207Janus Henderson Forty S 203Janus Henderson Growth And Income T 201Janus Henderson Overseas T 209Janus Henderson Research T 203Janus Henderson Triton T 207Janus Henderson Venture T 207
Fund Name Risk
Jensen Quality Growth J 203JPMorgan Large Cap Value A 201Kinetics Internet No Load 203Kinetics Market Opportunities No Load 207Kinetics Paradigm No Load 207Kinetics Small Cap Opportunities No Load 207Kirr Marbach Partners Value 205Laudus US Large Cap Growth 203Lazard Global Listed Infrastructure Open 209Lazard US Equity Concentrated Open 203Longleaf Partners 201Longleaf Partners International 209Longleaf Partners Small-Cap 205Madison Small Cap Y 207Mairs & Power Growth Inv 201Mairs & Power Small Cap 205Manning & Napier Equity Series S 203Manning & Napier International S 209Marathon Value Portfolio 201Marsico 21st Century 207Marsico Focus 203Marsico Growth 203Marsico International Opportunities 209Matrix Advisors Value 201Matthew 25 201Meeder Quantex Retail 205Meehan Focus 201Meridian Contrarian Legacy 205Meridian Enhanced Equity Legacy 203Meridian Growth Legacy 207MFAM Mid Cap Growth Inv 207Miller Opportunity A 205Monetta 203Monetta Core Growth 203Monteagle Opportunity Equity Inv 205Morgan Stanley Insight A 203Morgan Stanley Inst International Opp A 209Muhlenkamp 201Multi-Manager Growth Strategies A 203Multi-Manager Small Cap Eq Strat A 207Multi-Manager Value Strategies A 201Needham Growth Retail 207Neuberger Berman Intrinsic Value A 205Neuberger Berman Small Cap Growth A 207New Covenant Growth 201Nicholas 203Nicholas Equity Income I 201North Country Equity Growth 203Northern Active M International Equity 209Northern International Equity 209Northern Large Cap Value 201Northern Small Cap Core 205Northern Small Cap Value 205Oakmark International Investor 209Oakmark International Small Cap Investor 209Oakmark Investor 201Oakmark Select Investor 201Oberweis International Opportunities 209Oberweis Micro-Cap 207Osterweis 203Paradigm Value 205Parnassus 203Parnassus Core Equity Investor 203Parnassus Endeavor Investor 201
Fund Name Risk
Parnassus Mid-Cap 207Pax ESG Beta Quality Individual Investor 201Pax Small Cap Individual Investor 205Payson Total Return 203Pear Tree Polaris Fgn Val Sm Cap Ord 209Pear Tree Polaris Foreign Value Ord 209Pear Tree Polaris Small Cap Ord 205Pear Tree Quality Ordinary 203Perritt MicroCap Opportunities Investor 205Perritt Ultra MicroCap 205Pin Oak Equity 201Pinnacle Value 205Polen Growth Investor 203PRIMECAP Odyssey Aggressive Growth 207PRIMECAP Odyssey Growth 203PRIMECAP Odyssey Stock 201ProShares S&P 500 Dividend Aristocrats 202Prospector Opportunity 205Provident Trust Strategy 203Quantified Market Leaders Investor 207Queens Road Small Cap Value 205Reinhart Mid Cap PMV Adv 205Reynolds Blue Chip Growth 203RiverPark Large Growth Retail 203Royce Dividend Value Svc 205Royce Opportunity Svc 205Royce Small-Cap Value Service 205Royce Smaller-Companies Growth Svc 207Scharf Institutional 201Schwab Core Equity 201Schwab Dividend Equity 201Schwab Fundamental Intl Lg Co ETF 210Schwab Fundamental Intl Sm Co ETF 210Schwab Fundamental US Broad Market ETF 202Schwab Fundamental US Large Company ETF 202Schwab Fundamental US Small Company ETF 206Schwab International Equity ETF™ 210Schwab International Small-Cap Eq ETF™ 210Schwab Large-Cap Growth 203Schwab Small-Cap Equity 205Schwab US Broad Market ETF™ 202Schwab US Dividend Equity ETF™ 202Schwab US Large-Cap ETF™ 202Schwab US Large-Cap Growth ETF™ 204Schwab US Large-Cap Value ETF™ 202Schwab US Mid-Cap ETF™ 206Schwab US Small-Cap ETF™ 206Schwab® International Core Equity 209Segall Bryant & Hamill Fdml Int'lSmCpRet 209Segall Bryant & Hamill MidCp ValDiv Ret 205Segall Bryant & Hamill Sm Cp Val Div Ret 205Selected American Shares D 201Selected International D 209Selected International S 209Sequoia 203Seven Canyons Strategic Income Investor 205Sextant Growth 203Sextant International 209Shelton Core Value Direct 201Sit Large Cap Growth 203Sit Mid Cap Growth 207Sit Small Cap Growth 207Smead Value Investor 201Sound Shore Investor 201
Fund Name Risk
SPDR® Dow Jones Industrial Average ETF 202SPDR® MSCI ACWI ex-US ETF 210SPDR® Portfolio S&P 500 Growth ETF 204SPDR® S&P 400 Mid Cap Growth ETF 208SPDR® S&P 400 Mid Cap Value ETF 206SPDR® S&P 500 ETF 202SPDR® S&P 600 Small Cap ETF 206SPDR® S&P 600 Small Cap Growth ETF 208SPDR® S&P 600 Small Cap Value ETF 206SPDR® S&P Dividend ETF 202SPDR® S&P International Dividend ETF 210SPDR® S&P International Small Cap ETF 210SPDR® S&P MidCap 400 ETF 206SPDR® SSGA US Large Cap Low Volatil ETF 202State Farm Growth 201State Street International Stock Sel N 209Sterling Capital Stratton MdCp Val Instl 205Sterling Capital Stratton SmCp Val Instl 205T. Rowe Price Blue Chip Growth 203T. Rowe Price Diversified Mid Cap Gr 207T. Rowe Price Dividend Growth 201T. Rowe Price Equity Income 201T. Rowe Price Growth & Income 203T. Rowe Price Growth Stock 203T. Rowe Price International Discovery 209T. Rowe Price International Stock 209T. Rowe Price International Value Eq 209T. Rowe Price Mid-Cap Growth 207T. Rowe Price Mid-Cap Value 205T. Rowe Price New America Growth 203T. Rowe Price New Horizons 207T. Rowe Price Overseas Stock 209T. Rowe Price QM US Small-Cap Gr Eq 207T. Rowe Price Small-Cap Stock 207T. Rowe Price Small-Cap Value 205T. Rowe Price Spectrum Growth 203T. Rowe Price Tax-Efficient Equity 203T. Rowe Price U.S. Equity Research 203T. Rowe Price US Large-Cap Core 203T. Rowe Price Value 201TCW Relative Value Dividend Apprec N 201TCW Relative Value Large Cap N 201TCW Select Equities N 203TETON Westwood Equity AAA 201TETON Westwood Mighty Mites AAA 205The Investment House Growth 203Thomas White International Investor 209Thompson LargeCap 201Thrift Savings Plan C Fund 201Thrift Savings Plan I Fund 209Thrift Savings Plan S Fund 207Tocqueville 201Tocqueville Opportunity 207Tocqueville Select 205Torray 201Touchstone Mid Cap Z 205Touchstone Sands Capital Select Growth Z 203Towle Deep Value 205Tweedy, Browne Global Value 209Tweedy, Browne Global Value II Ccy Unhdg 209USA Mutuals Vice Investor 201USAA Aggressive Growth 203USAA Growth 203USAA Growth & Income 203
Fund Directory
Fund Performance Rankings
Page 38Fund Performance Rankings | SoundMindInvesting.com

Fund Name Risk
USAA Income Stock 201USAA International 209USAA Small Cap Stock 205USAA Value 201Value Line Larger Companies Focused Inv 203Value Line Mid Cap Focused 207Value Line Premier Growth 207Value Line Small Cap Opportunities Inv 207Vanguard 500 Index Admiral 201Vanguard Capital Opportunity Inv 203Vanguard Capital Value Inv 201Vanguard Diversified Equity Inv 203Vanguard Dividend Appreciation ETF 202Vanguard Dividend Growth Inv 201Vanguard Equity-Income Inv 201Vanguard Explorer Inv 207Vanguard Explorer Value Inv 205Vanguard Extended Market ETF 208Vanguard Extended Market Index Admiral 207Vanguard FTSE All-Wld ex-US ETF 210Vanguard FTSE All-Wld ex-US SmCp ETF 210Vanguard FTSE Developed Markets ETF 210Vanguard Growth & Income Inv 201Vanguard Growth ETF 204Vanguard International Explorer Inv 209
Fund Name Risk
Vanguard International Growth Inv 209Vanguard International Value Inv 209Vanguard Large-Cap ETF 202Vanguard Mega Cap ETF 202Vanguard Mega Cap Growth ETF 204Vanguard Mega Cap Value ETF 202Vanguard Mid Cap Growth Inv 207Vanguard Mid-Cap ETF 206Vanguard PRIMECAP Core Inv 201Vanguard PRIMECAP Inv 203Vanguard Russell 1000 ETF 202Vanguard Russell 1000 Growth ETF 204Vanguard Russell 1000 Value ETF 202Vanguard Russell 2000 ETF 206Vanguard Russell 2000 Growth ETF 208Vanguard Russell 2000 Value ETF 206Vanguard Russell 3000 ETF 202Vanguard S&P 500 ETF 202Vanguard S&P 500 Growth ETF 204Vanguard S&P 500 Value ETF 202Vanguard S&P Mid-Cap 400 ETF 206Vanguard S&P Mid-Cap 400 Growth ETF 208Vanguard S&P Mid-Cap 400 Value ETF 206Vanguard S&P Small-Cap 600 ETF 206Vanguard S&P Small-Cap 600 Growth ETF 208
Fund Name Risk
Vanguard S&P Small-Cap 600 Value ETF 206Vanguard Selected Value Inv 205Vanguard Small-Cap ETF 206Vanguard Small-Cap Growth ETF 208Vanguard Small-Cap Value ETF 206Vanguard Strategic Equity Inv 205Vanguard Strategic Small-Cap Equity Inv 205Vanguard Total International Stock ETF 210Vanguard Total Intl Stock Index Admiral 209Vanguard Total Stock Market ETF 202Vanguard US Growth Investor 203Vanguard US Value Inv 201Vanguard Value ETF 202Vanguard Windsor™ II Inv 201Vanguard Windsor™ Inv 201Vaughan Nelson International Sm Cap Adv 209Voya Corporate Leaders Trust B 201Vulcan Value Partners 201Vulcan Value Partners Small Cap 205Walthausen Small Cap Value 205Wasatch Core Growth 207Wasatch International Growth Investor 209Wasatch International Opps Inv 209Wasatch Micro Cap 207Wasatch Micro Cap Value 207
Fund Name Risk
Wasatch Small Cap Growth Investor 207Wasatch Small Cap Value 205Wasatch Ultra Growth 207Weitz Hickory 205Weitz Partners Value Investor 203Weitz Value Investor 203WesMark Growth 203WesMark Small Company Growth 207White Oak Select Growth 201William Blair Small Cap Growth N 207Wilshire Large Company Growth Invmt 203Wilshire Large Company Value Invmt 201WisdomTree International Equity ETF 210WisdomTree International SmallCp Div ETF 210WisdomTree Intl Hdgd Qual Div Gr ETF 210WisdomTree US High Dividend ETF 202WisdomTree US LargeCap Dividend ETF 202WisdomTree US MidCap Dividend ETF 206WisdomTree US MidCap Earnings ETF 206WisdomTree US SmallCap Dividend ETF 206WisdomTree US SmallCap Earnings ETF 206Xtrackers MSCI EAFE Hedged Equity ETF 210YCG Enhanced 203Zacks Small-Cap Core Inv 205
Fund Directory
Fund Performance Rankings
Page 39Fund Performance Rankings | SoundMindInvesting.com