functions of single variables input output - how do you evaluate this function? - how do you find...
TRANSCRIPT

2
( ) xy f x e
functions of single variables
inputoutput
- how do you evaluate this function?- how do you find the domain/range?- how do you plot the function?
MAT17C – LEWIS – 04/02/12

x
2
( ) xy f x e
inputoutput
y
1, 1,o ox y e
output: y = f (1)=e-1~0.3679a point on graph of f (x)
input: xo = 1
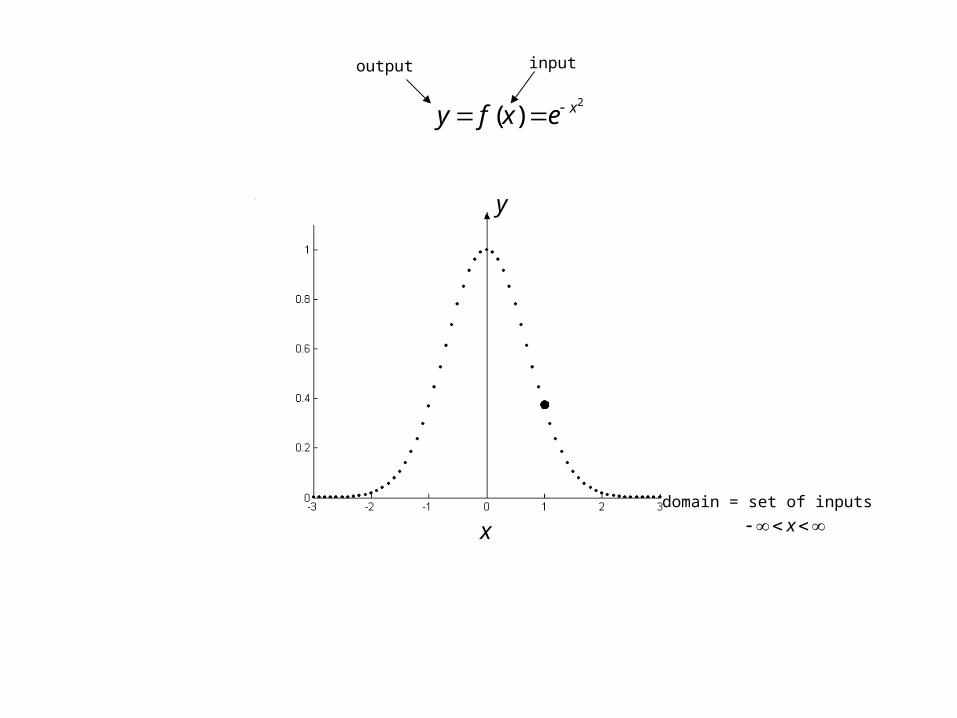
xdomain = set of inputs
2
( ) xy f x e
inputoutput
x
y

xdomain = set of inputs
2
( ) xy f x e
inputoutput
x
y
plot of f (x)
range = set of outputs
10 y

2 2
( , )x y
z f x y e
functions of two variables
- how do you evaluate this function?- how do you find the domain/range?- how do you plot the function?

2 2
( , )x y
z f x y e
x
y
z
input: (xo,yo) = (1,1)
output:
0135.0e)1,1( 2 fz
2, , 1,1,o o ox y z ea point on graph of f (x,y)

2 2
( , )x y
z f x y e
x
y
z
points on graph of f (x,y)

2 2
( , )x y
z f x y e
x
y
z
2, , 1,1,o o ox y z ea point on graph of f (x,y)
surface plot of f (x,y)
range = set of outputs
domain = set of inputs
yx,
10 z


http://nrs.ucdavis.edu/stebbins/maps/map.htm
z=f (x,y)
x
yTopographic maps plot curves of equal altitude. These curvesare also called contour lines or level curves.


2 2
( , )x y
z f x y e
x
y
z
level z=z*=0.5

2 2
( , )x y
z f x y e
level curves/contour lines for z=0.5 : 2 2ln 0.5 x y
.
y
x
222 8325.0 yx

2 2
( , )x y
z f x y e
(xo,yo) = (1,1)
level curves/contour lines for z=z* : * 2 2lnc z x y
.
contour plot of f (x,y)
x
y
0135.0e)1,1( 2 fz
2
22( )
50
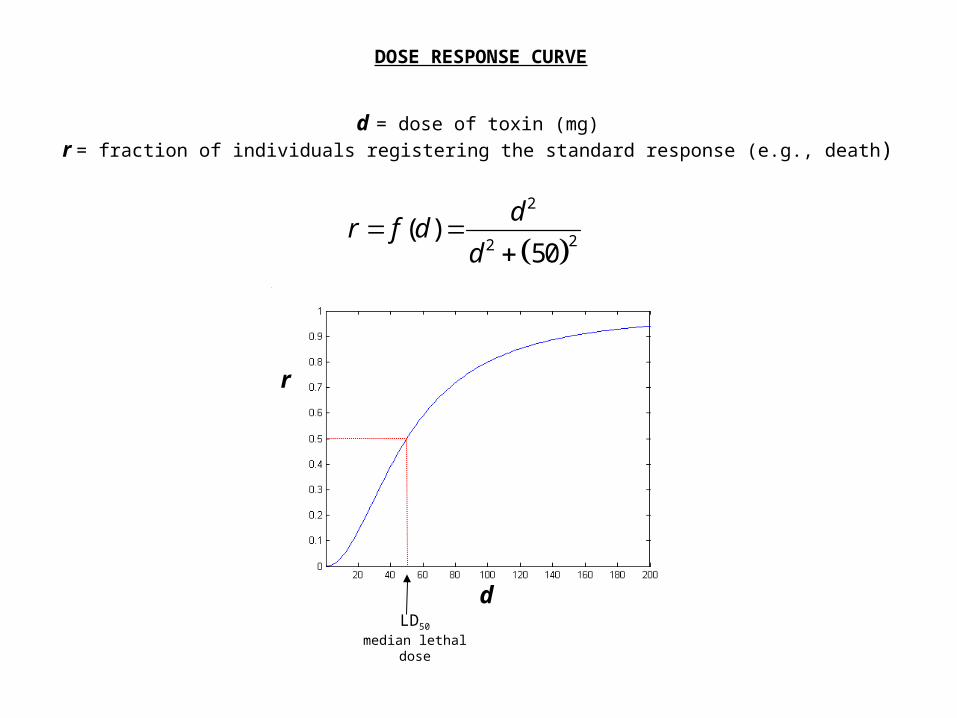
dr f d
d
DOSE RESPONSE CURVE
d = dose of toxin (mg)
r = fraction of individuals registering the standard response (e.g., death)
d
r
LD50
median lethal dose

2
22 23
( , )d
r f d wd w
DOSE RESPONSE CURVE
family of curves
d
r
note: LD50= 2/3 w
w=45
w=50
w=120
w=150
d = dose of toxin (mg)
w = weight of individual (kg)
r = fraction of individuals registering the standard response (e.g., death)

2
22 23
( , )d
r f d wd w
surface plot
DOSE RESPONSE CURVE

2
22 23
( , )d
r f d wd w
DOSE RESPONSE CURVE
contour plot
contour lines for r=r* : dr
rw
*
*1
2
3

0,4
9),(2
2
v
yxyxfv
• What are the level sets (contours) of f(x,y)? Draw the contour plot.
• What is the change in v along contours?
• What are the “shape” of the contours?
• What is the “shape” of f(x,y)?
• What is the shape of the function restricted to y=1?
• What is the shape of the function restricted to ?
• What is the rate of change of v with changes in x at (x=-1,y=1)? What is the rate of change of v with changes in x at (x=-1,y=1)? … what about in other directions?
2xy
v = activity of a neuron (Hz)(x,y) = position of stimulus on hand (or retina)
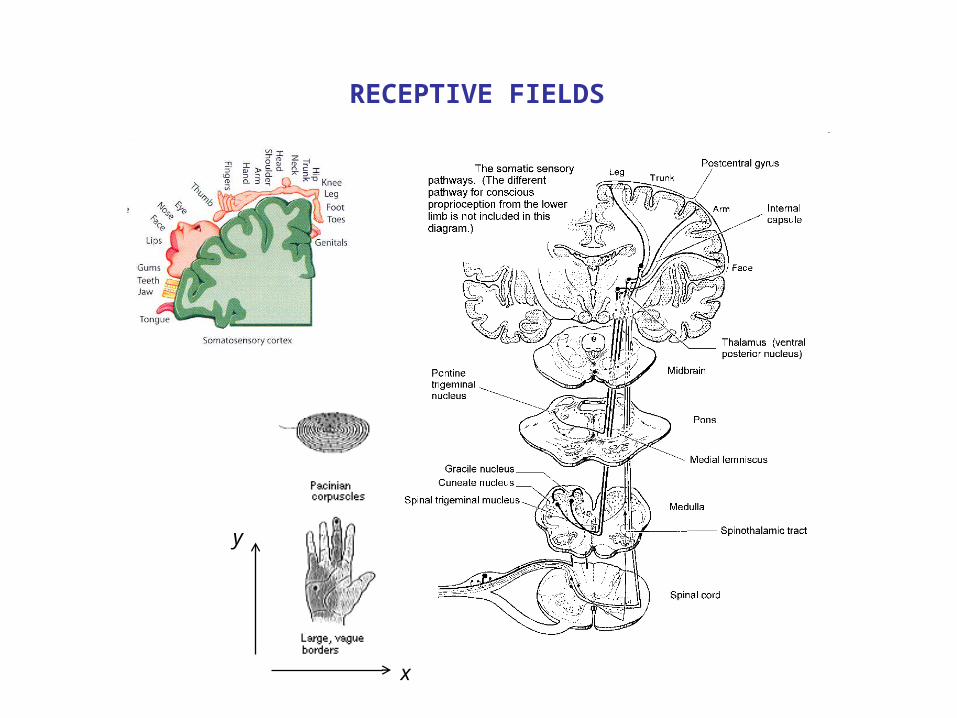
RECEPTIVE FIELDS
x
y

RECEPTIVE FIELDS
(.. or hand)
(.. o
r ha
nd)
x
y
The position of a stimulus is “encoded” in the activity level of a neuron.


49),(
22 y
xyxfv
surface plot contour plot(level sets)
xy
v
x
y

?