functioning of community health centres (chcs)
TRANSCRIPT

PEO Evaluation Studies
Functioning of Community Health Centres (CHCs)
i Preface ii Executive Summary 1 Introduction 2 The Evaluation Study- Objectives and Methodology 3 Coverage and Location of CHCs 4 Infrastructure in CHC – Availability and Adequacy 5 Utilisation of Medical Services 6 Family Welfare and National Health Programmes - Role of CHCs.. 7 The Utility of CHCs- Beneficiaries’ Views iii Appendix Tables iv Project Team
Preface
The Community Health Centre (CHC), the third tier of the network of rural health care institutions, was required to act primarily as a referral centre (for the neighbouring PHCs, usually 4 in number) for the patients requiring specialised health care services. The objective of having a referral centre for the primary health care institutions was two-fold; to make modern health care services accessible to the rural people and to ease the overcrowding in the district hospitals.The CHCs were accordingly designed to be equipped with : four specialists in the areas of medicine, surgery, paediatrics and gynaecology; 30 beds for indoor patients; operation theatre, labour room, X-ray machine, pathological laboratory, standby generator , etc., along with the complementary medical and para medical staff.
At the instance of Planning Commission, the Programme Evaluation Organisation undertook the study to evaluate the functioning of the Community Health Centres (CHCs) and their effectiveness in bringing specialised health care services within the reach of rural people.
Both secondary and primary data were required to be analysed to test the various hypotheses relating to the above mentioned objectives of the study. While the information available in published sources was obtained and used wherever necessary, the major part of the data, required for the study, was generated through a sample survey of 62 PHCs and 31 CHCs spread over the 16 sample districts of eight states selected for the study.
The findings of the Study are as follows:
(a) Given the other relevant factors, the services of a CHC are likely to be used less intensively, if:
(i) its geographical coverage is very large;
(ii) it has inadequate medical staff, particularly the specialists; and
(iii) the mean distance of the PHCs from the CHC is longer.
(b) Some CHCs have been approved without sanctioning all the posts of specialists. Only 30 per cent of the required posts of the specialists were found to be in position. More than 70 per cent of the sample CHCs are running either with one specialist or without any specialist.
(c) There is a mis-match between medical specialists vis-a-vis equipments/facilities/ staff, leading to sub-optimal utilisation of resources. The over- all productivity of the public health services can substantially be improved if this mis-match as well as thin spread of resources is avoided.
(d) Only two out of 31 CHCs were found to have been used as referral centres to some extent. As many as 11 CHCs have not attended any referral case, while the remaining 18 have been used sub-optimally with an average of 206 cases per year. The constraints to utilisation of the services of CHCs relate to inadequacies of infrastructure, medical and paramedical staff, and more importantly, the mis-match of various inputs.
(e) Notwithstanding the existing limitations in the services delivery system, a large majority of the households expressed their strong preference for public health care system as against the private facilities.
The findings tend to suggest that CHCs have not made any significant contributions towards realisation of the intended objectives even after about two decades of their establishment. The study
has been able to identify a set of key factors that has contributed to the poor performance of CHCs. It is hoped that the findings of the study will be useful to the planning/ implementing agencies in introducing the necessary corrective steps for improving the services delivery system.
The study received constant support and encouragement from the Deputy Chairman, Secretary and Chairman (EAC) of Planning Commission. Dr. (Mrs.) Manjula Chakraborty, the then Deputy Adviser (PEO) initiated the study, but it was designed and conducted under the direction of Shri Amar Singh, Deputy Adviser (PEO). The efforts put in by the officers of PEO (Hqrs.) and Regional/Project Evaluation Offices under the guidance of Shri V.K. Bhatia, Joint Adviser (PEO) in completing the study deserve special mention.
The help and cooperation extended by the officers of Union Ministry of Health and Family Welfare as also the Health and Family Welfare Division of Planning Commission at different stages of study is gratefully acknowledged.
(S.P. Pal) Adviser (Evaluation)
New Delhi. Dated : September, 1999
Executive Summary The Scheme
Our health policy envisages a three tier structure comprising the primary, secondary and tertiary health care facilities to bring health care services within the reach of the people. The primary tier is designed to have three types of health care institutions, namely, a Sub-Centre (SC) for a population of 3000-5000, a Primary Health Centre (PHC) for 20000 to 30000 people and a Community Health Centre (CHC) as referral centre for every four PHCs covering a population of 80,000 to 1.2 lakh. The district hospitals were to function as the secondary tier for the rural health care, and as the primary tier for the urban population. The tertiary health care was to be provided by health care institutions in urban areas which are well equipped with sophisticated diagnostic and investigative facilities.
In pursuance of this policy, a vast network of health care institutions has been created, both in rural and urban areas, and substantial resources, though inadequate vis-a-vis requirement, have gone into planning and implementing the health and family welfare programmes. Increased availability and utilisation of health care services have resulted in a general improvement of the health status of our population, as is reflected in the increased life expectancy and marked decline in birth and mortality rates over the last fifty years. However, these achievements are uneven, with marked disparities across states and districts, and between urban and rural people.
These disparities in the health outcome could be attributed to a large extent, to the differential access to health services by different segments of the population. While the demand side factors do play a role in exercising the choice of the modes of delivery of health care services, for the vast majority of our people, the access to health care services is determined primarily by the availability (and the quality of delivery) of public health institutions. This is especially true of the majority of the rural people, for whom alternatives to the public health services hardly exist.
In fact, the Fifth Five Year Plan document noted with concern the disparities in access to health services between urban and rural areas and the tardy implementation of the schemes in the health sector. The primary rural health care services were brought under the Minimum Needs Programme (MNP) during the Fifth Plan (1974-79). It was decided to integrate and strengthen the rural health care institutions through suitable organic and functional linkages between the different tiers of the primary health care system.
In this framework, the Community Health Centre (CHC), the third tier of the network of rural health care units, was required to act primarily as a referral centre (for the neighbouring PHCs, usually 4 in number) for the patients requiring specialised treatment in the areas of medicine, surgery, paediatrics and gynaecology. The objective was two-fold; to make modern health care services accessible to the rural people and to ease the overcrowding of the district hospitals. To enable the CHCs to contribute towards meeting the intended objectives, these were designed to be equipped with: four specialists in the areas of medicine, surgery, paediatrics and gynaecology; 30 beds for indoor patients; operation theatre, labour room, X-ray machine, pathological laboratory, standby generator etc. along with the complementary medical and para medical staff.
Evaluation Study
At the instance of Planning Commission, the Programme Evaluation Organisation undertook the study to evaluate the functioning of the Community Health Centres (CHCs) and their effectiveness in bringing specialised health care within the reach of rural people.
The study was also required to address some specific issues as identified by the Health Division of Planning Commission in consultation with the Department of Health and Family Welfare. These, inter alia, include: assessment of (a) appropriateness of the existing population norms and location of CHCs in the context of improving accessibility to the rural people, (b) the availability and adequacy of medical, para-medical and supportive staff in CHCs, (c) availability and functionality of health care infrastructure, including investigative facilities and medicines (d) utilisation of CHCs and identification of constraints to utilisation and (e) the role of CHCs in Family Welfare and National Health Programme. The study was also designed to identify the factors that could contribute to smooth functioning of CHCs as referral centres.
Methodology
Both secondary and primary data had to be analysed to test the various hypotheses relating to the above mentioned objectives of the study. While the information available in published sources was obtained and used wherever necessary, the major part of the data required for the study was generated through a sample survey. Thus, some state and some district level statistics on health care infrastructure and health indicators were obtained from published documents, but the health care institution (CHC/PHC) specific information and household level data had to be generated through collection of micro level information by the field units of PEO.
A multi-stage sample design was adopted for the study. The sample units at different stages are: States, Districts, CHCs, PHCs, Patients and Non-patients. The first stage sample units are the eight states selected purposively to represent ‘good and ‘poor’ health status of the population. The infant mortality rate was used as a stratifying parameter. Four States viz; Madhya Pradesh, Uttar Pradesh, Rajasthan and Orissa having IMR higher than the national average and another four viz; Tamil Nadu, Maharasthra, Bihar and Haryana with IMR less than or equal to national average were chosen for the study. Two districts -one with low and the other with high IMR, were selected from each state at the second stage of sampling. In the third stage, two CHCs -one near and the other away from the district hospital(s) were selected for each selected district. Two PHCs under the coverage of a CHC and eight patients (four indoor and four outdoor) were selected in the fourth stage of sampling. Finally, three villages- one near a PHC/ CHC and two located beyond a distance of 10 km. were selected from among the villages covered by the selected CHCs/ PHCs for selection of five non-patient households from each such village.
Following the above sample design, 224 patients, 155 non-patients households, 62 PHCs and 31 CHCs spread over the 16 sample districts of eight states were selected for the study. In each selected village the views of knowledgeable persons were also taken for preparation of qualitative notes regarding the functioning of health care institutions.
Population Coverage & Location of CHCs
At the all India level, a sub-centre covered 4737 people, a PHC 28768 and a CHC covered 2.6 lakh people in 1996. Thus, on an average, the population coverage of sub-centres and PHCs is well within the norms prescribed, though there do exist variations across states and districts. In the case of CHCs, however, the population coverage is more than twice the upper limit (1.2 lakh) prescribed in the norm. On an average, there are 9 PHCs for every CHC at the all- India level.
In the eight states under study, the population coverage of a CHC varied from a minimum of 1.3 lakh people in Rajasthan to a maximum of 5.1 lakh in Bihar. Similarly, the average number of PHCs covered by a CHC ranges between 6 in Maharashtra and about 20 in Tamil Nadu. The range between the minimum and maximum population coverage becomes even larger in the case of the districts selected for the study. The coverage varied between 27,000 in Jaisalmer (Rajasthan) and 10.4 lakh in Siwan (Bihar). Similarly, the number of PHCs per CHC in the sample districts varied

between a low of 4 PHCs in Katihar (Bihar) to a high of 30 in Tirunelveli (Tamil Nadu). In the case of Hardoi (Uttar Pradesh) the number is as high as 70 PHCs for one CHC.
Obviously, the requisite number of CHCs as per norms have not yet been established. Perhaps, it is also not possible to meet the demand for CHCs in near future, as the supply gap is quite large and resources are limited. Since resources are scarce, a set of criteria must be evolved for their optimal use. This issue of optimal use of resources has assumed added importance in view of the observation of the Planning Commission (Approach Paper, Ninth Plan) that thin spread of resources over a larger number of schemes without proper financial planning has adversely affected implementation, delivery systems and hence performance in the social sector.
To decide on the criteria for optimal use of resources, it is necessary to have knowledge of the factors that influence the utilization of services of CHCs. An attempt is made in this report to identify such factors through analysis of grassroots level information. These factors in the case of a CHC can be grouped into three, viz; location-related, infrastructure-related and those concerned with resource use. Since utilization is influenced by a large number of factors, it is difficult to empirically establish the degree of influence of each factor without using a multivariate analysis.
Accordingly, a multi-variable econometric analysis has been carried out to bring out the role of location- related factors, holding other explanatory factors constant. This analysis clearly brings out that apart from the population norm, the other location-related factors that have a bearing on the utilization rate of the services of CHC are : the geographical area coverage and the distribution of PHCs around a CHC. The econometric analysis also brought out clearly that availability of doctors, particularly the specialists (given other factors) is the most important determinant of utilization of services of the public health care institutions. The issues relating to infrastructure and availability of doctors are dealt with in details in Chapters 4 and 5 of the report.
Health Infrastructure - Availability & Adequacy
As the CHCs are required to deliver specialised health care services, it was decided to equip these institutions with suitable diagnostic and investigative facilities. As noted earlier, in addition to the usual staff and facilities, four medical specialists and other complementary para medical staff and facilities, such as, operation theatre, labour room, pathology laboratory, X-ray machine, refrigerator, generator, etc., were prescribed by the Central Government to enable CHCs to deliver specialised health care services to rural people.
A comparison of the availability of staff and facilities in the 31 sample CHCs with their prescribed norms shows wide gaps for the majority of the CHCs. In fact, most of them are not equipped to deliver the intended specialised health care services. In particular, the following inadequacies were observed (details in Chapter 4):
- some CHCs have been sanctioned without sanctioning all the posts of specialists;
- only 30 per cent of (the required posts) the specialists were found to be in position. More than 70 per cent of the sample CHCs are running either with one specialist (42%) or without any specialist (29%);
- the extent of shortfall in para medical staff is found to be 12 per cent for NMWs, 16 per cent for Dressers and 39 per cent for Radiographers. At the aggregate level, pharmacists and laboratory technicians are found to be in excess of requirement;
- Out of 31 sample CHCs, operation theatres and labour rooms were not available in 5, pathology laboratories in 12, safe drinking water in 9, ECG machines in 23, X-ray machines in 12 and generators in 23 CHCs;
- what is more striking is the mis-match between the medical specialists and equipments/ facilities/ staff of CHCs. For example, only 6 sample CHCs had Surgeons with the essential complementary facilities comprising X-ray machines with Radiographers, pathology laboratories with lab-technicians and operation theatres, while 8 CHCs had Surgeons, 26 had operation theatres, 19 pathology laboratories, 26 CHCs had 42 lab-technicians, 19 CHCs had 20 X-ray machines, 18 CHCs had 19 Radiographers etc. Similar mis-match is also noticed in the case of other specialists (see Text, Chapter 4).
All this tends to suggest that not only there is an acute shortage of medical specialists, but there is also a mis-match of facilities and specialists in a majority of CHCs, implying sub-optimal utilization and thin spread of available resources.
Utilization of Services
Among the sample CHCs only two - one CHC each in Orissa (with 1907 cases) and Tamil Nadu (1084) during 1995-96 were found to have been used as referral centres to some extent. Eleven (11) CHCs have not attended to any referral cases, while the remaining 18 have been used sub-optimally with an average of 206 cases per year.
An attempt has been made in the study to identify the factors that explain the variation in the utilization of services across sample CHCs. Given the location and the coverage of area and population, the utilization rate depends on the ability of CHCs to deliver the complete package of services for specialised treatment. Variations in the availability of specialists, para-medical staff, facilities for medical investigation, physical infrastructure and the complementarity among these inputs are found to be responsible for differential utilization rates across CHCs.
The above findings , however, should not lead one to conclude that the services of CHCs were not used at all. In fact, all the sample CHCs were found functioning more like PHCs and attended to a large number of routine/direct cases.
Beneficiaries’ Views
An analysis of the views of the beneficiaries of the rural primary health care institutions revealed that about 57 per cent of them were either dissatisfied or partially satisfied with the quality of services delivered through sample CHCs. The reasons for dissatisfaction stem from the inadequacies of the delivery system (already noted). Some of the major reasons for dissatisfaction are: non-availability of doctors, indifferent and non-sympathetic attitudes of doctors and para medical staff and non-availability of prescribed medicines.
Of about 62 per cent of the total number of selected beneficiaries of sample CHCs, 76.8 per cent of the indoor patients and 54.8 per cent of the outdoor patients had spent money on getting treatment from CHCs. About 80 per cent of the expenditure of both indoor and outdoor patients was on medicines. Twenty eight (28) per cent of the indoor and 6 per cent of the outdoor patients had to spend more than Rs. 500 on each illness episode.
It is interesting to note, however, that a large majority of the beneficiaries did not think that such expenses were a major constraint to the utilisation of the services intended to be delivered through these CHCs. On the contrary, most of them (91%) expressed their preference for the public health institutions vis-à-vis other alternatives.
Suggestions :
The evaluation study clearly brings out the fact that CHCs have not been able to render specialised

health care services for which these were established. The constraints to utilisation of their services as identified are the inadequacies in infrastructure, non-availability of medical specialists and para medical staff and non-functional complementary facilities. Notwithstanding these constraints and sub-optimal utilisation , the majority of the beneficiaries expressed their preference for the services of public health care institutions to those of other alternatives. For improvement in access to public health care services, the following measures can be suggested:
1. As only 43% of the required number of CHCs have been established (by June 1996), a significant increase in the allocation of plan resources for the health sector is needed to close the supply gap. It seems unlikely that the resources required for closing the gap will be available from budgetary provisions alone. Alternative sources of funds and /or alternative modes of delivery of health care services need to be explored to meet the demand for specialised health care services in the rural areas.
2. As the effective utilisation of a CHC as a referral centre depends on its ability to provide the complete package of services required for specialised health care, efficient utilisation of available resources warrants its use in closing the supply gap in infrastructure and manpower of the existing CHCs. The complementarity of facilities and manpower of health care institutions should get primacy over other considerations in allocation of resources, as thin spread of resources over a large number of health care institutions has led to sub-optimal utilisation of facilities created. It is advisable to make in each district a few CHCs fully equipped with all complementary facilities and manpower to discharge the intended functions of CHCs and disseminate the information about their functionality among the villages of the district through PRIs so that the people in the district can take full advantage of these well-equipped CHCs.
3. The monitoring of the functioning of CHCs and removal of constraints to utilisation are important issues that need to be addressed for improvement in access to health care services. Non-availability of doctors (in position) for consultation and non-functionality of existing equipments have been noted in CHCs which are otherwise equipped to deliver the intended services (refer paras 5.5.1 (f) and (g), 5.5.2 and 5.8.2 in text). Perhaps, the routinised departmental monitoring can be supplemented by a Monitoring Committee (at the district level) comprising the CMO/DHO and representatives of the Panchayati Raj Institutions.
4. There is an urgent need for setting up of a Technical Committee to go into some basic issues relating to the operational aspects of the rural health care institutions. The terms of reference of the Committee should inter alia, include:
• Review the existing guidelines (framed during Fifth/Sixth Plan) in the light of the advances made in medical sciences, change in health and demographic scenario, appearance of new emerging and re-emerging health problems like, HIV, Plague, Dengue, Hepatitis, Japanese encephalitis, etc, and the performance as revealed in the PEO evaluation study.
• Review the existing norms for establishment of PHCs/CHCs in view of the findings that location and geographical area coverage are important determinants of access and utilization of these institutions.
• Suggest ways and means to bridge the gap in the availability of manpower (including unwillingness of doctors to serve rural areas) and complementary infrastructure (e.g. the services of anaesthetists ).
Incidentally, the expert committee on Public Health System constituted under the Chairmanship of Prof. J.S.Bajaj, the then Member, Planning Commission also recommended for the constitution of a Task Force to review the National health Policy in terms of reformation of strategies.

Chapter 1
Introduction
Health care in India is delivered through a three tier structure of health services comprising the primary, secondary and tertiary health care facilities with the objective of bringing health care services within the reach of the people of both the rural and urban areas. The primary tier would have three types of health care institutions, namely, a Sub-centre (SC) for a population of 3000-5000, a Primary Health Centre (PHC) for 20000 to 30000 population and a Community Health Centre (CHC) as referral centre for every four PHCs. The district hospitals are to function as the secondary tier for the urban population. The tertiary health care is to be provided by health care institutions in urban areas which are well equipped with sophisticated diagnostic and investigative facilities.
1.2 However, inspite of a vast net work of health care institutions in India , there exists a wide gap between the rural and urban areas in terms of availability and accessibility of health care infrastructure, as the urban areas are found better equipped with these facilities. Moreover, health being a state subject, there are imbalances and variations in availability and accessibility of these services in the rural areas across the states .
1.3 The lopsided emphasis on health policy in favour of urban areas has led to disparity in the health status of the rural people, as reflected in the high birth, death and infant mortality rates. For instance, the rural health indicators, such as, birth rate, death rate and infant mortality rate stood at 30.3, 10.1 and 80 respectively during 1995, which are still higher as compared to the corresponding figures of 23.1, 6.3 and 48 respectively for urban areas.
1.4 The data available on the number of hospitals and beds with Directorate of Health Services during the year 1993 indicate that there were 13692 hospitals and 596220 beds in India, of which the rural areas accounted for only 4310 (31.48%) hospitals and 122109 (20.48%) beds. This tends to suggest that our health policy and planning have not facilitated the growth of health infrastructure in the rural areas, given the fact that about 74 per cent of the population lives in the rural areas.
1.5 Since a disproportionate emphasis has been laid on the establishment of curative health centres between the rural and urban areas as majority of these centres are located in the urban areas, the people residing in the rural areas have to travel a long distance to reach the nearest curative health centre for seeking relief from ailments which could have otherwise been readily handled at the CHC level. Besides, for want of a well established referral system, those seeking curative care have the tendency to visit various specialised health care centres, thus further contributing to congestions, duplication of efforts and wastage of resources.
1.6 However, the inadequacies in the policy measures and planning have been recognised and attempts have been made to address this imbalance in access to health care services by strengthening the rural health infrastructure. The creation of CHC as a referral centre equipped with modern facilities is an attempt to bring down the disparity in access to public health care services between the urban and rural areas and to make the facilities available in the tertiary health care hospitals to the rural people by improving the physical accessibility of such services. As a result, substantial resources have been flown into the programming and implementation of health and family welfare programmes since beginning of the Planning Process in India.
1.7 The Fifth Five Year Plan document admitted the shortfalls of earlier Plans in health sector especially related to disparities in availability of the facilities for health care, preventive medicines, medical treatment, family planning, etc., between the rural and urban areas and also the slow pace of the establishment of Primary Health Centres (PHCs) and Sub Centres (SCs) in the rural areas.

1.8 It was in this context that the need was felt to integrate and strengthen the existing rural health network under the Minimum Needs Programme (MNP) during the Fifth Five Year Plan. Accordingly, it was decided to upgrade one PHC among the existing four Primary Health Centres (PHCs) as Community Health Centre (CHC ) with the basic objectives of (I) providing routine as well as specialised health care services in medicine, surgery, paediatrics and obstetrics & gynaecology,(ii) making adequate provisions in the cases of emergencies and acute ill cases referred from the neighbouring PHCs, (iii) providing relief to already overcrowded district and other referral hospitals and (iv) bringing health care within the reach of the people residing in the rural areas.
1.9 This health care institution was envisaged to function as referral centre for four PHCs besides catering to the needs of the people as rural hospital. A Community Health Centre is supposed to cater to a prescribed norm of population of 80,000 to 1,20,000 in rural areas. It was decided under the scheme that each CHC should have four specialists, one having specialisation in each field of medicine, surgery, pediatrics and gynaecology. Besides, it should also be equipped with facilities like 30 beds for indoor patients, laboratory, X-ray machine, etc.
1.10 The functions of CHCs include regular and out-patient services, in-patient services, comprehensive family welfare services, i.e. surgical and non-surgical, obstetrecture, gynaecological and specialised services including labour room services to tackle high risk pregnancies, surgical services, specilised medical and paediatric services, laboratory diagnostic services, X-ray facilities, National Health Programmes, maternal care and child health, immunisation services, etc. In addition to medical services, functions of CHCs also include making provisions for safe drinking water and basic sanitation, prevention and control of endemic diseases, collection of vital statistics of the area, health and nutrition , education and training of various health personnel working under the CHC area.
1.11 The staff for the CHC are posted by the State Governments as per the norms prescribed by the Central Ministry. The staffing pattern envisaged for each CHC is: Medical Officers (4), Nurse Mid-Wives (7), Dressers (1), Pharmacist/Compounder (1), Laboratory Technician (1) Radiographer (1), Ward Boys (2) Dhobi (1), Sweepers (3), Mali (1), Chowkidar (1), Aya (1) and Peon (1).
Need for the Study
1.12 The Approach Paper to the Ninth Plan noted that many of our development objectives have not been realised owing to inadequacies in implementation. In this context, it needs to be examined whether the objectives of CHCs are actually being realised.
1.13 In view of the above, it is imperative to get insight into the functioning of the Community Health Centres (CHCs) which were established with the objectives of minimizing the hardships of the rural people arising out of lack of specialised medical services in the nearby areas and their inability to have access to District and other rural referral hospitals which are already overcrowded. Hence, the need to evaluate the scheme was felt. The study would provide useful inputs to the policy makers and the implementors for taking corrective measures on bottlenecks, disparities, etc., if any, in the functioning of CHCs

Chapter-2
THE EVALUATION STUDY – OBJECTIVES AND METHODOLOGY
At the instance of the Planning Commission, the Programme Evaluation Organisation undertook the evaluation study of functioning of the Community Health Centres (CHCs). The primary objective of the study was to assess whether the CHCs have been able to bring health care within the reach of the people residing in the rural areas and provide relief to the already overcrowded district and other referral hospitals. Within this broad objective, some specific objectives were identified in consultation with the health Division of Planning Commission.
Objectives
2.1.2 The specific objectives of the study are:
(1) to examine whether existing population norms and locations of CHCs are conducive for improving the accessibility of specialised health care services to the rural people;
(ii) to assess the availability and adequacy of medical, para-medical and supportive staff in CHCs;
(iii) to examine if the necessary health infrastructure including complementary facilities and medicines are available and their functionality in improving the delivery of specialised health care services;
(iv) to assess the extent to which the CHCs are being utilised as referral centres for PHCs;
In addition to the aforesaid objectives, the study was designed to investigate:
(a) timely supply of essential medicines under National Health Programme (NHP) and;
(b) contribution of CHCs to implementation of Family Welfare Programmes.
Methodology
2.2.1 A multi-stage sample design was adopted for the study.The sample units at different levels: States , Districts, CHCs, PHCs, patients and non-patients.The first stage sample units are the 8 States selected purposively to represent good and bad health status of the population. Four States,viz, Madhya Pradesh ,Uttar Pradesh ,Rajasthan and Orissa having infant mortality rate (IMR) higher than the national average and another four , viz, Bihar, Haryana, Maharashtra and Tamil Nadu with IMR less than or equal to the national average were selected for the study. The necessary data base was built through collection of both quantitative and qualitative data at various levels. To assess the location and coverage of CHCs, data pertaining to population coverage vis-a-vis norm prescribed, distance of sample CHCs from PHCs and district Hqrs. were collected through the structured schedules.
2.2.2 The information on availability and adequacy of health care service infrastructure, like, manpower, equipments, physical facilities was collected through secondary sources maintained at CHC level. To examine the utilisation of referral services, the data on number of routine as well as
referred cases attended at CHCs per annum were collected. Besides, to assess the effectiveness of CHCs, the primary information on accessibility and acceptability of health care services to the people was collected from sample beneficiaries.
2.2.3 Thus, the requisite data base for the study was generated through the instruments of observation structured at different levels and also through discussions with Govt. Health functionaries. The instruments of observation were structured at six levels i.e. District, CHC, PHC, knowledgeable person, patient and non-patient.
Instruments
2.3.1 The following instruments were designed for collection of both qualitative and quantitative data:
1. District Level Schedule
2. CHC Level Schedule
3. PHC Level Schedule
4. Knowledgeable person schedule
5. Patient-Schedule
6. Non-patient Schedule
District Level Schedule
2.3.2 This schedule was designed with a view to collect information on existing rural health care institutions and health indicators at the district level.
CHC Level Schedule
2.3.3 This schedule was prepared to collect secondary data on locations of CHCs, population coverage, distance of CHCs from their respective PHCs and district Hqrs., staffing position of both medical and para medical personnel, availability and status of health care service infrastructure including equipments and medicines and their achievements in family welfare programmes including maternal and child health care activities.
PHC Level Schedule
2.3.4 This schedule was prepared to collect information on locations of PHCs and coverage of population, staffing position and number of cases handled for both in door and out door patients in PHCs, number of cases referred to CHCs vis-a-vis the actual capacity of PHCs to handle the cases per annum.
Patient Schedule
2.3.5 This schedule was prepared with a view to collecting primary information on accessibility of referral as well as health care services provided by CHC in terms of location, distance, connectivity, etc. The schedule also sought to collect information on acceptability of both routine and referral services in terms of quality and cost of treatment in CHC. Besides, information on availability of

medicines and preference of patients for treatment at CHCs vis-a-vis other curative health centres was also sought through this schedule.
Non-Patient Schedule
2.3.6 This schedule was prepared with a view to collecting information on awareness about the functioning of CHCs and also to cross check the data collected through patient level schedule on acceptability, quality and cost of health care services provided by CHCs.
Knowledgeable Person Schedule
2.3.7 This schedule was prepared to cross check the primary information collected at patient and non-patient level on the same aspects, like, accessibility, acceptability, availability and adequacy of health care services.
Sample Design
2.3.8 A multi-stage sampling design was adopted in the study which is as follows:
States
2.4.1 Eight states were selected to represent the good and poor health status of the population. The infant mortality rate was used as a stratifying parameter. Four states viz. Madhya Pradesh, Uttar Pradesh, Rajasthan and Orissa having IMR higher than the national average and another four viz. Tamil Nadu, Maharashtra, Bihar and Haryana with IMR less than or equal to national average were chosen for the study.
Districts
2.4.2 From each state two districts one good performing and the other poor performing in terms of infant mortality rate were selected randomly.
Community Health Centres (CHCs)
2.4.3 Two Community Health Centres, of which one located near the district Hqrs. and the other located in disadvantageous area, were selected randomly from each district except Hardoi district where only one CHC was found to be in existence.
Primary Health Centres (PHCs)
2.4.4 Two PHCs from each CHC were selected randomly.
2.4.5 Respondents
(a) Patient respondents : Eight patient respondents, four indoor patients and four outdoor patients, were selected from each CHC.
(b) Non-patient respondents: In order to select non-patient respondents, three villages, of which two villages located far away from the CHC and one village from the same place/area where CHC was located, were selected from each district. Accordingly, five non-patient respondents belonging to different households from each village were selected.
Knowledgeable Persons
2.4.6 Two knowledgeable persons from each village where CHC was located were randomly selected.
Coverage
2.5.1 Thus,the envisaged sample size is as under:
(i) States 8
(ii) Districts 16
(iii) CHCs 32 (31)
(iv) PHCs 64 (62)
(v) Respondents
(a) Patient Respondents 256 (224)
(b) Non-patient Respondents 240 (155)
(vi) Knowledgeable Respondents 64 (62)
*Figures in parantheses represent the actual sample size against the envisaged.
Reference Period
2.6.1 The reference period for the study was from 1993-94 to 1996-97.
Orientation of the Field Teams
2.7.1 The study design and instruments were finalised in a meeting of the Heads of the Regional Evaluation Offices (REOs) of the PEO held on 23.9.1996 at the Hqrs. The REOs in turn held two Orientation Programmes for field staff, one at Calcutta on 13th & 14th October, 1996 for the states of Bihar, Haryana, Orissa and Uttar Pradesh and the other at Kanyakumari on 17th & 18th October, 1996 for the states of Madhya Pradesh, Maharashtra, Rajasthan and Tamil Nadu. In these orientation programmes, all the instruments prepared for the study were explained to the respective field teams of the selected states.
Field Work
2.8.1 The field work was initiated in November, 1996 and completed in February,
1997. The field teams stayed in the selected districts, blocks and villages for canvassing of the schedules at various levels and recording their observations on various aspects based on discussions held with the implementing functionaries and the knowledgeable persons.
Chapter -3
Coverage and Location of CHCs
The optimum population coverage by the rural health care institutions and their location in general, and CHC as referral centre in particular are among the important factors that influence the accessibility of health care services to the rural people. Though the norm for population coverage by a CHC has been prescribed, no criterion as such has been laid down for geographical location while establishing a CHC. In this back drop, the present chapter deals with the issues relating to actual population coverage by a CHC against the national norm, appropriateness of ‘population norm’ as a criterion for establishment of a CHC and implications of inconvenient location of a CHC on utilisation of referral services.
I Population Norms and Coverage
3.1.2 The national norm for population coverage per sub-centre as laid down in the year 1987 was 3000 for tribal and 5000 for plain areas. Similarly, it was fixed at 20,000 to 30,000 per PHC and 80,000 to 1.20 lakh per CHC.
3.1.3 At the all India level, a sub-centre, on an average, served 4737 people and a PHC 28,768 people in 1996. However, the population coverage of a CHC was found to be 2.6 lakh -which was much above the norm fixed for this rural health care institution. Thus, while the actual population coverage of a sub-centre and PHC, is on an average, as per norms, that of a CHC is not. Since CHC is required to act as a referral centre, this mis-match in the number of PHCs and CHCs is likely to create undue pressure on the limited services made available through CHCs. It was noted that, as against 4 PHCs per CHC, there were, on an average , 9 PHCs under a CHC during 1996.
State Level
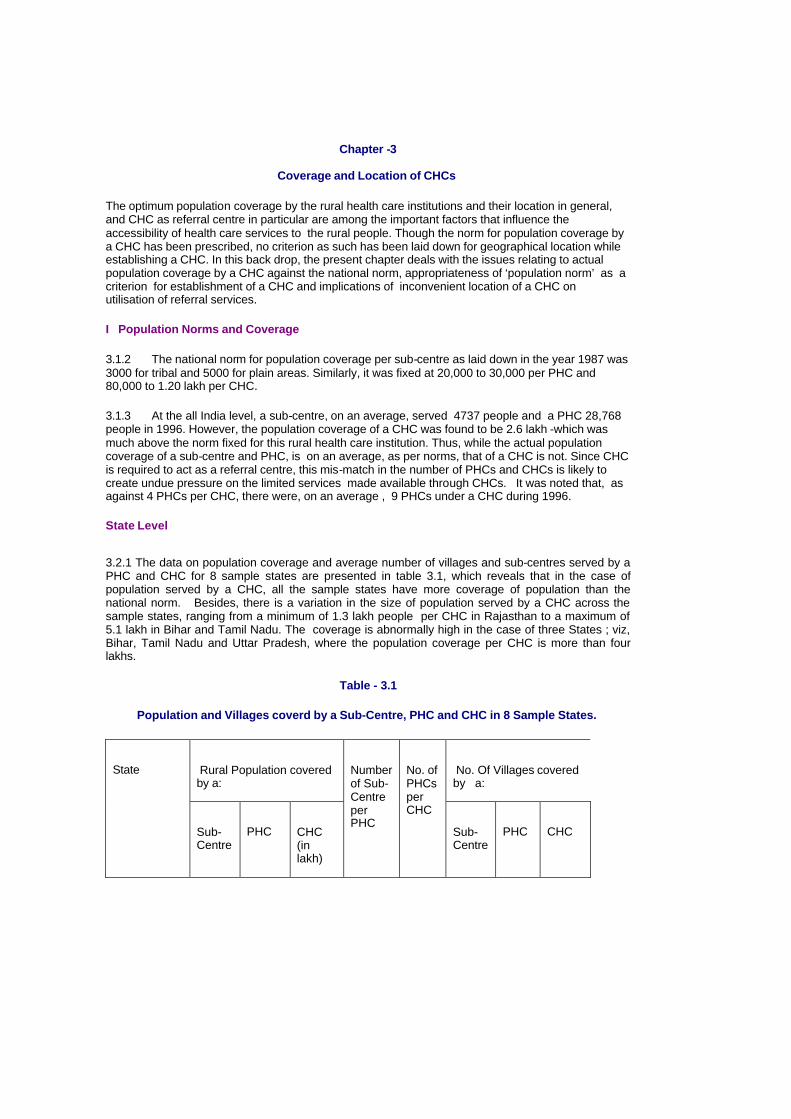
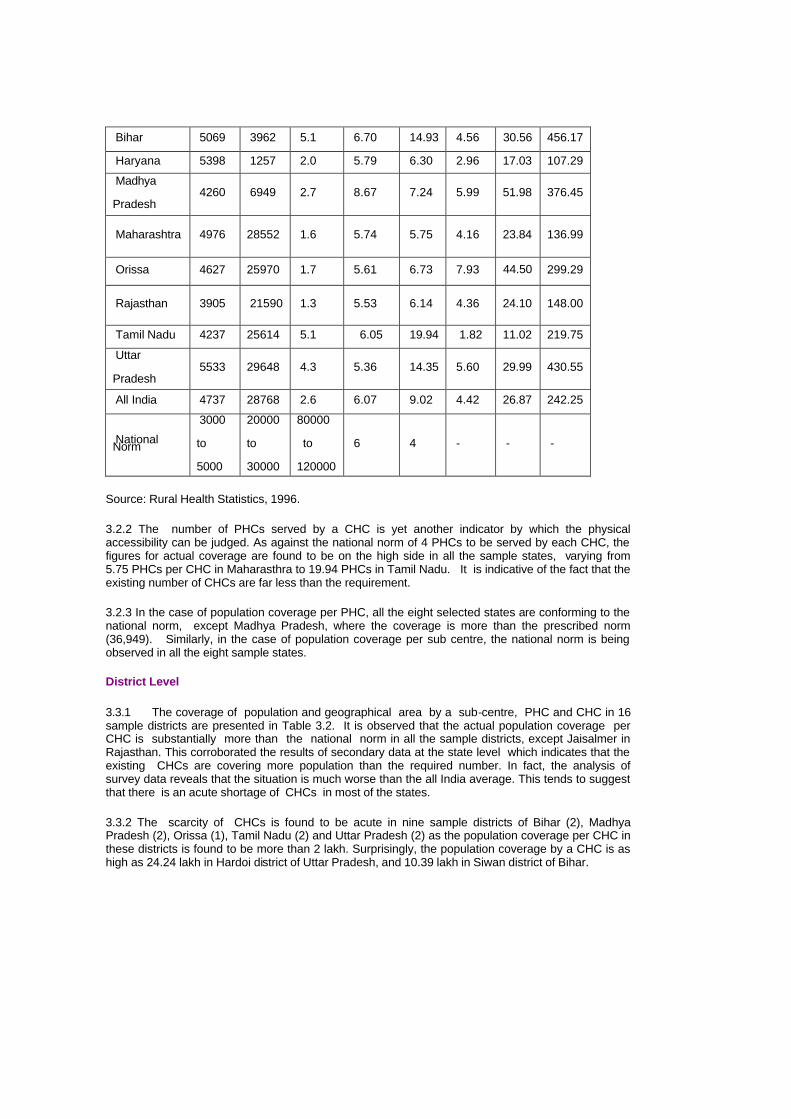
3.2.1 The data on population coverage and average number of villages and sub-centres served by a PHC and CHC for 8 sample states are presented in table 3.1, which reveals that in the case of population served by a CHC, all the sample states have more coverage of population than the national norm. Besides, there is a variation in the size of population served by a CHC across the sample states, ranging from a minimum of 1.3 lakh people per CHC in Rajasthan to a maximum of 5.1 lakh in Bihar and Tamil Nadu. The coverage is abnormally high in the case of three States ; viz, Bihar, Tamil Nadu and Uttar Pradesh, where the population coverage per CHC is more than four lakhs.
Table - 3.1
Population and Villages coverd by a Sub-Centre, PHC and CHC in 8 Sample States.
Rural Population covered by a:
No. Of Villages covered by a:
State
Sub-Centre
PHC
CHC (in lakh)
Number of Sub-Centre per PHC
No. of PHCs per CHC
Sub-Centre
PHC
CHC
Bihar 5069 3962 5.1 6.70 14.93 4.56 30.56 456.17
Haryana 5398 1257 2.0 5.79 6.30 2.96 17.03 107.29
Madhya
Pradesh 4260 6949 2.7 8.67 7.24 5.99 51.98 376.45
Maharashtra 4976 28552 1.6 5.74 5.75 4.16 23.84 136.99
Orissa 4627 25970 1.7 5.61 6.73 7.93 44.50 299.29
Rajasthan 3905 21590 1.3 5.53 6.14 4.36 24.10 148.00
Tamil Nadu 4237 25614 5.1 6.05 19.94 1.82 11.02 219.75
Uttar
Pradesh 5533 29648 4.3 5.36 14.35 5.60 29.99 430.55
All India 4737 28768 2.6 6.07 9.02 4.42 26.87 242.25
National Norm
3000
to
5000
20000
to
30000
80000
to
120000
6 4 - - -
Source: Rural Health Statistics, 1996.
3.2.2 The number of PHCs served by a CHC is yet another indicator by which the physical accessibility can be judged. As against the national norm of 4 PHCs to be served by each CHC, the figures for actual coverage are found to be on the high side in all the sample states, varying from 5.75 PHCs per CHC in Maharasthra to 19.94 PHCs in Tamil Nadu. It is indicative of the fact that the existing number of CHCs are far less than the requirement.
3.2.3 In the case of population coverage per PHC, all the eight selected states are conforming to the national norm, except Madhya Pradesh, where the coverage is more than the prescribed norm (36,949). Similarly, in the case of population coverage per sub centre, the national norm is being observed in all the eight sample states.
District Level
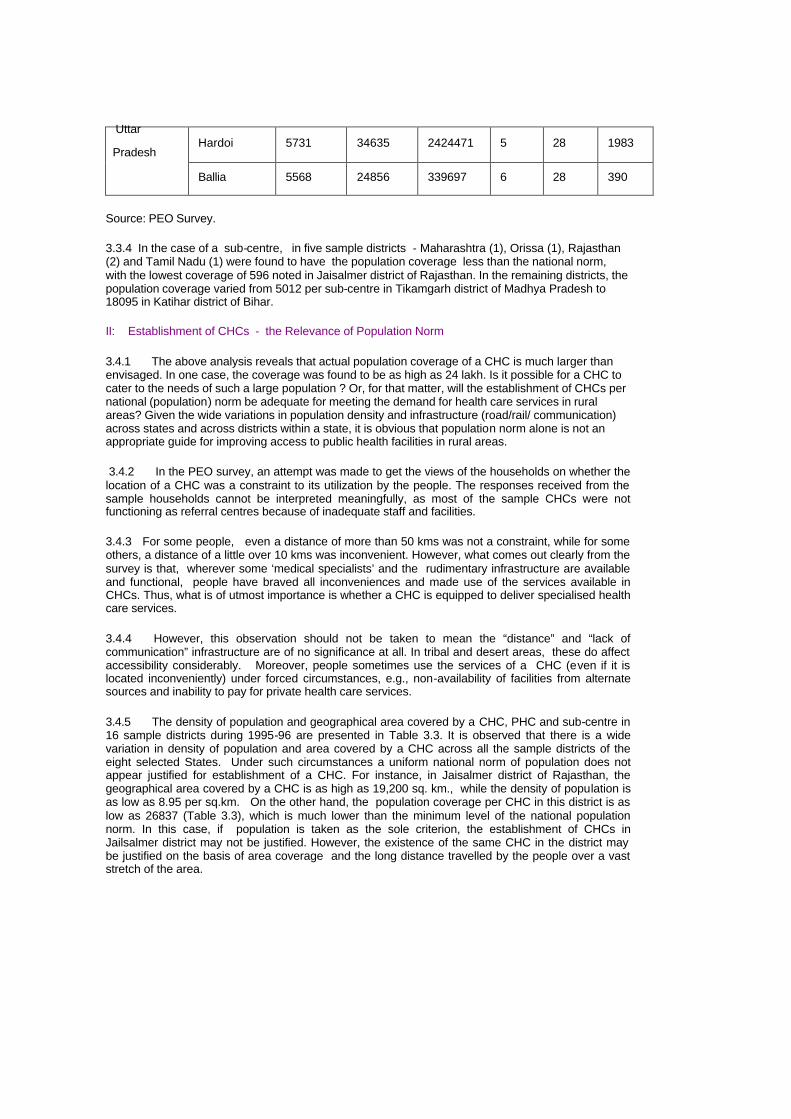
3.3.1 The coverage of population and geographical area by a sub-centre, PHC and CHC in 16 sample districts are presented in Table 3.2. It is observed that the actual population coverage per CHC is substantially more than the national norm in all the sample districts, except Jaisalmer in Rajasthan. This corroborated the results of secondary data at the state level which indicates that the existing CHCs are covering more population than the required number. In fact, the analysis of survey data reveals that the situation is much worse than the all India average. This tends to suggest that there is an acute shortage of CHCs in most of the states.
3.3.2 The scarcity of CHCs is found to be acute in nine sample districts of Bihar (2), Madhya Pradesh (2), Orissa (1), Tamil Nadu (2) and Uttar Pradesh (2) as the population coverage per CHC in these districts is found to be more than 2 lakh. Surprisingly, the population coverage by a CHC is as high as 24.24 lakh in Hardoi district of Uttar Pradesh, and 10.39 lakh in Siwan district of Bihar.

3.3.3 So far as the coverage of the PHCs is concerned, it is observed that the majority of the sample PHCs have a population coverage within or, in the neighbourhood of the national norms. Only four (4) out of 111 PHCs were found to have a population coverage of much above the national norm, while one PHC in Jaisalmer has a coverage of less than 4000 people. The coverage of population by a PHC is much above the national norm in the case of two PHCs of Bihar (Katihar and Siwan), one in Maharashtra (Parbhani) and one in Haryana (Bhiwani).
Table 3.2
Average Population and Villages served by a Sub-Centre, PHC and CHC in 16 Sample Districts.
State District population per sub- centre
population per PHC Population
per CHC No. of villages per sub- centre
No. of Villages per PHC
No. of Villages per CHC
Katihar 18095 150034 550126 5 112 413 Bihar
Siwan 6881 173187 1039127 1 10 59
Bhiwani 6239 53298 142129 2 17 47 Haryana
Ambala 5299 33637 193416 5 30 177
Tikamgarh 5012 48863 260605 5 53 287 Madhya
Pradesh Indore 5558 24408 280698 6 28 329
Parbhani 4764 327776 182097 4 31 172 Maharashtra
Kolhapur 5900 33166 168385 3 18 92
Balasore 6163 41984 258905 10 69 431 Orissa
Sambalpur 3840 18273 150754 8 40 331
Tonk 3870 19266 173400 4 24 216 Rajasthan
Jaisalmer 596 3355 26837 5 72 216
Tirunelveli 4461 28477 854328 2 10 314 TamilNadu
KanyaKumari 5046 46464 449155 1 3 27
Hardoi 5731 34635 2424471 5 28 1983 Uttar
Pradesh
Ballia 5568 24856 339697 6 28 390
Source: PEO Survey.
3.3.4 In the case of a sub-centre, in five sample districts - Maharashtra (1), Orissa (1), Rajasthan (2) and Tamil Nadu (1) were found to have the population coverage less than the national norm, with the lowest coverage of 596 noted in Jaisalmer district of Rajasthan. In the remaining districts, the population coverage varied from 5012 per sub-centre in Tikamgarh district of Madhya Pradesh to 18095 in Katihar district of Bihar.
II: Establishment of CHCs - the Relevance of Population Norm 3.4.1 The above analysis reveals that actual population coverage of a CHC is much larger than envisaged. In one case, the coverage was found to be as high as 24 lakh. Is it possible for a CHC to cater to the needs of such a large population ? Or, for that matter, will the establishment of CHCs per national (population) norm be adequate for meeting the demand for health care services in rural areas? Given the wide variations in population density and infrastructure (road/rail/ communication) across states and across districts within a state, it is obvious that population norm alone is not an appropriate guide for improving access to public health facilities in rural areas.
3.4.2 In the PEO survey, an attempt was made to get the views of the households on whether the location of a CHC was a constraint to its utilization by the people. The responses received from the sample households cannot be interpreted meaningfully, as most of the sample CHCs were not functioning as referral centres because of inadequate staff and facilities.
3.4.3 For some people, even a distance of more than 50 kms was not a constraint, while for some others, a distance of a little over 10 kms was inconvenient. However, what comes out clearly from the survey is that, wherever some ‘medical specialists’ and the rudimentary infrastructure are available and functional, people have braved all inconveniences and made use of the services available in CHCs. Thus, what is of utmost importance is whether a CHC is equipped to deliver specialised health care services.
3.4.4 However, this observation should not be taken to mean the “distance” and “lack of communication” infrastructure are of no significance at all. In tribal and desert areas, these do affect accessibility considerably. Moreover, people sometimes use the services of a CHC (even if it is located inconveniently) under forced circumstances, e.g., non-availability of facilities from alternate sources and inability to pay for private health care services.
3.4.5 The density of population and geographical area covered by a CHC, PHC and sub-centre in 16 sample districts during 1995-96 are presented in Table 3.3. It is observed that there is a wide variation in density of population and area covered by a CHC across all the sample districts of the eight selected States. Under such circumstances a uniform national norm of population does not appear justified for establishment of a CHC. For instance, in Jaisalmer district of Rajasthan, the geographical area covered by a CHC is as high as 19,200 sq. km., while the density of population is as low as 8.95 per sq.km. On the other hand, the population coverage per CHC in this district is as low as 26837 (Table 3.3), which is much lower than the minimum level of the national population norm. In this case, if population is taken as the sole criterion, the establishment of CHCs in Jailsalmer district may not be justified. However, the existence of the same CHC in the district may be justified on the basis of area coverage and the long distance travelled by the people over a vast stretch of the area.

Table 3.3
Density of Population and Geographical Area Covered by a CHC, PHC, Sub-Centre and Village
in 16 Sample Districts.
Geographical Area Covered in Sq.Kms Per:
State
District
Density of Population (in Sq. Kms)
Area (Sq. Kms)
Population (1991)
CHC
PHC
Sub-Centre
Village
1 2 3 4 5 6 7 8 9
Bihar Katihar 595.88 3057 1821590 1019.00 277.91 11.89 2.47
Siwan 973.12 2219 2159346 1109.50 184.92 7.35 18.81
Haryana Bhiwani 220.14 5099 1122487 566.56 212.46 24.87 12.03
Ambala 463.85 2385 1106275 596.25 103.70 16.34 3.35
Madhya
Pradesh
Tikamgarh 186.33 5048 940609 1682.67 315.50 32.36 5.85
Indore 469.69 3898 1830870 1949.00 169.48 38.59 5.92
Maharashtra Parbhani 191.44 11038 2113168 1226.44 220.76 32.09 7.10
Kolhapur 389.67 7633 2974352 587.15 115.65 20.57 6.36
Orissa Balasore 456.68 3706 1692439 617.67 100.16 14.71 1.43
Sambalpur 120.71 6702 809017 1675.50 203.09 42.69 5.06
Rajasthan Tonk 135.16 7200 973118 1440.00 160.00 2.14 6.65
Jaisalmer 8.95 38401 343648 19200.50 2400.06 426.68 90.78
Tamil Nadu Tirunelveli 364.61 6838 2493189 3419.00 113.97 17.85 10.89

Kanya
Kumari
950.33 1684 1600349 561.33 58.07 6.31 20.79
Uttar
Pradesh
Hardoi 457.57 5986 2739003 5986.00 85.51 14.15 3.02
Ballia 752.88 2988 2249598 498.00 36.44 8.16 1.28
3.4.6 In the same context, there are other seven sample distric ts where the area coverage per CHC is more than 1000 sq. Kms,.but the density of population is less than 500 per sq. Km. These seven districts are from the states of Madhya Pradesh (2), Mahrashtra (1), Orissa (1), Rajasthan (1), Tamil Nadu (1) and Uttar Pradesh (1). In these cases also, the feasibility of population norm alone as a criterion for establishment of CHC needs to be re-examined in view of the geographical area coverage and the density of population.
3.4.7 All this tends to suggest that while the population norm can be taken as a general guide for establishment of CHCs, due weightage needs to be given to the distance to be covered by a beneficiary and the conditions of the communication infrastructure of the local area.
III Location of CHCs
3.5.1 A CHC is primarily a referral centre for the PHCs. The CHC is designed to cater to the needs of 4 to 5 PHCs which would refer cases to CHCs for specialised health care. The CHC, therefore, should be conveniently located, so that the population served by all the PHCs (under a CHC) can avail the referral services rendered by the CHC.
3.5.2 Though, the density of population and coverage of geographical area can be taken as parameters for assessing the requirement of CHCs, it would be the radial distance and mode of communication, and also the location of district hospital, which would determine the suitability of CHC. The radial distance of 31 sample CHCs from their affiliated PHCs and District Hdqrs. is presented in Table 3.4. The variation in mean distance between the sample CHCs and PHCs has been computed for the sample CHCs in the selected states. The mean distance varied from a minimum of 8.25 kms in Tamil Nadu to a maximum of 31.44 kms in Madhya Pradesh. The minimum distance between sample CHCs and PHCs varied from 1 km in Bihar to 15 kms. in Madhya Pradesh, while the maximum distance varied from 16 kms. in Tamil Nadu to 80 kms. in Madhya Pradesh. Similarly, the radial distance between sample CHCs and the District Hqrs.was minimum in Tamil Nadu (22.75 kms.), while it was maximum in Rajasthan (86.25 Kms.).
3.5.3 The distribution of 111 PHCs according to distance from their respective CHCs is presented in Table 3.5. It is observed that only 29.73 per cent of PHCs are falling within the radial distance of less than 10 kms, while a vast majority (70.27 per cent) fall beyond the radial distance of 10 kms from their respective sample CHCs. Though, all the PHCs and the sample CHCs were found connected either with rail or road, the survey data do not permit us to assess the quality of the communication links between the habitations and the CHCs. In the absence of such information, it is assumed that the accessibility of people to CHCs is inversely related to the distance from PHCs.
Table 3.4
Radial Distance of Sample CHCs (31) from their Respective PHCs and District Hqrs.
Distance between PHCs and CHCs (Kms.) Distance between CHCs & District Hqrs. (Kms.)

State
CHC (No.)
PHC (No.)
Mean
Minimum
Maximum
Mean
Minimum
Maximum
Bihar 4 14 26.46 1 40 30.5 23 35
Haryana 4 17 21.07 7 50 30.25 14 60
Madhya Pradesh 4 16 31.44 15 80 48.25 35 78
Maharashtra 4 17 17.44 6 36 40.25 18 55
Orissa 4 11 25.70 7 50 50.75 31 80
Rajasthan 4 15 27.93 10 67 86.25 30 175
Tamil Nadu 4 8 8.25 3 16 22.75 12 36
Uttar Pradesh 3 13 13.92 5 34 31.00 17 40
Table 3.5
Distribution of PHCs (111) according to Distance in Kms. from their Respective Sample CHCs (31)
Number of PHCs at a Distance from CHCs in Kms. State
0-10 10-20 20-30 30 & above Total
Bihar 2 3 4 5 14
Haryana 7 5 2 3 17
Madhya Pradesh 0 5 5 6 16
Maharashtra 6 5 3 3 17
Orissa 3 4 1 3 11
Rajasthan 3 4 2 6 15
Tamil Nadu 6 2 0 0 8
Uttar Pradesh 6 5 1 1 13
Total 33 33 18 27 111
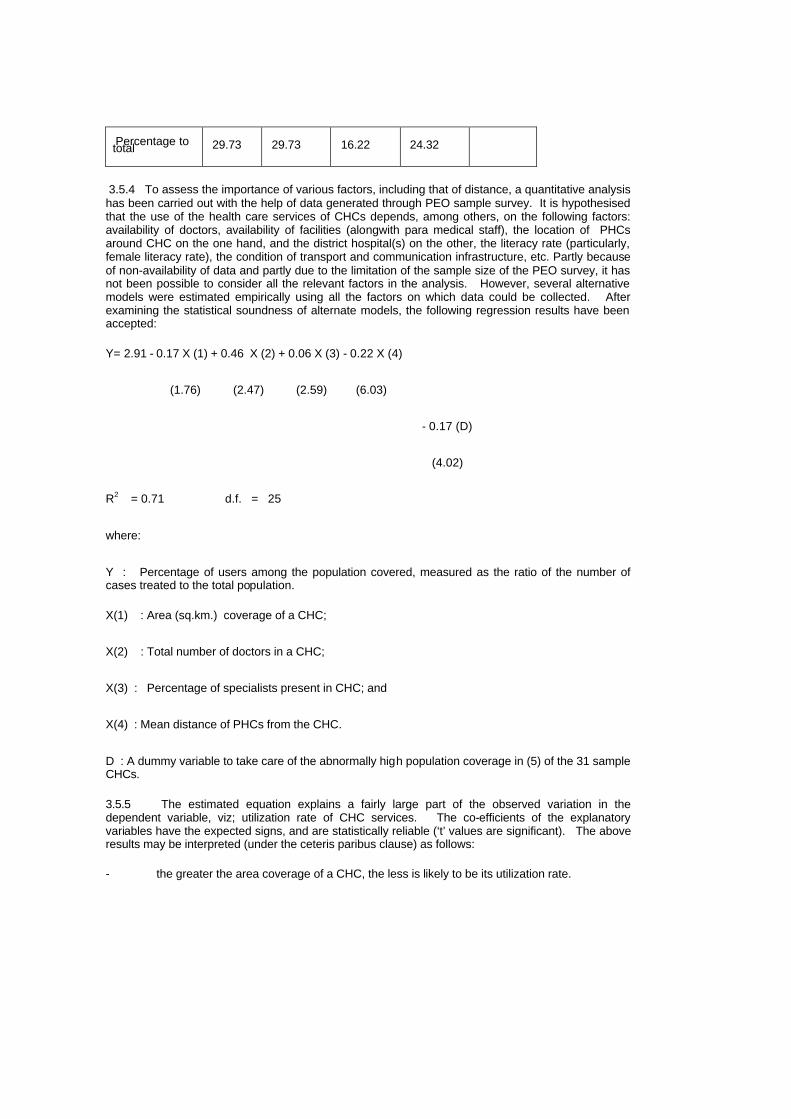
Percentage to total 29.73 29.73 16.22 24.32
3.5.4 To assess the importance of various factors, including that of distance, a quantitative analysis has been carried out with the help of data generated through PEO sample survey. It is hypothesised that the use of the health care services of CHCs depends, among others, on the following factors: availability of doctors, availability of facilities (alongwith para medical staff), the location of PHCs around CHC on the one hand, and the district hospital(s) on the other, the literacy rate (particularly, female literacy rate), the condition of transport and communication infrastructure, etc. Partly because of non-availability of data and partly due to the limitation of the sample size of the PEO survey, it has not been possible to consider all the relevant factors in the analysis. However, several alternative models were estimated empirically using all the factors on which data could be collected. After examining the statistical soundness of alternate models, the following regression results have been accepted:
Y= 2.91 - 0.17 X (1) + 0.46 X (2) + 0.06 X (3) - 0.22 X (4)
(1.76) (2.47) (2.59) (6.03)
- 0.17 (D)
(4.02)
R2 = 0.71 d.f. = 25
where:
Y : Percentage of users among the population covered, measured as the ratio of the number of cases treated to the total population.
X(1) : Area (sq.km.) coverage of a CHC;
X(2) : Total number of doctors in a CHC;
X(3) : Percentage of specialists present in CHC; and
X(4) : Mean distance of PHCs from the CHC.
D : A dummy variable to take care of the abnormally high population coverage in (5) of the 31 sample CHCs.
3.5.5 The estimated equation explains a fairly large part of the observed variation in the dependent variable, viz; utilization rate of CHC services. The co-efficients of the explanatory variables have the expected signs, and are statistically reliable (‘t’ values are significant). The above results may be interpreted (under the ceteris paribus clause) as follows:
- the greater the area coverage of a CHC, the less is likely to be its utilization rate.

- a CHC with inadequate medical stafff (doctors) is less frequently used by the people.
- the utilization of a CHC is greatly influenced by the availability of the
- specialists. Specifically, the utilization rate varies directly with the proportion of specialists to total number of doctors available in a CHC.
- the most significant factor that influences the utilization rate of a CHC is its location vis-a-vis PHCs for which it is a referral centre. In particular, the greater the mean distance of a CHC from the affiliated PHCs, the lower is its utilization rate, other things remaining the same.
3.5.6 The above analysis brings to the fore the limitations of the existing policies with regard to the development of the public health system in rural India. Alongwith the population norms the following factors, in order of their importance, should also be considered for improving the utilization rates of these institutions.
- the geographical location of the CHC and its mean distance from the affiliated PHCs for which it is a referral centre.
- the availability of doctors, particularly, the specialists in CHCs.
- the geographical coverage of a CHC.
3.5.7 Apart from these factors, the quality of the service delivery system, which encompasses a host of factors, like, the availability of paramedical staff, equipments and facilities, functionality of the equipments needed for providing specialised health care services, etc. is an important factor in determining accessibility of the public health care services. Partly due to lack of adequate information and partly because of statistical problems involved in estimating the influence of these factors on “accessibility” in quantitative terms, these factors have been omitted from the above empirical analysis. However, in Chapter-V which deals with the utilization of services of CHCs, an attempt is made to show the importance of the complementarity of the various inputs (both manpower and the various facilities) in determining the utilization of services of CHCs.
Chapter -4
Infrastructure at CHCs- Availability and Adequacy
The CHCs are required to deliver specialised health care services to the rural people, in the absence of which they would be forced to spend a lot of time and money in availing themselves of such services in the urban areas. To enable CHCs to discharge this responsibility, the CHCs were envisaged to be equipped with medical specialists, para medical staff and complementary infrastructure. The objective of this Chapter is to assess the adequacy and availability of manpower and infrastructure of the selected CHCs in the country. This assessment would enable us to place the findings of the subsequent chapters dealing with the functioning and performance of CHCs in appropriate context. For the purpose of working out the gaps in availability of manpower and other facilities, the requisite information was generated through a structured questionnaire which was canvassed to the sample CHCs by the Regional/ Field Units of PEO.
Facilities at CHCs
4.2.1 For the purpose of analysis, the various components of the infrastructure of CHCs can be broadly categorised under appropriate groups and sub -heads, like, man-power, physical facilities, machines and apparatus and medicines. While the Government of India have prescribed norms for essential facilities required at CHCs, the implementation of the norms and actual provision of such facilities are made by the concerned State Governments. The man-power at a CHC includes medical specialists, para-medical staff and supportive staff, while physical facilities include operation theatre, labour room, pathology laboratory and safe drinking water. Other essential complementary facilities, like, refrigerator, X-Ray machine, ECG apparatus and generator are included under equipments.
Specialist
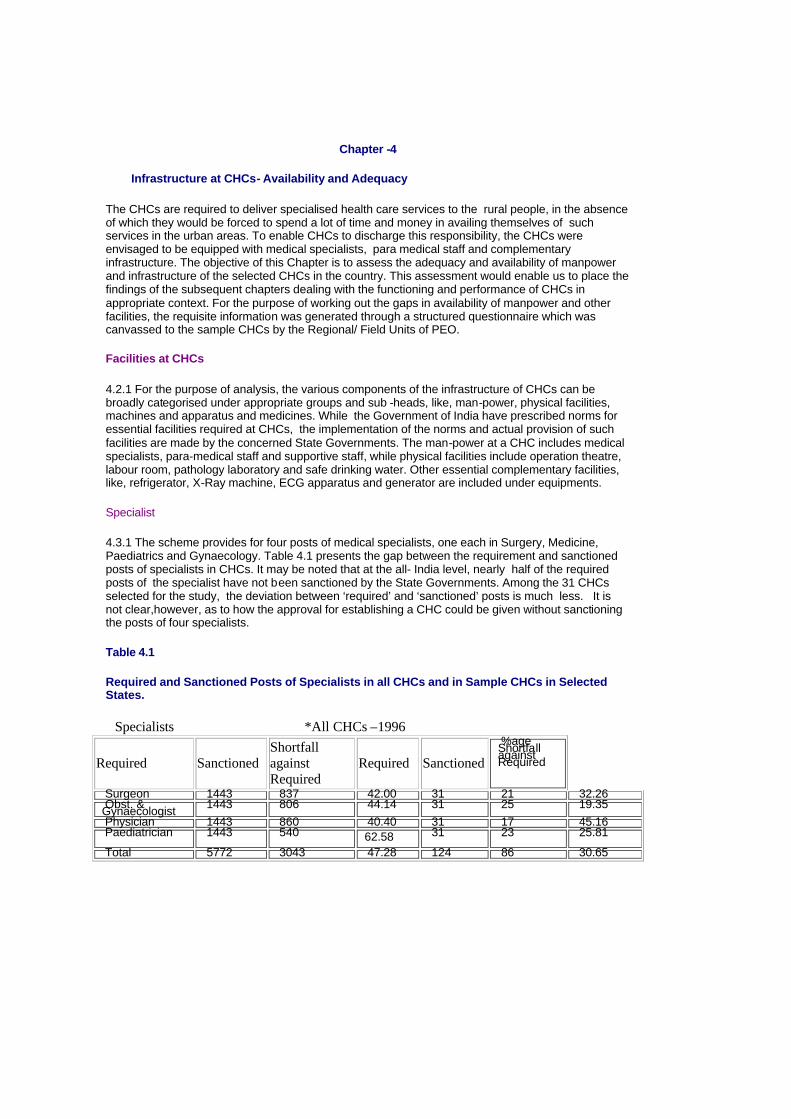
4.3.1 The scheme provides for four posts of medical specialists, one each in Surgery, Medicine, Paediatrics and Gynaecology. Table 4.1 presents the gap between the requirement and sanctioned posts of specialists in CHCs. It may be noted that at the all- India level, nearly half of the required posts of the specialist have not been sanctioned by the State Governments. Among the 31 CHCs selected for the study, the deviation between ‘required’ and ‘sanctioned’ posts is much less. It is not clear,however, as to how the approval for establishing a CHC could be given without sanctioning the posts of four specialists.
Table 4.1
Required and Sanctioned Posts of Specialists in all CHCs and in Sample CHCs in Selected States.
Specialists *All CHCs –1996
Required Sanctioned Shortfall against Required
Required Sanctioned
%age Shortfall against Required
Surgeon 1443 837 42.00 31 21 32.26 Obst. & Gynaecologist 1443 806 44.14 31 25 19.35 Physician 1443 860 40.40 31 17 45.16 Paediatrician 1443 540 62.58 31 23 25.81
Total 5772 3043 47.28 124 86 30.65
Source: * Rural Health Statistics in India, June 1996. ** PEO Survey
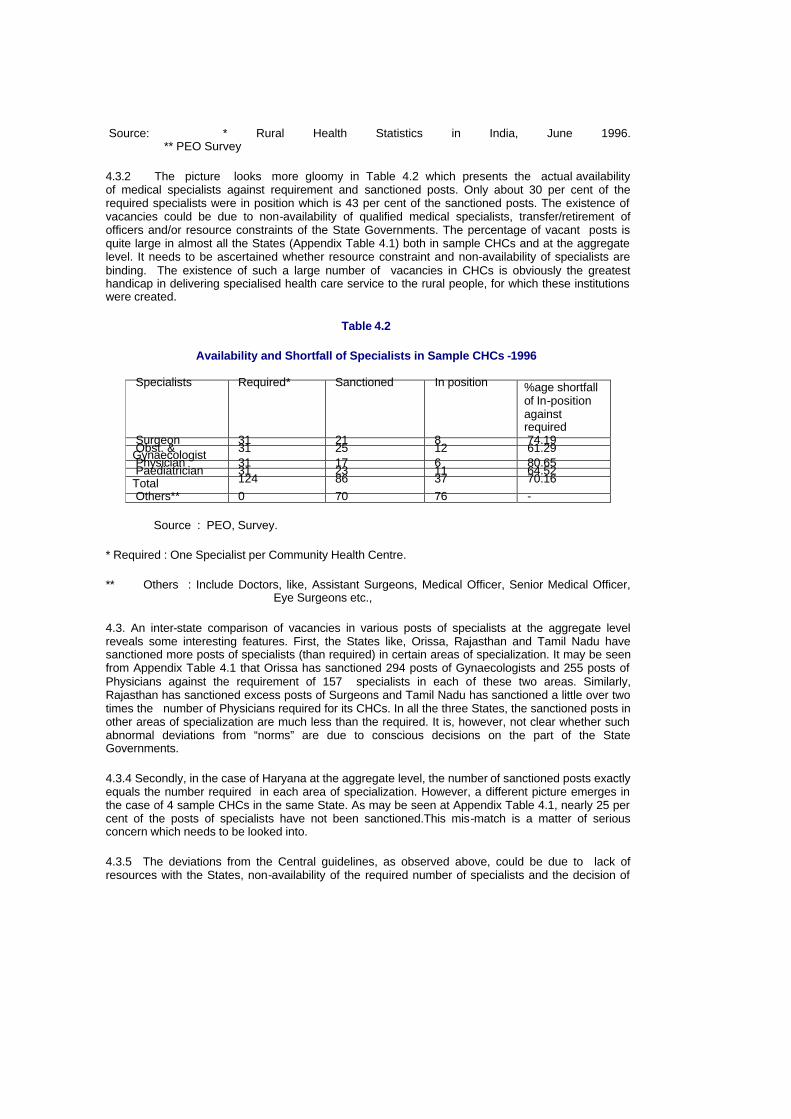
4.3.2 The picture looks more gloomy in Table 4.2 which presents the actual availability of medical specialists against requirement and sanctioned posts. Only about 30 per cent of the required specialists were in position which is 43 per cent of the sanctioned posts. The existence of vacancies could be due to non-availability of qualified medical specialists, transfer/retirement of officers and/or resource constraints of the State Governments. The percentage of vacant posts is quite large in almost all the States (Appendix Table 4.1) both in sample CHCs and at the aggregate level. It needs to be ascertained whether resource constraint and non-availability of specialists are binding. The existence of such a large number of vacancies in CHCs is obviously the greatest handicap in delivering specialised health care service to the rural people, for which these institutions were created.
Table 4.2
Availability and Shortfall of Specialists in Sample CHCs -1996
Specialists Required* Sanctioned In position %age shortfall of In-position against required
Surgeon 31 21 8 74.19 Obst. & Gynaecologist 31 25 12 61.29 Physician 31 17 6 80.65 Paediatrician 31 23 11 64.52 Total 124 86 37 70.16 Others** 0 70 76 -
Source : PEO, Survey.
* Required : One Specialist per Community Health Centre.
** Others : Include Doctors, like, Assistant Surgeons, Medical Officer, Senior Medical Officer, Eye Surgeons etc.,
4.3. An inter-state comparison of vacancies in various posts of specialists at the aggregate level reveals some interesting features. First, the States like, Orissa, Rajasthan and Tamil Nadu have sanctioned more posts of specialists (than required) in certain areas of specialization. It may be seen from Appendix Table 4.1 that Orissa has sanctioned 294 posts of Gynaecologists and 255 posts of Physicians against the requirement of 157 specialists in each of these two areas. Similarly, Rajasthan has sanctioned excess posts of Surgeons and Tamil Nadu has sanctioned a little over two times the number of Physicians required for its CHCs. In all the three States, the sanctioned posts in other areas of specialization are much less than the required. It is, however, not clear whether such abnormal deviations from “norms” are due to conscious decisions on the part of the State Governments.
4.3.4 Secondly, in the case of Haryana at the aggregate level, the number of sanctioned posts exactly equals the number required in each area of specialization. However, a different picture emerges in the case of 4 sample CHCs in the same State. As may be seen at Appendix Table 4.1, nearly 25 per cent of the posts of specialists have not been sanctioned.This mis-match is a matter of serious concern which needs to be looked into.
4.3.5 The deviations from the Central guidelines, as observed above, could be due to lack of resources with the States, non-availability of the required number of specialists and the decision of

the State governments to upgrade PHCs to CHCs rather than creating new CHCs. It is also important to understand as to why such deviations are occurring and how the relevant issues could be addressed.
Para Medical Staff
4.4.1 The scheme has laid down the norm that each CHC should be equipped with the required number of para-medical staff, such as, seven Nurse Mid-Wives (NMWs), one Compounder , one Laboratory Technician and one Radiographer. The availability, requirement and shortfall of these para-medical staff in 31 sample CHCs are presented in Table 4.3. It is observed in the case of para-medical staff that while the number of sanctioned posts of Nurse Mid-Wives, Dressers and Radiographers are less than their requirement, the sanctioned number of pharmacists and lab-technicians are in excess of their requirement. This is slightly in contrast with the picture that has emerged in the case of the medical specialists, where the sanctioned posts are generally less than their requirement.
Table 4.3
Availability and Shortfall of Para Medical (Technical) Staff in 31 Sample CHCs.
Para Medical (Technical) Required Sanctioned In -
position %age shortfall of In-Position against required
Nurse Mid-wive (NMW) 217 215 192 11.52 Dresser 31 29 26 16.13 Pharm./Compounder 31 77 65 -109.68 Laboratory Technician 31 50 42 -35.48 Radiographer 31 28 19 38.71 Total 341 399 344 -0.88
4.4.2 In the case of all categories of para-medical staff, there are vacancies against sanctioned posts. The extent of shortfall of para-medical staff vis-à-vis the prescribed norm of their requirement in the sample CHCs stood at 11.52 per cent for NMWs, 16.13 per cent for Dressers and 38.71 per cent for Radiographers respectively. Pharmacists and Laboratory Technicians, on the other hand, are in excess of requirement by 109.68 per cent and 35.48 per cent respectively.
4.4.3 CHC-wise details on availability and shortfall of para-medical staff in respect of selected States are given in Appendix Table 4.2. The variations in availability of para-medical staff vis-à-vis their requirement observed in sample CHCs tend to suggest that the central guidelines on posting of para-medical staff in CHCs are not being followed by the state Govts. This is likely to affect adversely the utilisation of health care services in CHCs.
Supporting Staff
4.5.1 The scheme has made the provision of supporting staff at each CHC, such as, two posts of Ward Boys, one Dhobi, three Sweepers and one Aya. The availability of supporting staff is presented in Table 4.4. It is seen from the table that except for Ward Boys, the posts of other supporting staff are sanctioned less than their requirement. However, the actual availability of all categories of supporting staff falls short of their sanctioned posts. The extent of shortfall in availability stood at 80.65% for Dhobies, 19.35% for Sweepers, 61.29% for Ayas and 47.31% for others.
Table 4.4
Availability and Shortfall of Supporting Staff in Sample CHCs.
Supporting Staff Required Sanctioned in position %age shortfall of In-
position against required

Ward Boys 62 143 130 -109.68 Dhobi 31 9 6 80.65 Sweeper 93 91 75 19.35 Aya 31 13 12 61.29 Others* 93 63 49 47.31 Total 310 319 272 12.26
* Others : Include Mali, Chowkidar and Peon.
4.5.2 The availability of Ward Boys, however, exceeds their requirement by 109.68 per cent. It is observed that the shortfall of Dhobies and Ayas is more pronounced as compared to others. The details of CHC-wise availability and shortfall of supporting staff are given in Appendix Table 4.3.
4.5.3 It may be pointed out that the shortage of medical and para-medical staff in the CHCs is a matter of serious concern as it may render the CHCs non-functional even in those where the necessary infrastructure exists.Nevertheless, the excess of supporting staff over their normative requirement is not to be encouraged.
Physical Facilities
4.6.1 One of the main objectives of the establishment of CHCs is to provide specialised health care services to both routine and referred cases. To meet this objective, the scheme has envisaged that, besides man-power, the CHCs should also be equipped with adequate health infrastructure including physical facilities, equipments and medicines so that the specialised health care services available in CHCs could be optimally utilised. The health infrastructure facilities in CHCs are complementary in nature, and non-availability of one or more such facilities could adversely affect the utilisation of health care services to be delivered in CHCs, even if the doctors, para-medical staff and other staff are in position.
4.6.2 Keeping this in view, the central guidelines have provided that the CHC as a referral centre should be well equipped with essential complementary facilities like, operation theater, labour room, pathology laboratory and safe drinking water. Besides, equipments including refrigerator, X-ray machine, ECG and generator are also to be provided in CHCs.
4.6.3 The availability of physical facilities in 31 sample CHCs is presented in Table 4.5. It is seen that the majority of the sample CHCs are having operation theatres, labour rooms, pathology laboratories and safe drinking water. Of the total sample CHCs, operation theatres and labour rooms were not available in 5 CHCs, pathology laboratories in 12 CHCs and safe drinking water in 9 CHCs.
Table 4.5
Sample CHCs functioning without Physical Facilities
CHCs Functioning Without: State CHCs Operation Theatre Labour
Room Pathology Laboratory Safe Drinking
Water Bihar 4 0 0 0 4 Haryana 4 1 1 0 0 Madhya Pradesh 4 1 0 1 3 Maharashtra 4 0 0 1 0 Orissa 4 1 3 3 0 Rajasthan 4 2 1 2 1 Tamil Nadu 4 0 0 4 1 Uttar Pradesh 3 0 0 1 0 Total 31 5 5 12 9 Percentage to Total 16.13 16.13 38.71 29.03
Equipments
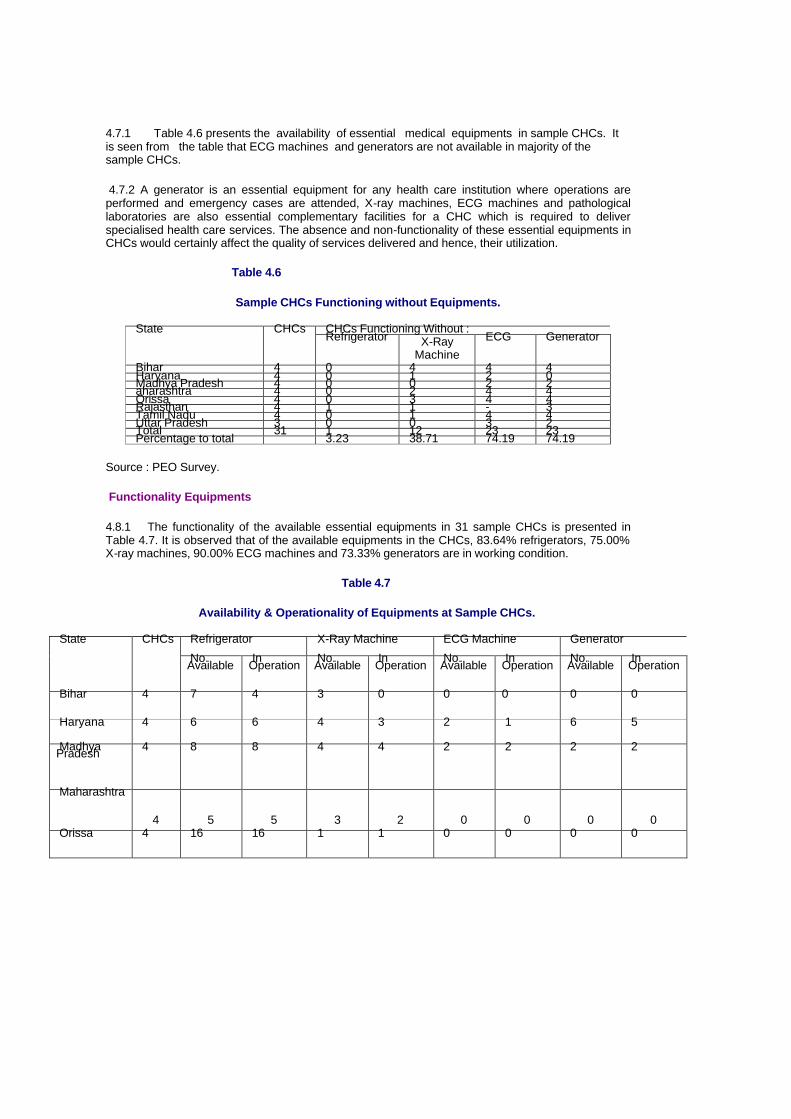
4.7.1 Table 4.6 presents the availability of essential medical equipments in sample CHCs. It is seen from the table that ECG machines and generators are not available in majority of the sample CHCs.
4.7.2 A generator is an essential equipment for any health care institution where operations are performed and emergency cases are attended, X-ray machines, ECG machines and pathological laboratories are also essential complementary facilities for a CHC which is required to deliver specialised health care services. The absence and non-functionality of these essential equipments in CHCs would certainly affect the quality of services delivered and hence, their utilization.
Table 4.6
Sample CHCs Functioning without Equipments.
CHCs Functioning Without : State CHCs Refrigerator X-Ray
Machine ECG Generator
Bihar 4 0 4 4 4 Haryana 4 0 1 2 0 Madhya Pradesh 4 0 0 2 2 aharashtra 4 0 2 4 4 Orissa 4 0 3 4 4 Rajasthan 4 1 1 - 3 Tamil Nadu 4 0 1 4 4 Uttar Pradesh 3 0 0 3 2 Total 31 1 12 23 23 Percentage to total 3.23 38.71 74.19 74.19
Source : PEO Survey.
Functionality Equipments
4.8.1 The functionality of the available essential equipments in 31 sample CHCs is presented in Table 4.7. It is observed that of the available equipments in the CHCs, 83.64% refrigerators, 75.00% X-ray machines, 90.00% ECG machines and 73.33% generators are in working condition.
Table 4.7
Availability & Operationality of Equipments at Sample CHCs.
Refrigerator X-Ray Machine ECG Machine Generator State CHCs No. Available In
Operation No. Available In
Operation No. Available In
Operation No. Available In
Operation
Bihar 4 7 4 3 0 0 0 0 0
Haryana 4 6 6 4 3 2 1 6 5
Madhya Pradesh 4 8 8 4 4 2 2 2 2
Maharashtra
4
5
5
3
2
0
0
0
0 Orissa 4 16 16 1 1 0 0 0 0

Rajasthan 4 3 2 3 3 6 6 3 3
Tamil Nadu 4 7 4 3 2 0 0 1 0
Uttar Pradesh 3 3 1 3 3 0 0 3 1
Total 31 55 46 24 18 10 9 15 11
Percentage to total
83.64 75.00 90.00 73.33
Source: PEO Survey.
Functioning of CHC
4.9.1 Delivery of specialised health care services requires not only the medical specialists but also all the complementary facilities including medical equipments, para-medical staff and other services. The absence and non-functionality of one or more of the complementary inputs affect the quality of services. However,the monitoring of the availability of each individual input at the aggregate level may often not reveal the quality and functionality of the delivery system in CHC.
4.9.2 To substantiate this point, an attempt is made to reveal the mis-match between specialists, physical facilities, equipments and other complementary staff. For the sake of clarity in exposition, the availability of essential complementary inputs/facilities required for each specialist to
deliver quality health care services is presented in Table 4.8 to 4.11.
Surgeon
4.10.1 Table 4.8 presents the availability of surgeons with complementary facilities in 31 sample CHCs. It is seen from the table that, of the 8 CHCs (25.18%) where specialist surgeons were available , the operation theatres were also available with them,but radiographers with X-ray machines and laboratory technicians with pathology laboratories were available only in 6 CHCs (75.00%) and 7 CHCs (87.50%) respectively. It is interesting to note that, among 31 sample CHCs, 26 CHCs have Operation Theatres, 19 CHCs have Pathology Laboratories and 20 CHCs have X-ray machines. Yet, some of the sample CHCs where specialists were available did not have some complementary facilities.
Table 4.8
Availability of Complementary Facilities in Sample CHCs with Surgeon.
CHCs having Surgeons also Equipped With : State Sample CHCs with Surgeons
Operation Theatre
Radiographer & X-Ray Machine
Lab Technician & Pathology Lab
Generator
Bihar 1 1 0 1 0 Haryana Nil NR NR NR NR Madhya Pradesh Nil NR NR NR NR Maharashtra 3 3 2 2 0 Orissa 1 1 1 1 0 Rajasthan 2 2 2 2 0 Tamil Nadu Nil NR NR NR NR

Uttar Pradesh 1 1 1 1 0 Total 8 8 6 7 0 Percentage to total 25.81 100.00 75.00 87.50 0.00
Source :PEO Survey
4.10.2 Inter-state comparison reveals that the Surgeons equipped with the necessary complementary facilities were available only in 6 CHCs falling in the states of Maharashtra(2), Orissa(1), Rajasthan(2) and Uttar Pradesh(1), whereas a mis-match between Surgeons and complementary facilities was observed in in rest of the CHCs. However, no Surgeon was posted in the sample CHCs of three states of Haryana, Madhya Pradesh and Tamil Nadu.
Gynaecologist
4.11.1 Table 4.9 presents the availability of Gynaecologist equipped with complementary facilities in sample CHCs. It is seen that of the 12 CHCs (38.71%) where Gynaecologists were in position , operation theatres or labour rooms were available in 11 CHCs (91.67%), Radiographers with X-ray machines in 8 CHCs (66.67%) and Laboratory technicians with Pathology laboratories in 6 CHCs (50.00%).
4.11.2 Inter-state comparison reveals that Gynaecologists with essential complementary facilities were available only in 6 CHCs falling in states of Maharashtra (2), Orissa (1), Rajasthan(2) and Uttar Pradesh (1), while the mis-match of health infrastructure was observed in the remaining 6 CHCs falling in the states of Orissa (3), Rajasthan (1) and Tamil Nadu (2).
Table 4.9
Availability of Complementary Facilities in Sample CHCs with Gynaecologists.
CHCs having Gynaecologists also Equipped With : State Sample CHCs with Gynaecologists
Operation Theatres or Labour Rooms
Radiographers & X-Ray Machines
Lab Technician & Pathology Labs
enerators
Bihar Nil NR NR NR NR Haryana Nil NR NR NR NR Madhya Pradesh
Nil NR NR NR NR
Maharashtra 2 2 2 2 0 Orissa 4 3 1 1 0 Rajasthan 3 3 2 2 1 Tamil Nadu 2 2 2 0 0 Uttar Pradesh 1 1 1 1 1 Total 12 11 8 6 2 Percentage to total
38.71 91.67 66.67 50.00 16.67
Physicians
4.12.1 Likewise, Table 4.10 presents the availability of Physicians equipped with essential complementary facilities in sample CHCs. The table reveals that, of the 6 CHCs (19.35%) where Specialist Physicians are available, the necessary combination of Radiographers with X-ray machines

is available in 5 CHCs (83.33%) and Laboratory Technicians with Pathology Laboratories are available in all the 6 CHCs .
Table-4.10
Availability of Complementary Facilities in Sample CHCs with Physician.
CHCs having Physicians also Equipped with : State Sample CHCs with Physician
Radiographer & X- Ray Machine
Lab Technician & Pathology Lab
Generator
Bihar 1 0 1 0 Haryana Nil NR NR NR Madhya Pradesh 1 1 1 1 Maharashtra 1 1 1 0 Orissa 1 1 1 0 Rajasthan 2 2 2 1 Tamil Nadu Nil NR NR NR Uttar Pradesh Nil NR NR NR Total 6 5 6 2 Percentage to total
19.35 83.33 100.00 33.33
4.12.2 Inter-state comparison reveals that the Physicians equipped with complementary facilities are available in 5 CHCs falling in the states of Madhya Pradesh (1), Maharashtra (1), Orissa (1) and Rajasthan (2).
Paediatrician
4.13.1 The availability of Paediatricians with complementary facilities is presented in Table 4.11. It is observed that, of the 11 CHCs (35.48%) where Paediatricians were in position, X-ray machines with Radiographers were available in 10 CHCs (90.91%), while Pathology laboratories with Laboratory Technicians were available in 8 CHCs (72.73%).
Table 4.11
Availability of Complementary Facilities in sample CHCs with Paediatricians.
CHCs having Paediatricians also Equipped with : State Sample CHCs with Paediatricians
Radiographers & X-Ray Machines
Lab Technicians & Pathology Labs
Generators
Bihar Nil NR NR NR Haryana Nil NR NR NR Madhya Pradesh 3 3 3 2 Maharashtra 2 2 2 0 Orissa 2 1 1 0 Rajasthan 2 2 2 0 Tamil Nadu 2 2 0 0 Uttar Pradesh Nil NR NR NR Total 11 10 8 2 Percentage to total 35.48 90.91 72.73 18.18

4.14.1 All this tends to suggest that not only there is an acute shortage of Specialists in every field of specialisation, but some of the available Specialists are also found to be inadequately equipped with the essential complementary facilities. Such a gloomy scenario of health infrastructure in the CHCs may have a strong bearing on the utilisation of their referral services..
Medicines
4.15.1 Availability of medicines is yet another factor that could influence the utilisation of CHCs as referral centres. Non-availability of medicines in CHCs would also have a bearing on the cost of health care services for the poor. To assess if the availability of medicines in the CHCs is satisfactory, the responses of 224 beneficiary patients are presented in table 4.13. Of the total sample beneficiary patients, it is observed that though medicines were prescribed to 99 per cent of the patients, 43 per cent of them did not get the prescribed medicines from the CHCs. Medicines were in short supply more in the case of five states of Bihar, Madhya Pradesh, Orissa and Uttar Pradesh, where majority of the sample beneficiary patients have not been able to get the medicines from the CHCs.
Table-4.12
Availability of Medicine at Sample CHCs.
Percentage of Beneficiaries : State Sample Beneficiary attended at CHCs
who were prescribed Medicines
for whom Medicine was not available at the Centre
Bihar 18 100 67 Haryana 32 100 6 Madhya Pradesh 32 100 72 Maharashtra 32 100 22 Orissa 32 97 66 Rajasthan 32 100 19 Tamil Nadu 32 97 22 Uttar Pradesh 14 100 79 Total 224 99 43
Observation
4.16.1 The analysis of the information on manpower and other complementary facilities collected from the 31 sample CHCs shows that most of the CHCs are not equipped to provide specialised health care services to patients. With the glaring gaps in availability of specialists, equipments, supporting staff and infrastructure, the CHCs cannot function as referral centres for PHCs, and therefore, cannot prevent the overcrowding in tertiary health care services in the District Headquarters and cities. As we shall see in the next chapter, the non-availability of specialists and inadequacy of infrastructure in CHCs are the major reasons for non-utilisation of their referral services.

Chapter 5
Utilisation of Helath Care Services
The utilisation of the services of CHCs depends primarily on the quality of services rendered by them. Other factors that may have a bearing on the utilization rate are the distance and location of the CHCs. Longer distance and inconvenient location can adversely affect utilisation. The quality of services rendered by CHCs is influenced by the availability of medical and para medical staff, and the availability and functionality of the infrastructure as proposed in the guidelines. The infrastructure includes all the physical facilities, viz; the building/rooms, operation threatre / labour room, arrangements for uninterrupted supply of water/electricity, medical equipments, pathology laboratories and the like.
5.1.2 It may, however, be pointed out right at the outset that, while availability and functionality of facilities are necessary to improve access to health care services of CHCs, their utilisation is likely to be greatly influenced by the ability of the CHCs to provide the complete package of complementary facilities required for specialised medical treatment. Non-availability of one or more elements of this package could adversely affect their utilisation. In the assessment of the functioning of CHCs, this aspect needs to be given its due importance for two reasons. First, in general, the facilities, like, X-ray, pathological tests and medical specialists are not available even in the private sector in areas where CHCs are located. Thus, even if some facilities for specialised treatment are available in the CHCs, the patients would prefer to go to towns/ cities where all complementary facilities are available. Secondly, this mis-match being the result of thin spread of resources, it is possible to make some CHCs (in each district) functional if the available resources including manpower and complementary facilities are used judiciously. This aspect has received attention in the strategy for implementation of the 9th Five Year Plan.
5.1.3 Keeping the above perspective in view, this chapter is designed to assess the rates of utilisation and to study the relationship between the quality of infrastructure of CHCs and their utilisation rates. Since CHCs are required to serve primarily as referral centres for the primary health care system, their utilisation rates have to be judged on the basis of the number of referral cases attended to by them.
Utilisation
5.2.1 The number of direct and referred cases attended to by the sample CHCs during 1995-96 in the eight selected states is presented in Appendix Table 5.1, while the number of referral cases attended to in sample CHCs is presented in Table 5.1. It is seen from Table 5.1 that the selected CHCs in Bihar, and Uttar Pradesh have not attended to any referral case, while the CHCs of other six States have attended some referred cases - both indoor and outdoor. However, there are variations in the number of referred cases attended across States and across CHCs within a State. The performance of the CHCs of Orissa and Tamil Nadu is better than those in other States. Even in the CHCs of these two better performing States, the number of referred cases attended is very low. On an average the number of referred cases attended by a CHC was 532 in Orissa and 393 in Tamil Nadu, while the overall average (across 31 CHCs) works out to 156 during 1995-96. In other words, an average CHC did not attend to even one referred case a day. Such a low utilization of CHC does not justify the existence of CHC as a referral institution.
Table 5.1 Number of Referral Cases attended by Sample CHCs.
Referral Cases attended by CHCs State Sample CHCs outdoor patient Indoor patient Total
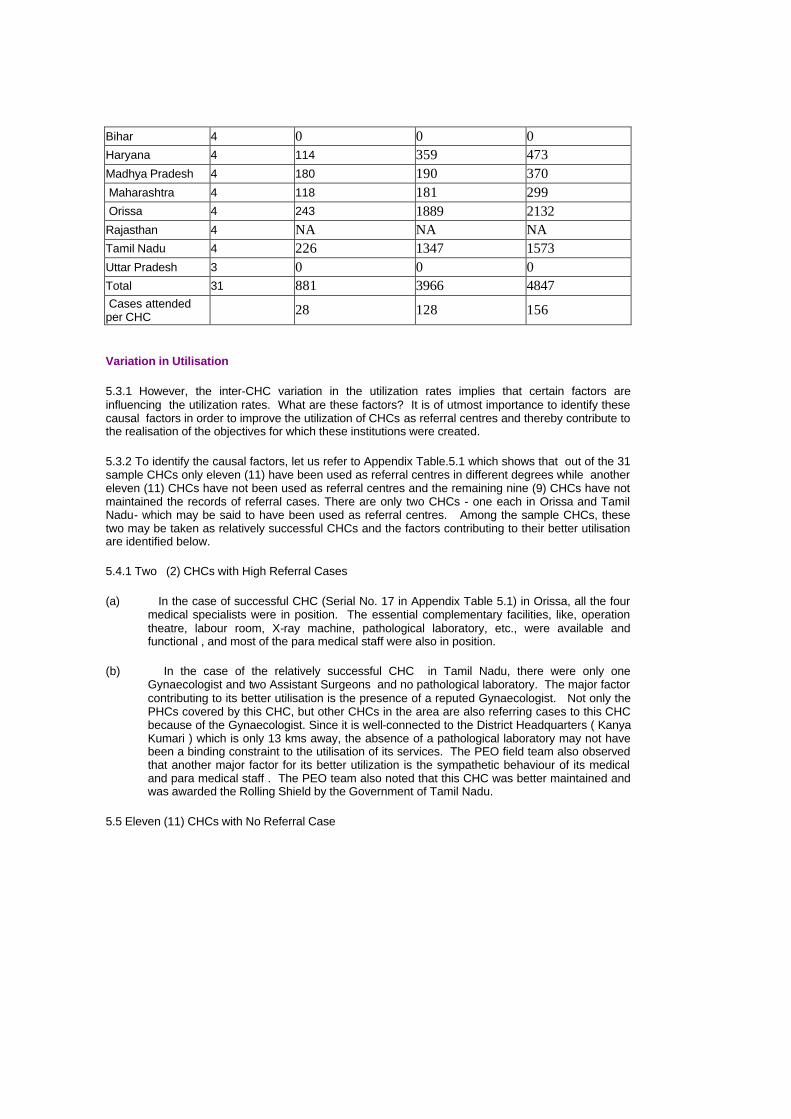
Bihar 4 0 0 0 Haryana 4 114 359 473 Madhya Pradesh 4 180 190 370 Maharashtra 4 118 181 299 Orissa 4 243 1889 2132 Rajasthan 4 NA NA NA Tamil Nadu 4 226 1347 1573 Uttar Pradesh 3 0 0 0 Total 31 881 3966 4847 Cases attended per CHC 28 128 156
Variation in Utilisation
5.3.1 However, the inter-CHC variation in the utilization rates implies that certain factors are influencing the utilization rates. What are these factors? It is of utmost importance to identify these causal factors in order to improve the utilization of CHCs as referral centres and thereby contribute to the realisation of the objectives for which these institutions were created.
5.3.2 To identify the causal factors, let us refer to Appendix Table.5.1 which shows that out of the 31 sample CHCs only eleven (11) have been used as referral centres in different degrees while another eleven (11) CHCs have not been used as referral centres and the remaining nine (9) CHCs have not maintained the records of referral cases. There are only two CHCs - one each in Orissa and Tamil Nadu- which may be said to have been used as referral centres. Among the sample CHCs, these two may be taken as relatively successful CHCs and the factors contributing to their better utilisation are identified below.
5.4.1 Two (2) CHCs with High Referral Cases
(a) In the case of successful CHC (Serial No. 17 in Appendix Table 5.1) in Orissa, all the four medical specialists were in position. The essential complementary facilities, like, operation theatre, labour room, X-ray machine, pathological laboratory, etc., were available and functional , and most of the para medical staff were also in position.
(b) In the case of the relatively successful CHC in Tamil Nadu, there were only one Gynaecologist and two Assistant Surgeons and no pathological laboratory. The major factor contributing to its better utilisation is the presence of a reputed Gynaecologist. Not only the PHCs covered by this CHC, but other CHCs in the area are also referring cases to this CHC because of the Gynaecologist. Since it is well-connected to the District Headquarters ( Kanya Kumari ) which is only 13 kms away, the absence of a pathological laboratory may not have been a binding constraint to the utilisation of its services. The PEO field team also observed that another major factor for its better utilization is the sympathetic behaviour of its medical and para medical staff . The PEO team also noted that this CHC was better maintained and was awarded the Rolling Shield by the Government of Tamil Nadu.
5.5 Eleven (11) CHCs with No Referral Case
5.5.1 Of the remaining 29 sample CHCs, the 11 CHCs falling in the States of Bihar (4), Uttar Pradesh (3), Orissa (2) and Tamil Nadu (2) did not attend to any referred case. The reasons for their non-utilisation are explained below:
(a) In the case of Bihar, in the first and second sample CHCs (Serial No.1 and 2 in Appendix Table 5.2), except one Medical Officer in each CHC, none of the four medical specialists was posted in both the CHCs. In the third sample CHC, except one Surgeon and one Medical Officer, the other three specialists in the field of medicine, Gynaecology and Paediatricians, were not available. As regards the complementary facilities, like, X-ray machines, Radiographers and generators were not available in all the sample CHCs, though other facilities , like, operation theatre, labour room, etc., were available . The PEO field team also observed that as the CHCs were ill-equipped with medical specialists and complementary facilities, like, X-ray machine, pathology laboratory, etc., the PHCs which were affiliated to these CHCs preferred to refer the cases to other Health Care Institutions.
(b) In the case of Uttar Pradesh, the non-availability of specialists was a constraint to utilization of services of CHCs. It was found that in the first sample CHC (Serial No. 29 in Appendix Table 5.2), neither the required specialists nor the other general practitioners were posted, though the essential complementary facilities were available. The PEO field team observed that in this CHC, one Ayurvedic lady doctor was engaged on part time basis at a fixed salary of Rs. 1800 per month. In the second sample CHC (Serial No. 30 in Appendix Table 5.2), only one Surgeon was posted, with all essential complementary facilities except pathology laboratory, while in the third CHC (Serial No. 31 in Appendix Table 5.2) only one Gynaecologist was in position, though all the essential complementary facilities were available.
(c) Besides, the PEO field team also observed that in the absence of Medical Specialists and other doctors, the CHCs in Uttar Pradesh were attending only direct cases and their services were found in no way better than those of the attached PHCs, except for the additional investigative facilities available in the CHCs, which remained under-utilised for want of availability of Medical specialists.
(d) In the case of Orissa , in the third sample CHC (Serial No. 19 in Appendix Table 5.1) except one Gynaecologist and two Medical Officers, the remaining medical specialists were not in position and the essential complementary facilities were also not available except one laboratory technician. Similarly, in fourth sample CHC (Serial No. 20 in Appendix Table 5.1) which did not attend to referral cases, except one Gynaecologist and two Medical officers, the other medical specialists were not in position and the essential complementary facilities were also not available except one operation threatre and one laboratory technician. Thus , in these two sample CHCs in Orissa, not only the medical specialists were not posted, but the essential complementary facilities were also not made available, which resulted in non-utilisation of the referral cases.
(e) In the case of Tamil Nadu, in one sample CHC (Serial No 25 in Appendix Table 5.2), except one Paediatrician and three Medical Officers, the other three specialists were not in position, though the complementary facilities were also made available except pathology laboratory and one laboratory technician.
(f) The PEO field team observed that even the utilisation of the services of Paediatrician was affected adversely due to non-availability of laboratory testing facilities. It was also observed by the field team that none of these available doctors resided in the residential accommodation allotted to them, though they had taken the possession of the accommodation. They preferred to stay in towns for the sake of children's education and private practice. This factor limits the availability of the doctors for emergency consultation in the CHC.

(g) In the second sample CHC (Serial No.26 in Appendix Table 5.1) except one qualified Gynaecologist and three other Medical Officers, the specialists in the field of medicine, surgery and paediatrics were not posted, though the essential complementary facilities except pathology laboratory were made available. Besides, the PEO field team noted that this CHC did not have any attached PHC and it functioned independently. However, a few cases like T.B patients who required prolonged treatment for whom the medicines were not available in the adjoining PHCs were only referred to this CHC. It was also observed by the PEO field team that of the four posted doctors, two were on long leave (surgeon for one year and the other doctor for three months). Of the remaining two, one was a lady doctor (General Practitioner) who attended to cases in O.P.D. in the morning only. It was further reported by the team that though a Gynaecologist with D.G.O. qualification was posted to this CHC recently on deputation, yet her services were not available for consultation at the CHC. It was further reported that the Gynaecologist did not reside in the quarters of the CHC and stayed in a nearby town where she was reported to have been running her own nursing home along with her husband. Therefore, the non-availability of a qualified Gynaecologist in the CHC on regular basis was a problem faced by the local population. Besides, in the case of high risk pregnancies, women were reluctant to avail themselves of the services of mid-wives.
5.5.2 Thus, non-availability of the specialists in full strength on the one hand and the absence of the posted doctors due to their long leave and their alleged engagement in private practice on the other, are also the contributory factors for non-utilization of the services of CHCs.
Constraints of CHCs with Nil Utilisation
5.6.1 The 11 sample CHCs which did not attend to the referral cases during 1995-96 and their constraints are summarised and presented in Table 5.2. It is observed that all the 11 CHCs faced the constraint of non-availability of specialists in varying degrees as none of these sample CHCs were found to be equipped with all the four specialists. Nine sample CHCs (81.82%) had the constraint of non-availability or non-functionality of investigative facilities, like, X-ray, Pathology laboratory, Radiographer, etc. Besides, inappropriate location of one CHC in Tamil Nadu was also one of the constraints identified in utilisation of referral services. Thus, the non-availability of specialists in varying degrees was noticed in all the 11 sample CHCs having nil utilisation, while the problem of non-availability or non-functionality of investigative facilities was noticed in 9 CHCs.
5.6.2 An inter-State comparison reveals that in eight sample CHCs, two each from the States of Bihar, Orissa, Tamil Nadu and Uttar Pradesh had only one specialist, while no specialist was posted in the other three sample CHCs falling in the States of Bihar (2) and Uttar Pradesh (`1).
5.6.3 As far as constraints related to investigative facilities are concerned, X-ray machines with Radiographers were not available in 6 sample CHCs falling in the States of Bihar (4) and Orissa (2), while pathology laboratories with lab technicians were not available in five CHCs falling in the States of Orissa (2), Tamil Nadu (2) and Uttar Pradesh (1).
Table 5.2 Distribution of 11 Sample CHCs without Referral Cases during 1995-96 according to type of Constraints.
No. of CHCs from the States of Type of Constraints Bihar Orissa Tamil Nadu Uttar Pradesh I. Non-availability of Specialists (a) All 4 Specialists not available 2 - - 1 (b) 3 Specialists not available 2 2 2 2

(c) 2 Specialists not available - - - - (d) 1 Specialist not available - - - - II. Non-availability/Non-functionality of Investigative Facilities
(a) X-Ray Machine with Radiographer 4 2 - - (b) Pathology Laboratory with Laboratory Technician - 2 2 1
(c) Both (a +b) - 2 - - III. Constraints not related to infrastructure (a) Inappropriate location of CHC - - - - (b) Doctors in position, but not available in CHCs - 1 - -
Sample CHCs 4 2 2 3
Eighteen (18) CHCs- 9 with Low Utilisation and 9 with no Record of Referral Cases.
5.7.1 Of the remaining 18 sample CHCs, 9 CHCs attended to some referral cases during 1995-96, while another 9 CHCs have not maintained the record of referral cases. The reasons for sub-optimum utilisation of these 18 CHCs from the selected States of Haryana, Uttar Pradesh, Maharashtra, Orissa, Rajasthan and Tamil Nadu are explained below:
(a) In the case of Haryana, the first sample CHC (Serial No. 5 in Appendix 5.1) attended to only 22 referred cases. Except two medical officers all the four specialists were not in position in the CHC. This CHC did not have the essential complementary facilities, except one Pathology laboratory and one generator. The second sample CHC (Serial No. 6 in Appendix 5.1) also attended to a few referred cases (12). Except four medical officers, no specialist was posted to the CHC. However, all the complementary facilities are made available except X-ray facility. The third sample CHC (Serial No.7 in Appendix 5.1) attended to 439 referred cases, which is the maximum among the four sample CHCs in Haryana. The CHC was equipped with seven medical officers and all essential complementary facilities, but has no specialist in position.
The PEO field team observed that this CHC was located in the town of Kalka which had been functioning as General Hospital before it was converted into a CHC.As a result quite a good number of doctors were posted there and adequate complementary facilities were also created. However, its utilization was low because of non-availability of specialists and existence of full fledged General Hospital in Panchkula which is located nearby.
Secondly, it was also observed that since Chandigarh was very near to this CHC, the people generally preferred to go to hospitals in the city which were equipped with specialised diagnostic and investigative facilities. The fourth sample CHC (Serial No. 8 in Table Appendx 5.1) did not maintain record of any referred cases. The CHC had five medical officers alongwith all complementary facilities, but there was no specialist in position.
The PEO field team observed that the CHC was not functioning as a referral centre because of two reasons: (a) non-availability of specialists and (b) its inconvenient location as the government hospital in Ambala City was nearer to the affiliated PHCs as compared to the present CHC for referral purposes.
Thus, it was observed that besides inconvenient location of CHC, the non-availability of specialists was the main reason for under and non-utilisation of referral services of CHCs in Haryana, as a result of which the heatlh infrastructure created remained under utilised.
(b) In the case of Madhya Pradesh, the sample CHCs (Serial No. 10 and 11 in Appendix Table 5.1) have not maintained the record of referred cases in an organised manner, though the PEO field team observed that these CHCs were attending to some cases referred by PHCs. In the second CHC (Appendix Table 5.2), except one specialist Paediatrician and three medical officers, the remaining three specialists were not posted, though the CHC has created all the complementary facilities. Two specialists, namely, Physician and Paediatrician and six medical officers were in position, but the specialists in the field of Surgery and Gynaecology were not posted. Among the complementary facilities, the operation theatre and pathology laboratory were also not made available in the CHC.
The other two sample CHCs i.e. first and fourth CHC (Serial at 9 and 12 in Appendix Table 5.1), however, attended to 110 and 260 referred cases respectively. In the first sample CHC (Serial No. 9 in Appendix Table 5.2), except one Paediatrician and two Medical Officers, the three specialists were not posted, though the CHC is found equipped with all the complementary facilities. In the fourth sample CHC (Serial No.12 in Table 5.2) except six Medical officers, all the four required specialists were not posted, however, the essential complementary facilities except generator were available.
The main reason for under-utilisation of referral services of CHCs in Madhya Pradesh was the non-availability of specialists, though other essential complementary facilities were made available in the CHCs.
(c) In the case of Maharashtra, the first and second sample CHCs (at Serial No.13 and 14 in Appendix Table 5.1) did not maintain the record of referral cases. However, the PEO field team noted that these CHCs were not functioning as referral centres due to two reasons (a) all the four Medical staff posted to sample CHC (Serial No.13 in Appendix Table 5.2) were reported to be practicing in the town and hence could hardly spare time for patients coming to CHC and (b) the sample CHC (at Serial No.14 in Appendix Table 5.2) was sanctioned in 1990, but no independent health infrastructure was created. Due to non-availability of the majority of the specialists and the required infrastructure, the cases referred to the CHC were further referred to District Hospital.
The third sample CHC (Serial No.15 in Appendix Table 5.1) attended to 149 referred cases. The CHC was having one Gynaecologist as specialist along awith 3 Medical Officers and the other three specialists were not posted. However,the essential complementary facilities were available.
The PEO field team observed that the CHC was functioning as a referral centre effectively, even though the three specialists in the field of Surgery, Medicine and Paediatrics were not in position. The cases relating to tubectomy operations, accident, injury, Anaemia, Gastro, etc., referred by PHCs were attended to in the CHC. Both indoor and outdoor patients were reported to have been referred to the CHC. Besides, the major surgery cases i.e. caesarian, hystrectomy, etc. were referred to and attended to in the CHC. The CHC was equipped with Anaesthetist as well. The field team further noted that the cooperation rendered by Voluntary Organisation and the excellent support by Panchayat Samiti in coordinating of the functions of the CHC also contributed to its success.
The fourth sample CHC (at Serial No. 16 in Appendix Table 5.1) attended to 151 cases during 1995-96. The three specialists, namely, Surgeon, Gynaecologist and Paediatrician along with one Medical Officer were in position, while the Physician was not posted in the
CHC (Appendix Table 5.2). Besides, all the essential complementary facilities were also available in the CHC. The PEO field team observed that the CHC was functioning effectively as a referral centre. It played a significant role in National Health Programmes and Family Welfare Programme. The factors which contributed to its successful functioning as referral centre were reported to be that (a) all the medical and para-medical staff were staying at CHC Headquarters, (b) qualified medical staff were available and (c) the location of CHC was convenient.
(d) In the case of Orissa, the sample CHC (at Serial No.18 in Appendix Table 5.1) attended to 225 referred cases. The two specialists, namely, Gynaecologist and Paediatrician were in position, while Surgeon and Physician were not posted in the CHC (Appendix Table 5.2). However, except the operation theatre and one laboratory technician, the essential complementary facilities were not available. Only one staff nurse was posted against the requirement of 7 nurses.
The PEO field team observed that the CHC was a partial success as a referral centre due to : (a) non-availability of full strength of specialists; (b) lack of laboratory and X-ray facilities and (c) lack of adequate para-medical staff.
(e) In the case of Rajasthan, all the four sample CHCs did not maintain the record of referral cases. However, the field team observed that the sample CHCs were attending to some referral cases, except the third sample CHC (at Serial No.23 in Appendix Table 5.2), which was found least equipped with specialists and complementary facilities.
(f) In the case of Tamil Nadu, one sample CHC (Serial No.28 in Appendix Table 5.1) attended to 489 referred cases. The under utilisation of referral services was mainly due to non-availability of specialists, namely, Surgeon, Gynaecologist and Physician. Besides, the non-availability of investigative facilities like, X-ray, Pathological tests etc. was also a constraint in providing referral services to the people.
Constraints of 18 CHCs with Low utilisation
5.8.1 The 18 sample CHCs with sub-optimum utilisation of referral services during 1995-96 and the constraints identified in these CHCs are summarised and presented in Table 5.3. Of the 18 sample CHCs, it is observed that except one sample CHC in Rajasthan (Serial No. 21 in Appendix Table 5.2) where all the four specialists were posted, the remaining 17 sample CHCs (94.44%) from the six selected States of Haryana (4), Madhya Pradesh (4), Maharashtra (4), Orissa (1), Rajasthan (3) and Tamil Nadu (1) faced the constraint of non-availability of specialists in varied degrees. As regards investigative facilities, of the 18 CHCs ,9 sample CHCs (50%) from the States of Haryana (1), Madhya Pradesh (1), Maharashtra (2), Orissa (1), Rajasthan (3) and Tamil Nadu (1) faced the constraint of non-availability or non-functionality of investigative facilities, like, X-Ray machine, Pathology laboratory, Radiographer, etc.
5.8.2 Besides, some CHCs also encountered constraints which were not related to infrastructure. For instance, the locations of 6 sample CHCs (33.33%) in the States of Haryana (3), Maharashtra (2) and Tamil Nadu (1) were not convenient to the affiliated PHCs, as the District Hospitals were found to be nearer to them than the CHCs for referral purposes. Two sample CHCs (11.11%) in the States of Maharashtra (1) and Tamil Nadu (1) faced the constraint of non-availability of the services of posted doctors due to their engagement in private practising.
5.8.3 This suggests that the constraint of non-availability of specialists was identified as the major reason for under-utilisation (in 17 CHCs, 94.44%), followed by non-availability or non-functionality of investigative facilities (in 9 CHCs, 50%), inconvenient location ( in 6 CHCs, 33.33%) and non-availability of services of in-position doctors (in 2 CHCs, 11.11%).
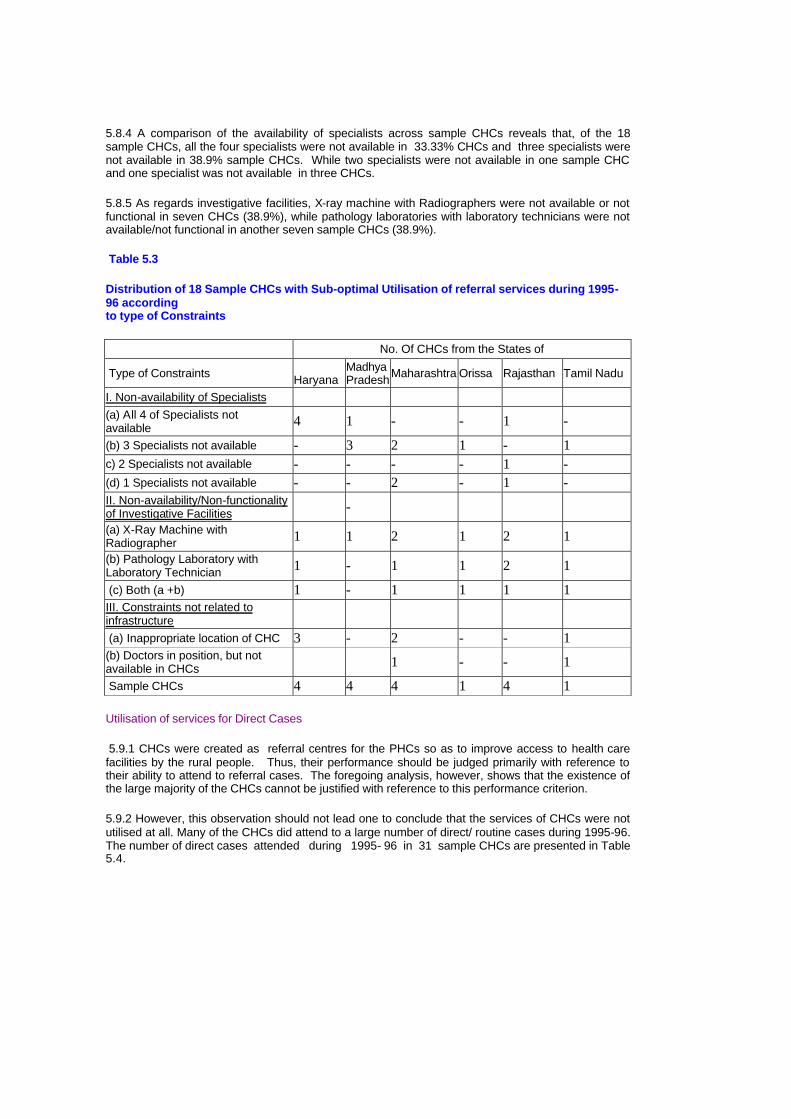
5.8.4 A comparison of the availability of specialists across sample CHCs reveals that, of the 18 sample CHCs, all the four specialists were not available in 33.33% CHCs and three specialists were not available in 38.9% sample CHCs. While two specialists were not available in one sample CHC and one specialist was not available in three CHCs.
5.8.5 As regards investigative facilities, X-ray machine with Radiographers were not available or not functional in seven CHCs (38.9%), while pathology laboratories with laboratory technicians were not available/not functional in another seven sample CHCs (38.9%).
Table 5.3
Distribution of 18 Sample CHCs with Sub-optimal Utilisation of referral services during 1995-96 according to type of Constraints
No. Of CHCs from the States of
Type of Constraints Haryana
Madhya Pradesh Maharashtra Orissa Rajasthan Tamil Nadu
I. Non-availability of Specialists (a) All 4 of Specialists not available 4 1 - - 1 -
(b) 3 Specialists not available - 3 2 1 - 1 c) 2 Specialists not available - - - - 1 - (d) 1 Specialists not available - - 2 - 1 - II. Non-availability/Non-functionality of Investigative Facilities -
(a) X-Ray Machine with Radiographer 1 1 2 1 2 1
(b) Pathology Laboratory with Laboratory Technician 1 - 1 1 2 1
(c) Both (a +b) 1 - 1 1 1 1 III. Constraints not related to infrastructure
(a) Inappropriate location of CHC 3 - 2 - - 1 (b) Doctors in position, but not available in CHCs 1 - - 1
Sample CHCs 4 4 4 1 4 1
Utilisation of services for Direct Cases
5.9.1 CHCs were created as referral centres for the PHCs so as to improve access to health care facilities by the rural people. Thus, their performance should be judged primarily with reference to their ability to attend to referral cases. The foregoing analysis, however, shows that the existence of the large majority of the CHCs cannot be justified with reference to this performance criterion.
5.9.2 However, this observation should not lead one to conclude that the services of CHCs were not utilised at all. Many of the CHCs did attend to a large number of direct/ routine cases during 1995-96. The number of direct cases attended during 1995- 96 in 31 sample CHCs are presented in Table 5.4.
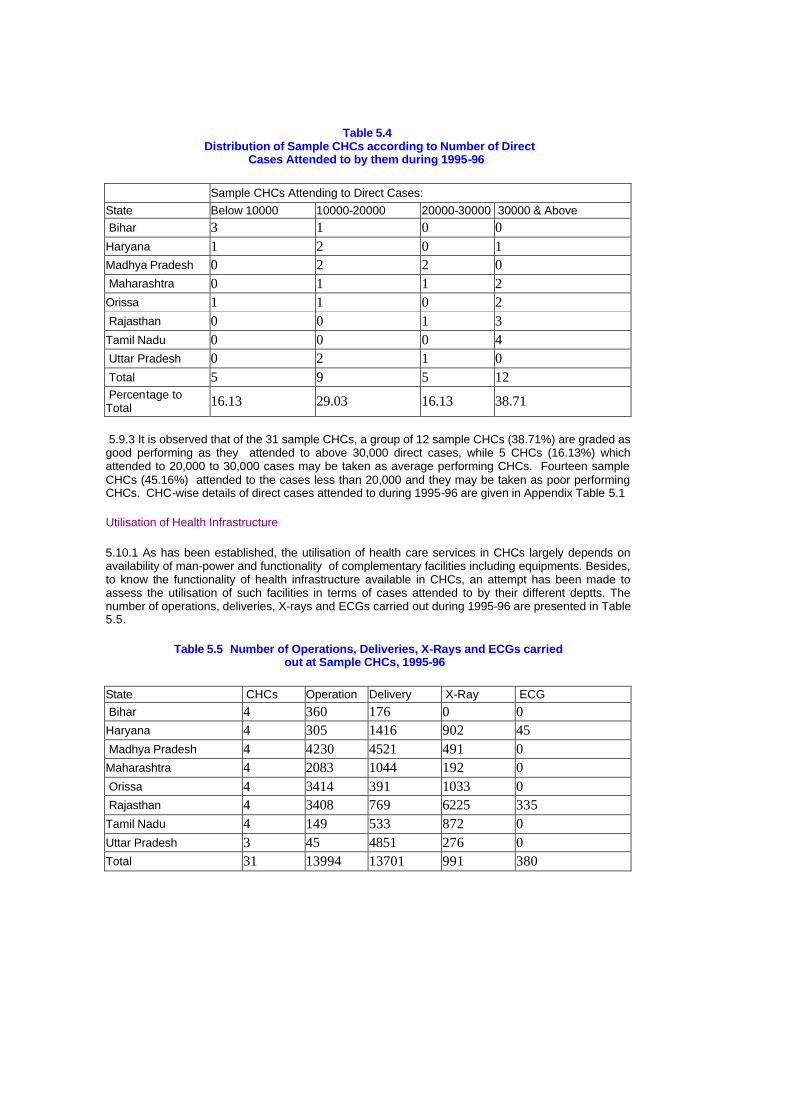
Table 5.4 Distribution of Sample CHCs according to Number of Direct
Cases Attended to by them during 1995-96
Sample CHCs Attending to Direct Cases: State Below 10000 10000-20000 20000-30000 30000 & Above Bihar 3 1 0 0 Haryana 1 2 0 1 Madhya Pradesh 0 2 2 0 Maharashtra 0 1 1 2 Orissa 1 1 0 2 Rajasthan 0 0 1 3 Tamil Nadu 0 0 0 4 Uttar Pradesh 0 2 1 0 Total 5 9 5 12 Percentage to Total 16.13 29.03 16.13 38.71
5.9.3 It is observed that of the 31 sample CHCs, a group of 12 sample CHCs (38.71%) are graded as good performing as they attended to above 30,000 direct cases, while 5 CHCs (16.13%) which attended to 20,000 to 30,000 cases may be taken as average performing CHCs. Fourteen sample CHCs (45.16%) attended to the cases less than 20,000 and they may be taken as poor performing CHCs. CHC-wise details of direct cases attended to during 1995-96 are given in Appendix Table 5.1
Utilisation of Health Infrastructure
5.10.1 As has been established, the utilisation of health care services in CHCs largely depends on availability of man-power and functionality of complementary facilities including equipments. Besides, to know the functionality of health infrastructure available in CHCs, an attempt has been made to assess the utilisation of such facilities in terms of cases attended to by their different deptts. The number of operations, deliveries, X-rays and ECGs carried out during 1995-96 are presented in Table 5.5.
Table 5.5 Number of Operations, Deliveries, X-Rays and ECGs carried out at Sample CHCs, 1995-96
State CHCs Operation Delivery X-Ray ECG Bihar 4 360 176 0 0 Haryana 4 305 1416 902 45 Madhya Pradesh 4 4230 4521 491 0 Maharashtra 4 2083 1044 192 0 Orissa 4 3414 391 1033 0 Rajasthan 4 3408 769 6225 335 Tamil Nadu 4 149 533 872 0 Uttar Pradesh 3 45 4851 276 0 Total 31 13994 13701 991 380
5.10.2 In the case of operations, the figures also include the cases related to permanent methods of family planning. It is observed that a maximum number of 4230 operations were carried out by sample CHCs in Madhya Pradesh, while a minimum of 45 cases were attended to in Uttar Pradesh. In the case of deliveries, the maximum of 4851 cases were attended to in Uttar Pradesh and the minimum of 391 cases were attended to in Orissa during 1995-96.
5.10.3 In the case of X-rays, Rajasthan attended to a maximum of 6225 cases, while the minimum of 192 cases were reported from Maharashtra. However, only two states of Haryana and Rajasthan carried out ECGs and the figures for which are 45 and 335 respectively. The CHC-wise details are given in Appendix Table 5.3.
5.10.4 It is observed from Appendix Table 5.3 that a maximum of 2613 operations were carried out by one sample CHC (Serial No. 22 in Appendix 5.3) in Rajasthan. The contributing factor for the high number of cases of operations as noted in the CHC was the availability of two specialists and six doctors. While the reasons for a maximum of 2965 deliveries carried out in another sample CHC (Serial No. 11 in Appendix 5.3) in Madhya Pradesh include the availability of two specialists and six doctors in the CHC. Similarly, the reason for highest number of X-rays (4425) carried out in the sample CHC (Serial No. 21 in Appendix 5.3) in Rajasthan was the availability of four specialists and three doctors, besides the availability of well equipped X-ray facility. This all tends to suggest that utilisation of health infrastructure depends on the functionality of the available equipments and physical facilities.
Chapter 6
Family Welfare and National Health Programmes - Role of CHCs
6.1.1 Though the main objective of the CHC is to function as a referral centre for PHCs, its functions also include the implementation of Family Welfare and National Health Programme in the rural areas.
6.1.2 The Family Welfare performance indices of 31 sample CHCs in the eight selected states are given in Appendix Table 6.1. It is observed that there are wide variations in the number of adoption of family planning methods (both permanent and temporary) and the cases treated under Mother Child Health Care (MCH) activities across selected states during 1995-96.
Family Planning Methods:
6.2.1 The performance of sample CHCs in regard to Family Planning methods is as under:
(a) In the case of sterlisation, of the eight sample states, the Sample CHCs of Madhya Pradesh treated the maximum number of 3905 cases during 1995-96, while those of Bihar has attended the minimum of 696 cases.
(b) In the case of IUD insertions, the sample CHCs of Madhya Pradesh attended a maximum of 13,420 cases, while those of Maharashtra attended a minimum of 654 cases during 1995-96.
(c) In the case of CC users, again the sample CHCs of Madhya Pradesh covered a maximum of 19024 cases, while a minimum of 908 cases were covered by those of Bihar.
(d) In the case of Oral pills, the sample CHCs of Uttar Pradesh covered a maximum of 8173 cases, while a lowest of 803 cases were covered by those of Maharashtra.
6.2.2 Therefore, it can be said that the sample CHCs in Madhya Pradesh have made a significant contribution in implementation of family planning methods (both permanent and temporary), while the CHCs in Bihar and Maharashtra lagged far behind in this sphere.
Mother Child Health Care (MCH) Activities
6.3.1 In the case of MCH activities also, Madhya Pradesh appears to be a good performing state, while Maharashtra a poor performing state in terms of the number of cases attended by the sample CHCs under the programme.
6.3.2 As seen in appendix Table 6.1, Madhya Pradesh has attended 23084 cases of tetanus immunisation for expectant mothers, 36858 DPT immunisation, 36746 Polio, 23898 BCG and 23762 D.T. immunisation for Children. In addition, they have attended to 22937 T.T. for ten years and 17115 T.T. for 16 years,which are the maximum cases attended as compared to other sample states during 1995-96. Whereas, Maharashtra has attended 2721 cases of DPT immunisation, 2721 Polio, 2762 BCG and 2676 Measles.
6.3.3 Besides, as compared to other states, Uttar Pradesh also figures as a good performing state in attending the highest number of cases of oral pills (8173), Measles (12563), prophylaxis against nutritional anemia among women (18711) and Prophylaxis against blindness due to vitamin A deficiency - 1st does (17397), while Bihar remained a poor performing state in attending the lowest number of cases T.T. for 16 years (180) and Prophylaxis against blindness due to vitamin A deficiency in second and fifth dose (2636) during 1995-96.
6.3.4. In terms of the number of cases attended, the sample CHCs of Madhya Pradesh seem to be the best performers in implementing the MCH activities. However, in the case of the sample CHCs of

the other selected states, the variation in performance with regard to the different activities under MCH were such that it was hardly possible to make any meaningful comparison among them.
6.3.5 The reasons for variations in their performance in different activities of the Family Welfare Programme are explained below:
(i) In the case of Madhya Pradesh, the availability of 17 doctors in addition to four specialists could be the contributing factor for better performance of Family Welfare Programme (Appendix 5.2).
(ii) In the case of Uttar Pradesh, the availability of 75 nurse Mid-wives (NMWs) against the requirement of 21 Nurses in three sample CHCs could be the main reason for successful implementation of some of the Family Welfare Programmes (see Appendix 4.2).
(iii) In the case of Bihar, the non-availability of Gynaecologist and lack of required para-medical staff specially nurses could be the constraints in implementation of Family Welfare Programmes (Appendix 5.2 and Appendix 4.2).
National Health Programme
6.4.1 The availability and timely supply of essential medicines under National Health Programme in 31 sample CHCs of eight selected States during 1995-96 are given in Appendix Table 6.2.
(a) In the case of National Leprosy Eradication Programme, the medicines were available and supplied in time in 41.93% of sample CHCs. The inter-state comparison of sample CHCs reveals that in all the sample CHCs of Madhya Pradesh and Maharashtra medicines were made available in time, while medicines were not made available to any of the CHCs of Orissa, Tamil Nadu and Uttar Pradesh.
(b) In the case of National Malaria Eradication Programme (NMEP), the essential medicines were made available and supplied in time in all the sample CHCs of the selected States, except in one sample CHC in Tamil Nadu, where medicines though made available, were not supplied..
(c) In the case of National Blindness Control Programme (NBCP), it is reported that the medicines were available in 70.97 per cent of sample CHCs, while their timely supply was reported in 64.52 per cent CHCs. Inter-state comparison shows that in the sample CHCs of from Madhya Pradesh, Maharashtra and Uttar Pradesh the medicines were both available and supplied in time. However, the medicines were not available in the sample CHCs of Orissa.
(d) In the case of National Tuberculosis Control Programme (NTCP), the medicines were available only in 96.77 per cent of sample CHCs, while they were supplied in time in 80.65 per cent CHCs. In the sample CHCs of Madhya Pradesh, Maharashtra, Rajasthan and Uttar Pradesh the medicines were both available and supplied in time.
(e) In the case of National Cancer Control Programme (NCCP), the medicines were made available and supplied in time only in two sample CHCs, one each from Madhya Pradesh and Maharasthra. While, in majority of sample CHCs (93.55%), the medicines were not available.

Chapter - 7 The Utility of CHCs - Beneficiaries' views
7.1.1 The analysis in the preceding chapters tends to suggest that the potential of CHCs as referral centre has not been realised because of inadequacies in planning and implementation. However, this inference is drawn by analysing primarily the supply side factors influencing the accessibility of services of CHCs. It is not clear as to whether there is adequate demand for the services intended to be delivered through CHCs. In chapters 3 and 5, where the variations in utilisation rates across sample CHCs were analysed, it was noted that, while the extent of use of services could be explained reasonably well by factors on the supply side, the fact that a large number of people are utilising such services, despite inadequacies in the delivery system needs further explanation. This would help identify the extent and nature of demand for such services
7.1.2 It is with this objective that an attempt is made in this chapter to analyse the views expressed by the CHC-beneficiaries about the potentials of CHCs and the constraints being faced by them.
Views of Beneficiaries
7.2.1 The sample (224) beneficiaries were asked to express their views on the quality of services they were receiving from the CHCs and on the reasons for dissatisfaction, if any. A little more than 43 per cent of the beneficiaries were satisfied, while the remaining 57 per cent were either dissatisfied or, partially satisfied (Table 7.1). Among the latter, only about 11 per cent were not satisfied at all. In other words, a little less than 90 per cent of the beneficiaries did receive some benefit from the CHCs, though majority of them were not fully satisfied. This clearly brings home the point that there is demand for the services intended to be delivered through CHCs. As has already been established in Chapter 3 and 5, the dissatisfaction stems from the inadequacies in the delivery system.
Table 7.1
Sample Beneficiaries Reporting about Level of Satisfaction with the Quality of Services Provided at CHCs.
Level of Satisfaction State CHCs No. of Sample Beneficiaries Satisfied Somewhat
satisfied Not
satisfied Bihar 4 18 6 3 9 Haryana 4 32 30 2 0 Madhya Pradesh 4 32 4 21 7 Maharashtra 4 32 16 14 2 Orissa 4 32 5 25 2 Rajasthan 4 32 16 12 4 Tamil Nadu 4 32 17 15 0
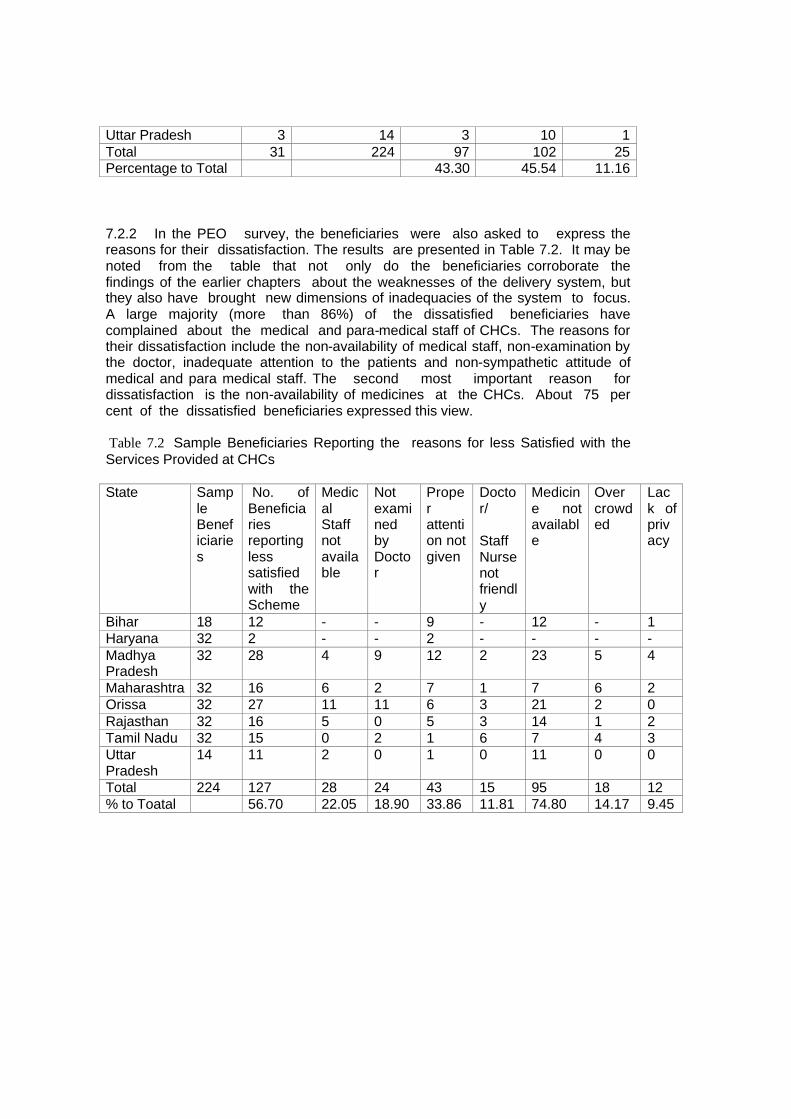
Uttar Pradesh 3 14 3 10 1 Total 31 224 97 102 25 Percentage to Total 43.30 45.54 11.16
7.2.2 In the PEO survey, the beneficiaries were also asked to express the reasons for their dissatisfaction. The results are presented in Table 7.2. It may be noted from the table that not only do the beneficiaries corroborate the findings of the earlier chapters about the weaknesses of the delivery system, but they also have brought new dimensions of inadequacies of the system to focus. A large majority (more than 86%) of the dissatisfied beneficiaries have complained about the medical and para-medical staff of CHCs. The reasons for their dissatisfaction include the non-availability of medical staff, non-examination by the doctor, inadequate attention to the patients and non-sympathetic attitude of medical and para medical staff. The second most important reason for dissatisfaction is the non-availability of medicines at the CHCs. About 75 per cent of the dissatisfied beneficiaries expressed this view.
Table 7.2 Sample Beneficiaries Reporting the reasons for less Satisfied with the Services Provided at CHCs
State Sample Beneficiaries
No. of Beneficiaries reporting less satisfied with the Scheme
Medical Staff not available
Not examined by Doctor
Proper attention not given
Doctor/
Staff Nurse not friendly
Medicine not available
Over crowded
Lack of privacy
Bihar 18 12 - - 9 - 12 - 1 Haryana 32 2 - - 2 - - - - Madhya Pradesh
32 28 4 9 12 2 23 5 4
Maharashtra 32 16 6 2 7 1 7 6 2 Orissa 32 27 11 11 6 3 21 2 0 Rajasthan 32 16 5 0 5 3 14 1 2 Tamil Nadu 32 15 0 2 1 6 7 4 3 Uttar Pradesh
14 11 2 0 1 0 11 0 0
Total 224 127 28 24 43 15 95 18 12 % to Toatal 56.70 22.05 18.90 33.86 11.81 74.80 14.17 9.45
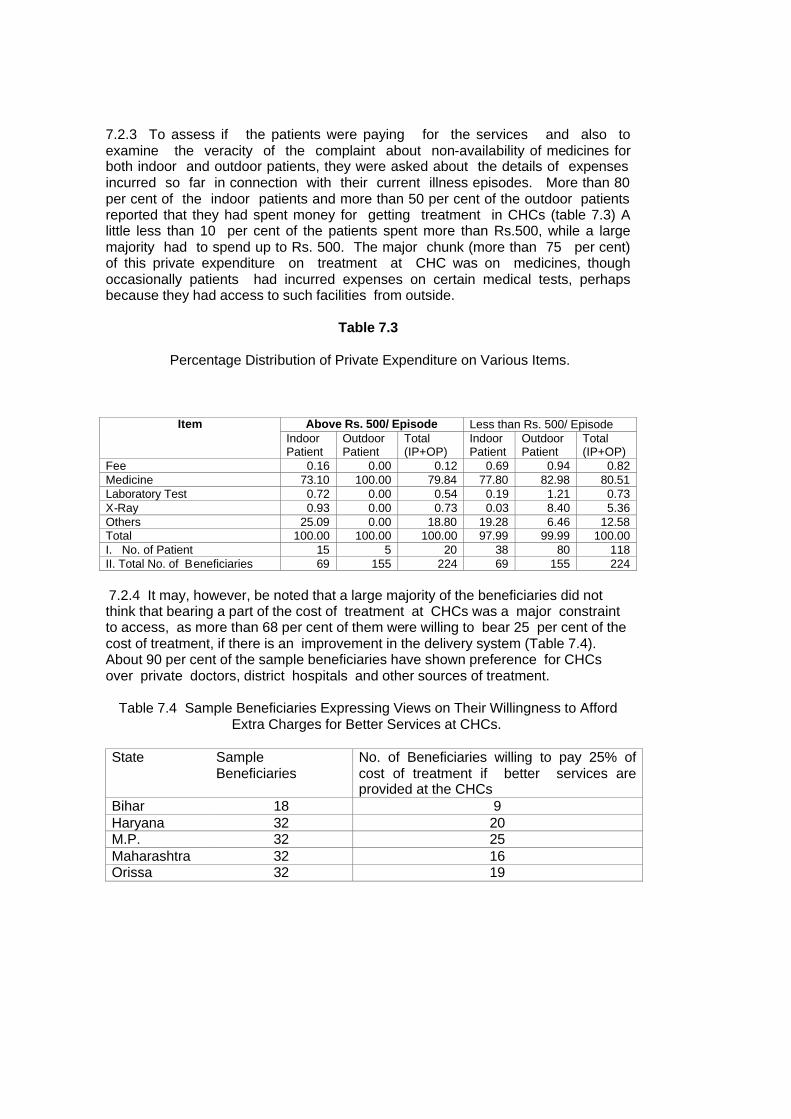
7.2.3 To assess if the patients were paying for the services and also to examine the veracity of the complaint about non-availability of medicines for both indoor and outdoor patients, they were asked about the details of expenses incurred so far in connection with their current illness episodes. More than 80 per cent of the indoor patients and more than 50 per cent of the outdoor patients reported that they had spent money for getting treatment in CHCs (table 7.3) A little less than 10 per cent of the patients spent more than Rs.500, while a large majority had to spend up to Rs. 500. The major chunk (more than 75 per cent) of this private expenditure on treatment at CHC was on medicines, though occasionally patients had incurred expenses on certain medical tests, perhaps because they had access to such facilities from outside.
Table 7.3
Percentage Distribution of Private Expenditure on Various Items.
Above Rs. 500/ Episode Less than Rs. 500/ Episode Item Indoor Patient
Outdoor Patient
Total (IP+OP)
Indoor Patient
Outdoor Patient
Total (IP+OP)
Fee 0.16 0.00 0.12 0.69 0.94 0.82 Medicine 73.10 100.00 79.84 77.80 82.98 80.51 Laboratory Test 0.72 0.00 0.54 0.19 1.21 0.73 X-Ray 0.93 0.00 0.73 0.03 8.40 5.36 Others 25.09 0.00 18.80 19.28 6.46 12.58 Total 100.00 100.00 100.00 97.99 99.99 100.00 I. No. of Patient 15 5 20 38 80 118 II. Total No. of Beneficiaries 69 155 224 69 155 224
7.2.4 It may, however, be noted that a large majority of the beneficiaries did not think that bearing a part of the cost of treatment at CHCs was a major constraint to access, as more than 68 per cent of them were willing to bear 25 per cent of the cost of treatment, if there is an improvement in the delivery system (Table 7.4). About 90 per cent of the sample beneficiaries have shown preference for CHCs over private doctors, district hospitals and other sources of treatment.
Table 7.4 Sample Beneficiaries Expressing Views on Their Willingness to Afford Extra Charges for Better Services at CHCs.
State Sample Beneficiaries
No. of Beneficiaries willing to pay 25% of cost of treatment if better services are provided at the CHCs
Bihar 18 9 Haryana 32 20 M.P. 32 25 Maharashtra 32 16 Orissa 32 19
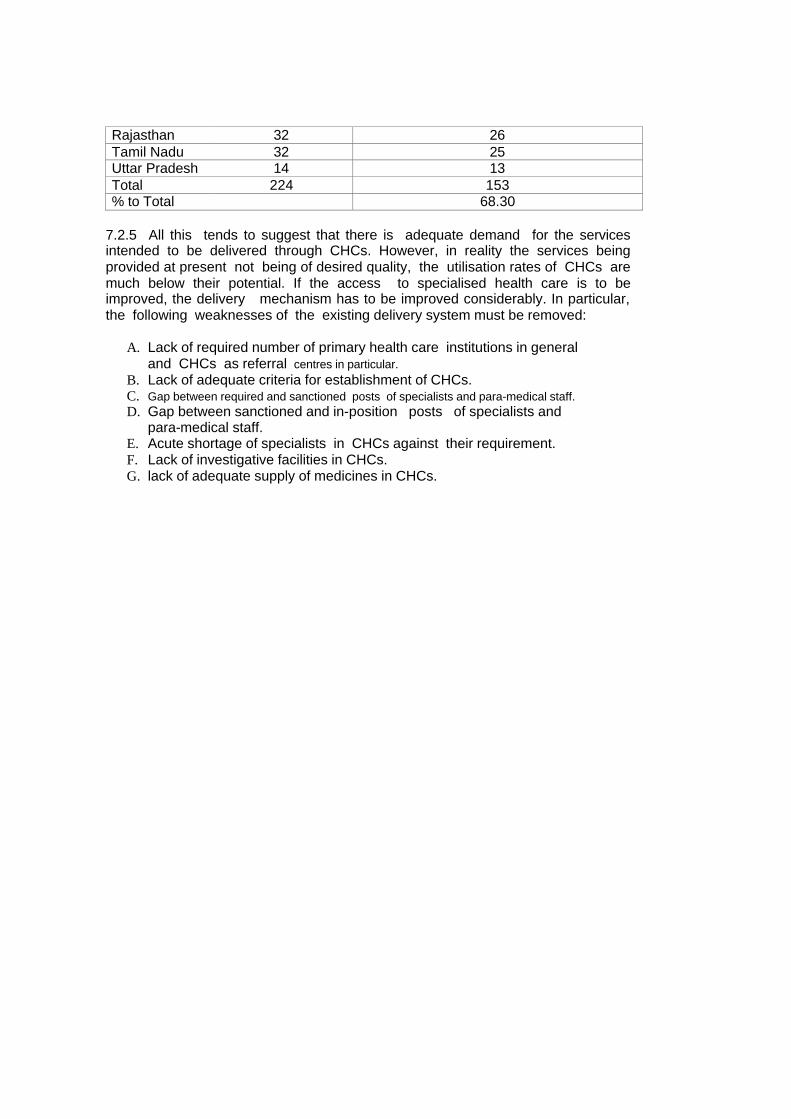
Rajasthan 32 26 Tamil Nadu 32 25 Uttar Pradesh 14 13 Total 224 153 % to Total 68.30
7.2.5 All this tends to suggest that there is adequate demand for the services intended to be delivered through CHCs. However, in reality the services being provided at present not being of desired quality, the utilisation rates of CHCs are much below their potential. If the access to specialised health care is to be improved, the delivery mechanism has to be improved considerably. In particular, the following weaknesses of the existing delivery system must be removed:
A. Lack of required number of primary health care institutions in general and CHCs as referral centres in particular.
B. Lack of adequate criteria for establishment of CHCs. C. Gap between required and sanctioned posts of specialists and para-medical staff. D. Gap between sanctioned and in-position posts of specialists and
para-medical staff. E. Acute shortage of specialists in CHCs against their requirement. F. Lack of investigative facilities in CHCs. G. lack of adequate supply of medicines in CHCs.
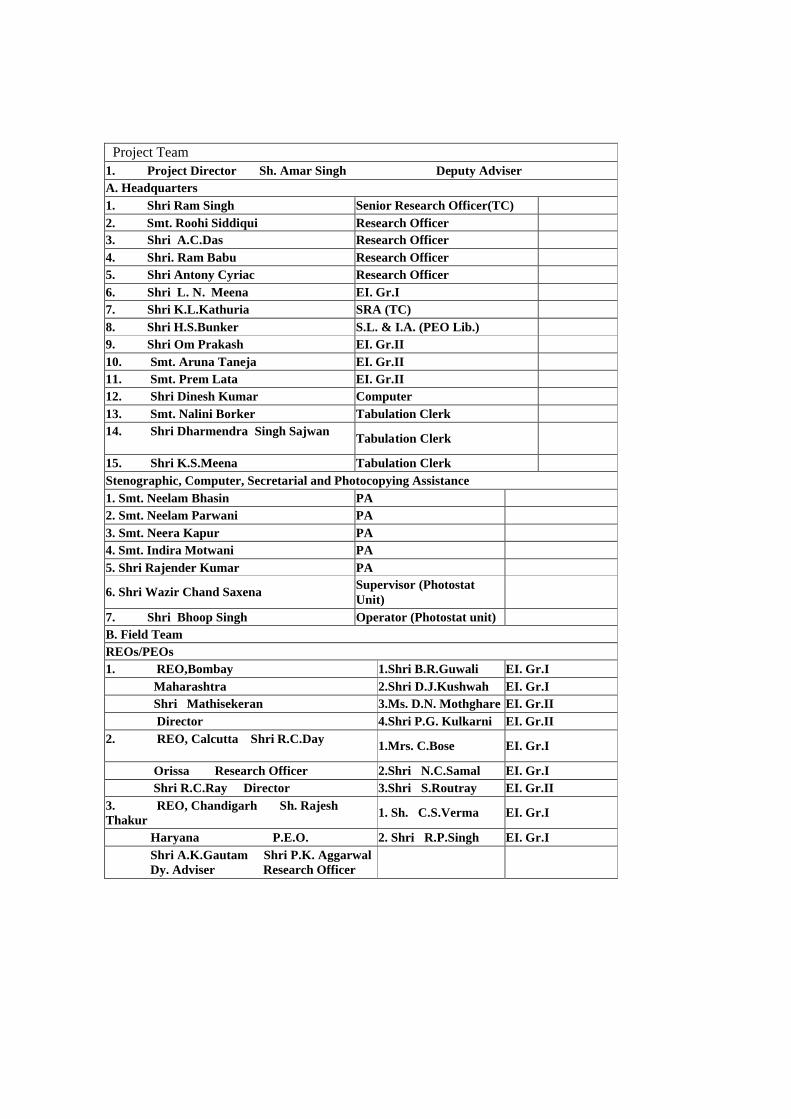
Project Team 1. Project Director Sh. Amar Singh Deputy Adviser A. Headquarters 1. Shri Ram Singh Senior Research Officer(TC) 2. Smt. Roohi Siddiqui Research Officer 3. Shri A.C.Das Research Officer 4. Shri. Ram Babu Research Officer 5. Shri Antony Cyriac Research Officer 6. Shri L. N. Meena EI. Gr.I 7. Shri K.L.Kathuria SRA (TC) 8. Shri H.S.Bunker S.L. & I.A. (PEO Lib.) 9. Shri Om Prakash EI. Gr.II 10. Smt. Aruna Taneja EI. Gr.II 11. Smt. Prem Lata EI. Gr.II 12. Shri Dinesh Kumar Computer 13. Smt. Nalini Borker Tabulation Clerk 14. Shri Dharmendra Singh Sajwan
Tabulation Clerk
15. Shri K.S.Meena Tabulation Clerk Stenographic, Computer, Secretarial and Photocopying Assistance 1. Smt. Neelam Bhasin PA 2. Smt. Neelam Parwani PA 3. Smt. Neera Kapur PA 4. Smt. Indira Motwani PA 5. Shri Rajender Kumar PA
6. Shri Wazir Chand Saxena Supervisor (Photostat Unit)
7. Shri Bhoop Singh Operator (Photostat unit) B. Field Team REOs/PEOs 1. REO,Bombay 1.Shri B.R.Guwali EI. Gr.I Maharashtra 2.Shri D.J.Kushwah EI. Gr.I Shri Mathisekeran 3.Ms. D.N. Mothghare EI. Gr.II Director 4.Shri P.G. Kulkarni EI. Gr.II 2. REO, Calcutta Shri R.C.Day
1.Mrs. C.Bose EI. Gr.I
Orissa Research Officer 2.Shri N.C.Samal EI. Gr.I Shri R.C.Ray Director 3.Shri S.Routray EI. Gr.II 3. REO, Chandigarh Sh. Rajesh Thakur
1. Sh. C.S.Verma EI. Gr.I
Haryana P.E.O. 2. Shri R.P.Singh EI. Gr.I Shri A.K.Gautam Shri P.K. Aggarwal Dy. Adviser Research Officer
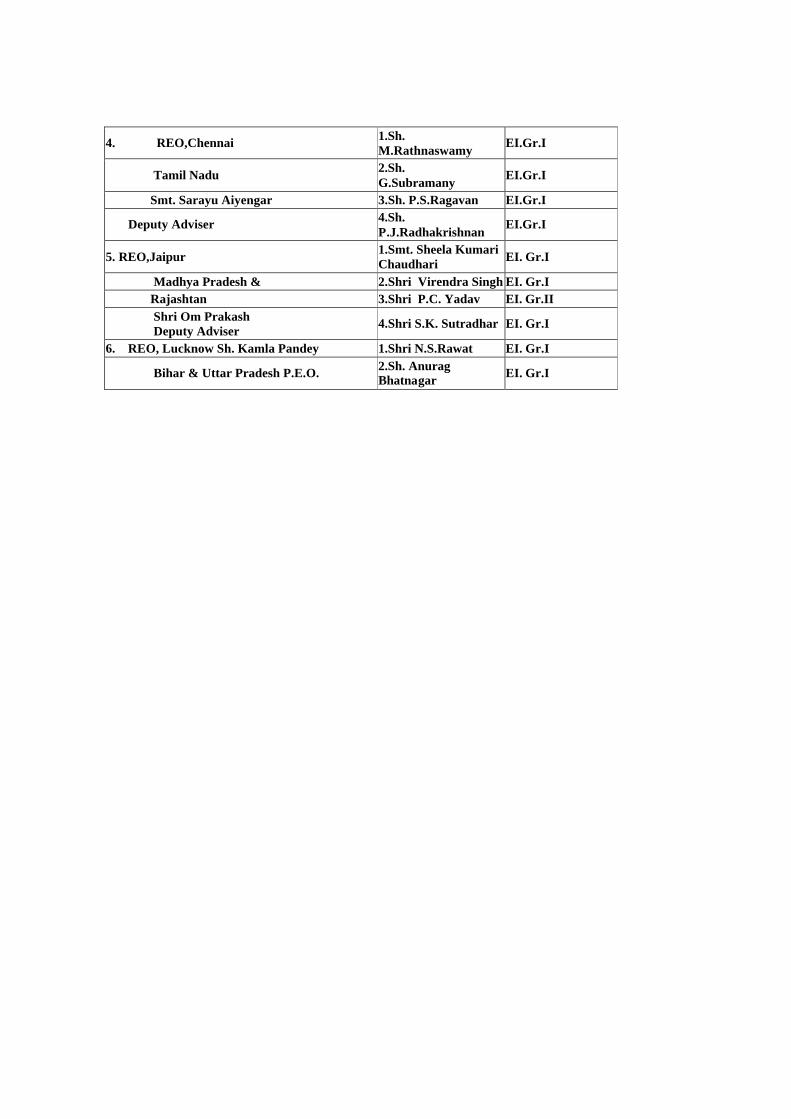
4. REO,Chennai 1.Sh. M.Rathnaswamy
EI.Gr.I
Tamil Nadu 2.Sh. G.Subramany
EI.Gr.I
Smt. Sarayu Aiyengar 3.Sh. P.S.Ragavan EI.Gr.I
Deputy Adviser 4.Sh. P.J.Radhakrishnan
EI.Gr.I
5. REO,Jaipur 1.Smt. Sheela Kumari Chaudhari
EI. Gr.I
Madhya Pradesh & 2.Shri Virendra Singh EI. Gr.I Rajashtan 3.Shri P.C. Yadav EI. Gr.II Shri Om Prakash Deputy Adviser
4.Shri S.K. Sutradhar EI. Gr.I
6. REO, Lucknow Sh. Kamla Pandey 1.Shri N.S.Rawat EI. Gr.I
Bihar & Uttar Pradesh P.E.O. 2.Sh. Anurag Bhatnagar
EI. Gr.I