functional segregation within the muscles of …axial muscles, appendicular muscles introduction...
TRANSCRIPT
ORIGINAL RESEARCHpublished: 08 September 2016doi: 10.3389/fphys.2016.00380
Frontiers in Physiology | www.frontiersin.org 1 September 2016 | Volume 7 | Article 380
Edited by:
J.-P. Jin,
Wayne State University School of
Medicine, USA
Reviewed by:
Douglas Swank,
Rensselaer Polytechnic Institute, USA
Han-Zhong Feng,
Wayne State University School of
Medicine, USA
Bruno Bastide,
Lille University of Science and
Technology, France
*Correspondence:
Bruce A. Young
Specialty section:
This article was submitted to
Striated Muscle Physiology,
a section of the journal
Frontiers in Physiology
Received: 14 April 2016
Accepted: 22 August 2016
Published: 08 September 2016
Citation:
Young BA, Dumais J, John N,
Lyons B, Macduff A, Most M,
Reiser NA and Reiser PJ (2016)
Functional Segregation within the
Muscles of Aquatic Propulsion in the
Asiatic Water Monitor (Varanus
salvator). Front. Physiol. 7:380.
doi: 10.3389/fphys.2016.00380
Functional Segregation within theMuscles of Aquatic Propulsion in theAsiatic Water Monitor (Varanussalvator)Bruce A. Young 1*, Jessica Dumais 2, Nicholas John 2, Brandon Lyons 2, Andrew Macduff 2,
Matthew Most 2, Nathan A. Reiser 3 and Peter J. Reiser 3
1Department of Anatomy, Kirksville College of Osteopathic Medicine, A.T. Still University of Health Sciences, Kirksville, MO,
USA, 2Department of Physical Therapy, University of Massachusetts Lowell, Lowell, MA, USA, 3Department of Biosciences,
College of Dentistry, Ohio State University, Columbus, OH, USA
Water monitor lizards (Varanus salvator) swim using sinusoidal oscillations generated at
the base of their long (50% of total body length) tail. In an effort to determine which
level of the structural/organizational hierarchy of muscle is associated with functional
segregation between the muscles of the tail base, an array of muscle features—myosin
heavy chain profiles, enzymatic fiber types, twitch and tetanic force production, rates
of fatigue, muscle compliance, and electrical activity patterns—were quantitated. The
two examined axial muscles, longissimus, and iliocaudalis, were generally similar at
the molecular, biochemical, and physiological levels, but differed at the biomechanics
level and in their activation pattern. The appendicular muscle examined, caudofemoralis,
differed from the axial muscles particularly at the molecular and physiological levels,
and it exhibited a unique compliance profile and pattern of electrical activation. There
were some apparent contradictions between the different structural/organizational levels
examined. These contradictions, coupled with a unique myosin heavy chain profile,
lead to the hypothesis that there are previously un-described molecular/biochemical
specializations within varanid skeletal muscles.
Keywords: electromyography, whole muscle physiology, muscle histochemistry, work loops, myosin heavy chain,
axial muscles, appendicular muscles
INTRODUCTION
Skeletal muscle is a dynamic tissue the functional properties of which are influenced, if notdetermined, at a variety of organizational levels. The diversity of myosin isoforms, as well asother molecular components within the single muscle fiber, can produce functional heterogeneity(Bottinelli, 2001). The packaging of the muscle fibers, both in terms of the geometric propertiesof the muscle (Azizi and Roberts, 2014) and the biomechanical properties of the muscle fibersand muscle-tendon complex (Fouré et al., 2012) will influence the timing and magnitude of forceproduction. At a higher level of organization, the dynamics of the muscle-tendon complex willdepend, in part, on the pattern of neural stimulation (e.g., Lacquaniti et al., 2012). While this iswidely recognized, the majority of published studies focus on a single analytical technique appliedto just one level of muscle organization.
Young et al. Skeletal Muscle Biology of Varanus
One of the key evolutionary developments of craniateswas an appendicular system (see Schilling, 2011), andincreasingly studies are finding key differences betweenaxial and appendicular muscles within the same individual.Differential regulation of myogenic pathways can generatemolecular differences between appendicular and axial muscles(Rao et al., 1996; Spangenburg and Booth, 2003), and keydevelopmental features of axial and appendicular muscles differ(Kablar et al., 1997; Neyt et al., 2000). Bagnall andMcLean (2014)have described how the complexity of locomotor spinal circuitsfor axial control could serve as a “source” for the early neuralpattern for tetrapedal (appendicular) locomotion.
The monitor lizards (Varanus) have diversified, bothbiogeographically and ecologically (Ast, 2001), in ways thatmake them attractive model organisms for studies of musclefunction. Although the basic body plan of the varanids isconserved (despite the largest size range of any terrestrialvertebrate radiation, Pianka et al., 2004), the group showsdistinct specializations in limb allometrics and tail shape thatare associated with a shifting emphasis from appendicular toaxial locomotion (Christian and Garland, 1996; Burnell et al.,2012a). These locomotor specializations are superimposed ontoa suite of physiological specializations for increased aerobiccapacity (see Frappell et al., 2002) and endurance. An earlierstudy (Young et al., 1990) documented a range of functionalcharacteristics within the shoulder muscles of the savannahmonitor (Varanus exanthematicus), a species that relies onappendicular locomotion. The present study concentrates onthe water monitor (Varanus salvator), a species that swimsusing axial undulations, primarily of the tail base (Young et al.,2008; Burnell et al., 2012a). As a comparison to the earlierstudy (Young et al., 1990), the present study applied a varietyof analytical techniques to two axial muscles of the tail base,as well as one appendicular muscle (caudofemoralis) whichis a major retractor of the femur but has been postulated tolaterally displace the tail base (Gatesy, 1990, 1997; Caldwell andSasso, 2004). By comparing these three muscles, two axial andone appendicular, from within these physiologically specializedlizards, we hope to explore patterns of functional specializationboth within and between these skeletal muscles.
MATERIALS AND METHODS
Live AnimalsEight specimens of the Asian water monitor (V. salvator) wereobtained commercially. To minimize scaling influences, all ofthe specimens had a similar total body length (85–120 cm). Theanimals were maintained individually in terraria with 12:12 lightcycle, water ad libitum, a temperature range of 29–34◦C, and adiet of pre-killed rodents. Maintenance and use of these animalsfollowed all applicable guidelines for vertebrate animals, andwereapproved by the Institutional Animal Care and Use Committee(Registration # 14-R-0081).
Kinematics and ElectromyographyMuscle activity patterns were quantified from four specimensof V. salvator. Earlier analysis had documented that there was
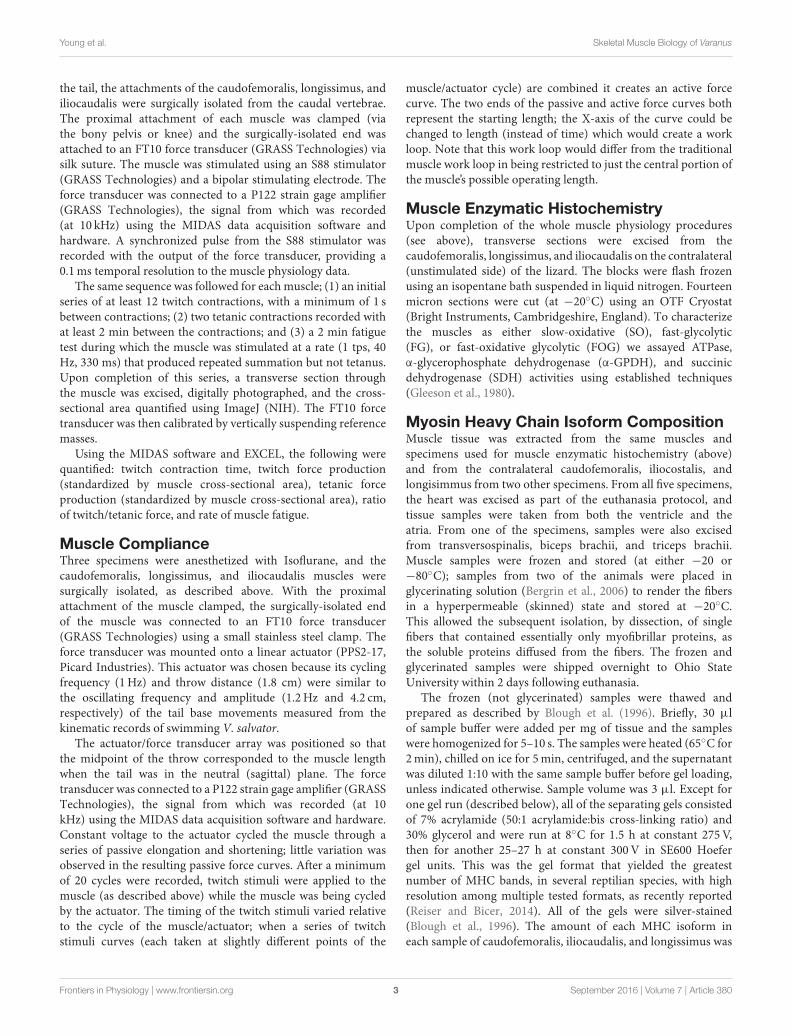
FIGURE 1 | Simplified diagram of the three studied muscles. The
proximal base of the iliocaudalis (in red) has been removed to better illustrate
the deeper caudofemoralis (in blue).
little undulatory displacement of the trunk during swimmingin this species (Burnell et al., 2012a), so the present analysisfocused exclusively onmuscles of the tail base.With the specimenlightly anesthetized with Isoflurane, sterile hypodermic needleswere used to implant bipolar electromyographic (EMG) leads(fabricated from 0.05 mm diameter stainless steel wire withNylon insulation; California Fine Wire, Grover City, CA) intothe caudofemoralis, the longissimus (an epaxial muscle) and theiliocaudalis (a hypaxial muscle). The latter two muscles wereimplanted within the proximal 5% of the tail length (Figure 1).
When the specimen was fully recovered from anesthesia, itwas placed into a 148× 63× 45 cm deep re-circulating flow tank(based on Vogel and Labarbera, 1978) which was filled with watermaintained at 25–26◦C. A TroubleShooter 1000S (Xcitex Inc.,Woburn, MA) high-speed digital video camera was mountedover the flow tank and used to record the swimming sequencesat either 125 or 250 fps. The resulting sequences were screened toeliminate those in which (1) the animal completed less than twocomplete tail oscillations; (2) the animal’s trajectory deviated bymore than 10◦ (measured as a line through the axis of the skullto the midline of the pelvis of each frame); or (3) the swimmingvelocity of the animal (see below) changed significantly duringthe sequence. Aminimum of five swimming sequences from eachspecimenwere used for analysis.MaxTRAQ software (InnovisionSystems Inc., Columbiaville, MI) was used to control the cameraand isolate sequence frames which were exported to ImageJ(NIH) for digitization. Using Excel and SSPS software packages,the swimming velocity of the lizard (defined as change in positionof the snout tip over time) and the amplitude of each undulatorypeak in the tail were calculated.
The EMG leads were bandpass filtered (10Hz–1 kHz) andpreamplified (QP511, GRASS Technologies, Natus NeurologyInc., Warwick, RI) prior to A/D conversion and recording (at10 kHz) usingMIDAS (Xcitex, Inc.). A pulsed LED strobe/voltagespike, generated by a S88 stimulator (GRASS Technologies)synchronized the EMG and kinematic data sets. Using theMIDAS and EXCEL software packages, the onset and offset timesof the muscles were quantified, as was the area under the rectifiedmuscle activation signal.
Whole Muscle PhysiologyFour specimens were anesthetized with Isoflurane, and the baseof the tail was surgically exposed for in situ analysis. At the sametransverse plane of the tail, and always within the proximal 5% of
Frontiers in Physiology | www.frontiersin.org 2 September 2016 | Volume 7 | Article 380
Young et al. Skeletal Muscle Biology of Varanus
the tail, the attachments of the caudofemoralis, longissimus, andiliocaudalis were surgically isolated from the caudal vertebrae.The proximal attachment of each muscle was clamped (viathe bony pelvis or knee) and the surgically-isolated end wasattached to an FT10 force transducer (GRASS Technologies) viasilk suture. The muscle was stimulated using an S88 stimulator(GRASS Technologies) and a bipolar stimulating electrode. Theforce transducer was connected to a P122 strain gage amplifier(GRASS Technologies), the signal from which was recorded(at 10 kHz) using the MIDAS data acquisition software andhardware. A synchronized pulse from the S88 stimulator wasrecorded with the output of the force transducer, providing a0.1ms temporal resolution to the muscle physiology data.
The same sequence was followed for eachmuscle; (1) an initialseries of at least 12 twitch contractions, with a minimum of 1 sbetween contractions; (2) two tetanic contractions recorded withat least 2 min between the contractions; and (3) a 2 min fatiguetest during which the muscle was stimulated at a rate (1 tps, 40Hz, 330 ms) that produced repeated summation but not tetanus.Upon completion of this series, a transverse section throughthe muscle was excised, digitally photographed, and the cross-sectional area quantified using ImageJ (NIH). The FT10 forcetransducer was then calibrated by vertically suspending referencemasses.
Using the MIDAS software and EXCEL, the following werequantified: twitch contraction time, twitch force production(standardized by muscle cross-sectional area), tetanic forceproduction (standardized by muscle cross-sectional area), ratioof twitch/tetanic force, and rate of muscle fatigue.
Muscle ComplianceThree specimens were anesthetized with Isoflurane, and thecaudofemoralis, longissimus, and iliocaudalis muscles weresurgically isolated, as described above. With the proximalattachment of the muscle clamped, the surgically-isolated endof the muscle was connected to an FT10 force transducer(GRASS Technologies) using a small stainless steel clamp. Theforce transducer was mounted onto a linear actuator (PPS2-17,Picard Industries). This actuator was chosen because its cyclingfrequency (1Hz) and throw distance (1.8 cm) were similar tothe oscillating frequency and amplitude (1.2Hz and 4.2 cm,respectively) of the tail base movements measured from thekinematic records of swimming V. salvator.
The actuator/force transducer array was positioned so thatthe midpoint of the throw corresponded to the muscle lengthwhen the tail was in the neutral (sagittal) plane. The forcetransducer was connected to a P122 strain gage amplifier (GRASSTechnologies), the signal from which was recorded (at 10kHz) using the MIDAS data acquisition software and hardware.Constant voltage to the actuator cycled the muscle through aseries of passive elongation and shortening; little variation wasobserved in the resulting passive force curves. After a minimumof 20 cycles were recorded, twitch stimuli were applied to themuscle (as described above) while the muscle was being cycledby the actuator. The timing of the twitch stimuli varied relativeto the cycle of the muscle/actuator; when a series of twitchstimuli curves (each taken at slightly different points of the
muscle/actuator cycle) are combined it creates an active forcecurve. The two ends of the passive and active force curves bothrepresent the starting length; the X-axis of the curve could bechanged to length (instead of time) which would create a workloop. Note that this work loop would differ from the traditionalmuscle work loop in being restricted to just the central portion ofthe muscle’s possible operating length.
Muscle Enzymatic HistochemistryUpon completion of the whole muscle physiology procedures(see above), transverse sections were excised from thecaudofemoralis, longissimus, and iliocaudalis on the contralateral(unstimulated side) of the lizard. The blocks were flash frozenusing an isopentane bath suspended in liquid nitrogen. Fourteenmicron sections were cut (at −20◦C) using an OTF Cryostat(Bright Instruments, Cambridgeshire, England). To characterizethe muscles as either slow-oxidative (SO), fast-glycolytic(FG), or fast-oxidative glycolytic (FOG) we assayed ATPase,α-glycerophosphate dehydrogenase (α-GPDH), and succinicdehydrogenase (SDH) activities using established techniques(Gleeson et al., 1980).
Myosin Heavy Chain Isoform CompositionMuscle tissue was extracted from the same muscles andspecimens used for muscle enzymatic histochemistry (above)and from the contralateral caudofemoralis, iliocostalis, andlongisimmus from two other specimens. From all five specimens,the heart was excised as part of the euthanasia protocol, andtissue samples were taken from both the ventricle and theatria. From one of the specimens, samples were also excisedfrom transversospinalis, biceps brachii, and triceps brachii.Muscle samples were frozen and stored (at either −20 or−80◦C); samples from two of the animals were placed inglycerinating solution (Bergrin et al., 2006) to render the fibersin a hyperpermeable (skinned) state and stored at −20◦C.This allowed the subsequent isolation, by dissection, of singlefibers that contained essentially only myofibrillar proteins, asthe soluble proteins diffused from the fibers. The frozen andglycerinated samples were shipped overnight to Ohio StateUniversity within 2 days following euthanasia.
The frozen (not glycerinated) samples were thawed andprepared as described by Blough et al. (1996). Briefly, 30 µlof sample buffer were added per mg of tissue and the sampleswere homogenized for 5–10 s. The samples were heated (65◦C for2min), chilled on ice for 5min, centrifuged, and the supernatantwas diluted 1:10 with the same sample buffer before gel loading,unless indicated otherwise. Sample volume was 3 µl. Except forone gel run (described below), all of the separating gels consistedof 7% acrylamide (50:1 acrylamide:bis cross-linking ratio) and30% glycerol and were run at 8◦C for 1.5 h at constant 275V,then for another 25–27 h at constant 300V in SE600 Hoefergel units. This was the gel format that yielded the greatestnumber of MHC bands, in several reptilian species, with highresolution among multiple tested formats, as recently reported(Reiser and Bicer, 2014). All of the gels were silver-stained(Blough et al., 1996). The amount of each MHC isoform ineach sample of caudofemoralis, iliocaudalis, and longissimus was
Frontiers in Physiology | www.frontiersin.org 3 September 2016 | Volume 7 | Article 380
Young et al. Skeletal Muscle Biology of Varanus
determined by scanning densitometry using a GS300 scanningdensitometer (Hoefer Scientific; San Francisco, CA), as describedin Bicer and Reiser (2004). The relative amount (as a percentageof total MHC) of each MHC isoform in each sample wascalculated. Differences in the mean relative amount of eachisoform were compared among the caudofemoralis, iliocaudalisand longissimus, using analysis of variance (SYSTAT) and thet-test for post-hoc determination of statistical significance.
Myosin Heavy Chain Isoform IdentificationAn immunoblot with an antibody that recognizes all sarcomericMHC isoforms (MF 20, diluted 1:50, obtained from theDevelopmental Studies Hybridoma Bank at the University ofIowa) was run to verify that all of the scanned bands wereMHC isoforms. Another antibody (1170-S, clone F88-12F8,diluted 1:50; BioCytex, Marseille, France) was used to test for theexpression of cardiac MHC-α. All of the steps were conductedat room temperature. Proteins were transferred to nitrocellulosemembranes, using a mini-V BRL unit (Life Technologies,Gaithersburg, MD). Transfers were run at constant 100 volts for2 h. The transfer buffer composition was 25mM Tris, 192mMglycine, 20% (v/v) methanol, 0.08% (v/v) beta-mercaptoethanoland 0.1% (w/v) SDS. Blocking of the membranes was performedwith 1% bovine serum albumin (BSA) in Tris-buffered salinewith 0.05% (v/v) Tween 20 (TBST) for 1 h. The membraneswere reacted with the primary antibodies in TBST with 0.3%BSA for 1 h and were washed three times, 5min each, inTBST. The membranes were incubated, for 1 h, with an alkalinephosphatase-conjugated secondary anti-mouse antibody (S3721,Promega, Madison, WI; 3 µl in 20 ml of TBST with 1%BSA,) and were washed three times, 5 min each, in TBST.Color development was performed with 5-bromo-4-chloro-3-indolyl phosphate and nitro blue tetrazolium dye as substrates(Promega).
Differences in separating gel composition can alter theelectrophoretic mobility of someMHC isoforms relative to othersand can yield separation of some isoforms that are not separatedfrom each other on other gel formats (e.g., Reiser and Bicer,2014). Therefore, some samples were also run on separating gelsthat consisted of 9% acrylamide, 200:1 crosslinking, and 12%glycerol, to test whether any monitor MHC isoforms that co-migrated on one format could be separated from each other on adifferent format. If a difference between formats is observed, thenthis would indicate that the isoforms are, in fact, different. Gelswith this format were run at 18◦C and at constant current, at 10mA/gel for the first 2.5 h and 20mA/gel for 25.5 additional hours.The stacking gels used with this separating gel format consistedof 4% acrylamide, with an acrylamide:bis cross-linking ratio of50:1, 0.125 M Tris, pH 6.8 and 0.1% (w/v) SDS.
One gel, with the first format described above (i.e., 7%acrylamide (50:1 acrylamide:bis cross-linking ratio) and 30%glycerol) was loaded with samples of atrium, ventricle andcaudofemoralis. The caudofemoralis sample was observed, onprevious gels, to contain all five MHC bands in monitor skeletalmuscles. The gel was stained with Coomassie Blue and bothatrial bands, the single ventricular band and bands 1, 2, and5 (Figure 8) from the caudofemoralis sample were excised and
submitted for identification by mass spectrometry at the CampusChemical Instrument Center at Ohio State University. Bands 3and 4 were not analyzed because of their low abundance andgreater sample loads created contaminating trailing edges fromthe bands that migrated immediately in front of these two bands.The bands were subjected to Orbitrap Fusion nanoLC-MS/MS.Collision-induced fragmentation, coupled with electron-transferdissociation, was used to generate peptides. The fragment masstolerance was set at 0.8 Dalton. The results were blasted againstthe SwissProt database for protein identification.
Skinned fibers were isolated from strips of biceps brachii,caudofemoralis, longissimus, and iliocaudalis (23 or 24 fibersfrom eachmuscle) that had been stored at−20◦C in glycerinatingsolution. Fibers were isolated by dissection in a Petri dishcontaining relaxing solution (composition as described inBergrin et al., 2006). Two types of fibers, based upon appearancewhen viewed with a dissecting microscope (either small diameterand white (semi-opaque) or large diameter and clear) were easilydiscerned and this was recorded for each isolated fiber. Thefiber diameter was estimated by inspection and fiber length wasmeasured with a ruler in the dissecting dish. Fiber volume wascalculated from the diameter estimate (assuming a circular cross-section) and length measurement. Each fiber was transferredto an individual microcentrifuge tube and 2.0 µl of samplebuffer per ηl of fiber volume were added to each single fibertube. The tubes were heated for 5 min at 65◦C, then chilledimmediately on ice for 5 min. The fibers were stored at −40◦Cuntil loading onto a gel. Three microliters of each single fibersample were loaded onto gels which were silver-stained. All 24fibers from a given muscle were loaded onto two gels and asample of a homogenate of the same muscle, which was knownto contain all five MHC isoforms in monitor skeletal muscles,was loaded in the center lane of each gel, as a standard to identifythe MHC isoform(s) in each single fiber. The pattern of MHCisoform content of each fiber was determined by inspection ofthe gels.
RESULTS
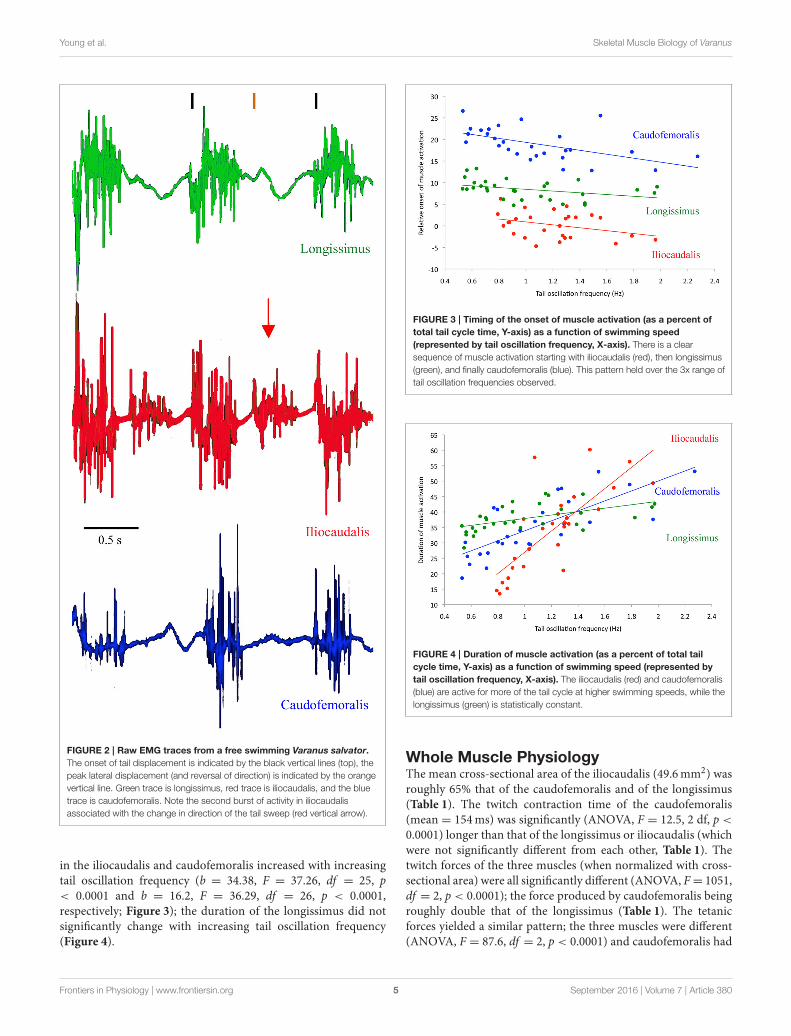
Electromyographic Activity PatternThe EMG patterns of activation of the three muscles differedfrom each other. The iliocaudalis EMG pattern differed fromthe pattern of the other two muscles in showing two bursts, oneassociated with the onset of tail oscillation, and the second whenthe tail reversed direction halfway through the oscillation cycle(Figure 2). The iliocaudalis fired shortly before tail movementbegan, followed (after approximately 10% of the oscillation cycleduration) by the longissimus, then (after approximately 20% ofthe oscillation cycle duration) the caudofemoralis (Figure 3). Thedifferences among these onsets were significant (ANOVA, F =
244.9, 2 df, p < 0.0001) as was the decrease in relative onsettime within the iliocaudalis and caudofemoralis with increasingtail oscillation frequency (b = −4.13, F = 22.42, df = 25, p< 0.0001 and b = −4.58, F = 10.87, df = 26, p = 0.0028,respectively). The relative onset time of the longissimus did notchange with increasing oscillation frequency (b = −1.715, F =
3.24, df = 28, p = 0.075). The duration of electrical activity
Frontiers in Physiology | www.frontiersin.org 4 September 2016 | Volume 7 | Article 380
Young et al. Skeletal Muscle Biology of Varanus
FIGURE 2 | Raw EMG traces from a free swimming Varanus salvator.
The onset of tail displacement is indicated by the black vertical lines (top), the
peak lateral displacement (and reversal of direction) is indicated by the orange
vertical line. Green trace is longissimus, red trace is iliocaudalis, and the blue
trace is caudofemoralis. Note the second burst of activity in iliocaudalis
associated with the change in direction of the tail sweep (red vertical arrow).
in the iliocaudalis and caudofemoralis increased with increasingtail oscillation frequency (b = 34.38, F = 37.26, df = 25, p< 0.0001 and b = 16.2, F = 36.29, df = 26, p < 0.0001,respectively; Figure 3); the duration of the longissimus did notsignificantly change with increasing tail oscillation frequency(Figure 4).
FIGURE 3 | Timing of the onset of muscle activation (as a percent of
total tail cycle time, Y-axis) as a function of swimming speed
(represented by tail oscillation frequency, X-axis). There is a clear
sequence of muscle activation starting with iliocaudalis (red), then longissimus
(green), and finally caudofemoralis (blue). This pattern held over the 3x range of
tail oscillation frequencies observed.
FIGURE 4 | Duration of muscle activation (as a percent of total tail
cycle time, Y-axis) as a function of swimming speed (represented by
tail oscillation frequency, X-axis). The iliocaudalis (red) and caudofemoralis
(blue) are active for more of the tail cycle at higher swimming speeds, while the
longissimus (green) is statistically constant.
Whole Muscle PhysiologyThe mean cross-sectional area of the iliocaudalis (49.6mm2) wasroughly 65% that of the caudofemoralis and of the longissimus(Table 1). The twitch contraction time of the caudofemoralis(mean = 154ms) was significantly (ANOVA, F = 12.5, 2 df, p <
0.0001) longer than that of the longissimus or iliocaudalis (whichwere not significantly different from each other, Table 1). Thetwitch forces of the three muscles (when normalized with cross-sectional area) were all significantly different (ANOVA, F= 1051,df = 2, p < 0.0001); the force produced by caudofemoralis beingroughly double that of the longissimus (Table 1). The tetanicforces yielded a similar pattern; the three muscles were different(ANOVA, F = 87.6, df = 2, p < 0.0001) and caudofemoralis had
Frontiers in Physiology | www.frontiersin.org 5 September 2016 | Volume 7 | Article 380

Young et al. Skeletal Muscle Biology of Varanus
TABLE 1 | Summary of the whole muscle physiology and enzymatic
histochemistry of the three muscles examined.
Caudofemoralis Iliocaudalis Longissimus
appendicular hypaxial epaxial
Cross-sectional area (mm2) 80.2 (2.2) 49.6 (1.9) 78.3 (2.5)
Twitch contraction time (ms) 154 (10) 115 (17) 110 (16)
Twitch force (N/mm2) 2.0 (0.20) 1.4 (0.25) 0.9 (0.09)
Tetanic force (N/mm2) 9.83 (0.99) 6.8 (0.59) 5.13 (0.42)
Tetanic force/twitch force 4.92 4.86 5.7
Fatigue rate −1.27 −3.83 −2.58
Histochemical Profile
SO% 72 65 61
FG% 11 10 30
FO% 17 25 9
Physiological values are expressed as mean (s.e.); fatigue rate was calculated as the linear
regression of relative force output per unit interval of the fatigue test.
FIGURE 5 | Results of the 2-min fatigue trials. The longissimus (green) and
iliocaudalis (red) show a similar fatigue profile; the caudofemoralis (blue) is
more resistant to fatigue.
nearly twice the force output of the longissimus (Table 1). Thetetanic forces were approximately 5x those of the twitch forces(Table 1); the ratio being slightly (but significantly; ANOVA, F= 161.5, df = 2, p < 0.0001) higher at 5.7 in the longissimus.The caudofemoralis exhibited the lowest rate of fatigue (Figure 5)retaining >80% of twitch force at the termination of the 2min trial. The fatigue rate (calculated as linear regression ofrelative force output per unit interval of the fatigue test) for theiliocaudalis was nearly 3x that of the caudofemoralis; the fatiguerate for the longissimus was halfway between those of the othertwo muscles (Figure 5, Table 1).
Muscle ComplianceThe cyclic movements of the actuator were capable of producingrepetitive length changes in the muscles (Figure 6). When therelative force of the muscle was adjusted for cross-sectional areaand plotted against time (length), there were distinct differencesamong the three muscles (Figure 7). The passive force curve
FIGURE 6 | Raw data traces from a force transducer (Y axis) coupled
to a linear actuator and clamped to iliocaudalis. By applying a constant
voltage to the linear actuator it was possible to induce a regular pattern of
passive elongation and shortening in the muscle. The different colors represent
different elongation/shortening cycles; each point is a single measurement.
(the black line in Figure 7) for caudofemoralis had the greatestresponse at low length changes, the lowest peak force, and thelowest slope. The passive curves for the two axial muscles weresimilar, although the iliocaudalis hadmore response at low lengthchanges than did the longissimus. The active force curve (colorcoded in Figure 7) was proportionately similar in caudofemoralisand longissimus; the iliocaudalis produced greater active force(relative to passive force) and showed a more asymmetric profilewith greater force production during active lengthening thanshortening.
Enzymatic Fiber Type ProfilesThe three muscles all had a predominance of SO fibers(Table 1). Among the fast-twitch fibers observed, those of thecaudofemoralis and iliocaudalis were mainly oxidative, whilethose of the longissimus were mainly glycolytic. In none of themuscle sections examined was the distribution of the enzymaticfiber types suggestive of compartmentalization.
Muscle and Single Fiber MHC IsoformExpressionThe electrophoretic separation of MHC isoforms in thecardiac atrium and ventricle, caudofemoralis, iliocaudalis,transversospinalis, and longissimus is shown in Figure 8. FiveMHC isoforms were consistently detected in the skeletal musclesthat were examined from each animal. Each band was recognizedby MF 20 antibody (not shown) and was, therefore, identifiedas an MHC isoform. The five bands observed in skeletal musclesamples are labeled as “1” (slowest migrating) through “5” (fastestmigrating), as the identity was determined for some, but not allof the bands (see mass spectrometry results, below). The cardiacMHC bands are referred to as either “atrial” (two isoforms) or“ventricular” (one isoform). The relative amount of each bandin the caudofemoralis, iliocaudalis and longissimus from sevenV. salvator was determined (Table 2). Band 1 was expressed
Frontiers in Physiology | www.frontiersin.org 6 September 2016 | Volume 7 | Article 380
Young et al. Skeletal Muscle Biology of Varanus
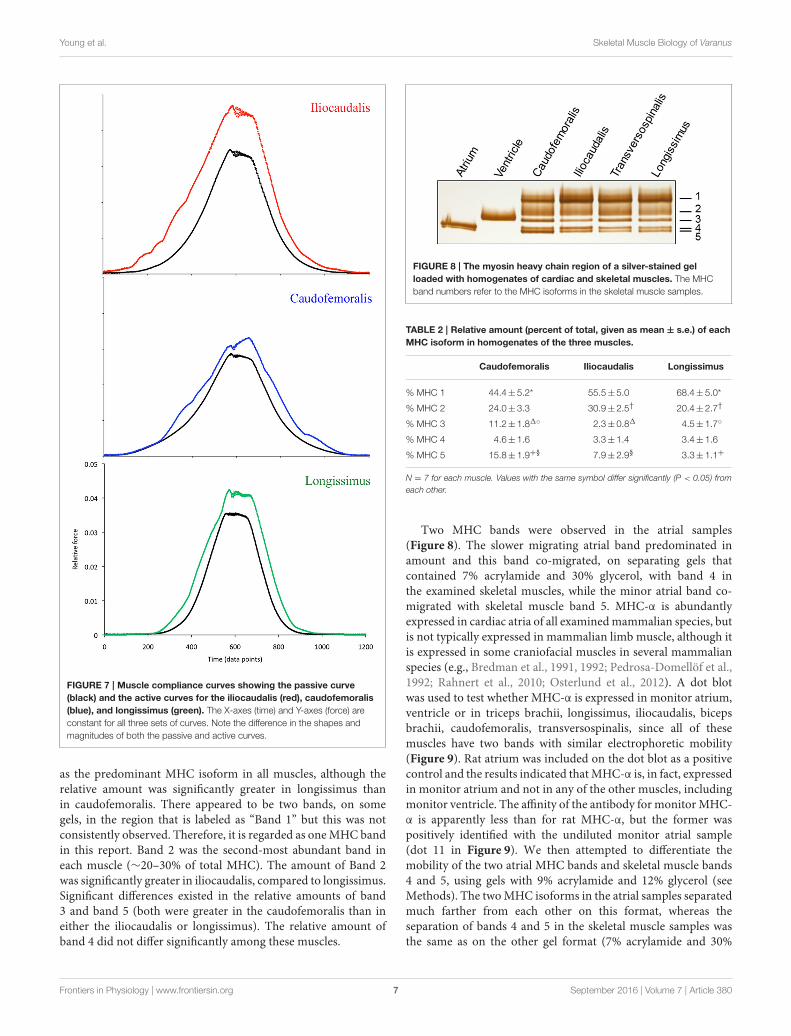
FIGURE 7 | Muscle compliance curves showing the passive curve
(black) and the active curves for the iliocaudalis (red), caudofemoralis
(blue), and longissimus (green). The X-axes (time) and Y-axes (force) are
constant for all three sets of curves. Note the difference in the shapes and
magnitudes of both the passive and active curves.
as the predominant MHC isoform in all muscles, although therelative amount was significantly greater in longissimus thanin caudofemoralis. There appeared to be two bands, on somegels, in the region that is labeled as “Band 1” but this was notconsistently observed. Therefore, it is regarded as oneMHC bandin this report. Band 2 was the second-most abundant band ineach muscle (∼20–30% of total MHC). The amount of Band 2was significantly greater in iliocaudalis, compared to longissimus.Significant differences existed in the relative amounts of band3 and band 5 (both were greater in the caudofemoralis than ineither the iliocaudalis or longissimus). The relative amount ofband 4 did not differ significantly among these muscles.
FIGURE 8 | The myosin heavy chain region of a silver-stained gel
loaded with homogenates of cardiac and skeletal muscles. The MHC
band numbers refer to the MHC isoforms in the skeletal muscle samples.
TABLE 2 | Relative amount (percent of total, given as mean ± s.e.) of each
MHC isoform in homogenates of the three muscles.
Caudofemoralis Iliocaudalis Longissimus
% MHC 1 44.4±5.2* 55.5± 5.0 68.4± 5.0*
% MHC 2 24.0±3.3 30.9± 2.5† 20.4± 2.7†
% MHC 3 11.2±1.81◦ 2.3± 0.81 4.5± 1.7◦
% MHC 4 4.6±1.6 3.3± 1.4 3.4± 1.6
% MHC 5 15.8±1.9+§ 7.9± 2.9§ 3.3± 1.1+
N = 7 for each muscle. Values with the same symbol differ significantly (P < 0.05) from
each other.
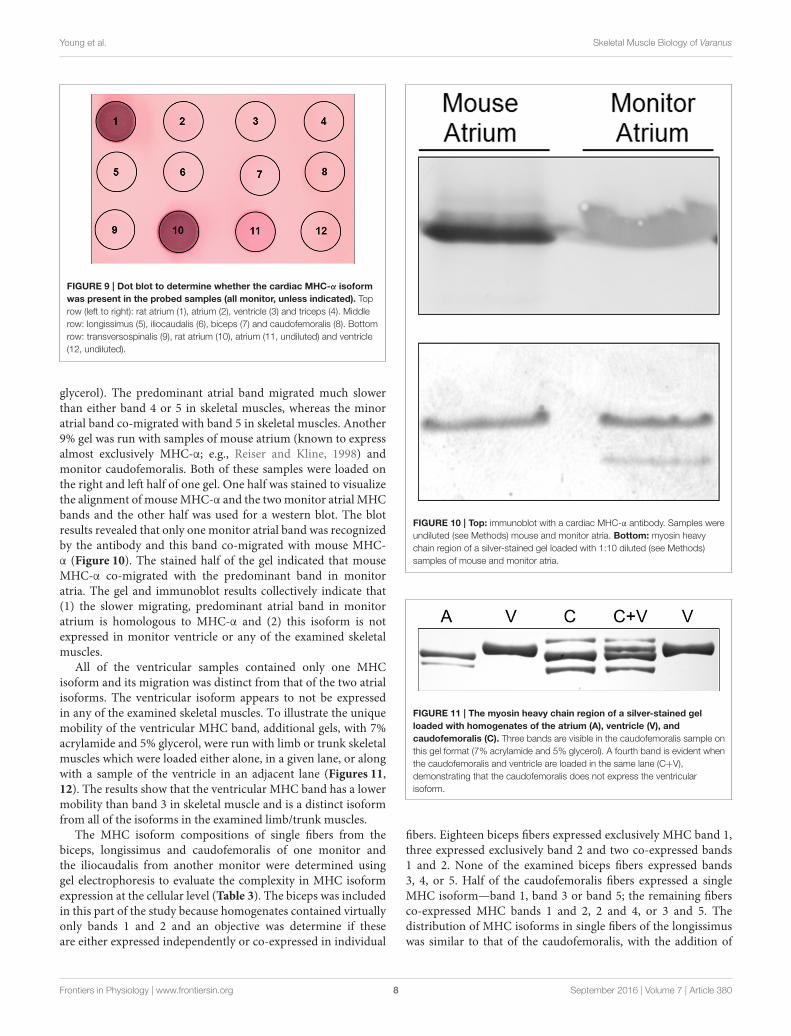
Two MHC bands were observed in the atrial samples(Figure 8). The slower migrating atrial band predominated inamount and this band co-migrated, on separating gels thatcontained 7% acrylamide and 30% glycerol, with band 4 inthe examined skeletal muscles, while the minor atrial band co-migrated with skeletal muscle band 5. MHC-α is abundantlyexpressed in cardiac atria of all examinedmammalian species, butis not typically expressed in mammalian limb muscle, although itis expressed in some craniofacial muscles in several mammalianspecies (e.g., Bredman et al., 1991, 1992; Pedrosa-Domellöf et al.,1992; Rahnert et al., 2010; Osterlund et al., 2012). A dot blotwas used to test whether MHC-α is expressed in monitor atrium,ventricle or in triceps brachii, longissimus, iliocaudalis, bicepsbrachii, caudofemoralis, transversospinalis, since all of thesemuscles have two bands with similar electrophoretic mobility(Figure 9). Rat atrium was included on the dot blot as a positivecontrol and the results indicated thatMHC-α is, in fact, expressedin monitor atrium and not in any of the other muscles, includingmonitor ventricle. The affinity of the antibody for monitorMHC-α is apparently less than for rat MHC-α, but the former waspositively identified with the undiluted monitor atrial sample(dot 11 in Figure 9). We then attempted to differentiate themobility of the two atrial MHC bands and skeletal muscle bands4 and 5, using gels with 9% acrylamide and 12% glycerol (seeMethods). The twoMHC isoforms in the atrial samples separatedmuch farther from each other on this format, whereas theseparation of bands 4 and 5 in the skeletal muscle samples wasthe same as on the other gel format (7% acrylamide and 30%
Frontiers in Physiology | www.frontiersin.org 7 September 2016 | Volume 7 | Article 380
Young et al. Skeletal Muscle Biology of Varanus
FIGURE 9 | Dot blot to determine whether the cardiac MHC-α isoform
was present in the probed samples (all monitor, unless indicated). Top
row (left to right): rat atrium (1), atrium (2), ventricle (3) and triceps (4). Middle
row: longissimus (5), iliocaudalis (6), biceps (7) and caudofemoralis (8). Bottom
row: transversospinalis (9), rat atrium (10), atrium (11, undiluted) and ventricle
(12, undiluted).
glycerol). The predominant atrial band migrated much slowerthan either band 4 or 5 in skeletal muscles, whereas the minoratrial band co-migrated with band 5 in skeletal muscles. Another9% gel was run with samples of mouse atrium (known to expressalmost exclusively MHC-α; e.g., Reiser and Kline, 1998) andmonitor caudofemoralis. Both of these samples were loaded onthe right and left half of one gel. One half was stained to visualizethe alignment of mouseMHC-α and the twomonitor atrial MHCbands and the other half was used for a western blot. The blotresults revealed that only one monitor atrial band was recognizedby the antibody and this band co-migrated with mouse MHC-α (Figure 10). The stained half of the gel indicated that mouseMHC-α co-migrated with the predominant band in monitoratria. The gel and immunoblot results collectively indicate that(1) the slower migrating, predominant atrial band in monitoratrium is homologous to MHC-α and (2) this isoform is notexpressed in monitor ventricle or any of the examined skeletalmuscles.
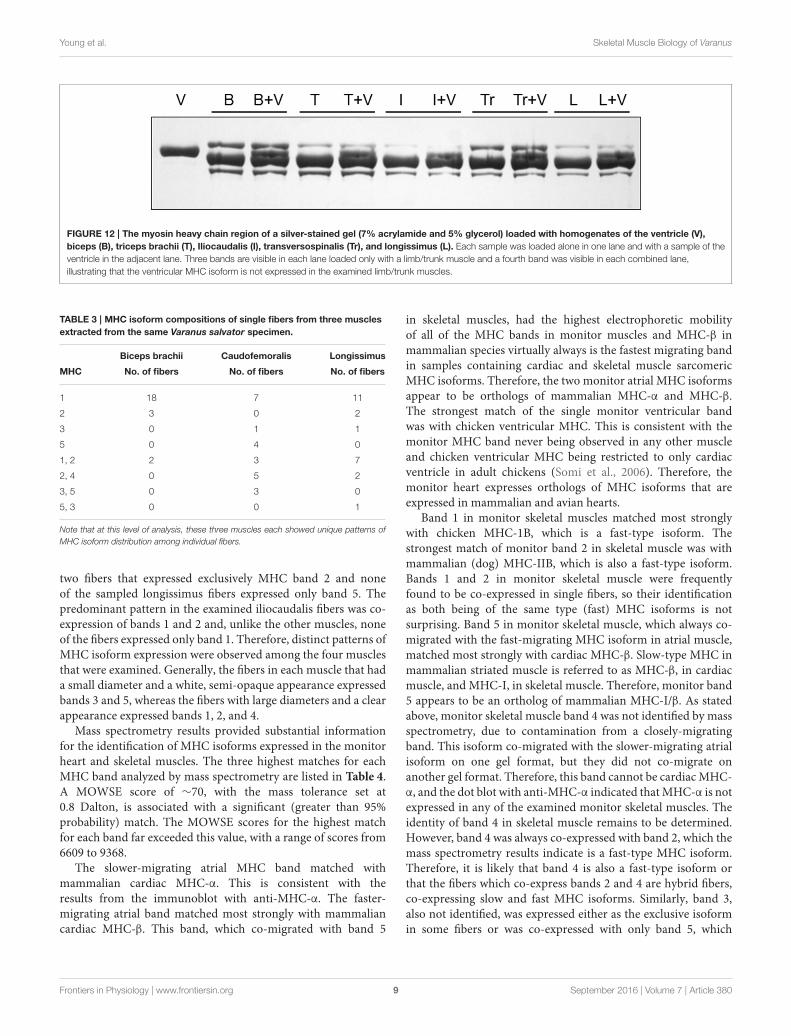
All of the ventricular samples contained only one MHCisoform and its migration was distinct from that of the two atrialisoforms. The ventricular isoform appears to not be expressedin any of the examined skeletal muscles. To illustrate the uniquemobility of the ventricular MHC band, additional gels, with 7%acrylamide and 5% glycerol, were run with limb or trunk skeletalmuscles which were loaded either alone, in a given lane, or alongwith a sample of the ventricle in an adjacent lane (Figures 11,12). The results show that the ventricular MHC band has a lowermobility than band 3 in skeletal muscle and is a distinct isoformfrom all of the isoforms in the examined limb/trunk muscles.
The MHC isoform compositions of single fibers from thebiceps, longissimus and caudofemoralis of one monitor andthe iliocaudalis from another monitor were determined usinggel electrophoresis to evaluate the complexity in MHC isoformexpression at the cellular level (Table 3). The biceps was includedin this part of the study because homogenates contained virtuallyonly bands 1 and 2 and an objective was determine if theseare either expressed independently or co-expressed in individual
FIGURE 10 | Top: immunoblot with a cardiac MHC-α antibody. Samples were
undiluted (see Methods) mouse and monitor atria. Bottom: myosin heavy
chain region of a silver-stained gel loaded with 1:10 diluted (see Methods)
samples of mouse and monitor atria.
FIGURE 11 | The myosin heavy chain region of a silver-stained gel
loaded with homogenates of the atrium (A), ventricle (V), and
caudofemoralis (C). Three bands are visible in the caudofemoralis sample on
this gel format (7% acrylamide and 5% glycerol). A fourth band is evident when
the caudofemoralis and ventricle are loaded in the same lane (C+V),
demonstrating that the caudofemoralis does not express the ventricular
isoform.
fibers. Eighteen biceps fibers expressed exclusively MHC band 1,three expressed exclusively band 2 and two co-expressed bands1 and 2. None of the examined biceps fibers expressed bands3, 4, or 5. Half of the caudofemoralis fibers expressed a singleMHC isoform—band 1, band 3 or band 5; the remaining fibersco-expressed MHC bands 1 and 2, 2 and 4, or 3 and 5. Thedistribution of MHC isoforms in single fibers of the longissimuswas similar to that of the caudofemoralis, with the addition of
Frontiers in Physiology | www.frontiersin.org 8 September 2016 | Volume 7 | Article 380
Young et al. Skeletal Muscle Biology of Varanus
FIGURE 12 | The myosin heavy chain region of a silver-stained gel (7% acrylamide and 5% glycerol) loaded with homogenates of the ventricle (V),
biceps (B), triceps brachii (T), Iliocaudalis (I), transversospinalis (Tr), and longissimus (L). Each sample was loaded alone in one lane and with a sample of the
ventricle in the adjacent lane. Three bands are visible in each lane loaded only with a limb/trunk muscle and a fourth band was visible in each combined lane,
illustrating that the ventricular MHC isoform is not expressed in the examined limb/trunk muscles.
TABLE 3 | MHC isoform compositions of single fibers from three muscles
extracted from the same Varanus salvator specimen.
Biceps brachii Caudofemoralis Longissimus
MHC No. of fibers No. of fibers No. of fibers
1 18 7 11
2 3 0 2
3 0 1 1
5 0 4 0
1, 2 2 3 7
2, 4 0 5 2
3, 5 0 3 0
5, 3 0 0 1
Note that at this level of analysis, these three muscles each showed unique patterns of
MHC isoform distribution among individual fibers.
two fibers that expressed exclusively MHC band 2 and noneof the sampled longissimus fibers expressed only band 5. Thepredominant pattern in the examined iliocaudalis fibers was co-expression of bands 1 and 2 and, unlike the other muscles, noneof the fibers expressed only band 1. Therefore, distinct patterns ofMHC isoform expression were observed among the four musclesthat were examined. Generally, the fibers in each muscle that hada small diameter and a white, semi-opaque appearance expressedbands 3 and 5, whereas the fibers with large diameters and a clearappearance expressed bands 1, 2, and 4.
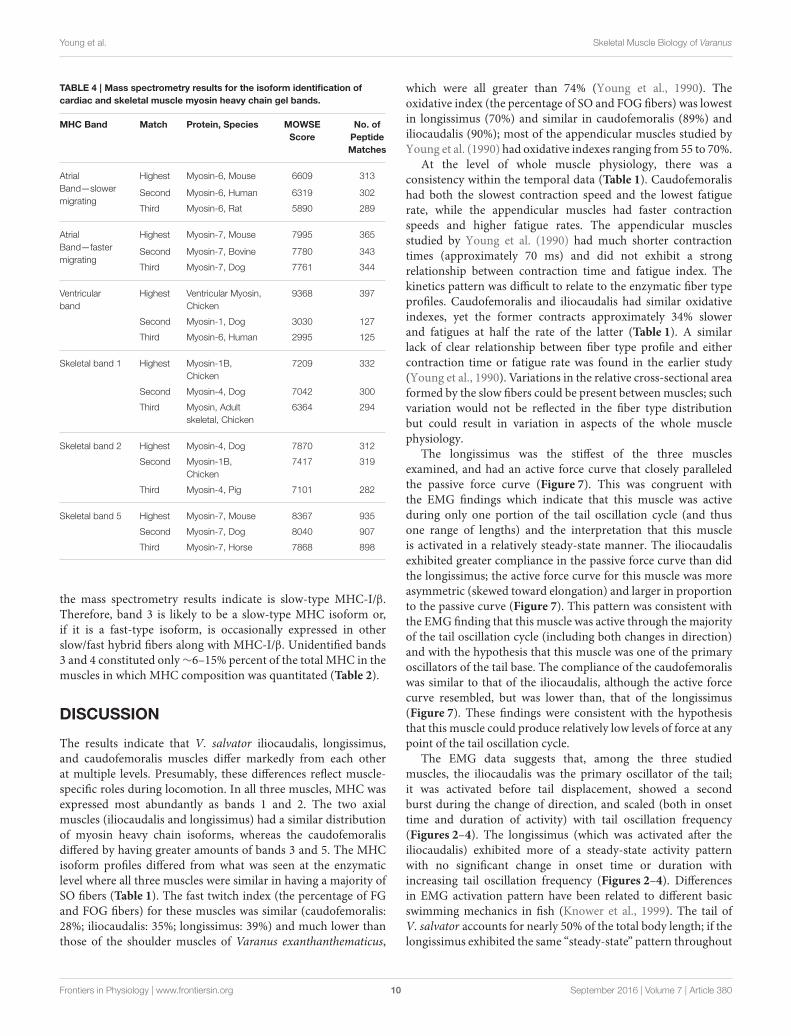
Mass spectrometry results provided substantial informationfor the identification of MHC isoforms expressed in the monitorheart and skeletal muscles. The three highest matches for eachMHC band analyzed by mass spectrometry are listed in Table 4.A MOWSE score of ∼70, with the mass tolerance set at0.8 Dalton, is associated with a significant (greater than 95%probability) match. The MOWSE scores for the highest matchfor each band far exceeded this value, with a range of scores from6609 to 9368.
The slower-migrating atrial MHC band matched withmammalian cardiac MHC-α. This is consistent with theresults from the immunoblot with anti-MHC-α. The faster-migrating atrial band matched most strongly with mammaliancardiac MHC-β. This band, which co-migrated with band 5
in skeletal muscles, had the highest electrophoretic mobilityof all of the MHC bands in monitor muscles and MHC-β inmammalian species virtually always is the fastest migrating bandin samples containing cardiac and skeletal muscle sarcomericMHC isoforms. Therefore, the two monitor atrial MHC isoformsappear to be orthologs of mammalian MHC-α and MHC-β.The strongest match of the single monitor ventricular bandwas with chicken ventricular MHC. This is consistent with themonitor MHC band never being observed in any other muscleand chicken ventricular MHC being restricted to only cardiacventricle in adult chickens (Somi et al., 2006). Therefore, themonitor heart expresses orthologs of MHC isoforms that areexpressed in mammalian and avian hearts.
Band 1 in monitor skeletal muscles matched most stronglywith chicken MHC-1B, which is a fast-type isoform. Thestrongest match of monitor band 2 in skeletal muscle was withmammalian (dog) MHC-IIB, which is also a fast-type isoform.Bands 1 and 2 in monitor skeletal muscle were frequentlyfound to be co-expressed in single fibers, so their identificationas both being of the same type (fast) MHC isoforms is notsurprising. Band 5 in monitor skeletal muscle, which always co-migrated with the fast-migrating MHC isoform in atrial muscle,matched most strongly with cardiac MHC-β. Slow-type MHC inmammalian striated muscle is referred to as MHC-β, in cardiacmuscle, and MHC-I, in skeletal muscle. Therefore, monitor band5 appears to be an ortholog of mammalian MHC-I/β. As statedabove, monitor skeletal muscle band 4 was not identified by massspectrometry, due to contamination from a closely-migratingband. This isoform co-migrated with the slower-migrating atrialisoform on one gel format, but they did not co-migrate onanother gel format. Therefore, this band cannot be cardiacMHC-α, and the dot blot with anti-MHC-α indicated thatMHC-α is notexpressed in any of the examined monitor skeletal muscles. Theidentity of band 4 in skeletal muscle remains to be determined.However, band 4 was always co-expressed with band 2, which themass spectrometry results indicate is a fast-type MHC isoform.Therefore, it is likely that band 4 is also a fast-type isoform orthat the fibers which co-express bands 2 and 4 are hybrid fibers,co-expressing slow and fast MHC isoforms. Similarly, band 3,also not identified, was expressed either as the exclusive isoformin some fibers or was co-expressed with only band 5, which
Frontiers in Physiology | www.frontiersin.org 9 September 2016 | Volume 7 | Article 380
Young et al. Skeletal Muscle Biology of Varanus
TABLE 4 | Mass spectrometry results for the isoform identification of
cardiac and skeletal muscle myosin heavy chain gel bands.
MHC Band Match Protein, Species MOWSE
Score
No. of
Peptide
Matches
Atrial
Band—slower
migrating
Highest Myosin-6, Mouse 6609 313
Second Myosin-6, Human 6319 302
Third Myosin-6, Rat 5890 289
Atrial
Band—faster
migrating
Highest Myosin-7, Mouse 7995 365
Second Myosin-7, Bovine 7780 343
Third Myosin-7, Dog 7761 344
Ventricular
band
Highest Ventricular Myosin,
Chicken
9368 397
Second Myosin-1, Dog 3030 127
Third Myosin-6, Human 2995 125
Skeletal band 1 Highest Myosin-1B,
Chicken
7209 332
Second Myosin-4, Dog 7042 300
Third Myosin, Adult
skeletal, Chicken
6364 294
Skeletal band 2 Highest Myosin-4, Dog 7870 312
Second Myosin-1B,
Chicken
7417 319
Third Myosin-4, Pig 7101 282
Skeletal band 5 Highest Myosin-7, Mouse 8367 935
Second Myosin-7, Dog 8040 907
Third Myosin-7, Horse 7868 898
the mass spectrometry results indicate is slow-type MHC-I/β.Therefore, band 3 is likely to be a slow-type MHC isoform or,if it is a fast-type isoform, is occasionally expressed in otherslow/fast hybrid fibers along with MHC-I/β. Unidentified bands3 and 4 constituted only∼6–15% percent of the total MHC in themuscles in which MHC composition was quantitated (Table 2).
DISCUSSION
The results indicate that V. salvator iliocaudalis, longissimus,and caudofemoralis muscles differ markedly from each otherat multiple levels. Presumably, these differences reflect muscle-specific roles during locomotion. In all three muscles, MHC wasexpressed most abundantly as bands 1 and 2. The two axialmuscles (iliocaudalis and longissimus) had a similar distributionof myosin heavy chain isoforms, whereas the caudofemoralisdiffered by having greater amounts of bands 3 and 5. The MHCisoform profiles differed from what was seen at the enzymaticlevel where all three muscles were similar in having a majority ofSO fibers (Table 1). The fast twitch index (the percentage of FGand FOG fibers) for these muscles was similar (caudofemoralis:28%; iliocaudalis: 35%; longissimus: 39%) and much lower thanthose of the shoulder muscles of Varanus exanthanthematicus,
which were all greater than 74% (Young et al., 1990). Theoxidative index (the percentage of SO and FOG fibers) was lowestin longissimus (70%) and similar in caudofemoralis (89%) andiliocaudalis (90%); most of the appendicular muscles studied byYoung et al. (1990) had oxidative indexes ranging from 55 to 70%.
At the level of whole muscle physiology, there was aconsistency within the temporal data (Table 1). Caudofemoralishad both the slowest contraction speed and the lowest fatiguerate, while the appendicular muscles had faster contractionspeeds and higher fatigue rates. The appendicular musclesstudied by Young et al. (1990) had much shorter contractiontimes (approximately 70 ms) and did not exhibit a strongrelationship between contraction time and fatigue index. Thekinetics pattern was difficult to relate to the enzymatic fiber typeprofiles. Caudofemoralis and iliocaudalis had similar oxidativeindexes, yet the former contracts approximately 34% slowerand fatigues at half the rate of the latter (Table 1). A similarlack of clear relationship between fiber type profile and eithercontraction time or fatigue rate was found in the earlier study(Young et al., 1990). Variations in the relative cross-sectional areaformed by the slow fibers could be present between muscles; suchvariation would not be reflected in the fiber type distributionbut could result in variation in aspects of the whole musclephysiology.
The longissimus was the stiffest of the three musclesexamined, and had an active force curve that closely paralleledthe passive force curve (Figure 7). This was congruent withthe EMG findings which indicate that this muscle was activeduring only one portion of the tail oscillation cycle (and thusone range of lengths) and the interpretation that this muscleis activated in a relatively steady-state manner. The iliocaudalisexhibited greater compliance in the passive force curve than didthe longissimus; the active force curve for this muscle was moreasymmetric (skewed toward elongation) and larger in proportionto the passive curve (Figure 7). This pattern was consistent withthe EMG finding that this muscle was active through the majorityof the tail oscillation cycle (including both changes in direction)and with the hypothesis that this muscle was one of the primaryoscillators of the tail base. The compliance of the caudofemoraliswas similar to that of the iliocaudalis, although the active forcecurve resembled, but was lower than, that of the longissimus(Figure 7). These findings were consistent with the hypothesisthat this muscle could produce relatively low levels of force at anypoint of the tail oscillation cycle.
The EMG data suggests that, among the three studiedmuscles, the iliocaudalis was the primary oscillator of the tail;it was activated before tail displacement, showed a secondburst during the change of direction, and scaled (both in onsettime and duration of activity) with tail oscillation frequency(Figures 2–4). The longissimus (which was activated after theiliocaudalis) exhibited more of a steady-state activity patternwith no significant change in onset time or duration withincreasing tail oscillation frequency (Figures 2–4). Differencesin EMG activation pattern have been related to different basicswimming mechanics in fish (Knower et al., 1999). The tail ofV. salvator accounts for nearly 50% of the total body length; if thelongissimus exhibited the same “steady-state” pattern throughout
Frontiers in Physiology | www.frontiersin.org 10 September 2016 | Volume 7 | Article 380
Young et al. Skeletal Muscle Biology of Varanus
the tail length, then disruption of the oscillation cycle wouldbe likely at higher tail frequencies. Interestingly, our kinematicrecords frequently included disrupted oscillation cycles including“negative” oscillations in which the end of the tail was movingforward, or out of phase, with the rest of the tail.
When swimming, V. salvator retracts and adducts thehindlimbs. This posture shortens the caudofemoralis (Figure 1)and deprives this muscle of any real leverage with which todisplace the tail. This was in sharp contrast to the situation interrestrial locomotion in crocodilians in which the planted (andextended) hindlimb enables caudofemoralis to displace the tail(Gatesy, 1997). Herein an “opposite” function of caudofemoralisis proposed, namely that the muscle is acting on the femur tokeep the hindlimb adducted against the tail base to minimizehydrodynamic drag (see D’Août and Aerts, 1997; Liu et al., 1997for other examples of hydrodynamic hindlimbs). Our kinematicrecords show cyclic separation between the hindlimb and thetail (as the tail oscillates to the contralateral side of the body)which would be explained by the lag in the EMG onset for thecaudofemoralis (Figure 2).
Despite the common name of “water monitor,” V. salvator isadept at climbing, digging, and cursorial locomotion (Burnellet al., 2012b). As such, care must be taken to not over-extendinterpretation of muscle function based on analysis of only onelocomotor mode (swimming). Still, active tail oscillation occursonly during swimming (Burnell et al., 2012b). The kinematicand EMG data strongly suggest that the appendicular muscleexamined (caudofemoralis) does not function in oscillation of thetail, while the two axial muscles (iliocaudalis and longissimus)have different functions during tail oscillation.
The different functional roles proposed herein for the twostudied axial muscles appear to be based on differences inmuscle compliance and the activity patterns of the muscles(Figures 2, 7). These two muscles had similar enzymatic profiles(albeit with greater glycolytic activity in longissimus), wholemuscle physiology, and MHC profiles (Figure 8, Tables 1, 2).Functionally, the caudofemoralis is herein interpreted as a true“appendicular” muscle functioning to adduct the hindlimb,rather than displace the tail. The caudofemoralis differed fromthe two axial muscles examined not only in the EMG patterns,but also in SO fiber content, slower twitch contraction time,greater force (both twitch and tetanic), highest compliance, anda different MHC profile. The properties of caudofemoralis differsignificantly from those of the varanid appendicular musclesexamined by Young et al. (1990) which were all predominantlyfast twitch. It is not surprising to find discrepancies betweenEMG activity patterns and enzymatic fiber type profiles; inheterogeneous (non-compartmentalized) muscles like these,there is no way of knowing the enzymatic profile of the fiberswe were recording the EMG signals from. But the difficulties inreconciling our different data sets go beyond this.
In both the present study of V. salvator, and the earlierstudy of V. exanthamaticus, there is little relationship betweenthe enzymatic profile and the whole muscle physiologicalperformance (in terms of both force production and fatigue). Therelative lability of enzymatic fiber type categorization has longbeen recognized, particularly in relation to pH (e.g., Müntener,
1979). The categorization of the muscles examined in this studyas predominantly Type I (slow twitch) fibers was supported bythe slow contraction times recorded during the whole musclephysiology.
The analyses of muscle activation pattern, relative compliance,force production, MHC isoform composition, and fatigue wereall able to distinguish among the three examined muscles.Categorization of the muscles, and differentiation between them,becamemore difficult at the biochemical andmolecular levels. Allthree muscles had a similar preponderance of SO fibers (definedenzymatically), although the fast twitch and oxidative indexescould distinguish them. Similarly, the three muscles could bedistinguished from each other on the basis of differences inMHC isoform expression. But it is important to note that theenzymatic and MHC isoform profiles, while both segregatingcaudofemoralis from the axial muscles, are not fully congruentin that the MHC isoform profiles suggest the muscles have amajority of “fast” myosin while the enzymatic results suggesta majority of “slow” fibers. The caudofemoralis was mostdistinct, differing from the other two with respect to the relativeamounts of three MHC isoforms. Initial measurements (notshown) of shortening velocity in single fibers suggest thatmonitor fibers expressing bands 1 and/or 2 have markedlyhigher shortening velocity than fibers expressing the other MHCbands. The mass spectrometry results indicate that bands 1 and2 are fast-type MHC isoforms. The caudofemoralis also hada greater amount of band 5 (i.e., MHCI/β), compared to thelongissimus and iliocaudalis. These results provide additionalinsight into understanding theMHC isoform expression patternsamong single fibers in the examined muscles and will guideinterpretation of future measurements of contractile propertiesof single fibers in monitor muscles.
These findings suggest two, not mutually exclusive,explanations. First, the three muscles examined in the presentstudy may truly be quite similar on a molecular and biochemicallevel, with the main functional differences observed arising outof higher-level specialization of the muscle tendon complex(compliance) and neural control (activation patterns). Second,the standard methodology for lizard enzymatic fiber typing(Gleeson et al., 1980) and the gel formats that were employed forMHC isoform analysis (although adequate to distinguish amongthe muscles) may not reflect the entire compositional diversity ofthese skeletal muscles.
In an attempt to explore the distinctions between our MHCisoform and enzymatic analyses, we sought to identify theobserved MHC isoforms using not only mass spectrometry, butalso their relationship to the cardiac MHC isoforms of Varanus,because it is well known that there is shared expression of someMHC isoforms in cardiac and skeletal muscles. Water monitoratrial and ventricular samples expressed different MHC isoforms.This is in contrast to mammalian species, which consistentlyexhibit two cardiac MHC isoforms, MHC-α and MHC-β (e.g.,Hamilton and Ianuzzo, 1991). MHC-β is the same MHC isoformthat is expressed in mammalian limb slow fibers, where it isreferred to as MHC-I (e.g., Lompré et al., 1984; Yamauchi-Takihara et al., 1989; Rindt et al., 1993). The ventricularMHC andthe predominant atrialMHC of the watermonitor were identified
Frontiers in Physiology | www.frontiersin.org 11 September 2016 | Volume 7 | Article 380
Young et al. Skeletal Muscle Biology of Varanus
as orthologs of chicken ventricularMHC andmammalian cardiacMHC-α, respectively (see Results). The monitor ventricularMHC was not observed to be expressed in any of the examinedskeletal muscles and, given the presence of slow oxidative fibersin monitor skeletal muscles (this report), it appears that monitorslow fibers express an MHC isoform that is different from theventricular MHC isoform. In fact, the mass spectrometry resultsindicate that monitor MHC band 5 is an ortholog of mammalianslow-type MHC-I/β and it is possible that this MHC is expressedin the histochemically-identified slow oxidative fibers. Changesin the MHC isoforms expressed in a given muscle can lead todistinct functional differences. Recent work has reported greaterthan predicted power output in larger lizards (James et al., 2015),and used an assumption of constant relative force production tolook at scaling of limb mechanics in varanid lizards (Dick andClemente, 2016); neither study addressed inter-specific variationin MHC isoforms, although such variation (if present) wouldclearly influence the conclusions in both papers.
It is possible that skeletal muscle fibers of V. salvator havecharacteristics that remain to be identified that support specificfunctions during species-specific locomotion. Earlier studiesdemonstrated that varanids have a specialized aerobic capacitycompared to other lizards (reviewed by Frappell et al., 2002).Sustained activity levels in these lizards is supported by anefficient, and seemingly unique, unidirectional pulmonaryairflow pattern (Schachner et al., 2014). High cardiac output isachieved by Varanus through specialized Ca2+ transport withinthe cardiac myocytes (Galli et al., 2009). Warren et al. (2010)also documented intracellular specializations within the cardiac
myocytes of Varanus. It is possible that related intracellularspecializations, such as glycogen stores, buffering systems, lactatetransport capacity, the number and properties of mitochondriaincluding the efficiency of oxidative phosphorylation, andenzymes that drive oxidative metabolism, occur within skeletalmuscle fibers of Varanus. A more detailed analysis of thecomposition and functional performance of the skeletal musclefibers may explain the unusual pattern of molecular, biochemical,and physiological properties that are reported in thisstudy.
AUTHOR CONTRIBUTIONS
BY was responsible for the overall project design; BY, JD, andMM performed the EMG experiments; BY, NJ, BL, AM, and MMperformed the whole muscle physiology; NR and PR performedthe molecular analyses of the muscle; BY and PR were primarilyresponsible for the drafting of the manuscript.
ACKNOWLEDGMENTS
The authors wish to thank S. Collins for support and leadership,as well as A. Burnell and D. Han who assisted with someof the experiments, and J. Carroll who drafted Figure 1. Themonoclonal antibody, MF20, developed by Dr. Donald A.Fischman, Weill Cornell Medical College, was obtained fromthe Developmental Studies Hybridoma Bank, created by the
NICHD of the NIH and maintained at The University of Iowa,Department of Biology, Iowa City, IA 52242.
REFERENCES
Ast, J. C. (2001). Mitochondrial DNA evidence and evolution in Varanoidea
(Squamata). Cladistics 17, 211–226. doi: 10.1006/clad.2001.0169
Azizi, E., and Roberts, T. J. (2014). Geared up to stretch: pennate muscle behavior
during active lengthening. J. Exp. Biol. 217, 376–381. doi: 10.1242/jeb.094383
Bagnall, M., and McLean, D. (2014). Modular organization of axial microcircuits
in zebrafish. Science 343, 197–200. doi: 10.1126/science.1245629
Bergrin, M., Bicer, S., Lucas, C. A., and Reiser, P. J. (2006). Three-dimensional
compartmentalization of myosin heavy chain and light chain isoforms within
dog thyroarytenoid muscle.Am. J. Physiol. Cell Physiol. 290, C1446–C1458. doi:
10.1152/ajpcell.00323.2005
Bicer, S., and Reiser, P. J. (2004). Myosin light chain 1 isoforms in slow fibers from
global and orbital layers of canine rectus muscles. Invest. Ophthalmol. Vis. Sci.
45, 138–143. doi: 10.1167/iovs.03-0716
Blough, E. R., Rennie, E. R., Zhang, F., and Reiser, P. J. (1996). Enhanced
electrophoretic separation and resolution of myosin heavy chains in
avian and mammalian skeletal muscles. Anal. Biochem. 233, 31–35. doi:
10.1006/abio.1996.0003
Bottinelli, R. (2001). Functional heterogeneity of mammalian single muscle fibres:
do myosin isoforms tell the whole story? Pflugers Arch. Eur. J. Physiol. 443,
6–17. doi: 10.1007/s004240100700
Bredman, J. J., Weijs, W. A., Korfage, H. A., Brugman, P., and Moorman, A.
F. (1992). Myosin heavy chain expression in rabbit masseter muscle during
postnatal development. J. Anat. 180, 263–274.
Bredman, J. J., Wessels, A., Weijs, W. A., Korfage, J. A., Soffers, C. A., and
Moorman, A. F. (1991). Demonstration of ‘cardiac-specific’ myosin heavy chain
in masticatory muscles of human and rabbit. Histochem. J. 23, 160–170. doi:
10.1007/BF01046587
Burnell, A., Collins, S., and Young, B. A. (2012a). The postpulmonary
septum of Varanus salvator and its implication for Mosasaurian
ventilation and physiology. Bull. Soc. Geol. France 183, 159–169. doi:
10.2113/gssgfbull.183.2.159
Burnell, A., Collins, S., and Young, B. A. (2012b). Vertebral morphometrics
in Varanus. Bull. Soc. Geol. France 183, 149–158. doi: 10.2113/gssgfbull.
183.2.151
Caldwell, M., and Sasso, C. (2004). Soft-tissue preservation in a 95 million year
old marine lizard: form, function, and aquatic adaptation. J. Vert. Paleo. 24,
980–985. doi: 10.1671/0272-4634(2004)024[0980:SPIAMY]2.0.CO;2
Christian, A., and Garland, T. (1996). Scaling of limb proportions in monitor
lizards (Squamata: Varanidae). J. Herpetol. 30, 219–230. doi: 10.2307/15
65513
D’Août, K., and Aerts, P. (1997). Kinematics and efficiency of steady swimming in
adult axolotls (Ambystoma mexicanum). J Exp Biol. 200, 1863–1871.
Dick, T. J. M., and Clemente, C. J. (2016). How to build your dragon: scaling of
muscle architecture from the world’s smallest to the world’s largest monitor
lizard. Front. Zool. 13:8. doi: 10.1186/s12983-016-0141-5
Fouré, A., Comu, C., McNair, P., and Nordez, A. (2012). Gender differences in both
active and passive parts of the plantar flexors series elastic component stiffness
and geometrical parameters of the muscle-tendon complex. J. Orthop. Res. 30,
707–712. doi: 10.1002/jor.21584
Frappell, P., Schultz, T., and Christain, K. (2002). The respiratory system in varanid
lizards: determinants of O2 transfer. Comp. Biochem. Physiol. A 133, 239–258.
doi: 10.1016/S1095-6433(02)00147-2
Galli, G., Warren, D., and Shiels, H. (2009). Ca2+ cycling in cardiomyocetes
from a high-performance reptile, the varanid lizard (Varanus
exanthematicus). Am. J. Physiol. Reg. Integr. Physiol. 297, R1636–R1644.
doi: 10.1152/ajpregu.00381.2009
Frontiers in Physiology | www.frontiersin.org 12 September 2016 | Volume 7 | Article 380
Young et al. Skeletal Muscle Biology of Varanus
Gatesy, S. (1990). Caudofemoral musculature and the evolution of theropod
locomotion. Paleobiology 16, 170–186. doi: 10.1017/S0094837300009866
Gatesy, S. (1997). An electromyographic analysis of hindlimb function in Alligator
during terrestrial locomotion. J. Morphol. 234, 197–212.
Gleeson, T. T., Putman, R. W., and Bennett, A. F. (1980). Histochemical,
enzymatic, and contractile properties of skeletal muscle fibers in the lizard
Dipsosaurus dorsalis. J. Exp. Zool. 214, 293–302. doi: 10.1002/jez.1402140307
Hamilton, N., and Ianuzzo, C. D. (1991). Contractile and calcium regulating
capacities of myocardia of different sizedmammals scale with resting heart rate.
Mol. Cell. Biochem. 106, 133–141. doi: 10.1007/BF00230179
James, R. S., Vanhooydonck, B., Tallis, J. A., and Herrel, A. (2015). Larger lacertid
lizard species produce higher than expected iliotibialis muscle power output:
the evolution of muscle contractile mechanics with body size. J. Exp. Biol. 218,
3589–3595. doi: 10.1242/jeb.124974
Kablar, B., Krastel, K., Ying, C., Asakura, A., Tapscott, S., and Rudnicki, M. (1997).
MyoD and Myf-5 differentially regulate the development of limb versus trunk
skeletal muscle. Dev. 124, 4729–4738.
Knower, T., Shadwick, R., Katz, S., Graham, J., and Wardle, C. (1999). Red muscle
activation patterns in yellowfin (Thunnus albacares) and skipjack (Katsuwonus
pelamis) tunas during steady swimming. J. Exp. Biol. 202, 2127–2138.
Lacquaniti, F., Ivanenko, Y., and Zago, M. (2012). Patterned control of human
locomotion. J. Physiol. 590, 2189–2199. doi: 10.1113/jphysiol.2011.215137
Liu, H., Wassersug, R., and Kawachi, K., (1997). The three-dimensional
hydrodynamics of tadpole locomotion. J Exp Biol. 200, 2807–2819.
Lompré, A. M., Nadal-Ginard, B., and Mahdavi, V. (1984). Expression of
the cardiac ventricular alpha- and beta-myosin heavy chain genes is
developmentally and hormonally regulated. J. Biol. Chem. 259, 6437–6446.
Müntener, M. (1979). Variable pH dependence of the myosin-ATPase in different
muscles of the rat. Histochemistry 62, 299–304. doi: 10.1007/BF00508358
Neyt, C., Jagla, K., Thisse, C., Thisse, B., Haines, L., and Currie, P. (2000).
Evolutionary origins of vertebrate appendicular muscle.Nature 408, 82–86. doi:
10.1038/35040549
Osterlund, C., Lindström, M., Thornell, L. E., and Eriksson, P. O. (2012).
Remarkable heterogeneity in myosin heavy-chain composition of the human
young masseter compared with young biceps brachii.Histochem. Cell Biol. 138,
669–682. doi: 10.1007/s00418-012-0985-5
Pedrosa-Domellöf, F., Eriksson, P. O., Butler-Browne, G. S., and Thornell, L. E.
(1992). Expression of alpha-cardiac myosin heavy chain in mammalian skeletal
muscle. Experientia 48, 491–494. doi: 10.1007/BF01928171
Pianka, E., King, D., and King, R. (2004). Varanoid Lizards of the World.
Bloomington, IN: Indiana University Press.
Rahnert, J. A., Sokoloff, A. J., and Burkholder, T. J. (2010). Sarcomeric myosin
expression in the tongue body of humans, macaques and rats. Cells Tissues
Organs 191, 431–442. doi: 10.1159/000258678
Rao, M., Donoghue, M., Merlie, J., and Sanes, J. (1996). Distinct regulatory
elements control muscle-specific, fiber-type-selective, and axially graded
expression of a myosin light-chain gene in transgenic mice. Mol. Cell. Biol. 16,
3909–3922. doi: 10.1128/MCB.16.7.3909
Reiser, P. J., and Bicer, S. (2014). Electrophoretic separation of reptilian skeletal
and cardiac muscle myosin heavy chain isoforms: dependence on gel format.
Electrophoresis 35, 2615–2620. doi: 10.1002/elps.201400221
Reiser, P. J., and Kline, W. O. (1998). Electrophoretic separation and quantitation
of cardiac myosin heavy chain isoforms in eight mammalian species. Am. J.
Physiol. Heart Circ. Physiol. 274, H1048–H1053.
Rindt, H., Gulick, J., Knotts, S., Neumann, J., and Robbins, J. (1993). In vivo
analysis of the murine beta-myosin heavy chain gene promoter. J. Biol. Chem.
268, 5332–5338.
Schachner, E., Cleri, R., Butler, J., and Famer, C. (2014). Unidirectional pulmonary
sirflow patterns in the savannah monitor lizard. Nature 506, 367–370. doi:
10.1038/nature12871
Schilling, N. (2011). Evolution of the axial system in craniates: morphology and
function of the perivertebral musculature. Front. Zool. 8:4. doi: 10.1186/1742-
9994-8-4
Somi, S., Klein, A. T. J., Houweling, A. C., Ruijter, J. M., Buffing, A. A. M.,
Moorman, A. F. M., et al. (2006). Atrial and ventricular myosin heavy-chain
expression in the developing chicken heart: strengths and limitations of non-
radioactive in situ hybridization. J. Histochem. Cytochem. 54, 649–664. doi:
10.1369/jhc.5A6846.2006
Spangenburg, E. E., and Booth, F. W. (2003). Molecular regulation of
individual skeletal muscle fiber types. Acta Physiol. Scand. 178, 413–424. doi:
10.1046/j.1365-201X.2003.01158.x
Vogel, S., and Labarbera, M. (1978). Simple flow tanks for research and teaching.
Bioscience 28, 638–643. doi: 10.2307/1307394
Warren, D., Galli, G., Patrick, S., and Shiels, H. (2010). The cellular force-
frequency response in ventricular myocytes from the varanid lizard, Varanus
exanthemticus. Amer. J. Physiol.: Reg. Integr. Physiol. 298, R567–R574. doi:
10.1152/ajpregu.00650.2009
Yamauchi-Takihara, K., Sole, M. J., Liew, J., Ing, D., and Liew, C. C. (1989).
Characterization of human cardiac myosin heavy chain genes. Proc. Natl. Acad.
Sci. U.S.A. 86, 3504–3508. doi: 10.1073/pnas.86.10.3504
Young, B., Boetig, M., Fahey, A., and Lawrence, A. (2008). The diversity of aquatic
locomotion in extant varanoid lizards. Fort Hays Studies Spec. Iss. 3, 159–167.
Young, B., Magon, D., and Goslow, G. (1990). Length-tension and histochemical
properties of select shoulder muscles of the savannah monitor lizard (Varanus
exanthematicus): implications for function and evolution. J. Exp. Zool. 256,
63–74. doi: 10.1002/jez.1402560109
Conflict of Interest Statement: The authors declare that the research was
conducted in the absence of any commercial or financial relationships that could
be construed as a potential conflict of interest.
The reviewer HF and handling Editor declared their shared affiliation, and
the handling Editor states that the process nevertheless met the standards of a fair
and objective review.
Copyright © 2016 Young, Dumais, John, Lyons, Macduff, Most, Reiser and Reiser.
This is an open-access article distributed under the terms of the Creative Commons
Attribution License (CC BY). The use, distribution or reproduction in other forums
is permitted, provided the original author(s) or licensor are credited and that the
original publication in this journal is cited, in accordance with accepted academic
practice. No use, distribution or reproduction is permitted which does not comply
with these terms.
Frontiers in Physiology | www.frontiersin.org 13 September 2016 | Volume 7 | Article 380