functional annotation of the human brain methylome ... · research open access functional...
TRANSCRIPT

RESEARCH Open Access
Functional annotation of the human brainmethylome identifies tissue-specific epigeneticvariation across brain and bloodMatthew N Davies1,2, Manuela Volta1, Ruth Pidsley1, Katie Lunnon1, Abhishek Dixit1, Simon Lovestone1,Cristian Coarfa3, R Alan Harris3, Aleksandar Milosavljevic3, Claire Troakes1, Safa Al-Sarraj1, Richard Dobson1,Leonard C Schalkwyk1 and Jonathan Mill1*
Abstract
Background: Dynamic changes to the epigenome play a critical role in establishing and maintaining cellularphenotype during differentiation, but little is known about the normal methylomic differences that occur betweenfunctionally distinct areas of the brain. We characterized intra- and inter-individual methylomic variation acrosswhole blood and multiple regions of the brain from multiple donors.
Results: Distinct tissue-specific patterns of DNA methylation were identified, with a highly significant over-representation of tissue-specific differentially methylated regions (TS-DMRs) observed at intragenic CpG islands andlow CG density promoters. A large proportion of TS-DMRs were located near genes that are differentially expressedacross brain regions. TS-DMRs were significantly enriched near genes involved in functional pathways related toneurodevelopment and neuronal differentiation, including BDNF, BMP4, CACNA1A, CACA1AF, EOMES, NGFR, NUMBL,PCDH9, SLIT1, SLITRK1 and SHANK3. Although between-tissue variation in DNA methylation was found to greatlyexceed between-individual differences within any one tissue, we found that some inter-individual variation wasreflected across brain and blood, indicating that peripheral tissues may have some utility in epidemiological studiesof complex neurobiological phenotypes.
Conclusions: This study reinforces the importance of DNA methylation in regulating cellular phenotype acrosstissues, and highlights genomic patterns of epigenetic variation across functionally distinct regions of the brain,providing a resource for the epigenetics and neuroscience research communities.
BackgroundDNA methylation is a key epigenetic mechanisminvolved in the developmental regulation of gene expres-sion [1], but the tissue-specific nature of DNA methyla-tion has not been fully characterized at a genomic level.Epigenetic processes control several neurobiological andcognitive processes, including neurogenesis and braindevelopment [2], neuronal activity [3], learning andmemory [4], drug addiction [5], neurodegeneration [6],and circadian rhythm [7]. The importance of DNAmethylation in normal brain function and developmentis exemplified by the neurodevelopmental deficits
associated with mutations in the methyl CpG bindingprotein 2 gene (MECP2) in Rett syndrome [8], and theaberrant DNA methylation signatures observed in neu-ropsychiatric disorders, including schizophrenia andbipolar disorder [9]. Although gene expression analyseshave highlighted clear transcriptomic differences acrossbrain regions [10-12], current studies of tissue-specificDNA methylation in the brain have assessed only asmall percentage of CpG sites in the human genome[13], and none has taken an unbiased methylome-wideapproach across multiple brain regions and bloodobtained from the same individuals. Little is known,therefore, about normal methylomic differences betweenfunctionally distinct areas of the brain and how thesecorrespond to patterns observed in easily accessible per-ipheral tissues such as blood. In this study we used
* Correspondence: [email protected] of Psychiatry, King’s College London, De Crespigny Park, London,SE5 8AF, UKFull list of author information is available at the end of the article
Davies et al. Genome Biology 2012, 13:R43http://genomebiology.com/2012/13/6/R43
© 2012 Davies et al.; licensee BioMed Central Ltd. This is an open access article distributed under the terms of the Creative CommonsAttribution License (http://creativecommons.org/licenses/by/2.0), which permits unrestricted use, distribution, and reproduction inany medium, provided the original work is properly cited.

methylated DNA immunoprecipitation combined withultra-deep sequencing (MeDIP-seq) to profile themethylomic landscape across multiple dissected brainregions and blood obtained from multiple individuals.We present annotated maps of the brain methylome,representing a unique resource for the genomics andneuroscience research communities, identifying keyregions of the genome characterized by functionallyrelevant tissue-specific DNA methylation.
Results and discussionMethylomic profiling across brain and bloodOur primary methylomic profiling experiments usedmultiple dissected brain regions (inferior frontal gyrus,middle frontal gyrus, entorhinal cortex, superior tem-poral gyrus of the temporal cortex, visual cortex, andcerebellum) from post-mortem brain samples obtainedfrom individuals free of any neuropathology and neu-ropsychiatric disease. From a subset of these indivi-duals, whole blood samples were also obtainedlongitudinally prior to death. A detailed list of the pri-mary samples used in this study is given in Supple-mentary Table 1 in Additional file 1. Of these, 21tissue samples from three individuals (two female, onemale) were initially assessed using ultra-deep paired-end MeDIP-seq (see Materials and methods). Afterstringent quality control (Supplementary Figure 1 inAdditional file 1), an average of >70.4 million uniquelymapped 50 bp reads were obtained from each of the21 samples (Supplementary Table 2 in Additional file1); to our knowledge, this represents the largestbetween-individual and cross-tissue DNA methylationdataset yet produced. To generate an estimate of actualDNA methylation from our MeDIP-seq data, we usedthe MEDIPS analysis package [14] to control for localCpG density and generate DNA methylation scores foroverlapping 500 bp bins across the genome. Bisulfitepyrosequencing was used to verify DNA methylationestimates at selected regions of the genome, and exam-ine base pair-specific levels of DNA methylation acrossnominated regions in additional brain and blood sam-ples. Normalized raw MeDIP-seq reads and MEDIPS-estimated absolute DNA methylation values for eachtissue/individual combination are available as aresource for download and browsing as UCSC tracksfrom our laboratory website [15]. The data are alsobeing integrated into the Human Epigenome Atlas[16,17] as part of the regular data release by NIH Epi-genomics Roadmap Initiative [18].
Genome-wide DNA methylation across cortex, cerebellumand peripheral blood is highly tissue-specificAs expected, canonical genic DNA methylation profilesdo not differ across samples or tissue types, with overall
low average DNA methylation around the immediatetranscription start site, high levels of DNA methylationacross the gene body, and more subtle hypomethylationbeing observed at the 3’ end of genes (SupplementaryFigure 2 in Additional file 1), confirming previous obser-vations [19]. Genome-wide, however, there are strikingtissue-specific differences in DNA methylation, with aclear hierarchical distinction between the six corticalregions, cerebellum and blood (Figure 1a, b). Thesebroad differences reflect the known developmental path-ways of the three tissues; blood cells originate from themesoderm, while cells of the central nervous system areectodermic. Within the brain, the cerebellum developsfrom the metencephalon, whilst the cerebral cortexdevelops from the most anterior part of the neural plate(the telencephalon). The cortex itself is subdivided intonumerous functionally distinct anatomical regions, spe-cializing in sensory, motor, and association tasks.
DNA methylation varies across different functionallyannotated regions of the genomeWe defined feature sets spanning i) all annotated CpGislands (CGIs), sub-typed by location (gene promoter,intragenic, 3’ UTR, and intergenic) as described pre-viously [19], ii) CGI shores (spanning 2,000 bp up- anddownstream of each CGI), and iii) all annotated codingsequences (CDSs). We also examined tissue-specific pat-terns of DNA methylation across gene promotersdefined by low, medium and high CG content (LCPs,ICPs, and HCPs, respectively) [20]. BED files of the fea-ture annotations used in this study (CGIs, CGI shores,CDSs, LCPs, ICPs, and HCPs) are available for down-load from our laboratory webpage [15]. DNA methyla-tion across each feature was quantified using bothnormalized MeDIP-seq read counts and MEDIPS scores;Figure 2a shows the average DNA methylation levels foreach feature type. As described previously [21], CGIs aresignificantly hypomethylated compared to CGI shoresand the gene body, with no overall difference in canoni-cal methylation patterns between tissues or individuals.There is, however, considerable heterogeneity in DNAmethylation across different categories of CGI, depen-dent upon genomic location, with promoter CGIs beingsignificantly hypomethylated in comparison to intra-genic, 3’ UTR, and intergenic CGIs. CGI shores, on theother hand, do not vary significantly as a function ofgenomic location. Although the majority of promoters(approximately 60%) are associated with CGIs, not allpromoter regions are hypomethylated; promoter methy-lation is inversely correlated with CG density, with LCPsbeing the most methylated of any feature type tested. Incontrast, HCPs (which overlap considerably with promo-ter CGIs) are hypomethylated relative to the otherfeatures.
Davies et al. Genome Biology 2012, 13:R43http://genomebiology.com/2012/13/6/R43
Page 2 of 14

DNA methylation differs significantly between tissuesacross all annotated feature typesWe next examined tissue- and brain region-specificDNA methylation in the context of annotated genefeatures to identify regions of the genome harboringtissue-specific differentially methylated regions (TS-DMRs). Due to the overall similarity between the sixcortical regions, we initially focused on gross differ-ences between cortex, cerebellum and blood. Cross-tis-sue normalized MeDIP-seq data for all 65,535annotated features can be downloaded from ourlaboratory website [15]. For each broad category of fea-ture, hierarchical clustering of the MeDIP-seq data canclearly distinguish between tissue types (SupplementaryFigure 3 in Additional file 1). The top 50 variablymethylated annotated features across cortex, cerebel-lum and blood are listed in Supplementary Table 3 inAdditional file 1. Using Illumina 450 K HumanMethy-lation microarray data obtained from matched cerebel-lum, frontal cortex, and whole blood samples from 90individuals being assessed by our group as part of anongoing clinical epigenetics study (Mill et al., unpub-lished data), we were able to confirm that the vastmajority of these features are true TS-DMRs (Supple-mentary Table 4 in Additional file 1); 74% of the 206probes mapping to the broad genomic regions covered
by these features were characterized by false discoveryrate-significant intra-individual between-tissue DNAmethylation differences in the direction predicted byour MeDIP-seq data.Ingenuity Pathway Analysis (IPA) of the most vari-
able features (defined as those with a coefficient ofvariance (CV) >1 across the three tissue types) high-lights a highly significant enrichment of functionalpathways involved in regulating developmental geneexpression (P = 8.83 × 10⁻²⁵), organismal development(P = 1.37 × 10⁻²⁰), and tissue differentiation (P = 2.34× 10⁻²⁰) (Supplementary Figure 4 in Additional file 1).Of note, given the origins of the samples used in thisanalysis, it is interesting that the primary tissue-speci-fic functional pathways enriched in the list of TS-DMRs are nervous system development and function(P = 4.60 × 10⁻²¹) and hematological system develop-ment and function (P = 3.61 × 10⁻⁸), indicating thatepigenetic differences are likely to be associated withsignificant phenotypic differences. Although TS-DMRsare distributed across all feature types, there aremarked differences in the between-tissue correlationof DNA methylation across each of the broad featurecategories we examined, with CGIs being more corre-lated across cortex, cerebellum and blood than CGIshores or CDSs (Figure 2b).
Figure 1 Methylomic profiling across multiple brain areas and blood from a cohort of individuals highlights clear tissue-specificdifferences in DNA methylation. (a, b) DNA methylation was calculated from ultra-deep MeDIP-seq data using 500 bp bins across thegenome, and the relationship between tissues determined by Pearson correlation (a) and unsupervised hierarchical clustering (b). BA, Brodmannarea; Ent Ctx, entorhinal cortex; STG, superior temporal gyrus; Vis Ctx, visual cortex.
Davies et al. Genome Biology 2012, 13:R43http://genomebiology.com/2012/13/6/R43
Page 3 of 14

TS-DMRs across brain regions are associated with stablegene expression differences and are highly enriched forfunctionally relevant neurobiological pathwaysWithin the brain, the top 50 differentially methylatedannotated features between cortical and cerebellumsamples are listed in Supplementary Table 5 in Addi-tional file 1. Strikingly, many of these DMRs are asso-ciated with genes of known relevance to cortical and/orcerebellar development and function, includingPPP2R2B (encoding a phosphatase implicated in thenegative control of cell growth and division, whose dis-ruption causes cerebellar ataxia [22]), JAKMIP1/MAR-LIN1 (encoding a RNA-binding protein that associateswith GABA receptors [23]), EOMES (encoding a tran-scriptional activator that plays a crucial role in braindevelopment, controlling the proliferation of intermedi-ate progenitor cells and their progeny in the cerebralcortex [24]), GPMB6 (encoding a proteolipid widelyexpressed in neurons and in oligodendrocytes [25]), andGRM4 (encoding a metabotropic glutamate receptorwith a distinct distribution in the brain, primarilyexpressed in cerebellar granule cells [26]). Furthermore,IPA of the top within-brain variable DMRs
(differentiating cortex from cerebellum) highlights a pri-mary network involved in nervous system developmentand function (Supplementary Figure 5 in Additional file1), with highly significant enrichment of developmen-tally relevant pathways, including neurogenesis (P = 1.76× 10⁻¹⁹), the guidance of neurites (P = 2.11 × 10⁻¹²),development of the cerebellum (P = 8.49 × 10⁻⁵) anddevelopment of the cortex (P = 1.11 × 10⁻⁴) (Supple-mentary Table 6 in Additional file 1).We next used RNA extracted from matched cerebel-
lum and frontal cortex (Brodmann area (BA)9) samples,obtained from an independent cohort of 42 additionalindividuals, to assess tissue-specific expression levels fordetectable gene transcripts located in the vicinity of thetop 50 cortex-cerebellum DMRs. The majority (82%) ofthese DMRs are mirrored by significant (P < 0.05) geneexpression differences between cerebellum and frontalcortex (Supplementary Table 7 in Additional file 1),with 61% of genes being represented by at least oneprobe with a highly significant (P < 1 × 10⁻¹⁰) expressiondifference across the two brain regions. Interestingly,DNA methylation at these DMRs is not always nega-tively correlated with gene expression; EOMES, for
Figure 2 Although DNA methylation at CGIs is relatively conserved across tissues, intragenic CGIs are dramatically over-representedand promoter CGIs under-represented in the most tissue-variable CGIs. (a) Average DNA methylation values calculated by MEDIPS fromMeDIP-seq data for all annotated gene features: CGIs (yellow), CGI shores (blue), gene promoters (red) and CDSs (green). DNA methylation islower in promoter CGIs compared to intragenic, 3’ UTR and intergenic CGIs. CGI shores are characterized by higher DNA methylation than CGIs,with less location-dependent variation. Promoter DNA methylation shows a strong inverse correlation with GC density, with LCPs showing ahigher average level of DNA methylation than CDSs. Error bars represent standard error of the mean. (b) Although TS-DMRs are distributedacross all feature types, there are marked differences in the between-tissue correlation of DNA methylation across each of the broad featurecategories we examined, with CGIs being more correlated across cortex, cerebellum and blood than CGI shores or CDSs. (c, d) There is a highlysignificant enrichment of intragenic CGIs (P = 2 × 10-102) in analyses of CGI DMRs differentiating blood, cortex and cerebellum (c), and an evenmore dramatic enrichment (P = 1 × 10-246) in comparisons between cortex and cerebellum (d). EXP, expected; OBS, observed.
Davies et al. Genome Biology 2012, 13:R43http://genomebiology.com/2012/13/6/R43
Page 4 of 14
example, shows highly significant elevated expression inthe cerebellum compared to the frontal cortex (log2expression values = 9.25 versus 6.46, P = 1.90 × 10⁻³³).An analysis of publically available gene expression data[12] confirms many of these gene expression differencesand demonstrates that many of the cortex-cerebellumDMRs are associated with developmentally stable geneexpression differences between the brain regions (Sup-plementary Figure 6 in Additional file 1). This furthersupports the notion that the TS-DMRs identified heremediate functionally important differences in the cellulartranscriptome.
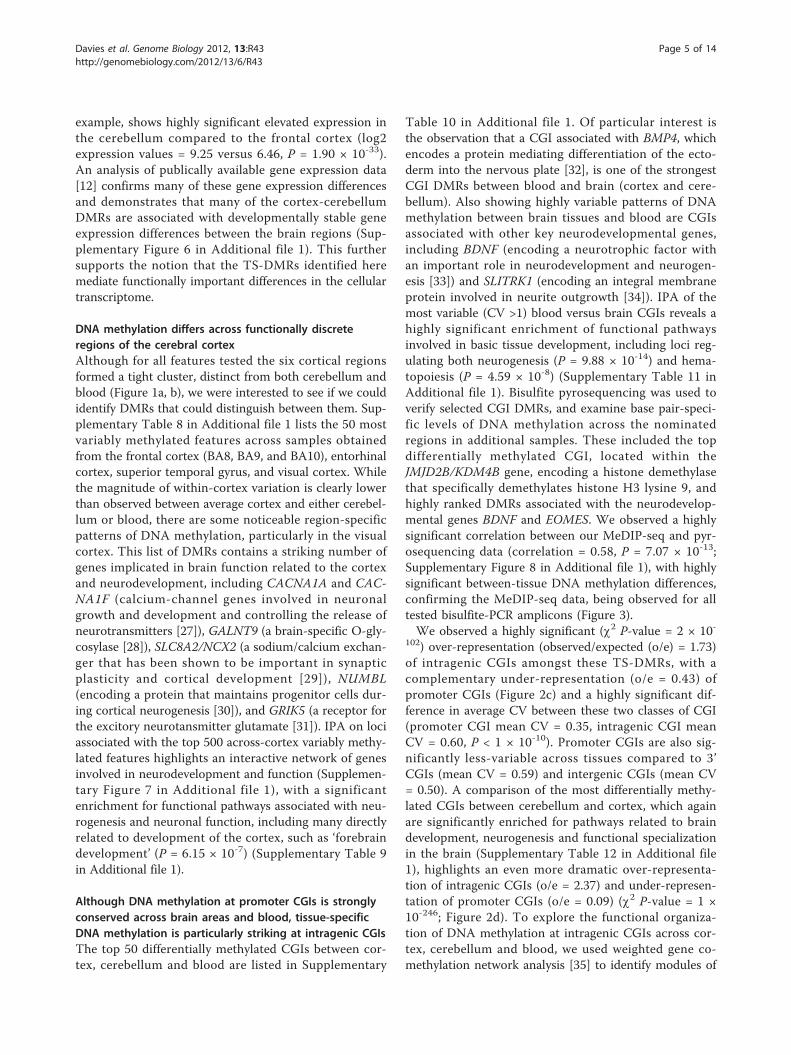
DNA methylation differs across functionally discreteregions of the cerebral cortexAlthough for all features tested the six cortical regionsformed a tight cluster, distinct from both cerebellum andblood (Figure 1a, b), we were interested to see if we couldidentify DMRs that could distinguish between them. Sup-plementary Table 8 in Additional file 1 lists the 50 mostvariably methylated features across samples obtainedfrom the frontal cortex (BA8, BA9, and BA10), entorhinalcortex, superior temporal gyrus, and visual cortex. Whilethe magnitude of within-cortex variation is clearly lowerthan observed between average cortex and either cerebel-lum or blood, there are some noticeable region-specificpatterns of DNA methylation, particularly in the visualcortex. This list of DMRs contains a striking number ofgenes implicated in brain function related to the cortexand neurodevelopment, including CACNA1A and CAC-NA1F (calcium-channel genes involved in neuronalgrowth and development and controlling the release ofneurotransmitters [27]), GALNT9 (a brain-specific O-gly-cosylase [28]), SLC8A2/NCX2 (a sodium/calcium exchan-ger that has been shown to be important in synapticplasticity and cortical development [29]), NUMBL(encoding a protein that maintains progenitor cells dur-ing cortical neurogenesis [30]), and GRIK5 (a receptor forthe excitory neurotansmitter glutamate [31]). IPA on lociassociated with the top 500 across-cortex variably methy-lated features highlights an interactive network of genesinvolved in neurodevelopment and function (Supplemen-tary Figure 7 in Additional file 1), with a significantenrichment for functional pathways associated with neu-rogenesis and neuronal function, including many directlyrelated to development of the cortex, such as ‘forebraindevelopment’ (P = 6.15 × 10⁻⁷) (Supplementary Table 9in Additional file 1).
Although DNA methylation at promoter CGIs is stronglyconserved across brain areas and blood, tissue-specificDNA methylation is particularly striking at intragenic CGIsThe top 50 differentially methylated CGIs between cor-tex, cerebellum and blood are listed in Supplementary
Table 10 in Additional file 1. Of particular interest isthe observation that a CGI associated with BMP4, whichencodes a protein mediating differentiation of the ecto-derm into the nervous plate [32], is one of the strongestCGI DMRs between blood and brain (cortex and cere-bellum). Also showing highly variable patterns of DNAmethylation between brain tissues and blood are CGIsassociated with other key neurodevelopmental genes,including BDNF (encoding a neurotrophic factor withan important role in neurodevelopment and neurogen-esis [33]) and SLITRK1 (encoding an integral membraneprotein involved in neurite outgrowth [34]). IPA of themost variable (CV >1) blood versus brain CGIs reveals ahighly significant enrichment of functional pathwaysinvolved in basic tissue development, including loci reg-ulating both neurogenesis (P = 9.88 × 10⁻¹⁴) and hema-topoiesis (P = 4.59 × 10⁻⁸) (Supplementary Table 11 inAdditional file 1). Bisulfite pyrosequencing was used toverify selected CGI DMRs, and examine base pair-speci-fic levels of DNA methylation across the nominatedregions in additional samples. These included the topdifferentially methylated CGI, located within theJMJD2B/KDM4B gene, encoding a histone demethylasethat specifically demethylates histone H3 lysine 9, andhighly ranked DMRs associated with the neurodevelop-mental genes BDNF and EOMES. We observed a highlysignificant correlation between our MeDIP-seq and pyr-osequencing data (correlation = 0.58, P = 7.07 × 10⁻¹³;Supplementary Figure 8 in Additional file 1), with highlysignificant between-tissue DNA methylation differences,confirming the MeDIP-seq data, being observed for alltested bisulfite-PCR amplicons (Figure 3).We observed a highly significant (c2 P-value = 2 × 10-
102) over-representation (observed/expected (o/e) = 1.73)of intragenic CGIs amongst these TS-DMRs, with acomplementary under-representation (o/e = 0.43) ofpromoter CGIs (Figure 2c) and a highly significant dif-ference in average CV between these two classes of CGI(promoter CGI mean CV = 0.35, intragenic CGI meanCV = 0.60, P < 1 × 10⁻¹⁰). Promoter CGIs are also sig-nificantly less-variable across tissues compared to 3’CGIs (mean CV = 0.59) and intergenic CGIs (mean CV= 0.50). A comparison of the most differentially methy-lated CGIs between cerebellum and cortex, which againare significantly enriched for pathways related to braindevelopment, neurogenesis and functional specializationin the brain (Supplementary Table 12 in Additional file1), highlights an even more dramatic over-representa-tion of intragenic CGIs (o/e = 2.37) and under-represen-tation of promoter CGIs (o/e = 0.09) (c2 P-value = 1 ×10-246; Figure 2d). To explore the functional organiza-tion of DNA methylation at intragenic CGIs across cor-tex, cerebellum and blood, we used weighted gene co-methylation network analysis [35] to identify modules of
Davies et al. Genome Biology 2012, 13:R43http://genomebiology.com/2012/13/6/R43
Page 5 of 14

Figure 3 Verification and replication of MeDIP-seq data for three top-ranked CGI DMRs. (a, b) Tissue-specific DNA methylation across anintragenic CGI in the JMJD2B/KDM4B gene. (a) MeDIP-seq analysis shows this region is hypermethylated in blood DNA compared to cortex andcerebellum (the red bar depicts the region subsequently analyzed by bisulfite pyrosequencing). (b) Pyrosequencing data for this region in anextended sample set confirm significant tissue-specific methylation patterns (P = 2 × 10⁻⁸). (c, d) Tissue-specific DNA methylation across a CGI inthe promoter of the EOMES gene. (c) MeDIP-seq analysis shows this region is hypermethylated in cerebellum DNA compared to cortex andblood. (d) Pyrosequencing data for this region in an extended sample set confirm significant tissue-specific methylation patterns (P = 2 × 10⁻⁵).(e, f) Tissue-specific DNA methylation across an intragenic CGI in the BDNF gene. (e) MeDIP-seq analysis shows this region is hypermethylated inblood DNA compared to cortex and cerebellum from the same individuals. (f) Pyrosequencing data for this region in an extended sample setconfirm significant tissue-specific methylation patterns (P = 4 × 10⁻⁹). Error bars represent standard error of the mean.
Davies et al. Genome Biology 2012, 13:R43http://genomebiology.com/2012/13/6/R43
Page 6 of 14

co-methylated features via unsupervised hierarchicalclustering on the basis of high topological overlap (seeMaterials and methods). Six modules were identifiedwith clear tissue-specific patterns, demonstrating thatthe methylome is organized into modules of co-methy-lated features (Figure 4a). The strongest tissue-specificmodule (blue), composed of approximately 1,000 intra-genic CGIs that were hypomethylated in the cortexcompared to cerebellum and blood (Pearson correlation= -0.98, P = 4 × 10⁻⁵), representing a network of genesinvolved in nervous system development and function(Figure 4b) and significantly enriched for functionalpathways, including neurogenesis (P = 2.47 × 10⁻²⁵) andthe differentiation of neurons (P = 6.18 × 10⁻¹⁸). Analy-sis of the top 5% of genes ranked by module member-ship using publically available gene expression datasetsby GeneMania [36] showed that 58.9% are also coex-pressed, indicating that the co-methylation networksidentified here map onto functional gene coexpressionnetworks. Furthermore, genes in this module are signifi-cantly enriched in relevant gene expression modulesfrom published brain gene expression datasets (Supple-mentary Table 13 in Additional file 1). A role for differ-ential DNA methylation at intragenic CGIs acrossdifferent cell types in the mouse hematopoietic lineagehas been recently reported [37], and it has been sug-gested that these features may regulate transcriptionfrom alternative promoters across specific cell types[19].
On average, CGI shores show more tissue-specific DNAmethylation than CGIs, but do not vary by genic locationCGI shores have been previously shown to harbor phe-notypically relevant tissue-specific patterns of DNAmethylation [21]. Compared to CGIs, we found CGIshores to be significantly more variable across brainareas and blood (average CGI CV = 0.46, average CGIshore CV = 0.57, P < 1 × 10⁻¹⁰), with DNA methylationnoticeably less correlated across tissues, especiallybetween brain (cortex and cerebellum) and blood (Fig-ure 2b). Unlike for CGIs, however, the location of CGIshores makes little impact on their variability across tis-sues with no over-representation of intragenicallylocated features (Supplementary Figure 9 in Additionalfile 1). The top 50 differentially methylated CGI shoresbetween cortex, cerebellum and blood are listed in Sup-plementary Table 14 in Additional file 1. Strikingly,many are associated with genes of known neurobiologi-cal function, including PCDH9 (encoding a cadherin-related neuronal receptor that localizes to synaptic junc-tions, involved in specific neuronal connections and sig-nal transduction [38]), NGFR (encoding the receptor fornerve growth factor, with widespread effects on neuro-development [39]), AUTS2 (encoding the autism
susceptibility candidate 2, a nuclear protein expressed indeveloping brain regions [40]), SHANK3 (encoding ascaffold protein involved in the structural and functionalorganization of the post-synaptic density and also impli-cated in autism [41]), and SLIT1 (encoding a proteinwith a key role in cortical development and synaptogen-esis [42]). IPA of the most variable CGI shores againreveals a highly significant enrichment for functionalpathways involved in nervous system function anddevelopment (Supplementary Table 15 in Additional file1). Bisulfite pyrosequencing was used to confirm andreplicate the two top-ranked CGI shore DMRs, whichare highly significantly hypermethylated specifically inthe cerebellum, flanking a hypomethylated intergenicCGI on chromosome 7 (Supplementary Figure 1 inAdditional file 10). Again, our pyrosequencing data weresignificantly correlated with the MEDIPS scores acrosseach of the three amplicons spanning this region (leftshore, correlation = 0.76, P = 5.58 × 10⁻⁵; CGI, correla-tion = 0.80, P = 1.18 × 10⁻⁵; right shore, correlation =0.82, P = 4.36 × 10⁻⁶), confirming the validity of themethylome data.
Low CG content promoters are also characterized bywidespread tissue-specific DNA methylation across brainregions and bloodOur CGI data concur with the notion that CpG-richpromoters (that is, HCPs) are predominantly hypo-methylated and associated with ubiquitously expressedhouse-keeping genes [20,43]. We next decided to com-pare HCP methylation with that seen in LCPs; recentmethylomic analyses of other tissues indicate that differ-ential DNA methylation across LCPs is associated withtissue-specific gene expression in somatic cells [20]. Ourdata provide strong evidence to support this notion, andlike intragenic CGIs, LCPs appear to be a major locationfor tissue-specific DNA methylation signatures acrossbrain regions and blood. While hierarchical clustering ofboth HCP and LCP DNA methylation can distinguishbetween tissues, the Euclidian distance between tissuesis much larger in the case of LCPs (Figure 5a). Principalcomponents analysis of our MeDIP-seq data shows amuch stronger tissue classification based upon LCPmethylation (Figure 5b), and correlation analyses showthat while HCP methylation is largely conserved acrosstissues (reflecting the pattern seen for promoter CGIs),the correlation of LCP methylation across tissues ismuch lower.
Between-individual differences in DNA methylation arecorrelated across brain and bloodBecause aberrant DNA methylation is being increasinglyimplicated in the etiology of complex disease phenotypes,including several mental health disorders [44], a key
Davies et al. Genome Biology 2012, 13:R43http://genomebiology.com/2012/13/6/R43
Page 7 of 14
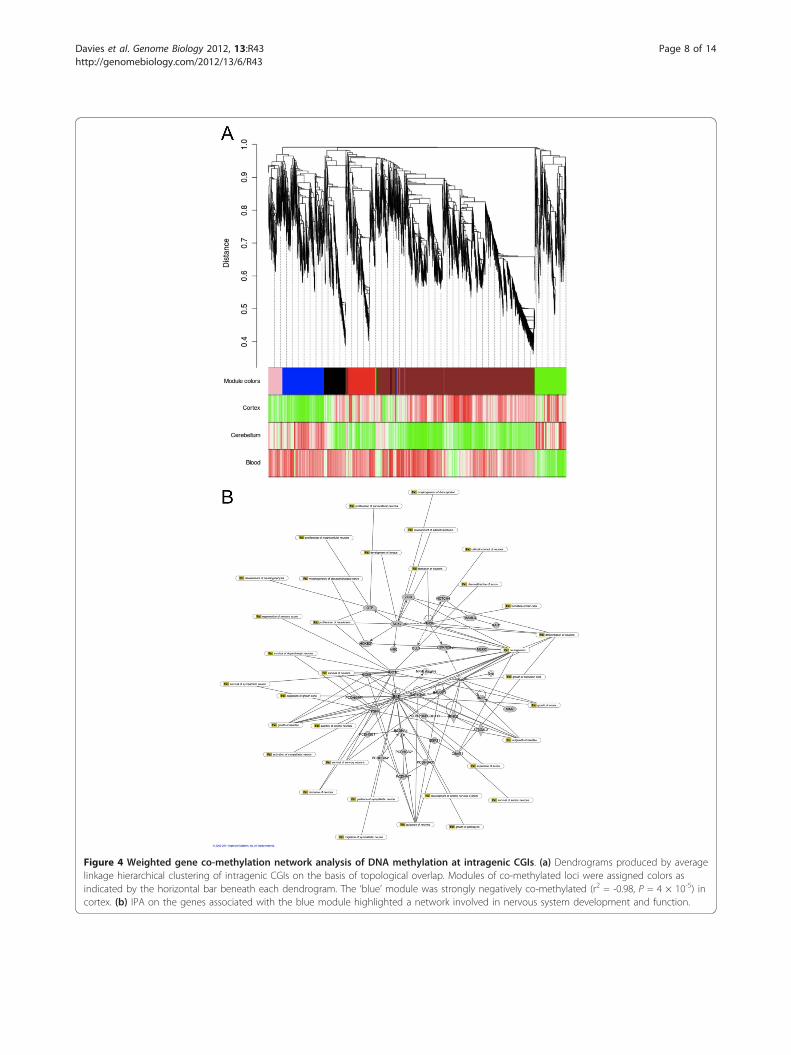
Figure 4 Weighted gene co-methylation network analysis of DNA methylation at intragenic CGIs. (a) Dendrograms produced by averagelinkage hierarchical clustering of intragenic CGIs on the basis of topological overlap. Modules of co-methylated loci were assigned colors asindicated by the horizontal bar beneath each dendrogram. The ‘blue’ module was strongly negatively co-methylated (r2 = -0.98, P = 4 × 10⁻⁵) incortex. (b) IPA on the genes associated with the blue module highlighted a network involved in nervous system development and function.
Davies et al. Genome Biology 2012, 13:R43http://genomebiology.com/2012/13/6/R43
Page 8 of 14

question in epigenetic epidemiology concerns the extentto which easily accessible peripheral tissues (for example,whole blood) can be used to ask questions about inter-individual phenotypic variation manifest in inaccessibletissues such as the brain [45,46]. Our use of brain tissueand blood obtained pre-mortem from the same individualsenabled us to investigate the extent to which between-individual methylomic variation in the blood is reflectedacross the cortex and cerebellum. Comparing MeDIP-seqdata from blood, cortex and cerebellum, we observe thatinter-individual DNA methylation differences are highestin blood and lowest in the cortex, with a highly significantdifference in variability across tissues (P < 0.001; Figure6a). The pattern of relative inter-individual variability byfeature is, however, the same across tissues, with non-pro-moter CGIs showing a significantly higher level ofbetween-individual DNA methylation differences thanother features. Strikingly, there is a significant correlationbetween individual DNA methylation differences in theblood and those in brain tissue (cortex and cerebellum)from the same two individuals (Figure 6b), with the mostreproducible pattern of blood-detected individual differ-ences observed in the cerebellum (correlation = 0.76, P <0.001) and slightly less correlation between blood and cor-tex (correlation = 0.66, P < 0.001). Although replicateDNA samples from each individual were assessed usinghigh-resolution SNP arrays to identify potential structuralvariants and minimize the confounding effect of inter-indi-vidual copy-number variations (CNVs) that could manifestas MeDIP-seq read differences (see Materials and meth-ods), the influence of genomic differences between indivi-duals cannot be fully excluded. Supplementary Table 16 inAdditional file 1 lists the top 50 between-individual differ-ences in DNA methylation identified in blood between thetwo female MeDIP-seq blood samples and lists the corre-sponding methylation scores from cortex and cerebellumfrom the same individuals. Interestingly, while many fea-tures show near-identical between-individual patternsacross all three tissues, some examples of blood-identifiedvariation are only detected in either the cortex or cerebel-lum. Given recent reports by us and others of widespreadgenotype-associated allele-specific DNA methylation [47],it is likely that many of these between-individual DNAmethylation differences are mediated by DNA sequencevariation that is common across tissues, although othermechanisms such as epigenetic changes occurring early indevelopment before complete tissue differentiation couldalso be important.
ConclusionsWe used MeDIP-seq to undertake the first genomiccharacterization of intra- and inter-individual variation
Figure 5 DNA methylation across LCPs is strongly associatedwith tissue type. (a) MEDIPS scores across both HCPs and LCPscan be used to accurately cluster samples by tissue type, but thestrength of clustering, indicated by Pearson dissimilarity on the y-axis, is much higher in LCPs. (b, c) This pattern is reflected in three-factor PCA plots (b) and correlation analyses (c), with LCPsdemonstrating stronger tissue-specific patterns of DNA methylationthan HCPs.
Davies et al. Genome Biology 2012, 13:R43http://genomebiology.com/2012/13/6/R43
Page 9 of 14

in DNA methylation across multiple regions of thehuman brain and an easily accessible peripheral tissue(whole blood). In summary, we show that between-tis-sue variation in DNA methylation greatly exceedsbetween-individual differences within any one tissue,with clear hierarchical differences in DNA methylationacross specific brain areas, and between brain andblood. Interestingly, we observe that TS-DMRs arestrikingly under-represented in classic promoter CGIs,being located primarily in intragenic CGIs and LCPs.These TS-DMRs are dramatically enriched for genesknown to be involved in brain development and neuro-biological function, forming networks of co-methylatedloci that define the cellular phenotype. Finally,although inter-individual differences in DNA methyla-tion are dwarfed by tissue-specific variation, and abso-lute levels of DNA methylation at specific loci clearlydiffers between cortex, cerebellum and blood, weobserve that some between-individual variation in
DNA methylation is correlated between brain regionsand blood.To our knowledge, this study represents the most
comprehensive cross-tissue inter-individual assessmentof the methylomic landscape of the brain yet underta-ken. The data generated in this project are available as aresource to the genomics research community; anno-tated UCSC tracks can be downloaded from our labora-tory website [15], and the raw data are being integratedinto the Human Epigenome Atlas [16] as part of theregular data release by NIH Epigenomics RoadmapInitiative. A primary goal of global research initiativessuch as the International Human Epigenome Consor-tium and the NIH Epigenomics Roadmap is to createhigh-resolution reference epigenome maps across multi-ple human tissue and cell types that will expedite theapplication of epigenomic technologies to studies ofhuman health and disease [18]. In this regard, and givenincreasing evidence supporting a role for epigenetic
Figure 6 Between-individual variation in DNA methylation is often correlated between blood and brain. (a) Between-individual variationin DNA methylation is highest in blood and lowest in the cortex. All tissues show a similarly significant (ANOVA P < 0.001) distribution ofvariability across features, with the greatest between-individual variation occurring in non-promoter CGIs. Scores represent the mean differencein normalized MeDIP-seq read density between individual 1 and 2 for each of the feature categories. Error bars represent standard error of themean. Features 1 to 4 = promoter, intragenic, 3’, and intergenic CGIs; features 4 to 8 = promoter, intragenic, 3’, and intergenic CGI shores;feature 9 = CDS; features 10 to 12 = HCPs, ICPs, and LCPs. (b) Between-individual differences in DNA methylation observed in blood aresignificantly (P < 0.001) correlated with differences observed in the cerebellum (correlation = 0.76) and cortex (correlation = 0.66) from the sameindividuals. Scores represent the mean difference in normalized MeDIP-seq read density between individual 1 and 2 for each of the quantifiedfeatures.
Davies et al. Genome Biology 2012, 13:R43http://genomebiology.com/2012/13/6/R43
Page 10 of 14

disruption in neuropsychiatric disease, a unique aspectof this study was our use of blood and multiple brainregions from the same individuals, enabling us toaddress questions about the extent to which easilyaccessible peripheral tissues can be used to ask ques-tions about inter-individual phenotypic variation mani-fest in inaccessible tissues such as the brain.In addition to creating reference maps of DNA methy-
lation across multiple brain regions and blood, we haveidentified key regions of the genome that are character-ized by tissue-specific patterns of DNA methylation. Ofnote, TS-DMRs were significantly enriched near genesinvolved in functional pathways related to neurodevelop-ment and neuronal differentiation, including BDNF,BMP4, CACNA1A, CACA1AF, EOMES, NGFR, NUMBL,PCDH9, SLIT1, SLITRK1, and SHANK3. Although DNAmethylation at promoter CGIs is largely conservedacross tissues, reflecting data from other studies, we findstriking evidence that intragenic CGIs are a primarylocation for TS-DMRs. This builds on recent data high-lighting cell type-specific DNA methylation at intragenicCGIs in the immune system [37], and evidence thatthese features may regulate transcription from alterna-tive promoters across specific cell types [19]. Our datahighlight LCPs as another region characterized by con-siderable cross-tissue epigenetic variation; again thesedata support recent methylomic analyses of other tis-sues, indicating that differential DNA methylation acrossLCPs is associated with tissue-specific gene expressionin somatic cells [20]. Given the striking enrichment oftissue-relevant pathways and gene sets amongst the lociassociated with the TS-DMRs we have identified, andthe observation that many of these genes are differen-tially expressed across brain regions (SupplementaryTable 7 and Supplementary Figure 6 in Additional file1), it is likely that they mediate functionally relevant dif-ferences in the cellular transcriptome.There are several limitations to this study. First,
although it represents one of the largest cross-tissuemethylomic analyses performed to date, the number ofindividuals profiled in our initial MeDIP-seq screen wasrelatively small. Our successful verification and replica-tion experiments (using bisulfite pyrosequencing and theIllumina 450 K array), combined with our gene expres-sion data, in larger number of samples, however, high-lights the validity of the between-tissue differences weobserve. Second, the samples used in our initial MeDIP-seq screen were all obtained from donors >75 years oldand may not fully represent patterns of DNA methyla-tion earlier in life. However, our observation of highlysignificant gene expression differences corresponding tothe top 50 cortex-cerebellum DMRs in a younger cohortof samples (average age = 62 ± 18 years) suggests thatmany of the tissue-specific differences observed are
developmentally stable, resulting in functional differ-ences at an earlier age. Future work should focus onidentifying developmental trajectories of epigeneticchange across multiple tissues.In summary, this study reinforces the importance of
DNA methylation in regulating cellular phenotypeacross tissues, and highlights genomic patterns of epige-netic variation across functionally distinct regions of thebrain.
Materials and methodsSample preparationPost-mortem brain samples from nine elderly controlindividuals (free of neuropathological and neuropsychia-tric disease) were obtained from the MRC London Neu-rodegenerative Diseases Brain Bank. Multiple brainregions were dissected from each sample by a trainedneuropathologist, snap-frozen and stored at -80°C.Genomic DNA was isolated from each dissected brainregion from each sample using a standard phenol-chloroform extraction method, and tested for degrada-tion and purity prior to analysis. From a subset of indi-viduals whole blood samples were also obtainedlongitudinally prior to death, and DNA extracted usinga standard phenol-chloroform method. A detailed list ofthe samples used for methylomic profiling in this studyis given in Supplementary Table 1 in Additional file 1.An independent set of matched frontal cortex and cere-bellum samples (average age = 62 ± 18 years, 33%female) for gene expression analysis was obtained from42 additional individuals provided by the London Neu-rodegenerative Diseases Brain Bank.
Methylated DNA immunoprecipitation and sequencingDNA was fragmented using a Covaris sonication systemand sequencing libraries were prepared from 5 μg frag-mented genomic DNA. End repair, <A> base additionand adaptor ligation steps were performed using Illumi-na’s Paired-End DNA Sample Prep kit. Adaptor-ligatedDNA was immunoprecipitated by anti-5mC using acommercial antibody (Diagenode, Liège, Belgium), andMeDIP products were validated by quantitative PCR.MeDIP DNA was purified with ZYMO DNA Clean &Concentrator-5 columns, and amplified using adaptor-mediated PCR. DNA fragments between 220 and 320 bpin size were gel-excised, and amplification quality andquantity were evaluated by Agilent BioAnalyzer analysis.The libraries were subjected to highly parallel 50 bppaired-end sequencing on the Illumina Hi-Seq platform.
Sequencing quality control and alignmentFrom the raw fastq files, Illumina quality scores wereconverted into Sanger Phred quality scores using MAQ[48]. Quality control was performed on the raw
Davies et al. Genome Biology 2012, 13:R43http://genomebiology.com/2012/13/6/R43
Page 11 of 14

sequence data using FastQC [49]. Supplementary Figure1 in Additional file 1 shows FastQC output for onerepresentative sample highlighting the high qualitysequencing data obtained. Alignment to hg18 was per-formed using the Burrows-Wheeler algorithm.
Correcting for local CpG densitiesThe MEDIPS package [14] was used to calculate methy-lation scores by incorporating a coupling factor basedon local CpG density. Bin sizes of 500 bp were definedacross the genome, with an overlap of 250 bp. Thenumber of CpGs within the maximal defined distancearound the genomic bin was calculated and a calibrationcurve determined relative to the dependency of localMeDIP-seq signal intensities and local CpG densities.
DMR calling across known features using normalized readcountsMapped reads were also quantified using SeqMonk(Babraham Institute, Cambridge, UK). BED files of thefeature annotations used in this study (CGIs, CGIshores, CDS, LCPs, ICPs, and HCPs) are available fordownload from our laboratory webpage [15]. Read-depth scores were generated for each feature, normal-ized for total read count and feature length. For eachfeature, the CV across tissues/samples was calculated(Standard deviation/(Mean + 1)) and ranked.
Weighted gene co-methylation network analysisWe employed weighted gene co-methylation networkanalysis [35,50,51] as described in R [52] to findweighted signed co-methylation networks (modules) inthe cortex, cerebellum and peripheral blood using logtransformed MEDIPS scores. For each genomic featurewe performed hierarchical clustering of the samples,based on Pearson correlation, and mapped the finalsample dendrogram to three traits (cortex, cerebellumand blood) to describe the sample-trait relationship.For each genomic feature type we performed hierarchi-cal clustering of the topological overlap matrix. Leavesof the tree were grouped into modules, which is a clus-ter of highly co-methylated genomic locations (GL).After finding the modules, the next step was todescribe the relationship between modules and eachtissue (that is, cortex, cerebellum and peripheralblood). For this we calculated the Pearson correlationcoefficient for the module representative also known asmodule eigengene (ME), which is the first principalcomponent of each module’s methylation profile, andeach trait. The GL-trait relation (or gene significanceGS if thinking in terms of gene expression) wasdefined as (the absolute value of) the correlationbetween the GL methylation profile and the trait. Foreach module, we also calculated a quantitative measure
of module membership as (the absolute value of) thecorrelation of the ME and the GL methylation profile.This measure allows us to assess the similarity betweena module’s DNA methylation profile and DNA methy-lation at a genomic location.
Bisulfite pyrosequencing analysisGenomic DNA (0.5 μg), extracted from dissected brainsamples and blood (Supplementary Table 1 in Addi-tional file 1), was bisulfite converted using the EZ 96-DNA methylation kit (Zymo Research, Irvine, CA, USA)following the manufacturer’s standard protocol. Fullymethylated and unmethylated samples were includedthroughout the experimental procedure as assay con-trols. Pyrosequencing assays were designed using thePyromark Assay Design Software (Qiagen, Crawley, UK).Bisulfite-PCR amplification was performed in duplicateusing Hot Star Taq DNA polymerase (Qiagen, UK) andoptimized cycling conditions. Pyrosequencing was per-formed using the Pyromark Q24 (Qiagen, UK). A fulllist of bisulfite PCR and sequencing primers is given inSupplementary Table 17 in Additional file 1.
Gene expression analysisRNA was extracted from matched cerebellum andfrontal cortex samples from 42 LBBND donors usingthe Trizol extraction method and purified using anRNeasy Mini Kit with DNase I digestion (Qiagen, UK)according to the manufacturer’s instructions. RNA wastested for purity and degradation using an Agilent2100 Bioanalyzer and RNA 6000 Nano kit (AgilentTechnologies, Wokingham, UK). RNA was biotinylatedand amplified using the Illumina TotalPrep™ RNAAmplification kit (Life Technologies, Paisley, UK).Gene expression was assessed using IlluminaHumanHT-12 v4 microarrays (Illumina, San Diego,California, USA) according to the standard manufac-turer’s protocol. Following scanning, signal intensitiesfor each probe were extracted using Illumina Geno-meStudio and imported into R using the Lumi packagewithin Bioconductor. Probes relating to the top 50 cer-ebellum-cortex DMRs were tested for expression dif-ferences between cerebellum and cortex.
Genotyping arrays and CNV analysisFor the individuals assessed by MeDIP-seq, AffymetrixSNP 6.0 arrays (Affymetrix, High Wycombe, UK) wereused to genotype samples from two tissues according tothe manufacturers’ standard protocol. CNVs were iden-tified using the PennCNV program [53]. Briefly, thisimplements a hidden Markov model that integrates mul-tiple sources of information to infer CNV calls for indi-vidual genotyped samples. CNVs were stringently calledby comparing the duplicate arrays from each individual.
Davies et al. Genome Biology 2012, 13:R43http://genomebiology.com/2012/13/6/R43
Page 12 of 14

Data availabilityThe methylomic data generated in this project is avail-able for browsing as UCSC Genome Browser tracksfrom our laboratory website [15]. Raw data have alsobeen deposited into the Human Epigenome Atlas[16,17] and will be integrated into this resource as partof the next data release by NIH Epigenomics RoadmapInitiative.
Additional material
Additional file 1: Supplementary figures and tables. This file containsSupplementary Figures 1 to 10 and Supplementary Tables 1 to 17.
AbbreviationsBA: Brodmann area; bp: base pair; CDS: coding sequence; CGI: CpG island;CNV: copy number variation; CV: coefficient of variance; DMR: differentiallymethylated region; GL: genomic location; GS: gene significance; HCP: highCG content promoter; ICP: intermediate CG content promoter; IPA: ingenuitypathway analysis; LCP: low CG content promoter; ME: module eigengene;MeDIP-seq: methylated DNA immunoprecipitation combined with ultra-deepsequencing; o/e: observed/expected; PCR: polymerase chain reaction; SNP:single nucleotide polymorphism; TS-DMR: tissue-specific differentiallymethylated region; UTR: untranslated region.
AcknowledgementsThe authors would like to acknowledge Dr Stephen Newhouse for his helpwith the bioinformatics pipeline and Dr Andrew King for his help inneuropathology. This work was funded by NIH grant AG036039 to JM andby NIH grant U01DA025956 to AM. RD and AD are supported by the NIHRBiomedical Research Centre for Mental Health at the South London andMaudsley NHS Foundation Trust, Kings College London. RP is supported bya UK Medical Research Council (MRC) PhD studentship.
Author details1Institute of Psychiatry, King’s College London, De Crespigny Park, London,SE5 8AF, UK. 2Department of Twin Research and Genetic Epidemiology,King’s College London, Westminster Bridge Road, London, SE1 7EH, UK.3Department of Molecular and Human Genetics, Baylor College of Medicine,One Baylor Plaza, Houston, TX 77030, USA.
Authors’ contributionsJM and LS conceived the experiment and participated in analysis andbioinformatics. SL provided samples. CT dissected post-mortem brainsamples. MV, RP, and KL performed laboratory work. MD performed MeDIP-seq data analysis and bioinformatics. The NIH Roadmap Epigenomics DataAnalysis and Coordination Center (CC, RAH, AM) provided bioinformaticssupport. AD and RD ran the weighted gene co-methylation networkanalysis. JM and MD drafted the manuscript. All authors read and approvedthe final manuscript.
Competing interestsThe authors declare that they have no competing interests.
Received: 30 January 2012 Revised: 21 May 2012Accepted: 15 June 2012 Published: 15 June 2012
References1. Suzuki MM, Bird A: DNA methylation landscapes: provocative insights
from epigenomics. Nat Rev Genet 2008, 9:465-476.2. Ma DK, Marchetto MC, Guo JU, Ming GL, Gage FH, Song H: Epigenetic
choreographers of neurogenesis in the adult mammalian brain. NatNeurosci 2010, 13:1338-1344.
3. Guo JU, Ma DK, Mo H, Ball MP, Jang MH, Bonaguidi MA, Balazer JA,Eaves HL, Xie B, Ford E, Zhang K, Ming GL, Gao Y, Song H: Neuronal
activity modifies the DNA methylation landscape in the adult brain. NatNeurosci 2011, 14:1345-1351.
4. Lubin FD, Roth TL, Sweatt JD: Epigenetic regulation of BDNF genetranscription in the consolidation of fear memory. J Neurosci 2008,28:10576-10586.
5. Renthal W, Nestler EJ: Histone acetylation in drug addiction. Semin CellDev Biol 2009, 20:387-394.
6. Migliore L, Coppede F: Genetics, environmental factors and the emergingrole of epigenetics in neurodegenerative diseases. Mutat Res 2009,667:82-97.
7. Nakahata Y, Grimaldi B, Sahar S, Hirayama J, Sassone-Corsi P: Signaling tothe circadian clock: plasticity by chromatin remodeling. Curr Opin CellBiol 2007, 19:230-237.
8. Samaco RC, Neul JL: Complexities of Rett syndrome and MeCP2. JNeurosci 2011, 31:7951-7959.
9. Mill J, Tang T, Kaminsky Z, Khare T, Yazdanpanah S, Bouchard L, Jia P,Assadzadeh A, Flanagan J, Schumacher A, Wang SC, Petronis A:Epigenomic profiling reveals DNA-methylation changes associated withmajor psychosis. Am J Hum Genet 2008, 82:696-711.
10. Roth RB, Hevezi P, Lee J, Willhite D, Lechner SM, Foster AC, Zlotnik A: Geneexpression analyses reveal molecular relationships among 20 regions ofthe human CNS. Neurogenetics 2006, 7:67-80.
11. Khaitovich P, Muetzel B, She X, Lachmann M, Hellmann I, Dietzsch J,Steigele S, Do HH, Weiss G, Enard W, Heissig F, Arendt T, Nieselt-Struwe K,Eichler EE, Paabo S: Regional patterns of gene expression in human andchimpanzee brains. Genome Res 2004, 14:1462-1473.
12. Johnson MB, Kawasawa YI, Mason CE, Krsnik Z, Coppola G, Bogdanovic D,Geschwind DH, Mane SM, State MW, Sestan N: Functional andevolutionary insights into human brain development through globaltranscriptome analysis. Neuron 2009, 62:494-509.
13. Ladd-Acosta C, Pevsner J, Sabunciyan S, Yolken RH, Webster MJ, Dinkins T,Callinan PA, Fan JB, Potash JB, Feinberg AP: DNA methylation signatureswithin the human brain. Am J Hum Genet 2007, 81:1304-1315.
14. Chavez L, Jozefczuk J, Grimm C, Dietrich J, Timmermann B, Lehrach H,Herwig R, Adjaye J: Computational analysis of genome-wide DNAmethylation during the differentiation of human embryonic stem cellsalong the endodermal lineage. Genome Res 2010, 20:1441-1450.
15. KCL Psychiatric Epigenetics Data. [http://epigenetics.iop.kcl.ac.uk/brain].16. MeDIP-seq data page in Human Epigenome Atlas. [http://genboree.org/
REST/v1/shortUrl/83m7yY?format=redirect].17. Human Epigenome Atlas. [http://www.epigenomeatlas.org].18. Bernstein BE, Stamatoyannopoulos JA, Costello JF, Ren B, Milosavljevic A,
Meissner A, Kellis M, Marra MA, Beaudet AL, Ecker JR, Farnham PJ, Hirst M,Lander ES, Mikkelsen TS, Thomson JA: The NIH Roadmap EpigenomicsMapping Consortium. Nat Biotechnol 2010, 28:1045-1048.
19. Maunakea AK, Nagarajan RP, Bilenky M, Ballinger TJ, D’Souza C, Fouse SD,Johnson BE, Hong C, Nielsen C, Zhao Y, Turecki G, Delaney A, Varhol R,Thiessen N, Shchors K, Heine VM, Rowitch DH, Xing X, Fiore C,Schillebeeckx M, Jones SJ, Haussler D, Marra MA, Hirst M, Wang T,Costello JF: Conserved role of intragenic DNA methylation in regulatingalternative promoters. Nature 2010, 466:253-257.
20. Weber M, Hellmann I, Stadler MB, Ramos L, Paabo S, Rebhan M,Schubeler D: Distribution, silencing potential and evolutionary impact ofpromoter DNA methylation in the human genome. Nat Genet 2007,39:457-466.
21. Doi A, Park IH, Wen B, Murakami P, Aryee MJ, Irizarry R, Herb B, Ladd-Acosta C, Rho J, Loewer S, Miller J, Schlaeger T, Daley GQ, Feinberg AP:Differential methylation of tissue- and cancer-specific CpG island shoresdistinguishes human induced pluripotent stem cells, embryonic stemcells and fibroblasts. Nat Genet 2009, 41:1350-1353.
22. Sato K, Yabe I, Fukuda Y, Soma H, Nakahara Y, Tsuji S, Sasaki H: Mapping ofautosomal dominant cerebellar ataxia without the pathogenic PPP2R2Bmutation to the locus for spinocerebellar ataxia 12. Arch Neurol 2010,67:1257-1262.
23. Couve A, Restituito S, Brandon JM, Charles KJ, Bawagan H, Freeman KB,Pangalos MN, Calver AR, Moss SJ: Marlin-1, a novel RNA-bindingprotein associates with GABA receptors. J Biol Chem 2004,279:13934-13943.
24. Baala L, Briault S, Etchevers HC, Laumonnier F, Natiq A, Amiel J, Boddaert N,Picard C, Sbiti A, Asermouh A, Attie-Bitach T, Encha-Razavi F, Munnich A,Sefiani A, Lyonnet S: Homozygous silencing of T-box transcription factor
Davies et al. Genome Biology 2012, 13:R43http://genomebiology.com/2012/13/6/R43
Page 13 of 14

EOMES leads to microcephaly with polymicrogyria and corpus callosumagenesis. Nat Genet 2007, 39:454-456.
25. Werner H, Dimou L, Klugmann M, Pfeiffer S, Nave KA: Multiple spliceisoforms of proteolipid M6B in neurons and oligodendrocytes. Mol CellNeurosci 2001, 18:593-605.
26. Makoff A, Lelchuk R, Oxer M, Harrington K, Emson P: Molecularcharacterization and localization of human metabotropic glutamatereceptor type 4. Brain Res Mol Brain Res 1996, 37:239-248.
27. Ramakers GJ, Avci B, van Hulten P, van Ooyen A, van Pelt J, Pool CW,Lequin MB: The role of calcium signaling in early axonal and dendriticmorphogenesis of rat cerebral cortex neurons under non-stimulatedgrowth conditions. Brain Res Dev Brain Res 2001, 126:163-172.
28. Toba S, Tenno M, Konishi M, Mikami T, Itoh N, Kurosaka A: Brain-specificexpression of a novel human UDP-GalNAc:polypeptide N-acetylgalactosaminyltransferase (GalNAc-T9). Biochim Biophys Acta 2000,1493:264-268.
29. Gibney GT, Zhang JH, Douglas RM, Haddad GG, Xia Y: Na(+)/Ca(2+)exchanger expression in the developing rat cortex. Neuroscience 2002,112:65-73.
30. Zhong W, Jiang MM, Weinmaster G, Jan LY, Jan YN: Differential expressionof mammalian Numb, Numblike and Notch1 suggests distinct rolesduring mouse cortical neurogenesis. Development 1997, 124:1887-1897.
31. Hayes DM, Braud S, Hurtado DE, McCallum J, Standley S, Isaac JT,Roche KW: Trafficking and surface expression of the glutamate receptorsubunit, KA2. Biochem Biophys Res Commun 2003, 310:8-13.
32. Sun Y, Hu J, Zhou L, Pollard SM, Smith A: Interplay between FGF2 andBMP controls the self-renewal, dormancy and differentiation of ratneural stem cells. J Cell Sci 2011, 124:1867-1877.
33. Boulle F, van den Hove DL, Jakob SB, Rutten BP, Hamon M, van Os J,Lesch KP, Lanfumey L, Steinbusch HW, Kenis G: Epigenetic regulation ofthe BDNF gene: implications for psychiatric disorders. Mol Psychiatry2011, 17:584-596.
34. Kajiwara Y, Buxbaum JD, Grice DE: SLITRK1 binds 14-3-3 and regulatesneurite outgrowth in a phosphorylation-dependent manner. BiolPsychiatry 2009, 66:918-925.
35. Zhang B, Horvath S: A general framework for weighted gene co-expression network analysis. Stat Appl Genet Mol Biol 2005, 4:Article17.
36. GeneMANIA. [http://www.genemania.org/].37. Deaton AM, Webb S, Kerr AR, Illingworth RS, Guy J, Andrews R, Bird A: Cell
type-specific DNA methylation at intragenic CpG islands in the immunesystem. Genome Res 2011, 21:1074-1086.
38. Kim SY, Mo JW, Han S, Choi SY, Han SB, Moon BH, Rhyu IJ, Sun W, Kim H:The expression of non-clustered protocadherins in adult rathippocampal formation and the connecting brain regions. Neuroscience2010, 170:189-199.
39. Cosgaya JM, Chan JR, Shooter EM: The neurotrophin receptor p75NTR asa positive modulator of myelination. Science 2002, 298:1245-1248.
40. Bedogni F, Hodge RD, Nelson BR, Frederick EA, Shiba N, Daza RA,Hevner RF: Autism susceptibility candidate 2 (Auts2) encodes a nuclearprotein expressed in developing brain regions implicated in autismneuropathology. Gene Expr Patterns 2010, 10:9-15.
41. Herbert MR: SHANK3, the synapse, and autism. N Engl J Med 365:173-175.42. Whitford KL, Marillat V, Stein E, Goodman CS, Tessier-Lavigne M, Chedotal A,
Ghosh A: Regulation of cortical dendrite development by Slit-Robointeractions. Neuron 2002, 33:47-61.
43. Borgel J, Guibert S, Li Y, Chiba H, Schubeler D, Sasaki H, Forne T, Weber M:Targets and dynamics of promoter DNA methylation during early mousedevelopment. Nat Genet 42:1093-1100.
44. Petronis A: Epigenetics as a unifying principle in the aetiology ofcomplex traits and diseases. Nature 2010, 465:721-727.
45. Davies MN, Lawn S, Whatley S, Fernandes C, Williams RW, Schalkwyk LC: Towhat extent is blood a reasonable surrogate for brain in geneexpression studies: estimation from mouse hippocampus and spleen.Front Neurosci 2009, 3:54.
46. Rakyan VK, Down TA, Balding DJ, Beck S: Epigenome-wide associationstudies for common human diseases. Nat Rev Genet 2011, 12:529-541.
47. Schalkwyk LC, Meaburn EL, Smith R, Dempster EL, Jeffries AR, Davies MN,Plomin R, Mill J: Allelic skewing of DNA methylation is widespread acrossthe genome. Am J Hum Genet 2010, 86:196-212.
48. MAQ: Mapping and Assembly with Qualities. [http://maq.sourceforge.net/].
49. FastQC. [http://www.bioinformatics.babraham.ac.uk/projects/fastqc/].50. Horvath S, Dong J: Geometric interpretation of gene coexpression
network analysis. PLoS Comput Biol 2008, 4:e1000117.51. Horvath S, Zhang B, Carlson M, Lu KV, Zhu S, Felciano RM, Laurance MF,
Zhao W, Qi S, Chen Z, Lee Y, Scheck AC, Liau LM, Wu H, Geschwind DH,Febbo PG, Kornblum HI, Cloughesy TF, Nelson SF, Mischel PS: Analysis ofoncogenic signaling networks in glioblastoma identifies ASPM as amolecular target. Proc Natl Acad Sci USA 2006, 103:17402-17407.
52. Langfelder P, Horvath S: WGCNA: an R package for weighted correlationnetwork analysis. BMC Bioinformatics 2008, 9:559.
53. PennCNV. [http://www.openbioinformatics.org/penncnv/].
doi:10.1186/gb-2012-13-6-r43Cite this article as: Davies et al.: Functional annotation of the humanbrain methylome identifies tissue-specific epigenetic variation acrossbrain and blood. Genome Biology 2012 13:R43.
Submit your next manuscript to BioMed Centraland take full advantage of:
• Convenient online submission
• Thorough peer review
• No space constraints or color figure charges
• Immediate publication on acceptance
• Inclusion in PubMed, CAS, Scopus and Google Scholar
• Research which is freely available for redistribution
Submit your manuscript at www.biomedcentral.com/submit
Davies et al. Genome Biology 2012, 13:R43http://genomebiology.com/2012/13/6/R43
Page 14 of 14