full scale experiment and numerical analysis for the ... · full scale experiment and numerical...
TRANSCRIPT

FULL SCALE EXPERIMENT AND NUMERICAL ANALYSIS FOR THE PERFORMANCE OFHEAT EXCHANGER IN MOLTEN CARBONATE FUEL CELLS
Seon-Hwa Kim1, Byeong-Keun Choi1 and Young-Su An21Department of Energy and Mechanical Engineering, Gyeongsang National University, Korea
2Institute of Marine Industry, Gyeongsang National University, Gyeongsang National University, KoreaE-mail: [email protected]
IMETI 2015 J5038_SCI16-CSME-46, Accession 3932
ABSTRACTThis study presents a numerical simulation of heat transfer and flow characteristics of the heat exchanger inmolten carbonate fuel cell system. In this study, the actual size of the heat exchanger was simulated in orderto avoid errors that can occur from the scale-down test, also the simulation gas (air) was verified with theheat duty of 800,000 kcal/hr. It is analyzed by using a commercial heat exchanger calculation code basedupon the test condition. It is found that a reasonable agreement is obtained from comparison between thepredicted results and the measured data. Furthermore, the verified similarity was presented in this analysis.In particular, the simulation gas used for the shell side service for the heat exchanger is obtained throughthe combustion calculation, i.e. by using a flow rate of the fuel gas. In addition, the performance of theheat exchanger is predicted under various conditions in the fuel cell operation conditions by the numericalmodel.
Keywords: heat exchanger; molten carbonate fuel cells; simulation gas; full scale test.
EXPÉRIMENTATION EN GRANDEUR RÉELLE ET ANALYSE NUMÉRIQUE DE LAPERFORMANCE D’UN ÉCHANGEUR THERMIQUE DE PILES À COMBUSTIBLE À
CARBONATE FONDU MCFC
RÉSUMÉNous présentons une simulation numérique des caractéristiques d’échange thermique et des écoulementsdans un système de piles à combustible à carbonate fondu MCFC. Dans cette étude, les dimensions réellesde l’échangeur thermique ont été simulées afin d’éviter les erreurs issus de tests sur une réduction à pluspetite échelle, le gaz de simulation (air) a également été vérifié avec une charge de chaleur de 800,000kcal/hr. Ce dernier est analysé à l’aide du code de calcul commercial d’échangeur thermique basé sur lesconditions du test. On a constaté qu’un accord raisonnable est obtenu dans la comparaison entre les résultatsprédits et les données mesurées. La vérification de la similitude a aussi été présentée dans cette analyse.En particulier l’utilisation des gaz de simulation pour le nettoyage du côté de la coque de l’échangeur estcalculée dans le calcul de la combustion, lequel utilise un taux d’écoulement de gaz combustible. En outreles prédictions sont faites dans différentes conditions d’opération du combustible par modèle numérique.
Mots-clés : échangeur thermique; pile à combustion à carbonate fondu MCFC; gaz de simulation; test engrandeur réelle.
Transactions of the Canadian Society for Mechanical Engineering, Vol. 40, No. 5, 2016 799

NOMENCLATURE
D diameter (m)h heat transfer coefficient (W kg−1hr−1K−1)h∗ ratio of heat transfer coefficientP pressure (Pa)V volume (m3)R gas constant (J K−1 mol−1)T temperature (C)k thermal conductivity (W m−1 K−1)Nu Nusselt Number (hDk−1)Pr Prandtl Number (Cpµk−1)Re Reynolds Number (ρDvµ−1)Cp specific heat (J kg−1 K−1)v velocity(m·s−1)
Greek symbolsµ viscosity (cP)ρ density (kg m−3)
Subscriptsc coldh hoti inleto outlet
1. INTRODUCTION
Molten carbonate fuel cells (MCFCs) are high temperature fuel cells, which achieve a relatively high elec-trical efficiency and can operate with a number of fuels, ranging from hydrogen to CO-containing gases.Based on these factors, the high temperature operation of MCFCs appears to be a favorable electrochemicalpower device, but also poses the cell components with unfavorable durability factors [1]. The carbonatefuel cell system is composed of a variety of mechanical equipments. One of the equipments of the heatexchangers is an important component for efficiency and cost in the MCFC system. The fuel stream forthe MCFC power plant is a mixture of hydrocarbon fuel, such as natural gas or anaerobic digester gas, andsteam. In the pre-reformer, to a small extent, the hydrocarbon is reformed with steam to give hydrogen.Thus, steam is a vital component of the fuel feed. The methane reforming in the pre-reformer is limited to5–10% conversion, leaving the bulk of the methane for internal reforming which provides cooling internalto the fuel cell stack. Therefore, the primary requirements of the heat exchanger are uniform mixing of thesteam and hydrocarbon fuel and a very low inventory of water in the heat exchanger. If water inventorycollects in the heat exchanger, the steam/carbon ratio of the exiting humidified fuel may vary with time andbe different from the one desired [2]. According to some references, the MCFC technology describes thatthe heat recovery system recovers heat energy from the fuel cells of cathode side exhaust gases. Energyfrom the exhaust gases is utilized to
1. Preheat the natural gas.
2. Generate superheated steam from a feed water supply after mixing with the purified natural gas.
3. Superheat the fuel supply before entering the anode side of the fuel cell.
4. Preheat the fuel cell stacks during start-up operation.
800 Transactions of the Canadian Society for Mechanical Engineering, Vol. 40, No. 5, 2016

Fig. 1. Fuel cell operation and heat exchanger’s role.
Table 1. Configuration of the heat exchanger.Parameter Value Parameter ValueTube OD, mm 38.1 Longitudinal pitch, mm 176Tube thickness, mm 2 Transverse pitch, mm 70Fin material SS316 Tube rows 8Tube material SS310 Tube number 24Fin height, mm 12.3 Tube layout Staggered
The cathode exhaust gases leaving the heat exchanger system are vented to the atmosphere through theblower and exhaust stack [3]. The temperature of the cold side outlet is critical for the reaction. Also,it is necessary to install additional equipment or utility to meet the operation condition in the fuel cellsystem. It is an important feature in cost and design. This heat exchanger has problems of multiphasefluid and phase change heat transfer. So, it is necessary to analyze the heat transfer characteristics and topropose a reasonable design methodology for the heat exchanger. Table 1 shows the configuration of theheat exchanger, which is based on preliminary thermal calculation.
A variety of researches have been conducted on the operation and control of the carbonate fuel cells usingmathematical modeling by Sundmacher et al. [4], Lee et al. [5] and Kim et al. [6]. The performance ofserpentine condenser and evaporator is simulated by using the computer program by Mathur [7] in orderto estimate the performance for a refrigerant. Some earlier experimental studies on pressure drop and voidfraction of air–water two-phase flow in relatively small diameter circular tubes were conducted by Fukanoand Kariyasaki [8], Bao et al. [9] and Mishima and Hibiki [10]. In the heat transfer characteristics, mostof the experimental studies are concerned with the flow boiling phenomena. Many investigators presentedthe experimental data of the nucleate boiling heat transfer and the critical heat flux. These are summarizedby Ghiaasiaan and Abdel-Khalik [11] and Chen and Mewes [12]. However, few studies have compared thenumerical calculations and full-scale experimental performance of the serpentine heat exchanger with two-phase flow and staggered tube alignment. Therefore, the objective of this study is to estimate performanceand to employ a numerical modeling for the specific heat exchanger by using full-scale test facility andcommercial tools.
2. APPROACH
2.1. Test MethodologyA series of designs are analyzed for selecting a preliminary design for a new type of heat exchanger to beinstalled in a unit. In addition, there are uncertainties in the heat transfer coefficients and pressure loss fromthe analysis. The incremental cost of overdesign of the heat exchanger due to allowance for the most adverse
Transactions of the Canadian Society for Mechanical Engineering, Vol. 40, No. 5, 2016 801

Fig. 2. Proposed methodology for heat exchanger design procedure.
Table 2. Test and analysis.Test Analysis
Hot side Cold side Hot side Cold sideSimulation Flue gas Air and water Flue gas Air and waterReal operation – – Cathode out gas NG and water
possible accumulation of the uncertainties should be considered in the heat exchanger design step [13]. Theproposed method of a heat exchanger design is as shown in Fig. 2. After the simulation on each operationmode, the thermodynamic properties of the operation steps such as temperature, pressure and flow velocitiesand the heat transfer characteristics such as thermal conductivity, viscosity, specific heat and density can bepredicted. On the other side, the heat exchanger presented in this study is difficult to satisfy the specificationin the MCFC system. The most important thing is that the heat exchanger should be satisfied with coldside temperature according to each operation mode. Even the conditions of flow rate for NG and water aredifferent. The temperature affects the product yield, and ultimately affects the electric power production andoperation. It incurs huge loss for the test using natural gas. In fact, it is often possible to carry out a betterset of tests with a properly designed model than it is possible with the full-scale heat exchanger, and the testcan be carried out at a tiny fraction of the cost and more quickly. In this study, the thermal characteristicfor the heat recovery unit was estimated by using the commercial tool of heat exchanger design, rating andsimulation. In addition, this study presents the test results by test facility, the proper design methodologyfor the above problems at the design step, and the results of real operation testing, thermal, and hydraulicdesign.
2.2. Experiment and Numerical SimulationThis paper suggests a methodology to estimate the prediction for the heat exchanger in real operation con-ditions as follows: testing by using simulation gas; analysis based on the same condition with the testing;verification of the analysis by comparing both results; and prediction for the operation performance.
This paper presents a methodology to estimate the fluid flow and heat transfer characteristic more accu-rately. At first, the heat exchanger was designed using a commercial code with known geometry information,which is a type of program that is capable of thermal rating and includes a number of physics for fluid flowand heat transfer characteristics for general heat exchanger. In the previous studies, the thermal calculationwas performed by using ASPEN B-JAC for calculating the thermal rating of the heat exchanger. In order toestimate the flue gas composition, ASPEN PLUS was used. In addition, the advanced level of research wasinterested in comparison only with heat capacities for simulation gas [14].
On the other hand, this work was simulated using the HTRI of the evaporator module for more reliablecalculation for the serpentine type of the heat exchanger. ASPEN PLUS with Gibbs reactor module was usedto calculate the combustion gas components in this analysis. These can be submitted as proper parameters
802 Transactions of the Canadian Society for Mechanical Engineering, Vol. 40, No. 5, 2016
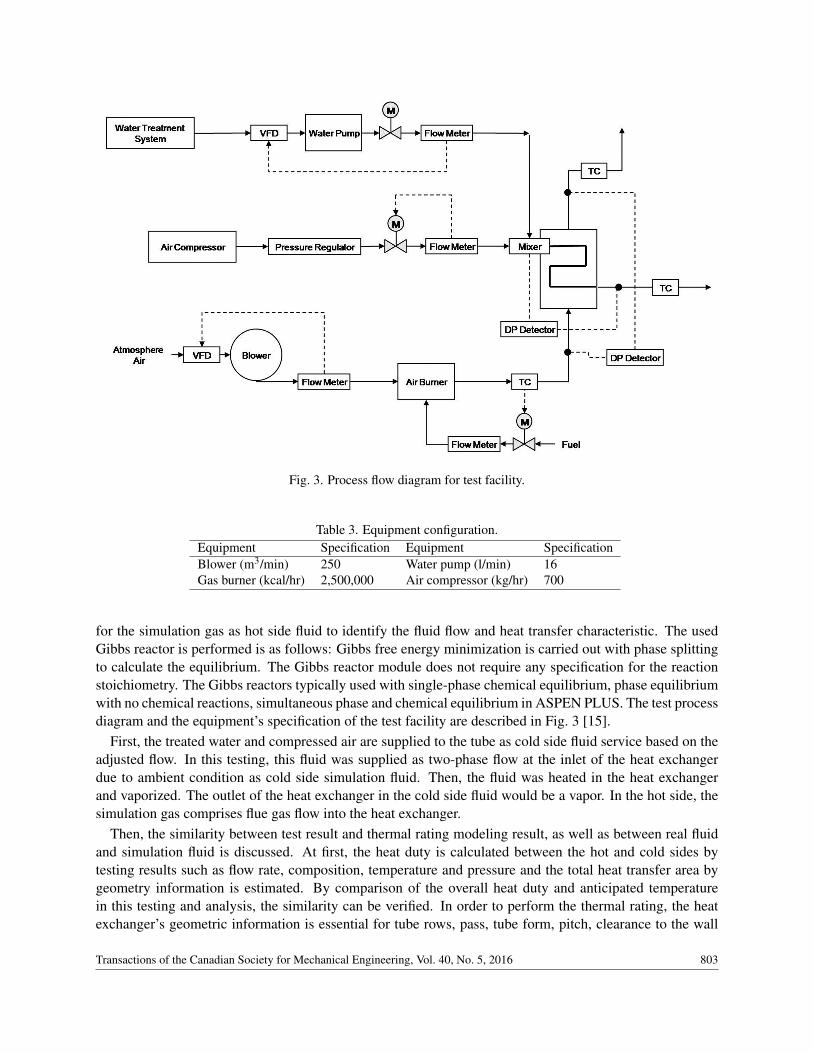
Fig. 3. Process flow diagram for test facility.
Table 3. Equipment configuration.Equipment Specification Equipment SpecificationBlower (m3/min) 250 Water pump (l/min) 16Gas burner (kcal/hr) 2,500,000 Air compressor (kg/hr) 700
for the simulation gas as hot side fluid to identify the fluid flow and heat transfer characteristic. The usedGibbs reactor is performed is as follows: Gibbs free energy minimization is carried out with phase splittingto calculate the equilibrium. The Gibbs reactor module does not require any specification for the reactionstoichiometry. The Gibbs reactors typically used with single-phase chemical equilibrium, phase equilibriumwith no chemical reactions, simultaneous phase and chemical equilibrium in ASPEN PLUS. The test processdiagram and the equipment’s specification of the test facility are described in Fig. 3 [15].
First, the treated water and compressed air are supplied to the tube as cold side fluid service based on theadjusted flow. In this testing, this fluid was supplied as two-phase flow at the inlet of the heat exchangerdue to ambient condition as cold side simulation fluid. Then, the fluid was heated in the heat exchangerand vaporized. The outlet of the heat exchanger in the cold side fluid would be a vapor. In the hot side, thesimulation gas comprises flue gas flow into the heat exchanger.
Then, the similarity between test result and thermal rating modeling result, as well as between real fluidand simulation fluid is discussed. At first, the heat duty is calculated between the hot and cold sides bytesting results such as flow rate, composition, temperature and pressure and the total heat transfer area bygeometry information is estimated. By comparison of the overall heat duty and anticipated temperaturein this testing and analysis, the similarity can be verified. In order to perform the thermal rating, the heatexchanger’s geometric information is essential for tube rows, pass, tube form, pitch, clearance to the wall
Transactions of the Canadian Society for Mechanical Engineering, Vol. 40, No. 5, 2016 803

Fig. 4. Test facility and serpentine finned tube.
Table 4. Parameters for the thermal state equation.σ ε Ω Ψ Zc
1+21/2 1−21/2 0.07780 0.45724 0.30740
and fin geometric information and material. By thermal rating, the temperature distribution can be calculatedfor the hot and colds side for this heat exchanger.
The stream properties were calculated by the gas state equation of Peng–Robinson with the followingequations:
V = RT P−1 +b−a(T )P−1(V −P)(V + εb)(V +σb)−1 (1)
a(T ) = ψα(Tr)R2T 2c P−1
c , b = ΩRT 2c P−1
c (2)
α(Tr) = [1+(0.37464+1.5422ω −0.26992ω2)(1−T 0.5
r )]2 (3)
ω ≡−1.0− log(Psatr ), Tr ≡
TTc
(4)
In the above equations Ω and Ψ are pure numbers, independent of substance and determined for a par-ticular equation of state from the value assigned to ε and σ [16]. Then, it was found from the result thatthe simulation fluid properties of fluid flow and heat transfer differ with temperature. In comparison withflow regime and vapor fraction, validity can be considered for them. The heat transfer coefficient can beobtained from Reynolds number and Prandtl number. Thus, the dimensionless quantity can be calculated bythermal conductivity, viscosity, specific heat and density base on gas analysis for the real stream and sidesimulation gas at the hot and cold sides. Therefore, the investigation conducted by the calculation revealedthat the values are different from each other and the quantity was estimated [17]. Here, several variables canbe eliminated such as diameter, velocities and surface tension due to the use of the identical geometry andflow rate.
Nu = hDk−1 = αReβ Prγ (5)
h∗ = ρβ
µ−β (Cpµ)γk(1−γ) (6)
804 Transactions of the Canadian Society for Mechanical Engineering, Vol. 40, No. 5, 2016

Table 5. Parameters for experimental equation.Condition β γ
External, 1000 < Re < 20,000, 0.7 < Pr < 500 0.6 0.36Internal, 10,000 < Re, 0.7 < Pr < 160 0.8 0.4
Table 6. Composition for hot and cold side fluid.Component Hot side Cold side(Mole fraction %) Simulation Real operation Simulation Real operationN2 76.5 68.1 – 0.2O2 16.3 9.2 – –CO2 2.2 4.6 – 0.2H2O 4.1 18.2 66.4 66.4CH4 – – – 31.5C2H6 – – – 0.6C3H8 – – – 0.5C4H10 – – – 0.1Air – – 33.6 –
Table 7. Flow rate estimation for hot side fluid.Case 1 Case 2 Case 3
Fuel gas (m3/hr) 197 385 644Flue gas from test (m3/hr) 28,134 29,672 51,828Flue gas from analysis (m3/hr) 28,324 29,784 52,113Deviation 0.7% 0.4% 0.6%
3. RESULTS AND DISCUSSION
3.1. Test and Analysis by Simulation FluidIn this experiment, predicted results were analyzed to avoid an error by the flow rate due to the large diam-eter. In other words, the airflow rate is estimated from the flow supplied into the air heater, the heat value ofthe fuel and measured temperature at the hot side inlet point. In the test state, the cold inlet stream is mixedfluid in air and water; in the design state, it is mixed fluid with NG and water. The temperature of the mixedfluid is decreased due to the latent heat when the water is boiling. Therefore, it is necessary to estimate thetemperature for the mixed two-phase fluid as input parameters in HTRI. In this study, the temperature iscalculated based on specific enthalpy. In the hot side test, because the inlet fluid is a flue gas from combus-tion reaction, the composition for the flue gas should be calculated using the combustion calculation in theASPEN PLUS.
The heat recovery system, with its start-up burner, provides make-up for additional heat energy to the heatexchangers wherever the temperature of the cathode exhaust gases is below a predetermined point. The heatrecovery system incorporates the reformer for the fuel-gas supply system between the start-up burner andthe fuel super heater [18]. Both case 1 and case 2 are the transient operation modes with different operationconditions for the flow rate, inlet temperature and liquid-gas fraction against the normal operation condition.The hot testing was performed based on the real operation condition. The test conditions for case 1 and case2 are the transient operation modes with start-up of the fuel cell system. Therefore, the ratio of water to airis different according to each case. The reason is that the steam to carbon ratio should be different for eachoperation mode.
Transactions of the Canadian Society for Mechanical Engineering, Vol. 40, No. 5, 2016 805

Table 8. Testing result for each case in system operation basis.Case 1 Case 2 Case 3
Air fraction for cold inlet 16% 16% 34%Water fraction for cold inlet 84% 84% 66%Cold inlet flow rate (kg/hr) 109.3 248.0 1726.2Cold inlet temperature (C) 13 14 12Cold outlet temperature (C) 269 560 468Hot inlet temperature (C) 331 580 559Hot outlet temperature (C) 300 500 326
Table 9. Flow regime for each tube pass.Tube pass Real Simulation Tube pass Real Simulation1 Wavy stratified Wavy stratified 5 Film Film2 Wavy stratified Wavy stratified 6 Mist Mist3 Film Film 7 Sensible Sensible4 Film Film 8 Sensible Sensible
Table 10. Stream property comparison for the cold side fluid.Temperature Density, ρ Viscosity, µ Conductivity, k Heat Capacity, Cp(C) Real Simulation Real Simulation Real Simulation Real Simulation98.4 0.84 0.87 0.012 0.015 0.032 0.026 2.05 1.50345.9 0.50 0.52 0.029 0.025 0.061 0.047 2.39 1.59593.3 0.36 0.37 0.021 0.035 0.097 0.073 2.77 1.70
Table 11. Stream property comparison for the hot side fluid.Temperature Density, ρ Viscosity, µ Conductivity, k Heat Capacity, Cp(C) Real Simulation Real Simulation Real Simulation Real Simulation593.3 0.41 0.41 0.038 0.039 0.065 0.062 1.26 1.14500.9 0.46 0.46 0.035 0.035 0.058 0.056 1.23 1.12406.3 0.53 0.53 0.031 0.032 0.051 0.05 1.20 1.09298.7 0.63 0.63 0.027 0.028 0.043 0.043 1.17 1.07
It can be observed that both flow patterns for case 2 conditions are similar to each other. The regimeshows a stratified wavy tendency until the second pass, and then boiling film was predicted from the third tofifth pass. Thereafter, almost 100% of vapor fraction was found. In addition, the vapor fraction of the innertube for simulation fluid is similar to the real fuel as shown in Table 9.
As shown in Tables 10 and 11, this research is investigated for the fluid properties for the simulation gasand real gas based on the increasing bulk temperature referring to data book and state equation. In orderto compare the heat transfer characteristics in view of the average temperature, the physics is on the vaporphase state. In the cold side case, it is similar to density and viscosity but a low similarity can be found forthe conductivity and the heat capacity.
On the other hand, the properties of the fluid have high similarity in the hot side case. This means thatthe flue gas from the combustor is substitutable as the cathode out gas in the fuel cell for this testing. Withrespect to the inside and the outside of the flow, owing to the ratio of the empirical relationship of convectionand conduction, the Nusselt number of correlations, overall heat transfer coefficients are calculated as inEqs. (7) and (8). The reference temperature is calculated for the arithmetic average for both inlet temperature
806 Transactions of the Canadian Society for Mechanical Engineering, Vol. 40, No. 5, 2016

Table 12. Comparison heat transfer characteristic.Service Temperature x y k∗ h∗
Cold 167 1.10 1.00 0.74 82%Hot 455 1.03 1.01 0.97 101%
Table 13. Heat transfer and flow regime for each tube pass.Case 1 Case 2
Tube Heat flux Film coeff. Flow regime Heat flux Film coeff. Flow regimepass (W/m2) (W/m2/C) (W/m2) (W/m2/C)1 1726.5 619.0 Wavy stratified 2024.4 362.9 Wavy stratified2 172.2 12.3 Film 445.4 17.2 Sensible3 87.5 14.0 Sensible 441.3 16.9 Sensible4 43.4 15.0 Sensible 438.8 16.7 Sensible5 21.0 15.4 Sensible 437.4 16.5 Sensible6 10.1 15.7 Sensible 438.3 18.7 Sensible7 4.8 15.8 Sensible 379.2 21.8 Sensible8 2.3 15.8 Sensible 304.3 25.6 Sensible
Table 14. Flow regime for each tube pass.Tube pass Case 1 Case 2 Tube pass Case 1 Case 2
(C) Skin Bulk Skin Bulk (C) Skin Bulk Skin Bulk1 255.5 86.1 481.3 78.4 5 326.6 310.4 548.2 99.12 322.1 175.2 536.9 95.9 6 326.9 319.2 552.0 149.43 324.6 253.8 540.7 97.4 7 327.1 323.4 557.0 264.24 325.9 292.0 544.5 98.4 8 327.2 325.4 562.0 356.3
and outlet temperature [17]:
Tm = 0.5(T0 +Ti) (7)
x =Reβ
r
Reβx, y =
Prγr
Prγs
(8)
3.2. Performance Prediction by Numerical ModelingIn this analysis result, both boiling patterns are found for the transient operation condition. This studyfocuses on two types of operation conditions for the start-up state to reason out why the operation pointwould be a standard point. Until the first pass, the regime shows a stratified wavy tendency, and then a filmboiling was predicted on the second pass. After that, almost 100% of vapor fraction was observed in case 1.In addition, the sensible gas can be seen in the first pass in case 2. Heat flux and cold side of film coefficientrelate to the flow regime. The value is increased by stratified flow occurrences. In order to realize heattransfer characteristics, the inside of tube is considered to be more stable by the index.
In addition, Table 14 indicates surface thermal of the tube and fluid thermal of the cold side. In thispaper, surface thermal of tube is different by flow characteristic with two-phase flow and operation mode.Therefore, an important parameter such as modulus can predict stress on tube. Especially, the predictedthermal expansion of the serpentine tube by the operation mode suggests a baffled position, tube thicknessto structure design and also metallurgical measure to prevent sensitization phenomena for stainless steel.
Transactions of the Canadian Society for Mechanical Engineering, Vol. 40, No. 5, 2016 807

Fig. 5. Vapour fraction for cold side for operation condition.
4. CONCLUSIONS
This study presents the numerical simulation for heat transfer and flow characteristics of the heat exchangerusing a molten carbonate fuel cell system which also shows that it is necessary to establish a methodologyof test and analysis to design fuel cell’s heat exchangers. The accomplishment of this study is that the full-scale test can be conducted so that some errors by the scale-down test can be avoided. In the testing by usingsimulation gas, a configuration for the test facilities on full-scale unit for the heat exchanger on the realoperation condition is possible. In the analysis based on the same conditions as for the testing, the similaritywas estimated by reviewing the heat duty and estimated temperature against the test results. Furthermore, the
808 Transactions of the Canadian Society for Mechanical Engineering, Vol. 40, No. 5, 2016

Table 15. Prediction the heat transfer characteristic.Parameter Case 1 Case 2 Case 3Heat duty, Q (kW) 76 202 936Cold side outlet temperature, T (C) 324.9 542.5 348.9Hot side outlet temperature, T (C) 312.6 526.3 393.1Cold side pressure drop (kPa) 0.064 0.279 5.352Hot side pressure drop (kPa) 0.271 0.298 0.365Overall heat transfer coefficient, U (W/m2/C) 1.946 2.266 8.431
verification for the analysis by comparison with both real condition and simulation confirms the possibilityfor this testing methodology. Finally, considering the predictions for the operation performance for eachmode, this research provides more information for the heat exchanger design under a variety of conditions.Furthermore, it suggests a methodology for the analysis of other heat exchangers in a variety of industryfields. That is, a verified empirical formula for each of the heat transfer coefficients can be compared withthese based on the condition of the heat exchanger design. The basis of that value is that the operationstatus of the hard environment ensures that the experiment can be presented with the methodology that ispredictable.
REFERENCES
1. Morita, H. et al., “Degradation mechanism of molten carbonate fuel cell based on long-term performance: Long-term operation by using bench-scale cell and post-test analysis of the cell”, Journal of Power Sources, Vol. 195,No. 20, pp. 6988–6996, 2010.
2. Maru, H.C. and Farooque, M., “Molten carbonate fuel cell product design improvement”, No. DE-FC21-95MC31184, U.S Department of Energy National Energy Technology Laboratory, Pittsburgh, PA, USA,2005.
3. Kordesch, K. and Simader, G., Fuel Cells and Their Applications, VCH, 1996.4. Sundmacher, K. et al. (Eds.), Molten Carbonate Fuel Cells: Modeling, Analysis, Simulation, and Control, John
Wiley & Sons, 2007.5. Lee, S.-Y. et al., “Mathematical modeling of a molten carbonate fuel cell (MCFC) stack”, International Journal
of Hydrogen Energy, Vol. 35, No. 23, pp. 13096–13103, 2010.6. Kim, B. et al., “The operation results of a 125 kW molten carbonate fuel cell system”, Renewable Energy, Vol.
42, pp. 145–151, 2012.7. Mathur, G.D., “Performance of serpentine heat exchangers”, SAE Technical Paper No. 980057, 1998.8. Fukano, T. and Kariyasaki, A., “Characteristics of gas-liquid two-phase flow in a capillary tube”, Nuclear Engi-
neering and Design, Vol. 141, No. 1, pp. 59–68, 1993.9. Bao, Z.Y., Bosnich, M.G. and Haynes, B.S., “Estimation of void fraction and pressure-drop for 2-phase flow in
fine passages”, Chemical Engineering Research & Design, Vol. 72, No. 5, pp. 625–632, 1994.10. Mishima, K. and Hibiki, T., “Some characteristics of air-water two-phase flow in small diameter vertical tubes”,
International Journal of Multiphase Flow, Vol. 22, No. 4, pp. 703–712, 1996.11. Ghiaasiaan, S.M. and Abdel-Khalik, S.I., “Two-phase flow in microchannels”, Advances in Heat Transfer, Vol.
34, pp. 145–255, 2001.12. Cheng, L. and Mewes, D., “Review of two-phase flow and flow boiling of mixtures in small and mini channels”,
International Journal of Multiphase Flow, Vol. 32, No. 2, pp. 183–207, 2006.13. Fraas, A.P., Heat Exchanger Design, John Wiley & Sons, 1989.14. Kim, S.H. et al., “Study of heat transfer characteristics for the fuel cell system of the humidifier due to analysis
and the hot testing”, in Proceedings ASME-JSME-KSME 2011 Joint Fluids Engineering Conference, Vol. 1, pp.641–647, 2011.
15. Aspen Plus User Guide. Aspen Technology Limited, Cambridge, MA, USA, 2003.
Transactions of the Canadian Society for Mechanical Engineering, Vol. 40, No. 5, 2016 809

16. Abbott, M.M., Smith, J.M. and Van Ness, H.C., Introduction to Chemical Engineering Thermodynamics,McGraw-Hill, 2001.
17. Çengel, Y.A. and Ghajar, A.J., Heat and Mass Transfer: Fundamentals & Applications, McGraw-Hill, 2011.18. Larminie, J., Dicks, A. and McDonald, M.S., Fuel Cell Systems Explained, Wiley, 2003.
810 Transactions of the Canadian Society for Mechanical Engineering, Vol. 40, No. 5, 2016