full-scale atmospheric tests of sequential combustionguethe/pub/pap/gt2010-22891_sev_atm_cia… ·...
TRANSCRIPT

FULL-SCALE ATMOSPHERIC TESTS OF SEQUENTIAL COMBUSTION
A.Ciani, A.Eroglu, F.Güthe, B.Paikert
Alstom Power Baden, Switzerland
ABSTRACT
Sequential combustion system of GT24 and GT26 engines from Alstom consists of a primary combustor, followed by a turbine and a re-heat combustor. This technology is capable of achieving the most rigorous emission targets at base-load operation, with an additional benefit of delivering very low NOx and CO emissions down to extremely low part load.
This paper describes further development of the re-heat technology with the help of multiple tools, with special consideration given to atmospheric tests. Prior to more demanding high-pressure combustion tests, full-scale atmospheric tests are utilized in order to down-select the most promising variants in a relatively cost-effective setup. Atmospheric tests are used additionally to gain insight into fundamental physics of reheat combustion, thanks to optical access and applicability of complicated measurement methods. A number of parameters, including NOx, CO, UHC emissions, temperature distribution, flashback margin, pressure drop and - to some extend - combustion dynamics can be assessed with the help of atmospheric tests. In order to increase the applicability of atmospheric test results to high-pressure conditions, the ignition and reaction characteristics of high-pressure flames must be reproduced at atmospheric conditions. This can be done through adjustment of operational parameters such as incoming temperature, as well as using fuel blends with modified ignition properties.
The scaling methods as well as recent analyses on improvement areas for this unique combustion technology are discussed.
1. INTRODUCTION Sequential combustion has been successfully used in the Alstom reheat gas turbines for over half a century, providing increased performance in a compact arrangement. The first applications of reheat concept in 1940’s were based on diffusion-type combustors. In 1995, a novel reheat combustor has been introduced in Alstom
GT24 engines (Joos et al [1]) This new premixing type combustor enabled achieving conflicting targets such as increased firing temperature for higher power and efficiency, as well as the lowest NOx emissions and increased lifetime simultaneously. A cross section of the GT24/GT26 gas turbines is represented in Figure 1. In this configuration, air is compressed to approximately 30 bars in 22 compressor stages. Afterwards, compressed air enters first a high-pressure annular combustor, which is equipped with EV burners. Part of the fuel is injected within the EV burners into the swirling air and thoroughly mixed before entering the EV combustor. The premix flame is stabilized at the exit of each EV burner by a recirculation zone due to vortex breakdown. The reaction products from the EV combustor are expanded in a single stage high-pressure turbine and subsequently enter the SEV combustor. The fuel is injected into hot gases in the SEV burner and mixed very well prior to entering SEV combustor, which is operating at auto-igniting conditions not requiring an external igniter. After complete combustion, reaction products are expanded in a four-stage low-pressure turbine. The SEV combustor is fuelled already at low loads (10-25%) operating both combustors in the lean regime. The fuel amount between both combustors is approximately equal at full load.
SEV Fuel Lance
Annular SEV Combustor
Annular EV Combustor
EV Burners
LP TurbineHP Turbine
Compressor
EV = EnVironmental
SEV = Sequential EnVironmental
Figure 1: GT24/GT26 cross section.
Details of operation principle for the SEV combustor are shown in Figure 2. Hot gases exiting the high-pressure
Proceedings of ASME Turbo Expo 2010: Power for Land, Sea and Air GT2010
June 14-18, 2010, Glasgow, UK
GT2010-22891
1 Copyright © 2010 by Alstom Technology, Ltd.

turbine flow first through an outlet guide vane (not shown) to remove any remaining swirl. At the downstream end of these outlet guide vanes, four vortex generators with delta wing shaped tetrahedral geometry are installed. Each of these vortex generators converts incoming flow into a pair of streamwise vortices. The combinations of four vortex pairs resemble a cloverleaf pattern as described by Eroglu et al [2]. A fuel lance is placed in the center of this unique vortex pattern to inject both gaseous and liquid fuel centrally. The fuel is carried away from the lance and a rapid yet uniform mixing is achieved within a pre-defined mixing zone. At the end of mixing zone, the mixture between fuel and hot gases is expanded through a backwards-facing step into SEV combustor. The air used for cooling of the lance fulfils additionally a carrier air function, ensuring proper fuel penetration into the hot gases. This air is injected from a small annular slit around the fuel nozzle, which also avoids a premature ignition of the fuel, thanks to the shielding effect between the fuel and the hot gas. As a result of this sudden expansion, recirculation zones are established on both inner and outer sides of SEV combustor. An intensive mixing takes place along the shear layer between these recirculation zones and the mixture exiting the SEV burner. This mixing with reaction products in SEV increases the temperature of the fresh mixture and causes the mixture to ignite spontaneously. The flow pattern in the SEV burner ensures reliable flame stabilization in a predefined location under a wide range of operation conditions.
Vortex Generators
Fuel Injector
Mixing Zone
Reaction Zone
Self Ignition
Recirculation Zone
Carrier AirFuel (Gas)Fuel (Liq.)
Vortex Generators
Fuel Injector
Mixing Zone
Reaction Zone
Self Ignition
Recirculation Zone
Carrier AirFuel (Gas)Fuel (Liq.)
Figure 2: Operation principle of Sequential EnVironmental (SEV) combustor.
The SEV combustor is being continuously upgraded since its introduction in early 1990’s. To our knowledge not many comparable combustion systems are in commercial operation with potential exception of afterburners [3]. The main technology targets to be achieved are:
• Low NOx emissions • Low CO and UHC emissions, • Low pressure drop • Flashback resistance
• Long lifetime • Fuel flexibility • Low cooling air and carrier air consumption
The technology development of such engines is based on a series of different tools, focusing on the understanding of design parameters linked to the development targets mentioned above.
2. TECHNOLOGY DEVELOPMENT PROCESS FOR REHEAT COMBUSTORS The first step undertaken in the evaluation of the reheat combustor concepts is composed of many types of experiments and calculations, with the aim of giving a physical understanding of the fluid dynamic, chemistry and the coupling between the two. The first-step tools are much cheaper and faster compared with the following steps.
Only the second step includes full-size burner combustion tests. This paper focuses on the full size single combustor tests done at atmospheric pressure, which constitutes the main combustion research done before embarking to the very expensive investigation done at high pressure (step 3). Steps 4 (Birr engine tests) and 5 (field experience) are already part of the validation phase.
Field Tests/Experience
SprayTests
AcousticsSimulations
ChemicalKinetics
CFD
High DensityModel
Wind Tunnel
Atm. Comb.Tests
Lab. ScaleHP Comb.
Tests
Single BurnerHP Comb.
Tests(DLR)
BirrTest Engine
Field Tests/Experience
Design
Feedback
WaterModel
ConceptField Tests/ExperienceField Tests/ExperienceField Tests/Experience
Step 1 Step 2 Step 3 Step 4 Step 5
Figure 3: Technology development for the Alstom sequential combustion engines.
One of the main challenges associated with atmospheric pressure testing is the transferability of the results for predicting the combustion behaviour at high pressure (engine) conditions. The first part of this paper focuses on the chemical kinetics of combustion at atmospheric and high pressure conditions, also explaining the main strategy to do high pressure prediction from an atmospheric rig for an autoignition based combustion system.
2 Copyright © 2010 by Alstom Technology, Ltd.
The following paragraphs present the combustion performances, focusing on the flame structure investigation as a function of the SEV burner boundary conditions and, consequently the resulting emissions, material temperatures, pressure drop, thermo acoustics and cooling air consumption. Some values recorded in the atmospheric rig can not match in absolute terms those recorded at high pressure conditions (e.g. limiting inlet temperature before burner overheating, NOx, etc). However, various tests conducted with the same hardware variants both at atmospheric and high pressure conditions, showed good correlation which makes a prediction from atmospheric to high pressure condition possible through calibration and in particular they allow a successful ranking to define the most promising hardware to be further developed.
3. ATMOSPHERIC COMBUSTION TESTS AS KEY DEVELOPMENT STEP FOR ENGINE PERFORMANCE The atmospheric combustion rig has been playing a key role as a development step of reheat combustors with full-scale geometry testing in reacting flows at reasonably low costs. It is well known that the pressure affects the auto ignition process, which is dominating flame stabilization mechanism, thus varying the reactivity quite significantly. However, this can be compensated by careful matching of the conditions to establish a comparative flame position. To do this a thorough understanding of the ignition process and modeling by mainly reaction kinetics or CFD is required. Efforts to update chemical mechanisms beyond the GRI30 [4], which has become a standard reference in natural gas combustion, are therefore essential for successfully transferring test results to engine conditions and operating the engines [5]. Only the use of advanced and most recent chemical models in connection with experimental verification through flame imaging and other measures makes this transfer possible.
Temperature Profile for a Combustion Process
time
Tem
pera
ture
ΔT
½ΔT
τign
84.1%ΔT
15.9%ΔT
tHR
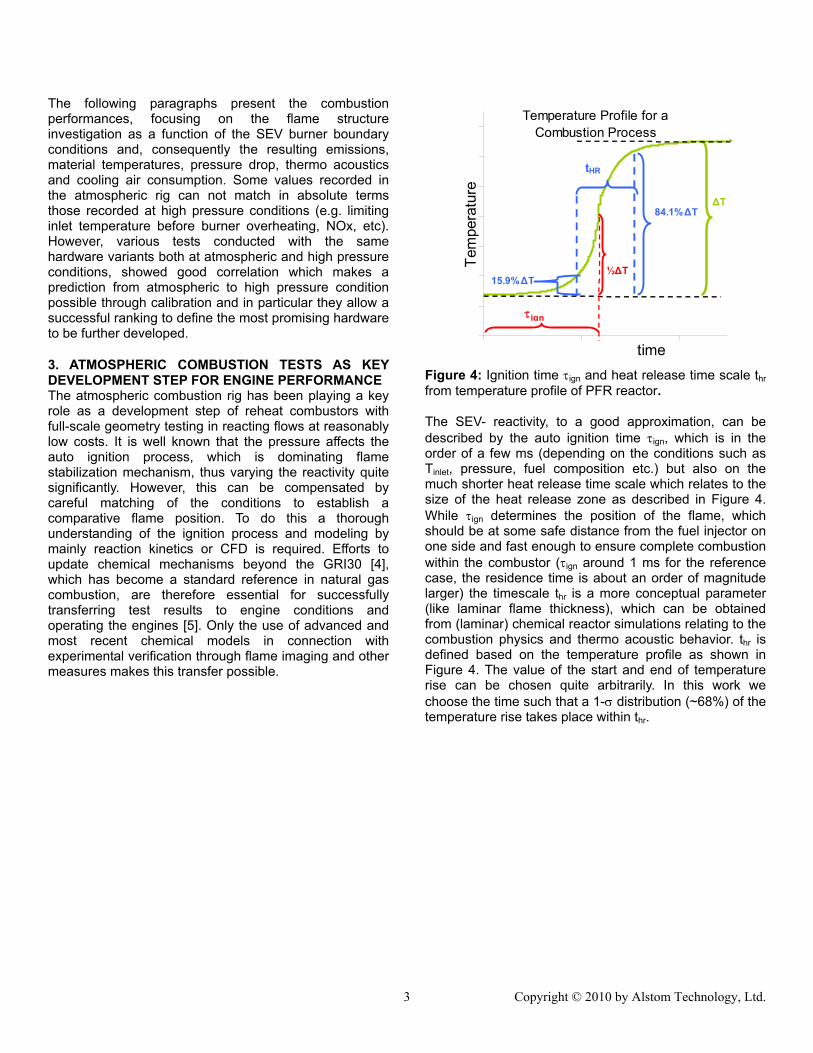
Figure 4: Ignition time τign and heat release time scale thr from temperature profile of PFR reactor. The SEV- reactivity, to a good approximation, can be described by the auto ignition time τign, which is in the order of a few ms (depending on the conditions such as Tinlet, pressure, fuel composition etc.) but also on the much shorter heat release time scale which relates to the size of the heat release zone as described in Figure 4. While τign determines the position of the flame, which should be at some safe distance from the fuel injector on one side and fast enough to ensure complete combustion within the combustor (τign around 1 ms for the reference case, the residence time is about an order of magnitude larger) the timescale thr is a more conceptual parameter (like laminar flame thickness), which can be obtained from (laminar) chemical reactor simulations relating to the combustion physics and thermo acoustic behavior. thr is defined based on the temperature profile as shown in Figure 4. The value of the start and end of temperature rise can be chosen quite arbitrarily. In this work we choose the time such that a 1-σ distribution (~68%) of the temperature rise takes place within thr.
3 Copyright © 2010 by Alstom Technology, Ltd.

Normalized tign and tHR vs. PressureT_ref, Fuel = NG
10%
100%
1 10Pressure (bar)
rela
tive:
t/t re
f [%
]
τign= b*p-a
thr= b*p-a
Figure 5: τign and thr for varying pressure double logarithmic plot.
The reactivity parameters can be determined by Chemkin simulations (for qualitative comparisons in the report GRI30 is used) or expressed as analytical fit of the form of (1) as a function of pressure p, O2 content of the combustion air, fuel composition (like C2+ content) and combustor inlet temperature Tinlet similar to the formula from Spadaccini and Colket [6].
inlet
a
TE
cbaig eCOpA ⋅⋅⋅⋅= +22τ (1)
For a given operating point the influencing parameters can be altered accordingly to maintain constant ignition time following equation (2)
inletinlet
aig T
TE
CC
cOObp
pa
Δ⋅−
+Δ⋅+Δ⋅+Δ⋅=≡ ++
222
22
0δτ (2)
The difference in τign due to the difference in pressure running a rig atmospherically vs. at GT conditions can be converted into a difference in inlet temperature Tinlet. According to equation (3) resulting in ca. >50 K for constant fuel and O2 content.
⋅⋅⋅Δ
⋅=Δa
inletinlet E
TppaT
2
(3)
for and 02 =Δ +C 02 =ΔOThe relative change of τign and thr with pressure is shown in Figure 5. Note the difference in slope for the different properties. From this graph it is obvious that a change in one of the properties can be compensated but not in both properties using the same parameter change. A second parameter to influence the flame position in the test rig is the fuel composition (Figure 6).
Normalized τign and tHR vs. Fuel Composition (C2+) p = 1bar; Fuel = NG-C2+
0%
10%
20%
30%
40%50%
60%
70%
80%
90%
100%
0% 10% 20% 30% 40% 50% 60% 70%
C2+ Fuel Fraction vol.rela
tive:
t/t re
f [%
] __ ign C2+τt_hr C2+
Figure 6: τign and thr for varying fuel in double logarithmic plot.
To obtain a similar flame as in the engine a combination of Tinlet and fuel composition and O2-content has to be chosen in the atmospheric rig. The O2 content at the rig will be slightly higher since the SEV inlet temperature is adjusted by adding dilution air instead of a high-pressure turbine as in the engine giving slightly more reactive conditions as is advantageous to compensate the reactivity decrease at atmospheric pressure and both parameters cannot be changed independently. With this combination of a more reactive fuel and the slightly higher O2 content at the inlet τign can be matched by increasing the inlet temperature only by 30-50K which is relatively moderate change to the temperature and density field. However it is not possible to match both parameters τign and thr at the same time since the pressure influence (mainly due to the increase the molecular collision frequency) on thr cannot totally be compensated by varying fuel and Tinlet (affecting the reaction rates). This situation is sketched in Figure 7 where the τign is matched by a change in Tinlet and fuel to the GT conditions but the thr is still more than 2 times higher. For that reasons the atmospheric test rig is believed to yield transferable results for flame position and emission studies but properties relating to the laminar flame thickness like thermo acoustic studies have to be conducted with special care. However the cost advantage and the easy optical access to the rig compensates for some of that shortcoming.
4 Copyright © 2010 by Alstom Technology, Ltd.
Reactivities on different test rigs Atmospheric Test Rig (TR)Tinlet1,1bar, NGτign,TR ~ 500%
tHR,TR ~ 300%
τign
tHR
High Pressure Gas Turbine (GT)Tinlet, p_SEV, NGτign,GT = 100%
tHR,GT = 100%
Atmospheric Test Rig (TR)Tinlet1+ 30K, 1bar, C2+=30% 1030ºC, τign,TR ~ 100%
tHR,TR ~ 250%
Reactivities on different test rigs Atmospheric Test Rig (TR)Tinlet1,1bar, NGτign,TR ~ 500%
tHR,TR ~ 300%
τign
tHR
High Pressure Gas Turbine (GT)Tinlet, p_SEV, NGτign,GT = 100%
tHR,GT = 100%
Atmospheric Test Rig (TR)Tinlet1+ 30K, 1bar, C2+=30% 1030ºC, τign,TR ~ 100%
tHR,TR ~ 250%
Figure 7: Schematic 2 D plot of reactivities (τign and thr) on different test conditions.
Experimental verification of the reactivity dependence can be obtained from flame images or thermocouple measurements as shown in Figure 8. The slope of the thermocouple reading on the burner front over Tinlet is indicative of flame position. A change in slope indicates the flame entering the SEV burner. As shown in the graph this change in slope occurs ca 50 K earlier at the high pressure conditions well in the range of the prediction by the chemical fit.
Flame position: Tmetal
-100
0
100
200
300
400
500
-100 -50 0 50 100Tinlet_gas_SEV-Tref_gas / K
T met
al -T
ref_
met
al/ K
Atmospheric combustion
High pressure combustion
Figure 8: Comparison of the response of the metal temperature to the flame approaching the burner at HP and atmospheric conditions with 18% C2+.
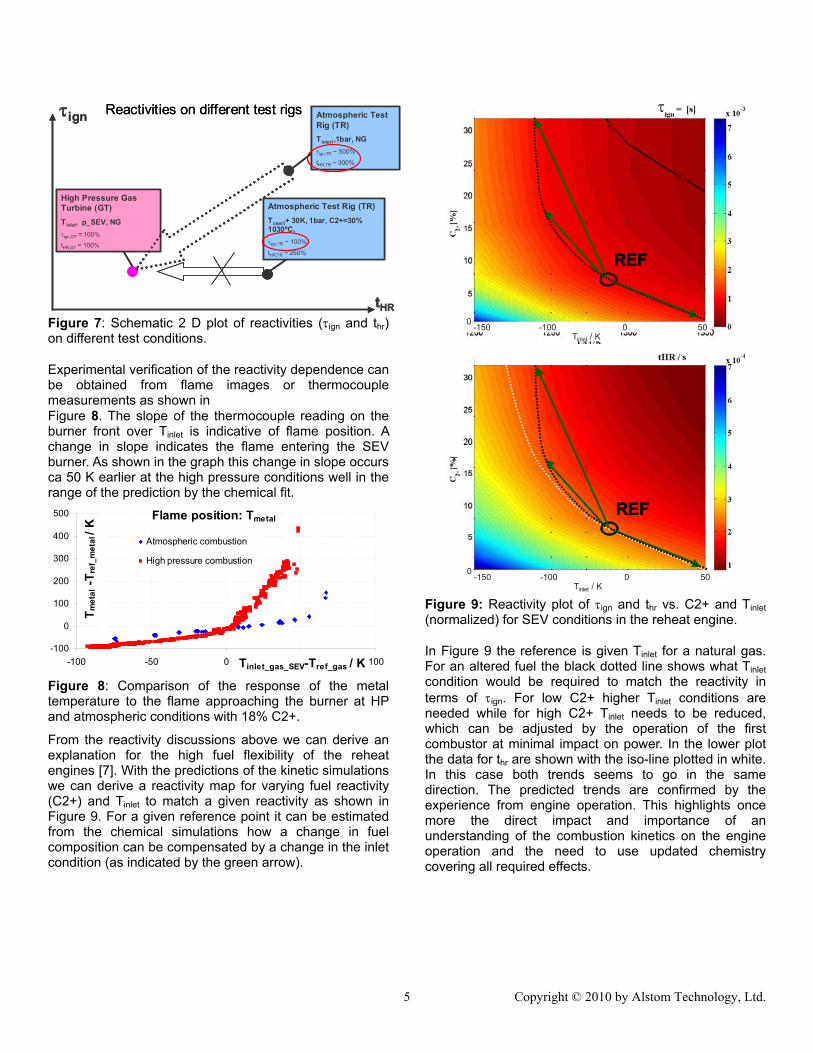
From the reactivity discussions above we can derive an explanation for the high fuel flexibility of the reheat engines [7]. With the predictions of the kinetic simulations we can derive a reactivity map for varying fuel reactivity (C2+) and Tinlet to match a given reactivity as shown in Figure 9. For a given reference point it can be estimated from the chemical simulations how a change in fuel composition can be compensated by a change in the inlet condition (as indicated by the green arrow).
REF
-150 -100 0 50Tinlet / K
0
τ
REFREF
-150 -100 0 50Tinlet / K
0
τ
-150 -100 0 50Tinlet / K
0
REFREF
Figure 9: Reactivity plot of τign and thr vs. C2+ and Tinlet (normalized) for SEV conditions in the reheat engine.
In Figure 9 the reference is given Tinlet for a natural gas. For an altered fuel the black dotted line shows what Tinlet condition would be required to match the reactivity in terms of τign. For low C2+ higher Tinlet conditions are needed while for high C2+ Tinlet needs to be reduced, which can be adjusted by the operation of the first combustor at minimal impact on power. In the lower plot the data for thr are shown with the iso-line plotted in white. In this case both trends seems to go in the same direction. The predicted trends are confirmed by the experience from engine operation. This highlights once more the direct impact and importance of an understanding of the combustion kinetics on the engine operation and the need to use updated chemistry covering all required effects.
5 Copyright © 2010 by Alstom Technology, Ltd.

4. DESCRIPTION OF THE ATMOSPHERIC COMBUSTION TEST RIG
The atmospheric test rig for reheated combustion chambers (see Figure 10) is a modified version of the original high-pressure facility used during the GT24/GT26 engine development phase [1]. The rig is used to provide insight into physical fundamentals and to study the sensitivity of certain influencing parameters with relatively reasonable effort in time and costs. It consists of two independent combustors in a serial arrangement, with the first one working as a hot gas generator. The inlet temperature and oxygen concentration can be adjusted by mixing the combustion products of the first stage with preheated air. The reheated combustor has large windows to allow optical access from all sides for visualization and measurement (chemiluminescence, LIF, LDA, PIV) of flow and flame.
carriercooling
combustiondilution
effusion
FlowFlow
Figure 10: Schematic of the full-scale atmospheric combustion rig for GT24/GT26 reheat systems.
The hot-gas generator simulates the EV burner of the GT24/GT26 engines. In this rig, four small EV burners are used, in order to optimise the local temperature and velocity homogeneity. Also, the possibility of switching off a burner gives further operation flexibility. For having stable operation of the hot-gas generator and realistic SEV inlet temperatures, the effects of the high-pressure turbine are achieved injecting dilution air towards the end of the first combustion chamber resulting in slightly higher O2 levels compared to the engine as already mentioned above. The rig is equipped with temperature, pressure and emission probes both at the SEV burner inlet and at the SEV combustion chamber exit, so that pressure drop and specific SEV emissions can be computed from the inlet and outlet measured data.
5. COMBUSTION PERFORMANCES OF REHEAT HARDWARE AT ATMOSPHERIC CONDITIONS On a reheat combustor, being driven by self-ignition, the inlet temperature is one of the main parameters to investigate. Its obvious importance is further emphasized by the fact that the engine needs stable operation over a wide spread of inlet temperatures. 5.1. METAL TEMPERATURES
For achieving long lifetime, it is very important to keep the metal temperature of the SEV burners within the specified limits. Seven thermocouples show the temperature at the most relevant burner areas: Six thermocouples in the mixing section few millimeters upstream of the burner exit and one at the burner entrance. As expected the inlet temperature are the highest, downstream (mixing section) the temperature are lower, thanks to the cooling applied to the burner. The metal temperature increases linearly with the main flow temperature, since cooling was maintained constant. Thermocouples in the mixing section are then used to monitor the metal temperatures as a function of the flame position. The flame front moves upstream with increasing inlet temperature. When the flame front gets close to the burner exit, the mixing section thermocouples respond strongly the approaching flame, and a further increase of the inlet temperature will produce a non-linear increase on the metal temperature. For a stable engine operation, the flame has to be located in the combustion chamber, the design criteria for of the mixing section and the burner velocities rely on the target temperatures to be achieved, with a linear response of the mixing section thermocouples.
MixingzoneFlamefront
vax=0
vax=0
Front Panel
= Thermocouples
Recirculation zones
Figure 11: Sketch of the SEV burner and combustion chamber.
In terms of lifetime assessment it is crucial to establish the maximum allowable inlet temperature for a certain
6 Copyright © 2010 by Alstom Technology, Ltd.

SEV burner. Various hardware configurations were tested both atmospherically and at high pressure to define the limiting inlet temperature at high pressure conditions from the data acquired in the atmospheric rig. Also, the tested burners are equipped with thermocouples on the front panel (FP), to check the temperature in the recirculation zones, as sketched in Figure 11. Despite their higher temperature, slightly lower values are recorded by these thermocouples, because of the low exhaust gas velocities in these regions. Flame imaging runs continuously during most of the tests. The visible chemiluminescence shows well how the flame structure changes with the inlet temperature as shown in Figure 12 and Figure 13. For low inlet temperature the flame is characterized by a V-shape. This structure is the result of the top/bottom recirculation regions which bring the hot exhaust gases near the exit of the burner, causing ignition near the top and bottom walls. Due to the relatively low temperature of the bulk flow, however, in the middle, the ignition occurs relatively far from the burner exit plane. With increasing temperatures, the flame front gets closer and closer to the burner exit, until a critical temperature is reached, for which the flame starts having part of it inside the mixing section. For such condition, the metal temperatures show very high values and the limit of the specific burner geometry is defined.
Increasing inlet temperature
Side view
SEV exit
Flow
Figure 12: Flame structure for varying inlet temperatures; Side and top views; constant SEV fuel mass flow.
Note the blue colour of the reaction zones. The upper and lower portions of the flame are stabilised near the interface between the bulk flow exiting the burner and the main recirculation zones inside the combustion chamber. The region in which the flame is stabilised plays an important role on emissions, thermo acoustic stability and lifetime. As clearly shown in Figure 12, the flame can be stabilised in a wide range of axial positions. A flame stabilised in the downstream region of the combustion chamber can be beneficial because of the low metal temperature at the burner body and low NOx emissions, due to the lower residence time in the combustion chamber and to the better fuel/air mixing at the flame front. However such flames are characterised by higher part-load CO emissions and possibly thermo acoustic instability risks. Generally speaking, flames stabilised more upstream are less likely to produce CO, but more likely to produce
more NOx. Consequently, the final flame position is selected as a compromise to optimize all parameters, such as NOx, CO and material temperatures.
5.2. FUEL FLEXIBILITY
It is a priority to offer gas turbines with stable operation for a broad range of natural gas composition, furthermore work is being undertaken to also provide reheat combustors optimized for hydrogen rich fuels. The main impact of a highly reactive fuel can be seen on the flame front location (see Figure 13) and on the metal temperature values at the burner downstream end (see Figure 14).
Increasing C2+ concentration
Side view
FlowFlow
Figure 13: Flame images varying the fuel reactivity; constant SEV fuel mass flow.
The flame front moves upstream (right) for increasing C2+ content. Note the consistency with the images taken for different inlet temperature, in agreement with the ignition time change due to temperature and fuel reactivity as calculated in the previous section.
Figure 14: Metal temperature at SEV burner exit as a function of inlet temperature and C2+ content; constant SEV fuel mass flow.
5.3. EMISSIONS
The reheat combustion development focuses towards a reduction of NOx and CO emissions. This task is particularly challenging due to the conflicting criteria needed to achieve a reduction on both pollutants. The atmospheric rig is particularly suitable for predicting the NOx formation, although valuable information on CO production mechanism can be gathered as well. The evaluation of SEV-NOx production has to be done very
7 Copyright © 2010 by Alstom Technology, Ltd.

careful attributing the NOx production in the first combustor by balancing the contribution NOx and overall mass flow. It is impossible to match the absolute values of NOx concentration with the ones measured in the atmospheric rig because of differences in the reaction kinetics, fuel composition and inlet/outlet temperature set to compensate the effects of the high pressure on the flame position. However, a number of hardware variants tested both at atmospheric and high pressure, show that trends can be well transferred so that a successful ranking of different hardware solutions can be achieved successfully, isolating the most promising combustor configuration. Figure 15 shows such an example: The left portion of the figure shows how increasing the inlet temperatures of the SEV burner substantially reduces the CO production. This is the kinetically-controlled CO, strongly produced at lower temperature and pressures than base load. At that conditions the residence time in the combustion chamber might not be sufficient for complete CO oxidation to CO2. The figure also shows the beneficial effect of increasing the fuel reactivity with fuels richer in C2+ content. The right portion of the figure (positive gradients), indicates how the temperature effects the equilibrium CO, mainly linked to the engine-base load CO. It is evident that the C2+ effects are minor in this region.
Figure 15: CO production as a function of SEV inlet temperature; constant SEV fuel mass flow.
The atmospheric combustion rig can be well used for NOx predictions. Figure 16 shows the effects of both the inlet temperature and the flame temperature on the SEV NOx production.
High SEV fuel mass-flow
Low SEV fuel mass-flow
-50 0 +50 +100 +150
Figure 16: Effects of SEV inlet temperature and flame temperature on SEV-NOx production; constant SEV fuel mass flow.
The measured NOx emissions agree well with the exponential trends (solid lines), which can also be used to calibrate other analytical tools as they used in step 1 of Figure 3.
5.4. COMBUSTOR PRESSURE DROP
The fluid-dynamic optimisation of the reheat combustor is mainly done in the first step of the development process, particularly through water channel testing. Pressure drop of various hardware can be measured in the water channel with even higher precision. However the blocking effect of the flame has a substantial contribution on the overall pressure drop.
Figure 17: Effects of inlet temperature and fuel reactivity on SEV combustor pressure drop values; constant SEV fuel mass flow.
Both the fuel composition and the inlet temperature influence the burner pressure drop, as shown in Figure 17. Indeed both parameters influence the reactivity, which in turn determines the flame axial position. Flames stabilised upstream cause a larger blocking effect, measurable in terms of higher pressure drops.
8 Copyright © 2010 by Alstom Technology, Ltd.

5.5. INVESTIGATION PRECEDING AND FOLLOWING THE ATMOSPHERIC COMBUSTION TESTS
Among the first-step research tools, CFD simulations and water channel tests constitute the major source of information for the concept analysis and down selection. Being able to achieve Reynolds numbers comparable with the engine ones, the water channel gives an excellent insight of the fluid dynamics of the burner and the combustion chamber. Particle Image Velocimetry (PIV) and Laser Doppler Anemometry (LDA) provide data for velocity distribution, focusing in particular on the regions near the vortex generation, the fuel injection and the flame front. Laser Induced Fluorescence (LIF) can provide accurate data about the fuel distribution and mixing, used in particular near the injector and the flame location. CFD is constantly validated against the experimental data and provides information for regions not easily accessible by the above mentioned laser diagnostics. It also gives a good prediction of the flame positioning and structure thanks to its strong link with chemical kinetics studies.
Low inlet temperature
Medium inlet temperature
High inlet temperature
Figure 18: Comparison between CFD calculations and atmospheric imaging as a function of SEV inlet temperature.
An example is shown in Figure 18 where flame front simulations are compared with chemiluminescence images acquired in the atmospheric rig [9]. The figures on the left side show the calculated flame front over a single plane at the plane of symmetry, as the figures on the right
side show a line-of-sight integrated view of the flame from the side window of atmospheric rig. The figures in the middle show the calculated flame front as a perspective view. The above mentioned information, completed with theromoacoustic studies, high density and spray tests for liquid fuels and give sufficient inputs to finally bring some hardware variants at a maturity level such that they are tested at atmospheric combustion condition in a full-scale single-combustor rig. Only few of the atmospherically tested variants further proceed towards high-pressure validation tests. In the expensive high-pressure rig the focus is on the burner operation and validation against the engine combustor specifications. In particular, emissions, metal temperatures and the operation range are carefully evaluated, giving therefore clear feedback on the predictions developed with atmospheric pressure testing.
6. CONCLUSION The sequential combustion system of GT24 and GT26 engines from Alstom is capable of achieving the most rigorous emission targets at base-load operation, with an additional benefit of delivering very low NOx and CO emissions down to low part load [8]. Atmospheric combustion testing is one of the main steps in the development process of this unique combustion system with a reheat combustor. Full-scale burners are evaluated, focusing in particular on the fuel flexibility, emissions, lifetime (metal temperature), also giving useful qualitative information through the acquired flame images, which clearly show the impact of the burner boundary conditions on the flame structure and stabilisation. Reaction kinetic analysis demonstrate how the large differences in reactivity between atmospheric and high pressure conditions, can be well compensated by temperature and C2+ doping, making the atmospheric rig an excellent tool to down select the most promising hardware, in order to accelerate development and to save time consuming high pressure tests.
REFERENCES [1] Joos, F., Brunner, P., Schulte-Werning, B., Syed, K. and
Eroglu, A., “Development of the Sequential Combustion System for the ABB GT24/GT26 Gas Turbine family”, ASME 1996-GT-315
[2] Eroglu, A., Döbbeling, K., Joos, F. and Brunner, P., “Vortex Generators in Lean-Premix Combustion”, Transactions of the ASME, Journal of Engineering for Gas Turbines and Power, January 2001, Vol. 123, pp. 41-49
[3] Cutright, J. T., Neumeier Y., Zinn, B. T,. Lewis Jr, D. S., Shahid, E., Birmaher, S, “Ignition Triggering Of Afterburner
9 Copyright © 2010 by Alstom Technology, Ltd.

Fuel Using Partial Oxidation Mixtures”, ASME Turbo Expo 2009, GT2009-60157.
[4] GRI-Mech Web site, http://www.me.berkeley.edu/grimech
[5] F. Güthe, M. de la Cruz García, A. Burdet, ”Flue Gas Recirculation In Gas Turbine: Investigation Of Combustion Reactivity and NOx Emission” ASME-GT2009-59221.
[6] L. J. Spadaccini, M.B. Colket, Progress in Energy Combustion Science, Vol.20, 431– 460. (1994).
[7] F Güthe, J. Hellat, P. Flohr, "The reheat concept: the proven pathway to ultra-low emissions and high efficiency and flexibility", Journal of Engineering for Gas Turbines and Power, 131, 021503 (2009).
[8] M. Hiddemann, P. Marx and A. Birrell, “Operating Experience with the Latest Upgrade of Alstom's Sequential Combustion GT26 Gas Turbine”, ASME Turbo Expo 2010, June 14-18, 2010, Glasgow, UK
[9] B. Ivancic, M. Brandt, P. Flohr W. Polifke, & B. Paikert, "Auto-Ignition and Heat Release in a Gas Turbine Burner at Elevated Temperature", ASME Turbo Expo 2004, GT2004-53339
10 Copyright © 2010 by Alstom Technology, Ltd.