fugro foundation report bridge street bridge
TRANSCRIPT

FUGRO Foundation Report Bridge Street Bridge Rehabilitation Over Arroyo Grande Creek EXISTING Bridge No. 49C-0196 Federal Project No. BRLO-5199(027) Arroyo Grande, California Prepared for: Quincy Engineering, Inc. May 2017 Project No. 04.62120100

Fugro Project No. 04.62120100
Prepared for:
Quincy Engineering Inc. 11017 Cobblerock Drive, Suite 100 Rancho Cordova, California 95670
02 Final LB May 5, 2017
01 Draft LB MM GD March 8, 2017
Issue Document Status Prepared Checked Approved Date
FUGRO Foundation Report Bridge Street Bridge Rehabilitation Over Arroyo Grande Creek EXISTING Bridge No. 49C-0196 Federal Project No. BRLO-5199(027) Arroyo Grande, California Prepared for: Quincy Engineering, Inc. May 2017 Project No. 04.62120100
A member of the Fugro Group of companies with offices throughout the world.
FUGRO 4820 McGrath Street, Suite 100 Ventura, California 93003 T +1 805 650 7000 F +1 805 650 7010 www.fugro.com
May 5, 2017 Project No. 04.62120100 Quincy Engineering Inc. 11017 Cobblerock Drive, Suite 100 Rancho Cordova, California 95670 Attention: Mr. Greg Young Subject: Foundation Report, Bridge Street Bridge Rehabilitation over Arroyo Grande Creek, Existing Bridge
No. 49C-0196, Federal Project No. BRLO-5199(027), Arroyo Grande, California Dear Mr. Young, Fugro is pleased to submit this Foundation Report for design of the Bridge Street Bridge Rehabilitation over Arroyo Grande Creek in Arroyo Grande, California. Our services for the project were performed in accordance with our proposals dated February 7, 2012 and March 16, 2017, and our work was authorized by Quincy Engineering’s Standard Agreement for Subconsultant Services dated June 26, 2012 and Amendment 1 dated March 17, 2017. Our geotechnical services were generally performed in two phases. The first phase of our work consisted of preparing a Preliminary Foundation Report, dated November 28, 2012, that was based on available existing information and review of previous geotechnical studies for the existing bridge. The second phase of work consisted of performing a field exploration and laboratory testing program to characterize the subsurface conditions at the site, conducting various analyses to provide seismic design criteria and response spectra for the bridge design, developing geotechnical engineering recommendations for the design of the bridge foundations, and providing recommendations for the design of the roadway approaches. This Foundation Report provides geotechnical recommendations for the design of the bridge foundations, abutments and roadway approaches, as well as geotechnical considerations regarding corrosion for substructures, scour, seismic data for use with Caltrans design methods, and construction considerations. Field and laboratory data collected for this study are attached with this report.

QUINCY ENGINEERING, INC. BRIDGE STREET BRIDGE REHABILITATION ARROYO GRANDE, CALIFORNIA
Fugro Project No. 04.62120100
Please contact the undersigned if you have questions or if you require additional information.
Sincerely, Fugro USA Land, Inc.
Loree A. Berry, PE 73221 Gregory S. Denlinger, GE 2249 Associate Engineer/Senior Project Manager Principal Geotechnical Engineer
Copies: 4 – Addressee

QUINCY ENGINEERING, INC. BRIDGE STREET BRIDGE REHABILITATION ARROYO GRANDE, CALIFORNIA
Fugro Project No. 04.62120100 Page i of ii
CONTENTS Page
1. PROJECT DESCRIPTION .......................................................................................................................... 1 1.1 Existing Facility............................................................................................................................................ 1 1.2 Previous Studies ......................................................................................................................................... 1 1.3 Proposed Improvements ............................................................................................................................. 2
2. WORK PERFORMED ................................................................................................................................. 3 2.1 Purpose ....................................................................................................................................................... 3 2.2 Scope .......................................................................................................................................................... 3 2.3 Field Exploration ......................................................................................................................................... 4 2.4 Laboratory Testing ...................................................................................................................................... 4 2.5 General Conditions ..................................................................................................................................... 5
3. SITE CONDITIONS ..................................................................................................................................... 6 3.1 Geologic Setting .......................................................................................................................................... 6 3.2 Subsurface Conditions ................................................................................................................................ 6 3.3 Groundwater................................................................................................................................................ 8
4. GEOTECHNICAL EVALUATION ............................................................................................................... 9 4.1 Seismicity .................................................................................................................................................... 9 4.2 Ground Surface Fault Rupture .................................................................................................................. 10 4.3 Landslides and Slope Instability ................................................................................................................ 10 4.4 Liquefaction and Seismic Settlement ........................................................................................................ 11
4.4.1 Evaluation .................................................................................................................................. 11 4.4.2 Potential Design Impacts from Liquefaction and Seismic Settlement ....................................... 11
4.5 Geologic Profiles and Engineering parameters ........................................................................................ 12
5. CONCLUSIONS AND RECOMMENDATIONS ........................................................................................ 13 5.1 Summary of Findings ................................................................................................................................ 13 5.2 Foundation Types ..................................................................................................................................... 14 5.3 Foundation Design .................................................................................................................................... 14
5.3.1 Axial Capacity of CIDH Piles ..................................................................................................... 15 5.3.2 Lateral Pile Capacity .................................................................................................................. 15 5.3.3 Group Effects ............................................................................................................................. 16 5.3.4 Settlement .................................................................................................................................. 16 5.3.5 Pile Design Data Table .............................................................................................................. 17 5.3.6 Abutment Resistance ................................................................................................................. 17
5.4 Static Lateral Earth Pressures .................................................................................................................. 17 5.5 Dynamic Earth Pressures ......................................................................................................................... 18 5.6 Corrosion Considerations .......................................................................................................................... 18 5.7 Roadway Approaches ............................................................................................................................... 19

QUINCY ENGINEERING, INC. BRIDGE STREET BRIDGE REHABILITATION ARROYO GRANDE, CALIFORNIA
Fugro Project No. 04.62120100 Page ii of ii
5.7.1 Structure Approach Embankment.............................................................................................. 19 5.7.2 Use of On-site Materials ............................................................................................................ 19 5.7.3 Approach Fill Settlements .......................................................................................................... 20
5.8 Pavement Structural Section ..................................................................................................................... 20 5.9 Construction Considerations ..................................................................................................................... 20
5.9.1 Excavation ................................................................................................................................. 20 5.9.2 Temporary Slopes and Shoring ................................................................................................. 21 5.9.3 Groundwater and Dewatering .................................................................................................... 21 5.9.4 CIDH Pile Construction .............................................................................................................. 21
6. CONTINUATION OF SERVICES ............................................................................................................. 23 6.1 Review of Plans and Specifications .......................................................................................................... 23 6.2 Geotechnical Observation and Testing ..................................................................................................... 23
7. REFERENCES .......................................................................................................................................... 24
LIST OF PLATES
No. Vicinity Map ................................................................................................................................................................ 1 Exploration Location Map ........................................................................................................................................... 2 Cross Section A-A’...................................................................................................................................................... 3 Design Acceleration Response Spectrum .................................................................................................................. 4 Geotechnical Properties for Analyses ........................................................................................................................ 5 Log of Test Borings (1 sheet)
APPENDICES
APPENDIX A SUBSURFACE EXPLORATION
Key to Terms & Symbols Used on Logs ................................................................................................A-1 Log of Boring No. DH-101 .....................................................................................................................A-2
APPENDIX B LABORATORY TEST RESULTS
Summary of Laboratory Test Results ......................................................................................... B-1a to 1b Grain Size Curves .................................................................................................................................B-2 Plasticity Chart ......................................................................................................................................B-3 Consolidation Test Results ....................................................................................................................B-4 Unconfined Compression Test Results ............................................................................... B-5a and B-5b Unconsolidated, Undrained Triaxial Test Results .......................................................... B-6a through B-6c Compaction Test Results ......................................................................................................................B-7 R-Value Test Results ............................................................................................................................B-8
APPENDIX C REFERENCED EXISTING SUBSURFACE DATA
Log of Test Boring (ESP 2004) ............................................................................................................ C-1

QUINCY ENGINEERING, INC. BRIDGE STREET BRIDGE REHABILITATION ARROYO GRANDE, CALIFORNIA
Fugro Project No. 04.62120100 May 2017 Page 1 of 26
1. PROJECT DESCRIPTION
This Foundation Report provides geotechnical input for designing the proposed rehabilitation improvements to the Bridge Street Bridge over Arroyo Grande Creek (Existing Bridge No. 49C-0196) in Arroyo Grande, California. The existing two-span bridge carries two lanes of vehicle traffic and sidewalks exist on both sides of the bridge.
The location of the site relative to nearby streets and landmarks is shown on Plate 1 - Vicinity Map. The general layout of the site and proposed facility are shown on Plate 2 - Field Exploration Location Plan.
1.1 Existing Facility
Constructed in 1908, the existing Bridge Street Bridge at Arroyo Grande Creek consists of 2 spans totaling 135 feet in length, is approximately 34 feet wide, and has two travel lanes with no shoulders. The north span is a steel truss. The south span is a reinforced concrete deck on steel girders. Sidewalks with timber decking are cantilevered from both sides of the bridge.
The bridge is within the historic and downtown area of Arroyo Grande. The streets that approach the bridge are generally lined with buildings used for retail, restaurants and various businesses. Arroyo Grande Creek flows to the west within an approximately 38-foot-deep channel beneath the bridge. Kiwanis Park is located on the north bank of the creek just upstream of the bridge. A partially collapsed and undermined concrete retaining wall appears to be located along portions of the south bank of the creek opposite of the park. The stream channel beneath and downstream of the bridge is heavily vegetated with blackberries, vines and some trees.
The bridge was retrofitted with a supplement steel truss constructed beneath the north span in or about 1990 (Caltrans, 1939-2011; Fred H. Schott & Associates, 1989). The supplemental truss was supported on the existing abutments and pier wall; no foundation improvements were made as part of that project. The Bridge Inspection Reports (BIR) do not describe the foundation system for the existing bridge; however, the Caltrans 1939 BIR states that the south span was added to the bridge after the old pier at the south end of the truss had washed out.
1.2 Previous Studies
As part of our data collection, we reviewed a “Conceptual Soils Engineering Report” prepared for the bridge site in 2004 by Earth Systems Pacific (ESP). That study included data from three exploratory borings at the site: one at each approach to depths of approximately 70 to 74 feet below the surface of Bridge Street, and one on the westerly side of the bridge pier to approximately 59 feet below the ground surface.
In addition, we reviewed as-built Caltrans Log of Test Borings (1957) prepared for the two (2) Highway 101 bridges located approximately 1,100 feet downstream of Bridge Street.

QUINCY ENGINEERING, INC. BRIDGE STREET BRIDGE REHABILITATION ARROYO GRANDE, CALIFORNIA
Fugro Project No. 04.62120100 May 2017 Page 2 of 26
1.3 Proposed Improvements
We understand the project will consist of replacing the existing foundations and supplemental truss with new foundations and a stronger supplemental truss, and rehabilitating the existing historic truss. The new bridge foundations will be supported by cast-in-drilled-hole (CIDH) piles.
The Foundation Plan (Sheet 3 of 31 of Quincy’s 65 Percent Plans) indicates that Abutment 1 at the north end of the bridge will be supported by a single row of four, 48-inch-diameter CIDH piles. Pier 2 will be supported by a single 84-inch-diameter CIDH pile and Abutment 3 at the south end of the bridge will be supported by one row of five, 36-inch-diameter CIDH piles. Rock slope protection will be placed at the abutments for scour protection.
It is anticipated that the vertical profile for the bridge rehabilitation will be near the existing site grades. The approaches will be resurfaced with asphalt to match the adjacent pavement surface.

QUINCY ENGINEERING, INC. BRIDGE STREET BRIDGE REHABILITATION ARROYO GRANDE, CALIFORNIA
Fugro Project No. 04.62120100 May 2017 Page 3 of 26
2. WORK PERFORMED
2.1 Purpose
The purpose of this report is to provide geotechnical recommendations for the design of the Bridge Street Bridge Rehabilitation project over Arroyo Grande Creek. The main geotechnical considerations that we evaluated for the project were characterization of the soil and groundwater conditions encountered at the bridge site, design of new CIDH pile foundations to support lateral and vertical loads, seismic design considerations, corrosion considerations for concrete substructures, and construction considerations for the bridge foundation rehabilitation.
2.2 Scope
To evaluate the geotechnical considerations for the project, we performed the following scope of work:
■ Consulted with Quincy and the City of Arroyo Grande (City) to review our approach to providing geotechnical services for design, and visited the site to observe the general site conditions and mark the locations of our borings;
■ Submitted a Preliminary Foundation Report (Fugro, 2012) based on review of existing documents as input to the bridge type selection process;
■ Obtained an encroachment permit from the City, prepared a health and safety plan for our work, contacted Underground Service Alert to review our proposed boring location relative to existing utilities, and coordinated the field exploration program with our drilling subcontractor;
■ Performed a field exploration program consisting of one (1) hollow-stem auger boring to a depth of approximately 95-1/2 feet near the existing northern abutment location on July 6, 2015. On March 29, 2017, the same borehole was extended to a depth of approximately 131-1/2 feet.;
■ Performed laboratory tests on selected samples recovered from the boring; ■ Prepared this report and the attached Log of Test Borings sheet summarizing the data collected and
providing our conclusions and recommendations regarding: □ Soil and groundwater conditions encountered; □ Site geology, faulting and seismicity; □ Seismic design criteria for use with Caltrans design methods; □ Liquefaction potential and considerations relative to foundation design (negative skin friction,
estimated seismic settlement of approaches and drilled pier foundations, as needed); □ Structural sections for asphalt concrete pavements based on traffic indices provided to us; □ Embankment construction including suitability of excavated materials for use as fill, moisture
control, erosion control, and drainage considerations, expansive soils, estimated settlement and special treatments to reduce settlement, if needed;
□ Corrosion considerations for design of subsurface structures (minimum cement factors estimated in accordance with Caltrans guidelines);
□ Potential for Naturally Occurring Asbestos (NOA) to impact the project; □ Suitable foundation types for the conditions encountered (such as spread footings, driven concrete
or steel piles, CISS, or CIDH piles);

QUINCY ENGINEERING, INC. BRIDGE STREET BRIDGE REHABILITATION ARROYO GRANDE, CALIFORNIA
Fugro Project No. 04.62120100 May 2017 Page 4 of 26
□ Specified tip elevations, settlement and size for cast-in-drilled hole foundations and pile loading provided by Quincy (2016);
□ Lateral capacity of single pile foundations for free-head and fixed-head conditions based on p-y analysis;
□ Pile spacing and group reduction factors for vertical and lateral loads; □ Lateral earth pressures, spring constants, and passive pressure resistance for abutment retaining
wall design; □ Special considerations for approach fill settlements, allowable slope inclinations, waiting periods
and need for monitoring; and □ Construction considerations: need for dewatering, CIDH pile construction, adjacent structures,
temporary excavations and shoring.
2.3 Field Exploration
The drilling subcontractor for the project was S/G Drilling Company (S/G) of Lompoc, California. S/G drilled one (1) hollow-stem-auger boring on July 6, 2015. The boring was drilled to a depth of approximately 95-1/2 feet below the existing ground surface using 8-inch-diameter hollow-stem augers. The boring was sampled at approximate five-foot intervals using a three-inch-outside-diameter modified California split-spoon sampler or a Standard Penetration Test sampler. The modified California sampler was equipped with one-inch high brass rings. The split-barrel samplers were driven into the materials at the bottom of the boring using a 140-pound automatic trip hammer with a 30-inch drop.
The blow count (N-value) shown on the boring logs is the number of blows from the hammer that were needed to drive the sampler one foot after the sampler had been seated at least six inches into the material at the bottom of the hole. Refusal is noted where the blow count exceeded 50 blows during seating. Bulk samples were collected from the drill cuttings retrieved from the auger flights. At completion, the boring was backfilled with one sack of cement slurry and capped with asphalt concrete patch.
The sample intervals, N-values, a description of the subsurface conditions encountered, and other field and laboratory data are presented on the log of the boring in Appendix A. The corresponding laboratory data is presented in Appendix B. The approximate location of Fugro’s 2015 boring and ESP’s 2004 borings are shown on Plate 2.
2.4 Laboratory Testing
Laboratory testing was performed on selected samples obtained during the field exploration program. Laboratory tests for moisture content, grain size analysis, plasticity (Atterberg limits), consolidation, unconfined compressive strength, unconsolidated undrained (UU) triaxial shear strength, laboratory compaction (modified Proctor), and R-value tests were performed by our laboratories in Ventura and Oakland, California. The tests were performed in general accordance with the applicable standards of ASTM. Corrosion tests were performed by Cooper Testing Laboratories of Palo Alto, California on selected samples using Caltrans test methods. Results of laboratory testing are presented on the boring logs in Appendix A and Appendix B.

QUINCY ENGINEERING, INC. BRIDGE STREET BRIDGE REHABILITATION ARROYO GRANDE, CALIFORNIA
Fugro Project No. 04.62120100 May 2017 Page 5 of 26
2.5 General Conditions
Fugro prepared the conclusions, recommendations and professional opinions of this report in accordance with the generally accepted geotechnical principles and practices at this time and location. This warranty is in lieu of all other warranties, either express or implied. This report was prepared for the exclusive use of Quincy Engineering, Inc. and their authorized agents only. It may not contain sufficient information for the purposes of other parties or other uses. If any changes are made in the project as described in this report, the conclusions and recommendations contained in this report should not be considered valid unless Fugro reviews the changes and modifies and approves, in writing, the conclusions and recommendations of this report.
The scope of geotechnical services performed and reported herein did not include any environmental assessments for the presence or absence of hazardous/toxic materials in the soil, groundwater, or atmosphere. Any statements, or absence of statements, in this report or data presented herein regarding odors, unusual or suspicious items, or conditions observed are strictly for descriptive purposes and are not intended to convey engineering judgment regarding potential hazardous/toxic assessment.
Soil and rock deposits can vary in type, strength, and other geotechnical properties between points of observations and exploration. Additionally, groundwater and soil moisture conditions can vary seasonally or for other reasons. Therefore, we do not and cannot have a complete knowledge of the subsurface conditions underlying the site. The conclusions and recommendations presented in this report are based upon the findings at the points of exploration, and interpolation and extrapolation of information between and beyond the points of observation, respectively. These findings are subject to confirmation based on the conditions revealed by construction.

QUINCY ENGINEERING, INC. BRIDGE STREET BRIDGE REHABILITATION ARROYO GRANDE, CALIFORNIA
Fugro Project No. 04.62120100 May 2017 Page 6 of 26
3. SITE CONDITIONS
3.1 Geologic Setting
The project is located in the Arroyo Grande Valley and within the Coast Ranges geologic and geomorphic province. That province consists of north-northwest-trending sedimentary, volcanic, and igneous rocks extending from the Transverse ranges at the south into northern California. Rock formations of the Coast Ranges province are predominantly of Jurassic and Cretaceous age; however, some pre-Jurassic, along with Paleocene-age to Holocene rock formations are present.
The Arroyo Grande Valley and adjacent hills are the dominant geomorphic features within the project vicinity. The valleys were formed during a period of low sea level (the Wisconsin glacial stage), as coastal streams adjusted to the drop in sea level by carving into the landscape. A subsequent rise in sea level produced a dynamic depositional environment reflected in the discontinuous and variable subsurface stratigraphy. Up to approximately 800 feet of interlayered and unconsolidated sediments have been deposited within the valleys that generally dip gently to the west. Fill and alluvium encountered at the site was underlain by sediments of the Paso Robles Formation.
Hall (1973) characterizes the Paso Robles Formation as unconsolidated or poorly consolidated gravel or conglomerate, sandstone, siltstone and claystone. Although designated as rock because of the formation, the sediments of the Paso Robles Formation are generally uncemented units of stiff to hard cohesive soils and medium dense to very dense granular soils and as a result, are described using soil classification terminology in this report. Holland (2013) maps the same unit as older alluvium and describes it as unconsolidated boulders, cobbles, gravel, sand, silt and clay with clasts generally consisting of Franciscan Complex, Obispo and Monterey Formation lithologies.
3.2 Subsurface Conditions
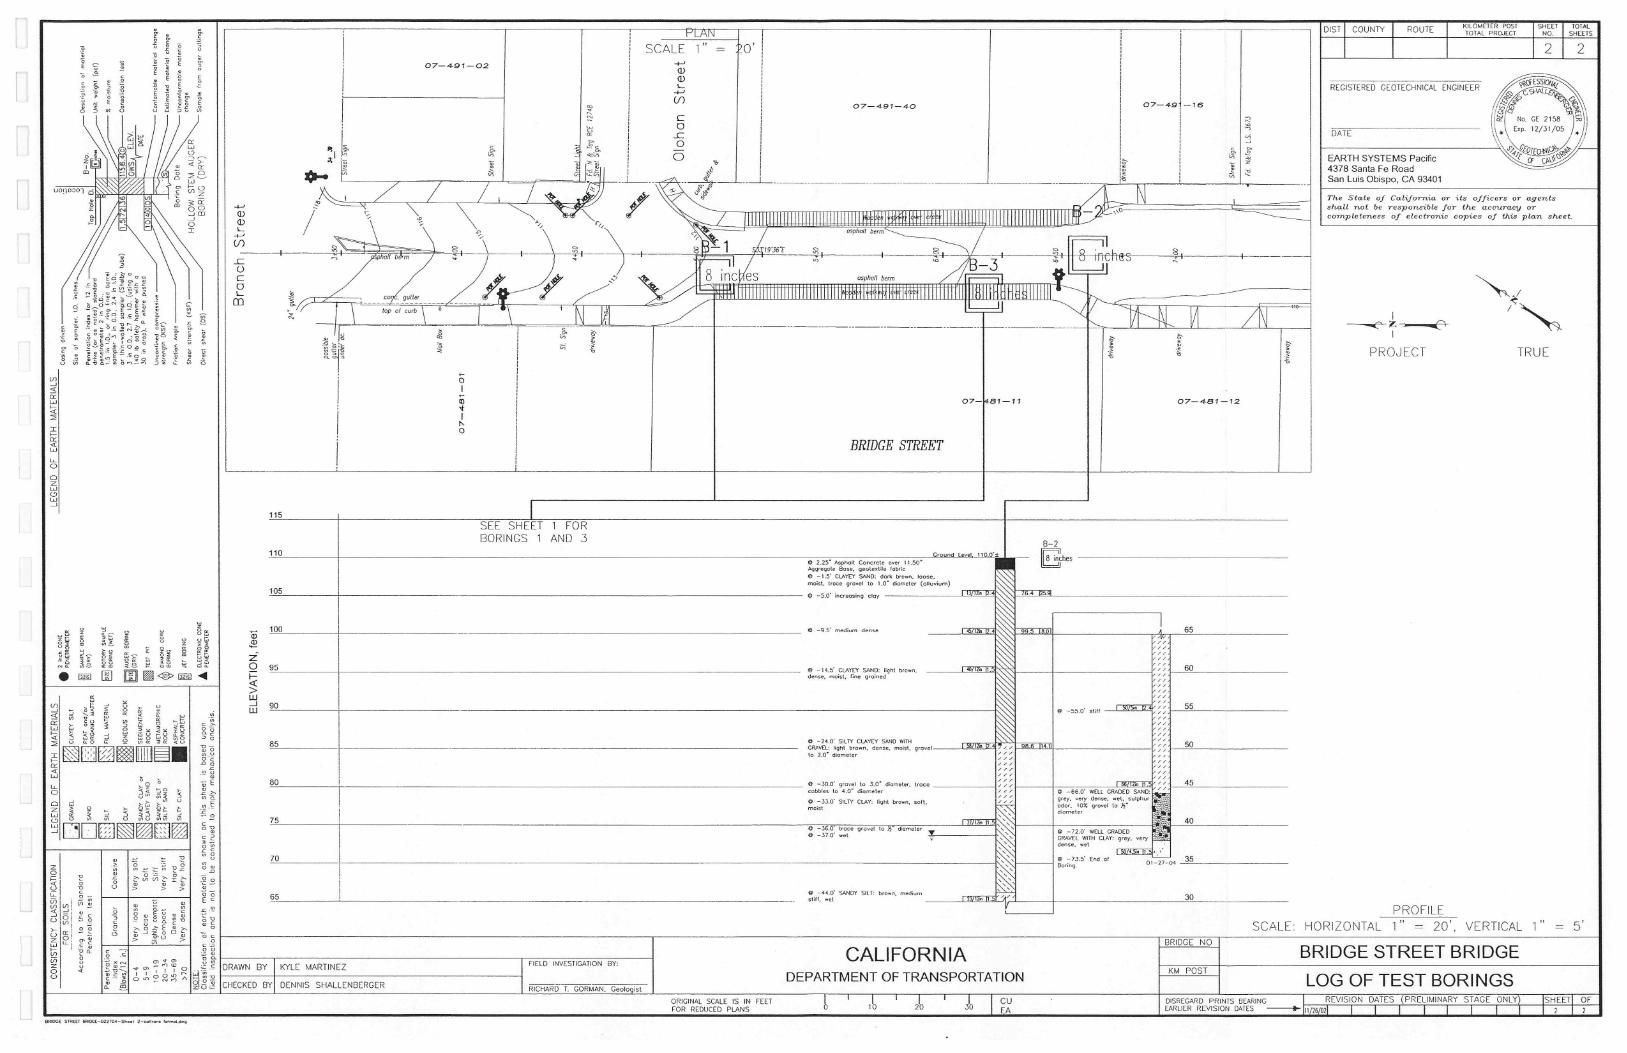
Fugro’s boring DH-101 was drilled in the north abutment area on July 6, 2015 to a depth of approximately 95-1/2 feet below the existing ground surface (bgs). On March 29, 2017 that same boring location was re-drilled and extended to a depth of approximately 131-1/2 feet bgs, corresponding to an approximate elevation (EL.) of EL. -19-1/2 feet above mean sea level (MSL). For the ESP (2004) exploration program, boring B-1 extended to about EL. +42 feet, and borings B-2 and B-3 extended to about EL. +35 feet. The approximate locations of the explorations are shown on Plate 2, a log of test borings (LOTB) depicting the Fugro boring is presented after Plate 5, and the ESP (2004) LOTB is presented in Appendix C.
The subsurface conditions encountered by Fugro and reported by ESP (2004) generally consisted of artificial fill (af) overlying alluvium (Qal) and Paso Robles Formation (Qpr). General descriptions of those units are provided below. It should be noted that ESP (2004) did not identify any materials encountered as Paso Robles Formation. Therefore, the depths estimated for the contact between alluvium and Paso Robles Formation are based on our interpretation and a comparison between ESP (2004) boring logs and the subsurface conditions encountered in boring DH-101.

QUINCY ENGINEERING, INC. BRIDGE STREET BRIDGE REHABILITATION ARROYO GRANDE, CALIFORNIA
Fugro Project No. 04.62120100 May 2017 Page 7 of 26
Artificial Fill (af). Artificial fill was encountered in boring DH-101 from the ground surface to about ten feet below the ground surface. The artificial fill consisted of very loose to medium dense clayey sand (SC), and very stiff sandy lean clay (CL). The ESP (2004) borings encountered artificial fill materials composed of loose to medium dense sand and clayey sand, and stiff sandy lean clay from the ground surface to depths ranging from about 1-1/2 to 8-1/2 feet. The artificial fill appears to be associated with grading performed during construction of the existing bridge. Artificial fill materials were encountered in all of the borings above alluvium.
Alluvium (Qa). The alluvium encountered in boring DH-101 consisted of medium dense to dense silty sand (SM) and poorly graded sand with clay and gravel (SP-SC), and soft to stiff fat clay (CH) with varying amounts of gravel. The ESP (2004) borings encountered alluvial materials that predominantly consisted of loose to dense poorly graded sand, silty and clayey sand with varying amounts of gravel, well-graded gravel with sand, and soft to stiff lean clay, silt and silty clay with varying amounts of sand and gravel.
We have logged the alluvial materials encountered in DH-101 extending to about EL. +74 feet and have interpreted the alluvial materials encountered in the ESP borings extending to EL. +74 at the north abutment (similar to DH-101), to about EL. +45 to +50 feet at the south abutment.
Paso Robles Formation (Qpr). Paso Robles Formation materials were encountered below alluvium at a depth of about 38 feet (about EL. +74 feet) in boring DH-101. The formational materials consisted of dense to very dense poorly-graded gravel with clay and sand (GP-GC), with interbedded clayey sand with gravel (SC) and silty sand with gravel (SM). Below the predominantly granular formational materials, we encountered a hard lean clay (CL) unit between a depth of about 83 feet (EL. +29 feet) to the final boring termination depth of approximately 131-1/2 feet (EL. -19.5 feet). The hard clay is massive with a high water content and low dry unit weight. On a visual basis, the material has the appearance similar to bentonite.
ESP (2004) encountered soils we that we interpret as formational materials from an approximate depth consistent with Fugro boring DH-101 extending to the maximum exploration depths of approximately 60 to 75 feet below the surface of the road. ESP (2004) logged materials within that interpreted formational zone as dense to very dense sand and gravel deposits.
Geotechnical Properties. The data presented below were developed on the basis of our recent field exploration effort and existing data presented in the Log of Test Borings (LOTB) prepared by ESP (2004). The results from selected laboratory tests and field data measured during the field exploration are summarized below. Plate 3 – Cross Section A-A’ also presents our interpreted contacts between geologic units consistent with Table 1.

QUINCY ENGINEERING, INC. BRIDGE STREET BRIDGE REHABILITATION ARROYO GRANDE, CALIFORNIA
Fugro Project No. 04.62120100 May 2017 Page 8 of 26
Table 1. Summary of Selected Geotechnical Properties by Unit
Geologic Unit Predominant Soil/Rock
Range of Dry Unit Weights
(pcf)
Range of Moisture Contents
(%)
SPT Field-N60
Value Range
Undrained Shear
Strength (ksf)1
Af/Qal1
Very loose to medium dense clayey SAND (SC) and silty SAND (SM) with layers of very stiff sandy lean CLAY (CL)
76 to 112 8 to 26 5 to 15 p: 2.5 (CL)
Qal2
Medium dense to very dense silty SAND (SM), clayey SAND (SC) and poorly graded sand with clay and gravel (SP-SC), trace cobbles, occasional very stiff to hard CLAY (CL) layers
84 to 101 12 to 21 8 to 50+ p: 4.0 (CL)
Qal3 Medium stiff to stiff lean CLAY (CL) to fat CLAY (CH) 90 to 100 30 to 31 14 to 33 p: 0.8 to 1.3
t: 0.7 to 1.7
Qpr
Dense to very dense poorly-to well-graded GRAVEL with sand and clay (GP-GC), occasional cobbles and/or boulders. Hard lean clay (CL) encountered below El. 28 feet
83 to 108 (GP-GC) 72 to 79
(CL)
17 to 36 (GP-GC) 36 to 47
(CL)
50 to Refusal
p: 4.5+ (CL) Q: 3.1 to 4.7
(CL) uu: 8.1 to 10.7
(CL)
Note: 1. Test to estimate undrained shear strength denoted: p = field pocket penetrometer; t = field torvane; Q = unconfined compression test; uu = unconsolidated, undrained triaxial compression testing
3.3 Groundwater
Groundwater was encountered in July 6, 2015 boring DH-101 at a depth of approximately 40-1/2 feet corresponding to EL. 71.5 feet. When DH-101 was extended on March 29, 2017, groundwater was measured in the boring at a depth of 28 feet bgs (EL. 84 feet). The ESP (2004) borings encountered groundwater at depths ranging from approximately 23-1/2 to 37 feet below the ground surface, corresponding to an elevation range of EL. 70 feet to EL. 77 feet. About two feet of water was observed within the creek channel on July 6, 2015 (approximate creek thalweg EL. 77 feet). For the purposes of our liquefaction and foundation analyses, we assumed a groundwater elevation of EL. 85 feet.
The groundwater level at the project site is likely influenced by the water level in Arroyo Grande Creek and local precipitation events. Groundwater and soil moisture conditions will vary in association with changes in precipitation, irrigation, runoff and other factors.

QUINCY ENGINEERING, INC. BRIDGE STREET BRIDGE REHABILITATION ARROYO GRANDE, CALIFORNIA
Fugro Project No. 04.62120100 May 2017 Page 9 of 26
4. GEOTECHNICAL EVALUATION
4.1 Seismicity
A design acceleration response spectrum (ARS) for the site was estimated using ARS Online and guidelines set forth in Appendix B of the Caltrans (2013) Seismic Design Criteria. The project site is within a seismically active region of California. We performed a fault search of the project area using current Caltrans Seismic Design Criteria and utilizing the Caltrans ARS Online V2.3.07 website. The ARS Online website is updated on an ongoing basis and we accessed the site on February 27, 2017.
ARS Online displays information for faults included in the Caltrans (2012b) Fault Database Version 2B and calculates both deterministic and probabilistic acceleration response spectra (ARS) as described in Appendix B of the Caltrans (2013) Seismic Design Criteria. ARS Online was used as a basis for developing the seismic design criteria and recommended response spectra for the site. The table below presents a list of three faults that are considered to be seismic sources closest to the site identified using ARS Online and site coordinates estimated as 35.122600 degrees latitude and -120.578600 degrees longitude.
Table 2. Nearby Faults
Fault Name Fault Type1 Rx Distance (km/miles)2
Maximum Magnitude (Mmax)3
San Luis Range (So Margin) (ID 238)
Reverse 45 degrees 0.62/0.78 7.1
San Luis Range – Oceano 2011 CFM (ID 240)
Reverse 45 degrees 5.00/3.11 6.8
Los Osos 2011 (ID 232)
Reverse 45 degrees 6.60/4.10 6.9
Notes: 1) Fault type per Caltrans (2012b) Fault Database Version 2B. 2) Horizontal perpendicular distance to the fault trace (*fictitious fault trace for sites offset from the mapped fault location) or surface projection of the top of rupture plane measured perpendicular to the fault from the site per ARS Online and Caltrans Geotechnical Services Design Manual. 3) Mmax values per ARS Online and Caltrans (2012b) Database.
We estimated the shear wave velocity for materials encountered in the borings using correlations to blow counts as presented in the Caltrans (2009) Geotechnical Services Design Manual. An average shear wave velocity of approximately 300 meters/second (m/s) was estimated for the top 100 feet of soil at the site, which corresponds to a Soil Profile Type D.
Plate 4 - Design Acceleration Response Spectrum shows the recommended five-percent damped design spectra estimated from ARS Online analysis. In accordance with Caltrans guidelines, the design ARS curve is taken as the upper envelope of the deterministic and probabilistic ARS curves. As shown on Plate 4, the design ARS curve is controlled by the deterministic spectra for the San Luis (So. Margin) and Los Osos faults. The estimated peak ground acceleration (PGA) for the bridge site is approximately 0.69g. The site response for periods less than about 0.35 second is controlled by a magnitude M6.9 earthquake on the Los Osos fault, mapped approximately 3 miles east of the site. The site response for periods greater than about

QUINCY ENGINEERING, INC. BRIDGE STREET BRIDGE REHABILITATION ARROYO GRANDE, CALIFORNIA
Fugro Project No. 04.62120100 May 2017 Page 10 of 26
0.35 seconds is controlled by a M7.1 earthquake on the San Luis Range fault system. We note the probabilistic spectrum corresponding to a 5-percent in 50 years probability of exceedance (975-year return period) is defined by a mean magnitude of M6.7 and an estimated peak ground acceleration (PGA) of 0.39g.
According to ARS Online, the Los Osos Fault does not contribute to the maximum spectral values. However, based on correspondence with Caltrans Division of Research and Innovation (personal communication with Tom Shantz, Caltrans Senior Research Engineer, in email dated January 21, 2014), we understand the southwest-dipping fault was mischaracterized by ARS Online as a southeast-dipping fault. Consequently, our development of the design ARS curve considered the Los Osos Fault as a southwest-dipping reverse fault.
A near-fault factor was applied to the ARS curve because the site is located less than 15 miles (25km) from a potentially controlling fault. Application of the adjustment factor consists of a 20 percent increase in spectral acceleration for periods greater than 1 second and is linearly tapered to zero percent increase from a period of 1 second to 0.5 seconds.
4.2 Ground Surface Fault Rupture
The closest active fault mapped by Holland (2013) is the Wilmar Avenue fault of the San Luis Range (Southern Margin) fault system, which trends northwest-southeast approximately 800 feet southwest of the site. According to the County of San Luis Obispo (1999) and PG&E (2015), the Wilmar Avenue fault should be characterized as potentially active because the fault displaces late Pleistocene marine terrace deposits interpreted to be approximately 120,000 years old.
In our opinion, there is a low potential for fault rupture to impact the proposed bridge site and ground surface rupture does not need to be considered for the design of this project.
4.3 Landslides and Slope Instability
Although we were unable to assess the bridge and channel conditions from within the channel, the adjacent channel slopes do not show distress or visual signs of instability. As noted above, a partially collapsed and undermined concrete retaining wall appears to be located along portions of the south bank of the creek upstream of the bridge, and the stream channel beneath and downstream of the bridge is heavily vegetated with blackberries, vines and some trees. However, there is no evidence of landsliding or global slope instability near the bridge site.
Quincy (2016) indicates that proposed abutment slopes will be constructed up to approximately 35 feet high and at inclinations of 1.5H:1V or flatter. The slopes will be lined with filter fabric and protected with approximately 6.1 feet of Rock Slope Protection (RSP) consisting of backing material and 1/2-ton rock. Static global slope stability of the proposed embankment slope geometry yields a factor of safety greater than 1.5 and is considered acceptable. Proposed RSP will help mitigate the potential for erosion, surficial slope instability and scour.

QUINCY ENGINEERING, INC. BRIDGE STREET BRIDGE REHABILITATION ARROYO GRANDE, CALIFORNIA
Fugro Project No. 04.62120100 May 2017 Page 11 of 26
4.4 Liquefaction and Seismic Settlement
Seismically induced liquefaction is a phenomenon that commonly affects loose, granular materials below the groundwater table. Seismic shaking causes transient shear stresses in the soil deposits, which in turn result in partial densification of the loose materials. As the saturated materials densify, pore water pressures can increase causing the effective shear strength of the soil to reduce. If pore pressures build to a significant level during or shortly after an earthquake event, the soil may begin to behave like a viscous fluid and result in lateral ground movement. In addition, pore pressure dissipation following the earthquake shaking may be accompanied by consolidation, which can cause ground settlement. Liquefaction potential of the soils was evaluated in accordance with the procedures described in the 1997 NCEER guidelines (Youd and Idriss, 2001).
Settlement from earthquake ground shaking can also occur in uncemented, granular soils above the groundwater. Because the soils are not saturated, the soils are not susceptible to liquefaction and settlement occurs from shaking-induced densification. Descriptions of the settlement caused by the densification of granular soils and the procedures we used to evaluate the potential magnitude of settlement that could occur are provided in Tokimatsu and Seed (1987) and Pradel (1998).
4.4.1 Evaluation
Liquefaction and seismic settlement hazards were evaluated for the site considering the 975-year return period earthquake, defined as a M6.7 event with a PGA of 0.39g. Groundwater was encountered in the area of the proposed bridge between about EL. 70 feet and EL. 82 feet during our March 2017, July 2015 and the ESP (2004) field exploration programs. This depth appeared to be near or slightly above the water level observed in the channel during our field exploration. A groundwater depth of 27 feet below the existing ground surface, corresponding to EL. 85 feet, was assumed for our liquefaction analyses of blow count data from boring DH-101 and the ESP (2004) borings.
4.4.2 Potential Design Impacts from Liquefaction and Seismic Settlement
Based on our analysis, the very loose to medium dense sandy artificial fill and shallow alluvial materials encountered, in boring DH-101 and the ESP (2004) borings, to a depth of about 15 feet below the ground surface are potentially liquefiable. However, those soils are located above the design groundwater elevation and therefore not susceptible to liquefaction. Although those shallow soils are not susceptible to liquefaction, the materials may be susceptible to seismic settlement or compression. Using the procedures outlined in Pradel (2008), we estimate that up to approximately ½-inch of seismically-induced settlement could occur within those unsaturated upper alluvial soils in response to the design earthquake. However, we anticipate some or all of those materials will be removed and replaced with engineered fill as part of the bridge rehabilitation project, which should reduce the potential for seismic settlement.
The alluvium and Paso Robles Formation encountered below a depth of about 15 feet were composed of predominantly medium stiff to hard clay deposits and dense to very dense sands and gravels that are not considered to be vulnerable to liquefaction or seismic settlement. Therefore, potential downdrag loads from liquefaction and lateral loading were neglected in our calculations for the specified pile tip elevations.

QUINCY ENGINEERING, INC. BRIDGE STREET BRIDGE REHABILITATION ARROYO GRANDE, CALIFORNIA
Fugro Project No. 04.62120100 May 2017 Page 12 of 26
4.5 Geologic Profiles and Engineering Parameters
Plate 5 - Geotechnical Properties for Analyses presents summary tables of the geotechnical engineering parameters used in our geotechnical analyses. Geotechnical engineering properties were assigned to units within the subsurface profile for use in evaluating the axial and lateral load capacity of CIDH pile foundations for the bridge rehabilitation. Soil unit weights and shear strength parameters have been estimated based on the results of laboratory tests and engineering judgment.

QUINCY ENGINEERING, INC. BRIDGE STREET BRIDGE REHABILITATION ARROYO GRANDE, CALIFORNIA
Fugro Project No. 04.62120100 May 2017 Page 13 of 26
5. CONCLUSIONS AND RECOMMENDATIONS
5.1 Summary of Findings
■ The existing bridge was retrofitted with a supplemental steel truss constructed beneath the north span in or about 1990. The supplemental truss was supported on the existing abutments and pier wall; no foundation improvements were made as part of the project. The bridge inspection reports do not describe the foundation system for the bridge, and we were not able to locate (nor were we provided) as-built subsurface information for the existing bridge.
■ The site subsurface is variable and composed of artificial fill overlying alluvium and Paso Robles Formation materials. The alluvium is composed of medium dense to dense coarse-grained soils, and medium stiff to stiff fine-grained soils. The Paso Robles Formation materials consisted of dense to very dense predominantly gravelly and sandy soils. A hard clay unit was encountered in boring DH-101 at the north abutment at an elevation of about EL. 29 feet to the termination depth of the boring at about EL. -19-1/2 feet. The hard clay unit was not encountered in the ESP (2004) borings to the maximum depth explored by ESP (2004), corresponding to EL. 35 feet. In addition, the Caltrans LOTB for Highway 101 at Arroyo Grande Creek (Caltrans 1957) suggests that similar hard clay materials were not encountered in those explorations.
■ Design subsurface profiles at the north abutment and center pier were primarily developed using the data obtained from boring DH-101, but also considered data from the ESP (2004) borings. The design subsurface profile at the south abutment was primarily developed using the data obtained from the ESP (2004) borings.
■ On the basis of the 65-percent foundation plan (Quincy, 2016) and correspondence with Quincy Engineering, we understand the rehabilitated bridge will be supported on CIDH pile elements deriving frictional resistance from the fine-grained alluvium and Paso Robles Formation materials at the site.
■ Our evaluations included axial and lateral capacity of 36-inch and 48-inch diameter cast-in-drill hole piles at the abutments and an 84-inch diameter CIDH pile at the center pier.
■ Groundwater was encountered in explorations performed by Fugro in 2015 and 2017 and Earth Systems Pacific in 2004 at depths ranging from about 23-1/2 feet to 40-1/2 feet below the ground surface. Groundwater and seepage should be expected during construction and drilling of the CIDH piles.
■ For the purposes of our liquefaction and foundation analyses, groundwater was assumed to be present at an elevation of about EL. 85 feet. We expect that wet placement methods will be needed to construct the CIDH piles, and that the potential for post-installation anomalies should be anticipated.
■ CIDH pile construction should assume “wet hole” conditions. The need for temporary casing and/or use of the slurry displacement methods consistent with Caltrans Standard Specifications should be anticipated to control caving of the sidewalls and to reduce water seepage into the excavation. Based on the anticipated conditions, the length of the temporary casing may be terminated once it is embedded at least 3 feet into the hard claystone encountered at EL. 29 feet in exploratory boring, DH-101, unless caving and water seepage cannot be controlled within the uncased section. Casing advanced drilling equipment or oscillating casing systems should be strongly considered for this project.
■ Permanent casing is not allowed for abutment piles because their capacity is provided by sidewall friction developed between the pile cut-off elevation and the SPTE. Although sidewall friction is also providing capacity for Pier 2, Caltrans requires that permanent casing extend at least 5 feet below a

QUINCY ENGINEERING, INC. BRIDGE STREET BRIDGE REHABILITATION ARROYO GRANDE, CALIFORNIA
Fugro Project No. 04.62120100 May 2017 Page 14 of 26
proposed construction joint. To accommodate that requirement, permanent casing may be used at Pier 2 but it shall only extend 5 feet below the construction joint. Further, it shall consist of corrugated metal pipe (CMP) that is set in an oversized drilled hole. The annular space between pile cutoff to provide adequate load transfer between the pile and excavation. The grout shall be placed under pressure with grout tubes from the bottom of the casing to fill any voids in the annular space.
■ Hard claystone anticipated below EL. 29 feet may become smeared and smooth during drilling resulting in a reduction of the frictional capacity assumed in the design for that geologic unit. The portion of shaft sidewalls exposed below EL. 29 feet or below the bottom of the temporary casing and within the hard clay/claystone should be scored and roughened prior to placing reinforcing steel and concrete.
5.2 Foundation Types
Several foundation types were reviewed and considered for this project including shallow foundations, driven piles, cast-in-steel shell (CISS) piles, and drilled shafts. A discussion of those foundation types and their suitability for this project were provided in Fugro’s Preliminary Foundation Report (Fugro, 2012).
5.3 Foundation Design
We understand the City of Arroyo Grande and the project team have selected CIDH piles as the preferred foundation system for the Bridge Street Bridge Rehabilitation. We consider the proposed CIDH piles feasible from a geotechnical standpoint. Design and construction of CIDH piles will need to consider relatively shallow groundwater within the drilled shaft excavation and the potential for caving of the drilled holes. Wet construction methods will be required and we recommend that temporary casing and drill slurry be used during excavation of the drilled holes. We strongly encourage the City and project team to consider specifying the use of a casing advanced drilling system to construct the foundations. In addition, quality assurance integrity testing of the constructed CIDH piles should be performed.
The following sections provide the results of our evaluations for axial and lateral capacity based on our field and laboratory testing program, and the foundation design data sheet and 65-percent foundation plan prepared by Quincy Engineering (2016).
Abutment 1 at the north end of the bridge will be supported by a single row of four, 48-inch diameter CIDH piles. The southern abutment (abutment 3) will be supported by a single row of five, 36-inch diameter CIDH piles. At pier 2, the foundation will consist of a single 84 inch-diameter CIDH pile. Rock slope protection will be placed at the abutments to counteract local scour impacts. The following foundation data table was provided by Quincy, dated December 15, 2016.

QUINCY ENGINEERING, INC. BRIDGE STREET BRIDGE REHABILITATION ARROYO GRANDE, CALIFORNIA
Fugro Project No. 04.62120100 May 2017 Page 15 of 26
Table 3. Foundation Data Table
Support No.
Design Method Pile Type
Approx. Finished Grade
(ft)
Approx. Cut-Off Elevation
(ft)
Pile Cap Size No of Piles per support B (ft) L (ft)
Abut 1 LRFD 48” Dia. CIDH 112.33 93.42 5 36.2 4
Pier 2 LRFD 60” Dia. Column to 84” Dia. CIDH 83.00 78.90 6.5 35 1
Abut 3 LRFD 36” Dia. CIDH 110.95 97.42 3.5 36.2 5
5.3.1 Axial Capacity of CIDH Piles
We evaluated the axial capacity of the proposed foundations based on the pile types and cut-off elevations provided above in Table 3. The nominal resistance (ultimate geotechnical capacity) of the proposed CIDH pile sizes were evaluated using the methods presented in Caltrans Memo to Designers 3-1, dated June 2014 and the computer program SHAFTv6.0 (ENSOFT, 2012a).
In accordance with Caltrans (2014a), Caltrans Amendments (2014b) and the AASHTO Load Resistance Factor Design (LRFD) Bridge Design Specifications (AASHTO, 2012), foundations for bridge abutments and bents/piers should be designed using Strength Limit State loads and LRFD methods. The nominal resistance of the pile and the estimated tip elevation is provided in Table 5 and is based on the minimum embedment into the alluvium and Paso Robles Formation needed to achieve the nominal resistance equal to the structural load and applied group efficiency and resistance factors. End bearing was not considered in the evaluation of nominal resistance.
The axial capacity evaluation did not include an assessment of the Extreme Event Limit State because Quincy did not provide the structural demand for that load case and it is our understanding that the Strength 2 Limit Strength loading conditions control the design. The granular soils at the site are generally dense to very dense and on a preliminary basis do not appear to be susceptible to liquefaction. Therefore, we have not considered downdrag loads from liquefaction in our assessment of axial capacity.
5.3.2 Lateral Pile Capacity
We evaluated the lateral pile load carrying capacity of the CIDH piles using the computer program LPILE Plus v6.35 (ENSOFT, 2012b), which uses a soil resistance - pile deflection model (p-y analysis) to estimate pile deflections and moment and shear forces in the pile. We used the program to estimate the lateral load at the pile head, maximum shear, maximum moment, and critical length of a single fixed and free head pile for pile head displacements of 0.25 and 1.0 inch.
For our LPILE analyses, the scour conditions provided by Quincy controlled design for the center pier. We assumed lateral loads are applied at the cut-off elevations provided by Quincy (2016b), that the soils surrounding the center pier are removed by scour to the design scour elevations and that level ground conditions exist at the scour elevations. Our LPILE analyses considered a “round concrete shaft (Bored pile)” Section type with a steel percentage of approximately 1.3 percent. We assumed an axial load per pile
QUINCY ENGINEERING, INC. BRIDGE STREET BRIDGE REHABILITATION ARROYO GRANDE, CALIFORNIA
Fugro Project No. 04.62120100 May 2017 Page 16 of 26
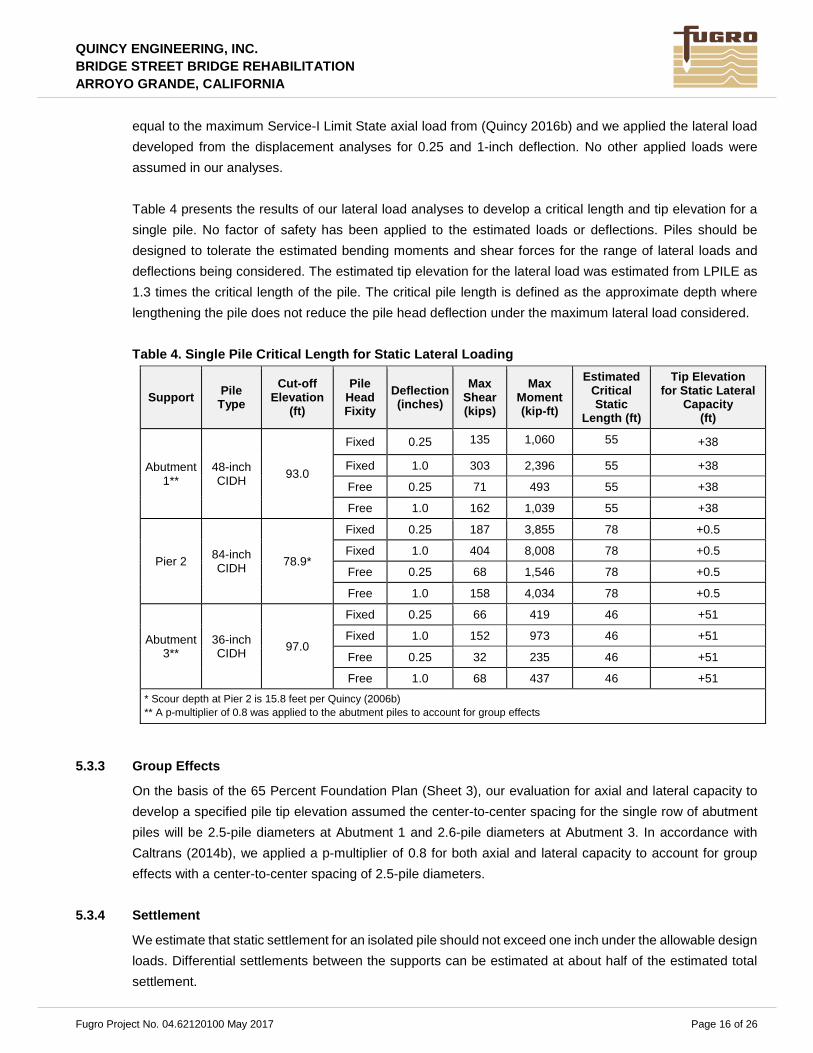
equal to the maximum Service-I Limit State axial load from (Quincy 2016b) and we applied the lateral load developed from the displacement analyses for 0.25 and 1-inch deflection. No other applied loads were assumed in our analyses.
Table 4 presents the results of our lateral load analyses to develop a critical length and tip elevation for a single pile. No factor of safety has been applied to the estimated loads or deflections. Piles should be designed to tolerate the estimated bending moments and shear forces for the range of lateral loads and deflections being considered. The estimated tip elevation for the lateral load was estimated from LPILE as 1.3 times the critical length of the pile. The critical pile length is defined as the approximate depth where lengthening the pile does not reduce the pile head deflection under the maximum lateral load considered.
Table 4. Single Pile Critical Length for Static Lateral Loading
Support Pile Type
Cut-off Elevation
(ft)
Pile Head Fixity
Deflection (inches)
Max Shear (kips)
Max Moment (kip-ft)
Estimated Critical Static
Length (ft)
Tip Elevation for Static Lateral
Capacity (ft)
Abutment 1**
48-inch CIDH 93.0
Fixed 0.25 135 1,060 55 +38
Fixed 1.0 303 2,396 55 +38
Free 0.25 71 493 55 +38
Free 1.0 162 1,039 55 +38
Pier 2 84-inch CIDH 78.9*
Fixed 0.25 187 3,855 78 +0.5
Fixed 1.0 404 8,008 78 +0.5
Free 0.25 68 1,546 78 +0.5
Free 1.0 158 4,034 78 +0.5
Abutment 3**
36-inch CIDH 97.0
Fixed 0.25 66 419 46 +51
Fixed 1.0 152 973 46 +51
Free 0.25 32 235 46 +51
Free 1.0 68 437 46 +51 * Scour depth at Pier 2 is 15.8 feet per Quincy (2006b) ** A p-multiplier of 0.8 was applied to the abutment piles to account for group effects
5.3.3 Group Effects
On the basis of the 65 Percent Foundation Plan (Sheet 3), our evaluation for axial and lateral capacity to develop a specified pile tip elevation assumed the center-to-center spacing for the single row of abutment piles will be 2.5-pile diameters at Abutment 1 and 2.6-pile diameters at Abutment 3. In accordance with Caltrans (2014b), we applied a p-multiplier of 0.8 for both axial and lateral capacity to account for group effects with a center-to-center spacing of 2.5-pile diameters.
5.3.4 Settlement
We estimate that static settlement for an isolated pile should not exceed one inch under the allowable design loads. Differential settlements between the supports can be estimated at about half of the estimated total settlement.
QUINCY ENGINEERING, INC. BRIDGE STREET BRIDGE REHABILITATION ARROYO GRANDE, CALIFORNIA
Fugro Project No. 04.62120100 May 2017 Page 17 of 26
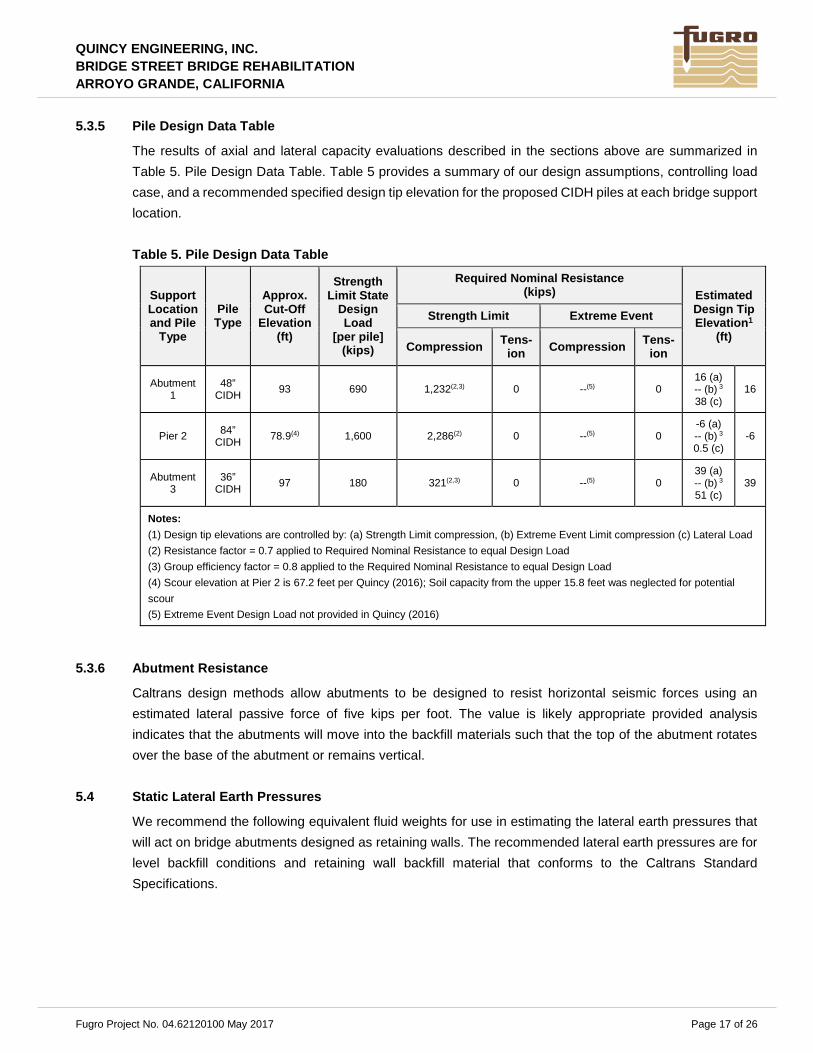
5.3.5 Pile Design Data Table
The results of axial and lateral capacity evaluations described in the sections above are summarized in Table 5. Pile Design Data Table. Table 5 provides a summary of our design assumptions, controlling load case, and a recommended specified design tip elevation for the proposed CIDH piles at each bridge support location.
Table 5. Pile Design Data Table
Support Location and Pile
Type
Pile Type
Approx. Cut-Off
Elevation (ft)
Strength Limit State
Design Load
[per pile] (kips)
Required Nominal Resistance (kips) Estimated
Design Tip Elevation1
(ft) Strength Limit Extreme Event
Compression Tens-ion Compression Tens-
ion
Abutment 1
48” CIDH 93 690 1,232(2,3) 0 --(5) 0
16 (a) -- (b) 3 38 (c)
16
Pier 2 84” CIDH 78.9(4) 1,600 2,286(2) 0 --(5) 0
-6 (a) -- (b) 3 0.5 (c)
-6
Abutment 3
36” CIDH 97 180 321(2,3) 0 --(5) 0
39 (a) -- (b) 3 51 (c)
39
Notes: (1) Design tip elevations are controlled by: (a) Strength Limit compression, (b) Extreme Event Limit compression (c) Lateral Load (2) Resistance factor = 0.7 applied to Required Nominal Resistance to equal Design Load (3) Group efficiency factor = 0.8 applied to the Required Nominal Resistance to equal Design Load (4) Scour elevation at Pier 2 is 67.2 feet per Quincy (2016); Soil capacity from the upper 15.8 feet was neglected for potential scour (5) Extreme Event Design Load not provided in Quincy (2016)
5.3.6 Abutment Resistance
Caltrans design methods allow abutments to be designed to resist horizontal seismic forces using an estimated lateral passive force of five kips per foot. The value is likely appropriate provided analysis indicates that the abutments will move into the backfill materials such that the top of the abutment rotates over the base of the abutment or remains vertical.
5.4 Static Lateral Earth Pressures
We recommend the following equivalent fluid weights for use in estimating the lateral earth pressures that will act on bridge abutments designed as retaining walls. The recommended lateral earth pressures are for level backfill conditions and retaining wall backfill material that conforms to the Caltrans Standard Specifications.

QUINCY ENGINEERING, INC. BRIDGE STREET BRIDGE REHABILITATION ARROYO GRANDE, CALIFORNIA
Fugro Project No. 04.62120100 May 2017 Page 18 of 26
Table 6. Lateral Earth Pressures
Wall Loading Condition Lateral Earth Pressure Condition
Equivalent Fluid Weight (pcf)
Unbraced - Drained cantilever wall with level backslope and wall is free to rotate Active 35
Braced - Drained with level backslope and wall is not free to rotate At-rest 55
Unbraced - Undrained cantilever wall with level backslope and wall is free to rotate Active 80
Braced - Undrained with level backslope and wall is not free to rotate At-rest 90
The recommended equivalent fluid weights are provided for drained or undrained backfill conditions. The undrained equivalent fluid weights should be used when considering hydrostatic forces resulting from submerged conditions (i.e., standing water in the backfill material). The equivalent fluid weights do not provide for surcharge loads acting on the backfill. Surcharge traffic loads can be represented by the lateral earth pressures that result from an equivalent 2-foot soil surcharge with a total soil unit weight of 120 pounds per cubic foot (pcf). If surcharge loading from adjacent foundation loads are to be considered, then Fugro should be advised so that we can provide additional recommendations as needed.
5.5 Dynamic Earth Pressures
Dynamic earth pressures were estimated using the Mononobe Okabe approach with a reduced value of kh taken as a percentage of the design horizontal ground acceleration. AASHTO (2012) suggests using a horizontal seismic coefficient equal to about 50 percent of the peak ground acceleration. Based on a kh of 0.35g (about 50 percent of the peak horizontal ground acceleration of 0.69g), the additional force on the wall from earthquake loading is estimated to be about 27H2 (pounds per lateral foot of wall) where H is the wall height in feet. The distribution of seismic pressure can be assumed to be triangular and the resultant can be assumed to act at H/3. The dynamic lateral force increment should be considered as an additional load above the resultant static earth pressure.
5.6 Corrosion Considerations
Corrosion test results are summarized on Plate B-1 and in the table below. For this project, we performed corrosivity tests on samples of artificial fill, alluvium and Paso Robles Formation materials collected from boring DH-101 at the north abutment. According to Caltrans (2012a, 2014b) a site is considered to be corrosive if one or more of the following conditions exist:
■ The pH is 5.5 or less. ■ The soil has a minimal resistivity value of 1,000 ohm-cm or less. ■ Chloride concentration is 500 ppm or greater. ■ Sulfate concentration is 2,000 ppm or greater.

QUINCY ENGINEERING, INC. BRIDGE STREET BRIDGE REHABILITATION ARROYO GRANDE, CALIFORNIA
Fugro Project No. 04.62120100 May 2017 Page 19 of 26
In general, the fill, alluvium and Paso Robles Formation materials tested for this project do not meet the Caltrans criteria for a corrosive environment and in our opinion can be considered non-corrosive toward concrete and steel. We note ESP (2004) reported the results of corrosion tests performed on selected soil samples and those test results also suggest the soils tested would not be considered corrosive towards concrete and steel. Therefore, reinforced concrete piles and substructures can be designed using the minimum cement types and water-cement ratios in accordance with the Standard Specifications.
Most metals are subject to corrosion associated with oxidation. Therefore, metal piping and exposed steel should be designed with appropriate losses for corrosion, coatings or cathodic protection as needed. If needed, a corrosion engineer should be consulted to provide recommendations for test points, cathodic protection or coatings that may be needed for design. We recommend imported backfill material be tested for corrosion potential prior to use on the project.
Table 7. Results of Corrosion Analyses
Boring Depth (feet) Material pH
Chloride Content (ppm)
Sulfate Content (ppm)
Minimum Resistivity (ohm-cm)
DH-101 2.5 Artificial Fill: Clayey SAND (SC) 7.9 7 49 3,900
DH-101 24.0 Alluvium: Poorly-graded SAND with clay and gravel (SP-SC) 8.1 5 31 6,000
DH-101 64.0 Paso Robles Formation: Silty SAND with gravel (SM) 7.5 67 271 1,703
5.7 Roadway Approaches
Site preparation and fill placement for the roadway approaches should be performed according to Section 16, Clearing and Grubbing, and Section 19, Earthwork, of the Caltrans Standard Specifications (Caltrans, 2015b). The recommendations presented below are intended to provide a relatively uniform transition between the approach fill and the proposed structure. In general, approach fill embankments and cut slopes should be designed with a slope inclination of 2H:1V or flatter.
5.7.1 Structure Approach Embankment
The structure approach embankments should be designed according to Topic 670 of the Highway Design Manual (Caltrans, 2012c). Fill materials placed within the structure approach area should be compacted to at least 95-percent relative compaction, except where 90-percent relative compaction is permitted in the outer 5 feet of the embankment.
5.7.2 Use of On-Site Materials
Boring DH-101 and the ESP (2004) borings encountered predominantly silty and clayey sand artificial fill material in the upper 8-1/2 to 10 feet of the soil explored soil profile with fines contents on the order of 26 to 47 percent. Depending on the sand equivalent of those materials, they may not be suitable for use as structure backfill (per Section 19-3.02B of the Caltrans Standard Specifications, 2015b). Quality assurance

QUINCY ENGINEERING, INC. BRIDGE STREET BRIDGE REHABILITATION ARROYO GRANDE, CALIFORNIA
Fugro Project No. 04.62120100 May 2017 Page 20 of 26
acceptance testing should be performed on on-site soils where those soils are proposed for use as structure backfill.
The on-site artificial fill material encountered will likely be suitable for use as local borrow for embankment construction per Caltrans Standard Specifications (2015b).
5.7.3 Approach Fill Settlements
The approaches are anticipated to be constructed near existing site grades, without appreciable addition of embankment fill. Assuming the proposed finished grades are no higher than about two to three feet above existing grade, we expect that the static settlement of the approach fill should be less than about one-inch. In addition, we do not anticipate the CIDH piles will be subjected to downdrag loads from static settlement, and in our opinion, a post-construction waiting period should not be required.
5.8 Pavement Structural Section
One R-value test, which was performed on a sample of the near surface materials at boring DH-101, yielded an R-value of 21. Flexible pavement design sections were estimated using the Caltrans pavement design procedures (Caltrans, 2009) for assumed traffic indices ranging from 5 to 7 assuming an R-value of 21. Recommended preliminary asphalt pavement sections for the access roadway are listed below. R-value tests should be performed during rough grading to confirm that the assumed value of 21 is representative of the as-graded subgrade condition below proposed pavement sections. Imported fill should have an R-value of 21 or greater.
Table 9. Preliminary Asphalt Pavement Sections, R-value: 21
Traffic Index Thickness of Asphalt Concrete (ft)
Thickness of Aggregate Base (ft)
5.0 0.25 0.55
6.0 0.25 0.85
7.0 0.30 1.05
Earthwork and compaction should be performed in accordance with Section 19 of the Caltrans Standard Specifications. Pavement subgrade should consist of compacted materials placed under the observation of the geotechnical professional. If soft or unsuitable soils are exposed in the subgrade for the pavement structural section, stabilization or additional soil removal may be required. Pavement materials should conform to Sections 26 and 39 of the Caltrans Standard Specifications (2015b) (or equivalent) for aggregate base (AB) and hot mix asphalt (HMA), respectively.
5.9 Construction Considerations
5.9.1 Excavation
Materials encountered within the anticipated depth of excavation for the bridge abutments and pier consisted of artificial fill materials, alluvium and minimally-cemented Paso Robles Formation. We anticipate those materials can be excavated with typical heavy construction equipment in good working order. Based on the

QUINCY ENGINEERING, INC. BRIDGE STREET BRIDGE REHABILITATION ARROYO GRANDE, CALIFORNIA
Fugro Project No. 04.62120100 May 2017 Page 21 of 26
conditions encountered in our borings, we do not anticipate adverse geologic structures will be encountered within the anticipated depths of excavation.
5.9.2 Temporary Slopes and Shoring
Temporary slopes should be braced or sloped according to the requirements of OSHA. The contractor should be responsible for job site safety, reviewing the soil conditions encountered during construction, and the design of temporary slopes and shoring systems. Within the expected depth of excavation, the subsurface conditions are anticipated to consist of artificial fill over alluvium and Paso Robles Formation. Based on OSHA guidelines and the anticipated materials to be encountered, temporary slopes should be excavated no steeper than 1.5h:1v or be shored to support Type C soil conditions. It should be noted that driven shoring systems will not be allowed due to site’s proximity to historic buildings and the magnitude of potential vibrations that driven shoring systems could generate.
Temporary slopes should not be considered stable if they will be excavated below the groundwater table or there is a potential for seepage to daylight on the slope face. Dewatering should be performed in advance of excavation if temporary slopes are expected to extend below the water table, and the presence of groundwater should be considered in the design of temporary slopes and shoring.
5.9.3 Groundwater and Dewatering
Groundwater conditions are discussed in Section 3.3 of this report. The depth to groundwater measured in the Fugro and ESP (2004) borings at depths ranged from approximately 23-1/2 to 40-1/2 feet below the existing road surface, corresponding to an elevation range of EL. 70 feet to EL. 82 feet. Groundwater levels are likely influenced by flows in the creek, precipitation/storm runoff, the time of year, irrigation levels, and other factors, and future groundwater levels could be higher than those encountered for this study.
The contractor should be responsible for both designing and maintaining the dewatering system for construction. Dewatering facilities, such as sump pits and wells should be designed by a qualified registered professional and with filters such that sand and fine-grained materials are not removed from the soil during dewatering operations. Dewatering facilities should be installed prior to beginning excavation, and time should be allowed for lowering of the groundwater table before beginning excavation. Shoring systems should be embedded adequately below the base of the excavation to cutoff groundwater and help stabilize the base of the excavation.
5.9.4 CIDH Pile Construction
CIDH piles will extend through predominantly coarse-grained alluvium above the design groundwater elevation and finer grained alluvium and Paso Robles Formation materials at depth. A generalized profile of the subsurface conditions encountered is shown on Plate 3. Excavations for CIDH piles will likely encounter groundwater and soils susceptible to sloughing or caving. Project specifications should indicate that drill casing for the length of the excavation, Caltrans wet construction methods and temporary casing will be required. Additionally, we strongly encourage that a casing advanced type drilling system be considered to install the CIDH piles.

QUINCY ENGINEERING, INC. BRIDGE STREET BRIDGE REHABILITATION ARROYO GRANDE, CALIFORNIA
Fugro Project No. 04.62120100 May 2017 Page 22 of 26
Because of the presence of shallow groundwater and younger alluvial soils at the site, it will be important to maintain a differential head in drilling slurry relative to the groundwater level during construction. The contractor should provide a detailed submittal describing the proposed construction methods, equipment, personnel, sequencing of events, materials, type of slurry, and procedures to monitor and test the condition of the slurry prior to concrete placement. That submittal should be reviewed by the engineer or record prior to mobilization. Procedures for monitoring and testing the slurry should conform to Caltrans requirements. After excavation of a shaft to the design tip elevation, loose or disturbed materials should be removed from the bottom of the pile excavations. The conditions of the drilled hole should be reviewed for stability before placing reinforcing steel and concrete. The concrete should be tremied to displace groundwater (and loose soils) present at the bottom of the hole. If temporary casing is used, the casing should be pulled as the concrete level rises in the drilled shaft. The tremie pipe should remain in the fresh concrete through completion of concrete placement. Improper retrieval of the casing or reinsertion of the tremie pipe can cause necking or contamination of the concrete.
Inspection tubes for gamma-gamma and cross sonic logging (CSL) should be installed by the contractor, and the City of Arroyo Grande should provide for gamma-gamma and CSL testing and evaluation of the completed CIDH piles. Personnel employed to perform and interpret the non-destructive tests should have specific expertise in that type of work.
The contractors' construction submittal should include methods for handling anomalies that are detected from the logging. At the contractors' expense, additional non-destructive logging and/or concrete coring may be performed to confirm or reject detected anomalies. Concrete defects still recognized by the City or the project team after additional testing is performed should be repaired at the contractors' expense or may be deducted from their payment, so long as the design team confirms that the constructed foundation meets all design capacity requirements. Design should consider the potential for irreparable piles and the possibility of replacement or supplemental piles.
We recommend that a geotechnical professional observe the construction of the drilled shaft foundations. The purpose of this observation is to evaluate if the soil conditions encountered and methods of construction are consistent with those assumed for this report. The project specifications should provide for expected variations in the drilling conditions and materials encountered, and for deepening the drilled shaft foundations, if needed.

QUINCY ENGINEERING, INC. BRIDGE STREET BRIDGE REHABILITATION ARROYO GRANDE, CALIFORNIA
Fugro Project No. 04.62120100 May 2017 Page 23 of 26
6. CONTINUATION OF SERVICES
The geotechnical evaluation consists of an ongoing process involving the planning, design and construction phases of the project. To provide this continued service, we recommend that the geotechnical engineer be provided the opportunity to review the project plans and specifications, and observe portions of the construction.
6.1 Review of Plans and Specifications
The geotechnical engineer should review the foundation and grading plans for the project. The purpose of the review is to evaluate if the plans and specifications were prepared in general accordance with the recommendations of this report.
6.2 Geotechnical Observation and Testing
Field exploration and site reconnaissance provides only a limited view of the geotechnical conditions of the site. Substantially more information will be revealed during the excavation and grading phases of the construction. Subsurface conditions, excavations and fill placement should be reviewed by the geotechnical professional during construction to evaluate if the materials encountered during construction are consistent with those assumed for this report.

QUINCY ENGINEERING, INC. BRIDGE STREET BRIDGE REHABILITATION ARROYO GRANDE, CALIFORNIA
Fugro Project No. 04.62120100 May 2017 Page 24 of 26
7. REFERENCES
American Association of State Highway and Transportation Officials [AASHTO] (latest edition), AASHTO LRFD Bridge Specifications, with Caltrans amendments.
California Department of Transportation (Caltrans), Materials Testing Manual (latest edition).
Caltrans (2015a), Foundation Manual, Revision 2, October.
Caltrans (2015b), Standard Specifications.
Caltrans (2014a), Memo to Designers 3-1, Deep Foundations, June.
Caltrans (2014b), California Amendments (to the AASHTO LRFD Bridge Design Specification, 6th Edition).
Caltrans (2013), Seismic Design Criteria, Version 1.7, April 2013, Division of Engineering Services, Structures Design.
Caltrans (2012a), Corrosion Guidelines, Version 2.0, Division of Engineering Services, Materials Engineering and Testing Services, Corrosion and Structural Concrete Field Investigation Branch, November.
Caltrans (2012b), Spreadsheet entitled “Caltrans_Fault_Database_V2b_121312”, at http://dap3.dot.ca.gov/ARS_Online/technical.php, accessed in October 2013.
Caltrans (2012c), Highway Design Manual, dated May 7.
Caltrans (2009), Geotechnical Services Design Manual Version 1.0, dated August 2009.
Caltrans (1939-2011), Bridge Inspection Records, “Bridge Number 19C-0196, Bridge Street, 0.1 MI S. of S.R. 227, Arroyo Grande”, 121 pages of reports dated June 28, 1939 through May 3, 2011.
Caltrans (1957), Log of Test Borings, Arroyo Grande Creek, Bridge 49-175 R/L, Drawing C-4695-9, As-Built Document No. 50000913.
California Geologic Survey (2008), Guidelines for Evaluating and Mitigating Seismic Hazards in California, Special Publication 117A, revised and re-adopted September 11, 2008.
Cao, T., Bryant, W. A., Rowshandel, B., Branum, D., & Wills, C. J., (2002), The Revised 2002 California Probabilistic Seismic Hazard Maps.
County of San Luis Obispo (1999), Safety Element, San Luis Obispo County General Plan, Department of Planning and Building, December.

QUINCY ENGINEERING, INC. BRIDGE STREET BRIDGE REHABILITATION ARROYO GRANDE, CALIFORNIA
Fugro Project No. 04.62120100 May 2017 Page 25 of 26
Earth Systems Pacific [ESP] (2004), Conceptual Soils Engineering Report, Bridge Street Bridge, Bridge Street at Arroyo Grande Creek, Arroyo Grande, California, File No. SL-14066-SA, consultant report prepared for John L. Wallace & Associates, dated March 26, 2004.
Ensoft, Inc. (2012), “Lpile 2012.6.37, a program for analyzing stress and deformation of individual piles or drilled shafts under lateral load”, Austin, Texas.
Ensoft, Inc. (2012), “SHAFT 2012.7.10, a program for analyzing the axial capacity and short-term settlement of drilled shafts under axial load”, Austin, Texas.
Federal Highway Administration [FHWA] (2010), Drilled Shafts: Construction Procedures and LRFD Design Method, Publication No. FHWA-NHI-10-016, NHI Course No. 132014, dated May.
Fred H. Schott & Associates (1989), Plans Entitled “Fabrication and Erection of Supplemental Support System for Bridge Street Bridge, Arroyo Grande, California” Project No. 90-89-2, prepared for the City of Arroyo Grande, dated December 13, 1989. Presented with Caltrans (1939-2011).
Fugro (2015), “Project Memorandum, Preliminary Pile Tip Elevations and Input Parameters for Lateral Loading Analyses, Bridge Street Bridge Replacement, Arroyo Grande, California” Project No. 04.62120100, dated August 11.
Fugro Consultants (2012), Preliminary Foundation Report “Bridge Street Bridge over Arroyo Grande Creek (Bridge No. 49c-0196), Arroyo Grande, California”, Project No. 04.6212.0100, dated November 28.
Holland, Peter J. (2013), Preliminary Geologic Map of Oceano 7.5’ Quadrangle, San Luis Obispo County, California: A Digital Database, Version 1.0. Digital Preparation by Peter J. Holland and Matt D. O’Neal. California Department of Conservation, California Geological Survey, scale 1:24,000.
Hall, C.A., (1973), Geology of the Arroyo Grande 15’ Quadrangle, San Luis Obispo County, California: California Division of Mines and Geology, scale 1:48,000.
Nitchman, S.P., and Slemmons, D.B. (1994), The Wilmar Avenue fault: A late Quaternary reverse faults near Pismo Beach, California: in Alterman, I.B., McMullen, R.B., Cluff, L.S., and Slemmons, D.B. (editors), Seismotectonics of the Central California Coast Range, Geological Society of America Special Paper 292, pp. 103-110.
Pacific Gas and Electric Company (PG&E), (2015), Seismic Source Characterization for the Diablo Canyon Power Plant, San Luis Obispo County, California; report on the results of a SSHAC level 3 study, Rev. A, March. Available online at http://www.pge.com/dcpp-ltsp.

QUINCY ENGINEERING, INC. BRIDGE STREET BRIDGE REHABILITATION ARROYO GRANDE, CALIFORNIA
Fugro Project No. 04.62120100 May 2017 Page 26 of 26
Pradel, D. (1998), "Procedure to Evaluate Earthquake-Induced Settlements in Dry Sandy Soils," Journal of Geotechnical and Geoenvironmental Engineering, Vol. 124, No. 4, April, pp. 364-368 (erratum in the October 1998 issue).
Tokimatsu, K. and Seed, H. B. (1987), "Evaluation of Settlements in Sands Due to Earthquake Shaking," Journal of the Geotechnical Engineering Division, American Society of Civil Engineers, Vol. 113, GT8, pp. 861-878.
Quincy Engineering, Inc. (2016), Foundation Plan, Bridge Street Bridge – Rehabilitation, (Sheet 3 of 31), received December 2016.
Quincy Engineering, Inc. (2016b), Bridge Street Bridge Pile Loads, dated 12/15/16.
Youd, T. L. and Idriss, I.M. (2001), “Liquefaction Resistance of Soils: Summary Report from the 1996 NCEER and 1998 NCEER/NSF Workshops on Evaluation of Liquefaction Resistance of Soils, Co-chairs Youd, T.L. and Idriss, I.M., Journal of Geotechnical and Geoenvironmental Engineering, Vol. 127, No. 10, pp. 817-833.

QUINCY ENGINEERING, INC. BRIDGE STREET BRIDGE REHABILITATION ARROYO GRANDE, CALIFORNIA
Fugro Project No. 04.62120100 Plates
PLATES

_̂Site
Location
5780000
5780000
5790000
5790000
2230
000
2230
000
2240
000
2240
000
2250
000
2250
000
Quincy EngineeringProject No. 04.62120100
VICINITY MAPBridge St. Bridge Rehabilitation
Arroyo Grande, California PLATE 1
Service Layer Credits: Sources: Esri, HERE, DeLorme, USGS, Intermap, increment P Corp.,NRCAN, Esri Japan, METI, Esri China (Hong Kong), Esri (Thailand), MapmyIndia, ©OpenStreetMap contributors, and the GIS User Community
Ü1:48,000
0 4,000 8,0002,000Feet
Y:\J
obdo
cs\0
4_20
12\0
4.62
1201
00_B
ridge
StBr
idge
\GIS
\Out
puts
\201
7_04
_26_
Geo
tech
Rep
ort_
Fina
l\mxd
\Pla
te1_
Vici
nity
Map
.mxd
, 4/2
7/20
17, c
.dea
n

!<
!<
!<
!P
Arroyo Grande Creek
Bridge Street
Olohan Alley
A
A'
B-3
B-2
B-1DH-101
80
80
80
80
80
80
85
85
85
85
85
90
90
90
90
90
90
95
95
95
95
100
100
100
100
100
100
105
105
105
5
105
110110
110
110
110
110
115
5790400
5790400
5790600
5790600
5790800
5790800
2240
600
2240
600
2240
800
2240
800
2241
000
2241
000
Quincy EngineeringProject No. 04.62120100
EXPLORATION LOCATION MAPBridge St. Bridge Rehabilitation
Arroyo Grande, California
PLATE 2
Ü0 60 12030
Feet
1:600
Legend
Topography Contours
!P Approximate Fugro 2015 Boring Location
!< Approximate Earth Systems Pacific2004 Boring Location
Major Contour
Minor Contour
Base Map
Cross Section Location
Service Layer Credits: Source: Esri, DigitalGlobe, GeoEye, EarthstarGeographics, CNES/Airbus DS, USDA, USGS, AEX, Getmapping, Aerogrid,IGN, IGP, swisstopo, and the GIS User Community
Y:\J
obdo
cs\0
4_20
12\0
4.62
1201
00_B
ridge
StBr
idge
\GIS
\Out
puts
\201
7_04
_26_
Geo
tech
Rep
ort_
Fina
l\mxd
\Pla
te2_
Expl
_Pla
n.m
xd, 4
/27/
2017
, c.d
ean

@@@@
@@
@@
@@
@@@@ @@ @@@@ @@ @@ @@ @@ @@ @@ @@ @@ @@
@@
@@ @@ @@ @@ @@
@@ @@@@
@@@@
@@@@
@@@@ @@
@@@@ @@
!P!<!<
!<
-20
0
20
40
60
80
100
-20
0
20
40
60
80
100
00+00 0+20 0+40 0+60 0+80 1+00 1+20 1+40 1+60 1+80 2+00
ELEV
ATIO
N (F
EET)
ELEV
ATIO
N (F
EET)
DISTANCE (FEET)
AN31W
A'S31E
DH
-101
7 ft,
Eas
t
B-1
6 ft,
Wes
t
B-2
5 ft,
Wes
t
B-3
4 ft,
Wes
t
<11><7>4
<6>12
<24>
33
<32>
22
<10>
<49>
<93/11.5">
<38>
<42>
<35>
<48>
<45>
<Ref/5">
<50/5">
38
<50/4">
<92/12"><46>
<88/10.5">
42
<85/9">
60
70
<16>
<14>
8
30
58
<36>
12
<52>
37
80
54
<8>
<28>
40
<36>
22
23
<50/5">
66
50/4.5"
<12>
<50/6">
50/5"
<19>
13
50/5"
<18>
50/6"
83
50/5"
80
Arroyo Grande Creek Channel
Qal 3
Qpr
Qal 3
Qal 2
Qal 2
af/Qal 1
af/Qal 1
Design Water Elevation (El. +85)80 80
CROSS SECTION A-A'Bridge Street Bridge Rehabilitation
Arroyo Grande, California
PLATE 3
Subsurface profile is interpolated between points of exploration and will vary from that shown.
See text and logs for additional description and data concerning subsurface conditions.
All locations and information are approximate.
Boring Legend
20 SPT Blow Counts
80 Final Water Levels
<32>CA Liner Blow Counts Convertedto Equivalent Blow Count
Lean CLAY (CL)
Silty CLAY (CL-ML)
! !
! !
Lean CLAY with Sand (CL)
! ! !
! ! !
! ! !
Sandy Lean Clay (CL)
Fat CLAY (CH)
! ! ! ! ! !
! ! ! ! ! !
! ! ! ! ! !
! ! ! ! ! !
Sandy SILT (ML)
! ! ! ! ! !
! ! ! ! ! !
! ! ! ! ! !
! ! ! ! ! !
! ! ! ! ! !
! ! ! ! ! !
! ! ! ! ! !
! ! ! ! ! !
! ! ! ! ! !
! ! ! ! ! !
Poorly-Graded SAND (SP)
! ! ! ! ! !
! ! ! ! ! !
! ! ! ! ! !
! ! ! ! ! !
! ! ! ! ! !
! ! ! ! ! !
! ! ! ! ! !
! ! ! ! ! !
! ! ! ! ! !
! ! ! ! ! !
Poorly-Graded SAND with Clay (SP-SC)
Well-Graded SAND (SW)
Well-Graded SAND with Clay (SW-SC)
Clayey SAND (SC)
Clayey to Silty SAND (SC-SM)
Silty SAND (SM)
! ! !
! ! !
! ! !
! ! !
! ! !
Poorly-Graded GRAVEL with Clay (GP-GC)
Well-Graded GRAVEL with Clay (GW-GC)
! ! ! ! !
! ! ! ! !
! ! ! ! !
! ! ! ! !
Sandy Well-Graded GRAVEL (GW)
Asphaltic Concrete
20 ft
20 ftVertical Exaggeration = 1.0X
Quincy EngineeringProject No. 04.62120100
Notes
af/Qal 1- Artificial Fill/Alluvium- very loose to medium dense clayey and silty sandwith layers of sandy lean clay
Qal 2- Alluvium- medium dense sand, silty sand and clayey sand with little to somegravel, cobbles, occasional very stiff to hard clay layers
Qal 3- Alluvium- medium stiff to stiff lean to fat clay
Qpr- Paso Robles Formation- dense to very dense poorly to well graded gravel with sand and clay, occasional cobbles and boulders. hard clay encountered below El. 20 feet.
Geology Legend
Y:\J
obdo
cs\0
4_20
12\0
4.62
1201
00_B
ridge
StBr
idge
\GIS
\Out
puts
\201
7_04
_26_
Geo
tech
Rep
ort_
Fina
l\mxd
\Pla
te3_
Prof
A.m
xd, 4
/27/
2017
, c.d
ean
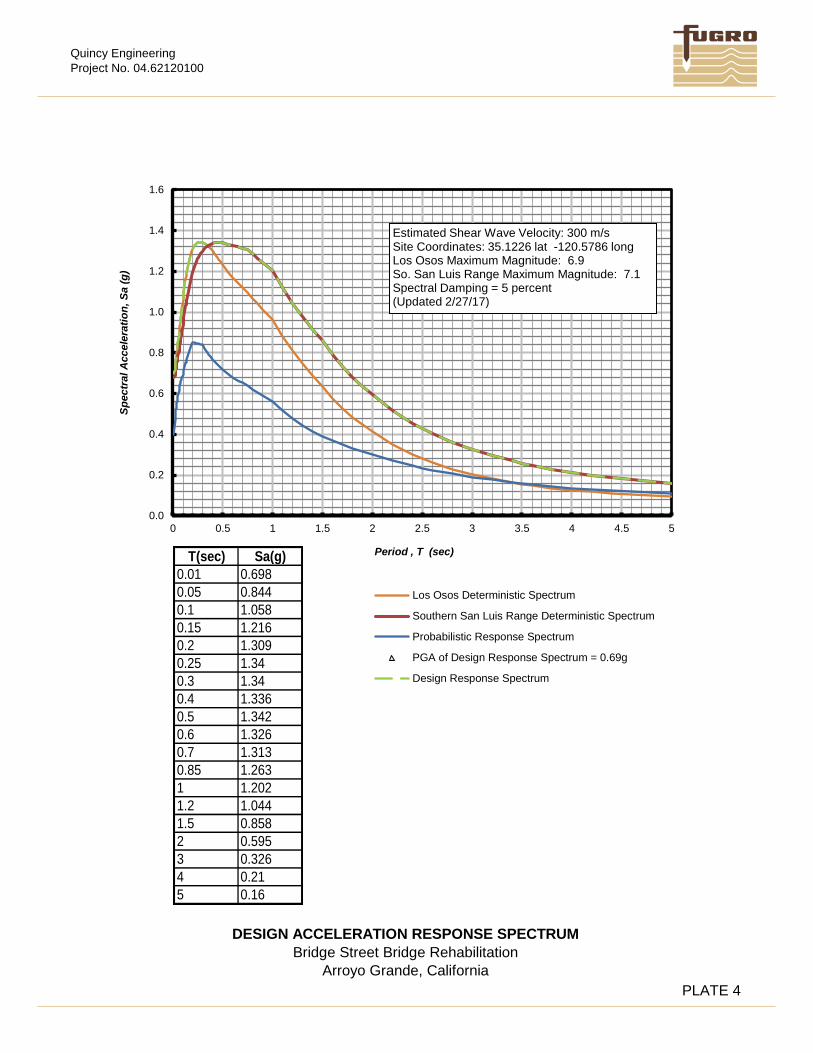
Quincy EngineeringProject No. 04.62120100
DESIGN ACCELERATION RESPONSE SPECTRUMBridge Street Bridge Rehabilitation
Arroyo Grande, California
0.0
0.2
0.4
0.6
0.8
1.0
1.2
1.4
1.6
0 0.5 1 1.5 2 2.5 3 3.5 4 4.5 5
Spec
tral
Acc
eler
atio
n, S
a (g
)
Period , T (sec)
Los Osos Deterministic Spectrum
Southern San Luis Range Deterministic Spectrum
Probabilistic Response Spectrum
PGA of Design Response Spectrum = 0.69g
Design Response Spectrum
Estimated Shear Wave Velocity: 300 m/sSite Coordinates: 35.1226 lat -120.5786 longLos Osos Maximum Magnitude: 6.9So. San Luis Range Maximum Magnitude: 7.1Spectral Damping = 5 percent(Updated 2/27/17)
T(sec) Sa(g)0.01 0.6980.05 0.8440.1 1.0580.15 1.2160.2 1.3090.25 1.340.3 1.340.4 1.3360.5 1.3420.6 1.3260.7 1.3130.85 1.2631 1.2021.2 1.0441.5 0.8582 0.5953 0.3264 0.215 0.16
PLATE 4

Quincy EngineeringProject No. 04.62120100
GEOTECHNICAL PROPERTIES FOR ANALYSESBridge Street Bridge Rehabilitation
Arroyo Grande, CaliforniaPLATE 5
Worksheet: Geotechnical Properties For AnalysesClient: Quincy Engineering Project No. 4.62120100Job Name: Bridge Street Bridge RehabilitationEngineer: LBDate: 4/28/17
Notes: Scour estimate provided by Quincy Lpile analyses utilized default values for ks and E50
NORTH ABUTMENT (DH-101, B-1 [ESP,2004])
Existing Ground el: 112.0 feetPile Cutoff el. 93.0 feetExisting Streambed 77.0 feetEstimated Scour el. 93.0 feetDesign GW el. 85.0 feet
Elevation Interval (feet)
Depth below Ground
Depth below Scour
Depth below Footing: Predominant Material Type within Unit Unit Weight Eff. Unit Wt. Blowcounts Friction
Angle Cohesion
(top/bottom) (feet) (feet) (feet) (pcf) (pcf) N60 (degrees) (psf)
112 0 --- -19
102 10 --- -9
102 10 --- -9
83 29 10 10
83 29 10 10
74 38 19 19
74 38 19 19
28 84 65 65
28 84 65 65
-19 131 112 112
SOUTH ABUTMENT (B-2 [ESP, 2004])
Existing Ground el: 110.0 feetPile Cutoff el. 97.0 feetExisting Streambed 77.0 feetEstimated Scour el. 97.0 feetDesign GW el. 85.0 feet
Elevation Interval (feet)
Depth below Ground
Depth below Scour
Depth below Footing: Predominant Material Type within Unit Unit Weight Eff. Unit Wt. Blowcounts Friction
Angle Cohesion
(top/bottom) (feet) (feet) (feet) (pcf) (pcf) NField (degrees) (psf)
110 0 --- -13
86 24 11 11
86 24 11 11
77 33 20 20
77 33 20 20
44 66 53 53
44 66 53 53
33 77 64 64
CENTER PIER (B-3 [ESP, 2004])
Existing Ground el: 94.0 feetPile Cutoff el. 79.0 feetExisting Streambed 77.0 feetScour elevation (estimated) 67.2 feetConstruction Joint elevation (estimated)Design GW el. 85.0 feet
Elevation Interval (feet)
Depth below Ground
Depth below Scour
Depth below Footing: Predominant Material Type within Unit Unit Weight Eff. Unit Wt. Blowcounts Friction
Angle Cohesion
(top/bottom) (feet) (feet) (feet) (pcf) (pcf) NField (degrees) (psf)
94 0 --- -15
89 5 --- -10
89 5 --- -10
75.5 18.5 --- 3.5
75.5 18.5 --- 3.5
50 44 17.2 29
50 44 17.2 29
28 66 39.2 51
28 66 39.2 51
-- -- -- --
600
--
4700
--
Medium Dense to Dense Sand with Gravel (modeled as API Sand in LPILE and Sand in
SHAFT)110 48 50+ 35 --
--
--
600
--
4700
Qal2Dense to Very Dense Sand with Gravel
(modeled as API Sand in LPILE and Sand in SHAFT)
100 38 35 --
14
17 to 50+ --
50+
50+
50+
50+
9 to 48
--
35
--
--
600
af/Qal1 Stiff Sandy Lean Clay 105 43
Qpr
Dense to Very Dense Sand with Gravel (modeled as API Sand in LPILE and Sand in
SHAFT)100 38
38
Geologic Unit
Geologic Unit
Qal3 Medium Stiff to Stiff Lean/Fat Clay(modeled as Soft Clay in LPILE and Clay in SHAFT)
af/Qal1
22 to 50+
50+
7 to 13
15 to 29
13 to 45
Soft to Stiff Sandy Silt(modeled as Soft Clay in LPILE and Clay in SHAFT)
Medium Stiff to Very Stiff Sandy Lean Clay (modeled as Soft Clay in LPILE and Clay in SHAFT) 100 38
--
Very Loose Clayey Sand and Stiff to Very Stiff Sandy Lean Clay
QprHard Lean to Fat Clay
(modeled as Mod. Stiff Clay w/o Free Water in LPILE and Clay in SHAFT)
QprMedium Dense to Dense Sand with Gravel
(modeled as API Sand in LPILE and Sand in SHAFT)
38
Geologic Unit
Loose to Dense Clayey Sand(modeled as API Sand in LPILE and Sand in
SHAFT)
Qal3
105 43
Qal2Medium Dense to Dense Sand with Gravel
(modeled as API Sand in LPILE and Sand in SHAFT)
100
110 48
35
100
--
50+ 35
QprDense to Very Dense Sand with Gravel
(modeled as API Sand in LPILE and Sand in SHAFT)
110 48
100
af/Qal1 95 33
63125
30
--
38
Qal3
Qal2
--QprHard Lean to Fat Clay
(modeled as Mod. Stiff Clay w/o Free Water in LPILE and Clay in SHAFT)
125 63
35
--

May 1, 2017

QUINCY ENGINEERING, INC. BRIDGE STREET BRIDGE REHABILITATION ARROYO GRANDE, CALIFORNIA
Fugro Project No. 04.62120100 Appendices
APPENDIX A SUBSURFACE EXPLORATION

PLATE A-1
Quincy EngineeringProject No. 04.62120100
10
Symbol for:
CA Liner Sampler, driven
Vibracore Sample
Pitcher Sample
Lexan Sample
BASALT
Sonic Soil Core Sample
No Sample Recovered
CA Liner Sampler, Bagged
13
(25)
6
11
4
Poorly graded SAND (SP)
COARSE
GRAINED
MATERIAL DESCRIPTION
Silty CLAY (CL-ML)
Silty SAND (SM)
Paving and/or Base Materials
SANDSTONE
Poorly graded GRAVEL (GP)
MUDSTONE
SY
MB
OL
SILTSTONE
Well graded SAND (SW)
Fat CLAY (CH)
MA
TE
RIA
L
SA
MP
LE N
O.
Hand Auger Sample
ANDESITE BRECCIA
7
9
5
Thin-walled Tube, pushed
CONGLOMERATE
3
FINE
GRAINED
ROCK
-12
-14
-16
-18
-20
-22
-24
-26
-28
-30
-32
-34
-36
-38
-40
-42
-44
-46
-48
2
4
6
8
10
12
14
16
18
20
22
24
26
28
30
32
34
36
38
25
Silty, Clayey SAND (SC-SM)
(25)
Elastic SILT (MH)
(25)
(25)
Lean CLAY (CL)
Sampler Driving Resistance
p = Pocket Penetrometer
Q = Unconfined Compressionu = Unconsolidated Undrained Triaxial
Initial or perched water level
Seepages encounteredFinal ground water level
Bulk Bag Sample (from cuttings)
Number of blows with 140 lb. hammer, falling30" to drive sampler 1 ft. after seatingsampler 6"; for example,
CLAYSTONE
LOCATION:
SILT (ML)
2
5
13
9
1
8
7
SA
MP
LES
Clayey SAND (SC)
The drill hole location referencing locallandmarks or coordinates
Well graded GRAVEL (GW)B
LOW
CO
UN
T /
t = Torvane
Blows/ft Description
25
Blow counts for California Liner Samplershown in ( )
Geologic Formation noted in bold font atthe top of interpreted interval
Classification of Soils per ASTM D2487 orD2488
Strength Legend
Length of sample symbol approximatesrecovery length
Water Level Symbols
SURFACE EL: Using local, MSL, MLLW or other datum
KEY TO TERMS & SYMBOLS USED ON LOGS
12
m = Miniature Vane
Samplers and sampler dimensions
Soil Texture Symbol
General Notes
Sloped line in symbol column indicatestransitional boundary
(unless otherwise noted in report text) are as follows:
3 CA Liner Sampler, disturbed
11
1 SPT Sampler, driven
6
8
2
4
CME Core Sample
12
10
BORING LOG KEY VENTURA C:\USERS\GECKRICH\DESKTOP\ACTIVE PROJECTS\04.62120100 BRIDGE ST. BRIDGE\GINT\04_6212_0100_VQ15B.GPJ 6/1/16 02:22 p
30"/30"
20"/24"
DE
PT
H, f
t
RE
C"/
DR
IVE
"
18"/30"
20"/24"
ELE
VA
TIO
N, f
t
50 blows drove sampler 3" duringinitial 6" seating interval
Ref/3"
50 blows drove sampler 6" afterinitial 6" of seating
After driving sampler the initial 6"of seating, 36 blows drovesampler through the second 6"interval, and 50 blows drove thesampler 5" into the third interval
50/6"
86/11"
25 blows drove sampler 12" afterinitial 6" of seating
Rock Quality Designation (RQD) is thesum of recovered core pieces greater than4 inches divided by the length of the coredinterval.
1-3/8" ID, 2" OD
2-3/8" ID, 3" OD
2-3/8" ID, 3" OD
2-7/8" ID, 3" OD

p 2.5
p 4.0
p 0.8
t 0.7
p 1.3
t 1.7
A
1
2
3
4
5
6
7A
7B
8
9A
9B
10
11
47
35
25
16
9
10
27
45
N/A
(18)
(11)
4
(10)
12
(39)
33
(51)
22
(16)
(79)
13
14
21
17
12
30
19
127
127
121
119
117
126
ARTIFICIAL FILL (af) 3.5" AC over 9" Base material over geotextile fabricClayey SAND (SC): medium dense, dark brown to
black, moist, fine to medium sand, some to mostlymoderate to high plasticity fines
- loose at 2.5'- very loose at 4'
Sandy lean CLAY (CL): very stiff, black matrix, moist,fine sand to fine angular gravel up to 2" diameter,asphalt inclusions
ALLUVIUM (Qal)Silty SAND (SM): medium dense, light brown, moist,
fine sand
Clayey SAND with gravel (SC): medium dense, blackto dark brown, moist, fine to coarse sand, fine tomedium angular gravel up to 2" diameter, pale grayshale and red sandstone clasts
Fat CLAY (CH): very stiff to hard, black, moist
Poorly graded SAND with clay and gravel (SP-SC):medium dense, gray to dark gray matrix, moist, littleto some fine to coarse sand, fine to medium angulargravel up to 2" diameter, shale and sandstone clasts
- dense at 24'
Fat CLAY (CH): medium stiff, brown with light brownmottling, moist, few subangular fine to mediumgravel up to 1" diameter, trace decomposed roots,grades to clayey SAND (SC) from 30-30.5 ft,medium dense, brown, moist
- medium stiff to stiff at 34'
PASO ROBLES FORMATION (QTp)Poorly graded GRAVEL with clay and sand (GP-GC):
very dense, brown to light brown, wet, few moderate
112
112
101
101
90
106
11
24
% P
AS
SIN
G#2
00 S
IEV
E
The log and data presented are a simplification of actual conditions encountered at the time of drilling at the drilled location. Subsurface conditions may differ at other locations and with the passage of time.
SA
MP
LER
SMATERIAL DESCRIPTION
PLA
ST
ICIT
YIN
DE
X, %
DEPTH TO WATER: 28.0 ft
LOG OF DRILL HOLE NO. DH-101
SURFACE EL: 112 ft +/- (rel. MSL datum)
Refer to Exploration Location MapN 2,240,890.1 E 5,790,597.9CA State Plane, Zone 5, NAD83, Feet
UN
IT D
RY
WE
IGH
T, p
cf
2
4
6
8
10
12
14
16
18
20
22
24
26
28
30
32
34
36
38
LIQ
UID
LIM
IT, %
UN
IT W
ET
WE
IGH
T, p
cf
SA
MP
LE N
O.
MA
TE
RIA
LS
YM
BO
L
ELE
VA
TIO
N, f
t
WA
TE
RC
ON
TE
NT
, %
LOCATION:
DRILLING METHOD: 8-inch-dia. Hollow Stem AugerHAMMER TYPE: Automatic Trip
DRILLED BY: S/G Drilling CompanyLOGGED BY: G Eckrich and T Gebhart
CHECKED BY: G S Denlinger
COMPLETION DEPTH: 131.5 ft
DRILLING DATE: March 29, 2017BACKFILLED WITH: 2-Sack Slurry with Asphalt Concrete Cap
110
108
106
104
102
100
98
96
94
92
90
88
86
84
82
80
78
76
74
DE
PT
H, f
t
PLATE A-2a
UN
DR
AIN
ED
SH
EA
RS
TR
EN
GT
H, S
u, k
sf
SA
MP
LER
BLO
W C
OU
NT
Project No. 04.62120100Quincy Engineering
Bridge Street Bridge RehabilitationArroyo Grande, California
BORING LOG VENTURA N:\PROJECTS\04_2012\04_6212_0100_BRIDGESTBRIDGE_INWC_DONOTUSE\EXPLORATIONS\GINT\2015\04_6212_0100_VQ15B.GPJ 4/27/17 05:11 p

12
13
14
15
16A16B
17
18
19
15
18
26
19
(93/11.5")
(60)
(67)
(56)
(77)
(72)
(Ref/5")
(50/5")
36
20
32
23
17
126
127
109
121
125
plasticity fines, fine to coarse sand, fine to mediumsubangular to angular gravel up to 1" diameter,shale clasts
- dense at 49'
- grades to clayey sand with gravel (SC)
- some to mostly angular to subrounded gravel up to2" diameter, trace lenses of lean clay (CL)
- grades to silty sand with gravel (SM)
- sulphur odor
93
106
83
99
108
% P
AS
SIN
G#2
00 S
IEV
E
The log and data presented are a simplification of actual conditions encountered at the time of drilling at the drilled location. Subsurface conditions may differ at other locations and with the passage of time.
SA
MP
LER
SMATERIAL DESCRIPTION
PLA
ST
ICIT
YIN
DE
X, %
DEPTH TO WATER: 28.0 ft
LOG OF DRILL HOLE NO. DH-101
SURFACE EL: 112 ft +/- (rel. MSL datum)
Refer to Exploration Location MapN 2,240,890.1 E 5,790,597.9CA State Plane, Zone 5, NAD83, Feet
UN
IT D
RY
WE
IGH
T, p
cf
42
44
46
48
50
52
54
56
58
60
62
64
66
68
70
72
74
76
78
LIQ
UID
LIM
IT, %
UN
IT W
ET
WE
IGH
T, p
cf
SA
MP
LE N
O.
MA
TE
RIA
LS
YM
BO
L
ELE
VA
TIO
N, f
t
WA
TE
RC
ON
TE
NT
, %
LOCATION:
DRILLING METHOD: 8-inch-dia. Hollow Stem AugerHAMMER TYPE: Automatic Trip
DRILLED BY: S/G Drilling CompanyLOGGED BY: G Eckrich and T Gebhart
CHECKED BY: G S Denlinger
COMPLETION DEPTH: 131.5 ft
DRILLING DATE: March 29, 2017BACKFILLED WITH: 2-Sack Slurry with Asphalt Concrete Cap
70
68
66
64
62
60
58
56
54
52
50
48
46
44
42
40
38
36
34
DE
PT
H, f
t
PLATE A-2b
UN
DR
AIN
ED
SH
EA
RS
TR
EN
GT
H, S
u, k
sf
SA
MP
LER
BLO
W C
OU
NT
Project No. 04.62120100Quincy Engineering
Bridge Street Bridge RehabilitationArroyo Grande, California
BORING LOG VENTURA N:\PROJECTS\04_2012\04_6212_0100_BRIDGESTBRIDGE_INWC_DONOTUSE\EXPLORATIONS\GINT\2015\04_6212_0100_VQ15B.GPJ 4/27/17 05:11 p

p 4.5+
p 4.5+u 10.7
p 4.5+
p 4.5+
p 4.5+u 8.1
p 4.5+
p 4.5+u 8.4
20
21
22A22B
23
24
25
26
88 Q 4.7Q 3.1
38
(50/4")
(92/12")
(73)
(88/10.5")
42
(85/9")
36
39
47
38
45
107
108
105
108
109
Lean to Fat CLAY (CL to CH): hard, light gray towhite, moist, strong sulphur odor, occasional darkercolored seams
79
78
72
79
75
% P
AS
SIN
G#2
00 S
IEV
E
The log and data presented are a simplification of actual conditions encountered at the time of drilling at the drilled location. Subsurface conditions may differ at other locations and with the passage of time.
SA
MP
LER
SMATERIAL DESCRIPTION
PLA
ST
ICIT
YIN
DE
X, %
DEPTH TO WATER: 28.0 ft
LOG OF DRILL HOLE NO. DH-101
SURFACE EL: 112 ft +/- (rel. MSL datum)
Refer to Exploration Location MapN 2,240,890.1 E 5,790,597.9CA State Plane, Zone 5, NAD83, Feet
UN
IT D
RY
WE
IGH
T, p
cf
82
84
86
88
90
92
94
96
98
100
102
104
106
108
110
112
114
116
118
LIQ
UID
LIM
IT, %
UN
IT W
ET
WE
IGH
T, p
cf
SA
MP
LE N
O.
MA
TE
RIA
LS
YM
BO
L
ELE
VA
TIO
N, f
t
WA
TE
RC
ON
TE
NT
, %
LOCATION:
DRILLING METHOD: 8-inch-dia. Hollow Stem AugerHAMMER TYPE: Automatic Trip
DRILLED BY: S/G Drilling CompanyLOGGED BY: G Eckrich and T Gebhart
CHECKED BY: G S Denlinger
COMPLETION DEPTH: 131.5 ft
DRILLING DATE: March 29, 2017BACKFILLED WITH: 2-Sack Slurry with Asphalt Concrete Cap
30
28
26
24
22
20
18
16
14
12
10
8
6
4
2
0
-2
-4
-6
DE
PT
H, f
t
PLATE A-2c
UN
DR
AIN
ED
SH
EA
RS
TR
EN
GT
H, S
u, k
sf
SA
MP
LER
BLO
W C
OU
NT
Project No. 04.62120100Quincy Engineering
Bridge Street Bridge RehabilitationArroyo Grande, California
BORING LOG VENTURA N:\PROJECTS\04_2012\04_6212_0100_BRIDGESTBRIDGE_INWC_DONOTUSE\EXPLORATIONS\GINT\2015\04_6212_0100_VQ15B.GPJ 4/27/17 05:11 p

p 4.5+
p 4.5+
27
28
60
70
- gray to dark gray below 125 feet
7/6/15: Borehole terminated at 95.5 feet,Groundwater measured at 40.5 feet, Backfilled with1-sack slurry
3/29/17: Borehole extended to 131.5 feet,Groundwater measured at 28 feet, Backfilled with2-sack slurry
% P
AS
SIN
G#2
00 S
IEV
E
The log and data presented are a simplification of actual conditions encountered at the time of drilling at the drilled location. Subsurface conditions may differ at other locations and with the passage of time.
SA
MP
LER
SMATERIAL DESCRIPTION
PLA
ST
ICIT
YIN
DE
X, %
DEPTH TO WATER: 28.0 ft
LOG OF DRILL HOLE NO. DH-101
SURFACE EL: 112 ft +/- (rel. MSL datum)
Refer to Exploration Location MapN 2,240,890.1 E 5,790,597.9CA State Plane, Zone 5, NAD83, Feet
UN
IT D
RY
WE
IGH
T, p
cf
122
124
126
128
130
132
134
136
138
140
142
144
146
148
150
152
154
156
158
LIQ
UID
LIM
IT, %
UN
IT W
ET
WE
IGH
T, p
cf
SA
MP
LE N
O.
MA
TE
RIA
LS
YM
BO
L
ELE
VA
TIO
N, f
t
WA
TE
RC
ON
TE
NT
, %
LOCATION:
DRILLING METHOD: 8-inch-dia. Hollow Stem AugerHAMMER TYPE: Automatic Trip
DRILLED BY: S/G Drilling CompanyLOGGED BY: G Eckrich and T Gebhart
CHECKED BY: G S Denlinger
COMPLETION DEPTH: 131.5 ft
DRILLING DATE: March 29, 2017BACKFILLED WITH: 2-Sack Slurry with Asphalt Concrete Cap
-10
-12
-14
-16
-18
-20
-22
-24
-26
-28
-30
-32
-34
-36
-38
-40
-42
-44
-46
DE
PT
H, f
t
PLATE A-2d
UN
DR
AIN
ED
SH
EA
RS
TR
EN
GT
H, S
u, k
sf
SA
MP
LER
BLO
W C
OU
NT
Project No. 04.62120100Quincy Engineering
Bridge Street Bridge RehabilitationArroyo Grande, California
BORING LOG VENTURA N:\PROJECTS\04_2012\04_6212_0100_BRIDGESTBRIDGE_INWC_DONOTUSE\EXPLORATIONS\GINT\2015\04_6212_0100_VQ15B.GPJ 4/27/17 05:11 p

QUINCY ENGINEERING, INC. BRIDGE STREET BRIDGE REHABILITATION ARROYO GRANDE, CALIFORNIA
Fugro Project No. 04.62120100 Appendices
APPENDIX B LABORATORY TEST RESULTS

DH-101 0.0 A Clayey SAND (SC) 114.0 8.5 21
DH-101 1.0 1 Clayey SAND (SC) 127 112 13 47
DH-101 2.5 2 Clayey SAND (SC) 127 112 14 3900 7.90 7 49.0
DH-101 4.0 3 Clayey SAND (SC) 35
DH-101 9.0 4 Sandy Lean CLAY (CL) 121 101 21 27 11
DH-101 10.5 5 Silty SAND (SM) 25
DH-101 14.0 6 Clayey SAND with gravel (SC) 119 101 17 16
DH-101 24.0 8 Poorly graded SAND with clay and gravel (SP-SC) 12 9 6000 8.10 5 31.0
DH-101 34.0 10 Lean CLAY (CL) 117 90 30 45 24
DH-101 39.0 11 Poorly graded GRAVEL with clay and sand (GP-GC) 126 106 19 10
DH-101 44.0 12 Poorly graded GRAVEL with clay and sand (GP-GC) 126 93 36
DH-101 54.0 14 Clayey SAND with gravel (SC) 127 106 20 15
DH-101 64.0 16A Silty SAND with gravel (SM) 109 83 32 18 1703 7.50 67 271.0
DH-101 69.0 17 Silty SAND with gravel (SM) 121 99 23 26
DH-101 79.0 19 Silty SAND with gravel (SM) 125 108 17 19
DH-101 89.0 21 Lean to Fat CLAY (CL to CH) 107 79 36 10.7(10.7)
DH-101 94.0 22A Lean to Fat CLAY (CL to CH) 108 78 39 88 9.3
DH-101 94.5 22B Lean to Fat CLAY (CL to CH) 105 72 47 6.1
DH-101 100.0 24 Lean to Fat CLAY (CL to CH) 108 79 38 8.1(7)
DH-101 115.0 26 Lean to Fat CLAY (CL to CH) 109 75 45 8.4(7)
CO
MP
RE
SS
IVE
ST
RE
NG
TH
TE
ST
S
Bridge Street Bridge RehabilitationArroyo Grande, California
DRILLHOLE
Qu,ksf
FINES%
MAXDDpcf
LA
B S
UM
MA
RY
TA
BL
E V
EN
TU
RA
_N:\P
RO
JEC
TS
\04_2012\04_6212_01
00_BR
IDG
ES
TB
RID
GE
_INW
C_D
ON
OT
US
E\E
XP
LOR
AT
ION
S\G
INT
\2015\04_6212_0100
_VQ
15B.G
PJ_ 4/28/17 09:00 A
M-cab
MC%
UDWpcf
SA
ND
EQ
UIV
ALE
NT
(SE
)
SA
MP
LE N
UM
BE
R
AT
TE
RB
ER
GLI
MIT
S
DE
PT
H, f
t
LL
UWWpcf
OPTMC%
DIR
EC
TS
HE
AR
ClR pH
CORROSIVITY TESTS
PLA
TE
B-1
MATERIAL DESCRIPTION
PHIdeg
SUMMARY OF LABORATORY TEST RESULTS
So4
(ppm)
Spe
cific
Gra
vity
R-V
ALU
E
CO
MP
AC
TIO
NT
ES
T
SU(Cell Prs.)
ksfCksf
PI EX
PA
NS
ION
IND
EX
Project N
o. 04.6212
0100Q
uincy Engin
eering

0
10
20
30
40
50
60
70
80
90
100
0.0010.010.1110100
SANDSILT or CLAY
Fine Coarse
PE
RC
EN
T F
INE
R B
Y W
EIG
HT
Medium FineCoarse
GRAIN SIZE IN MILLIMETERS
GRAVEL
GRAIN SIZE CURVES
PLATE B-2
Project No. 04.62120100Quincy Engineering
Bridge Street Bridge RehabilitationArroyo Grande, California
GRAIN SIZE CURVES VENTURA (C:\USERS\GECKRICH\DESKTOP\ACTIVE PROJECTS\04.62120100 BRIDGE ST. BRIDGE\GINT\04_6212_0100_VQ15B.GPJ) 6/1/16 02:26 p-sz
HYDROMETER ANALYSIS
20
LEGEND
40 1003 1.5 3/4 3/8 4
(depth,ft)CLASSIFICATION Cc Cu
38.885.6
Clayey SAND with gravel (SC)Poorly graded SAND with clay and gravel (SP-SC)
Poorly graded GRAVEL with clay and sand (GP-GC)Silty SAND with gravel (SM)
DH-101DH-101DH-101DH-101
(location)
US STD SIEVE SIZEINCHES
200
US STD SIEVE SIZENUMBERS
14.024.039.064.0
3.65.3
10

0
10
20
30
40
50
60
70
80
90
100
0 10 20 30 40 50 60 70 80 90 100
9.0
34.0
DH-101
DH-101
27
45
CH or OH
ML or OL
MH or OH
LEGENDlocation
LIQUID LIMIT (LL)
PLASTICITYLIQUIDLIMIT(LL)
PLASTICLIMIT(PL)
Sandy Lean CLAY (CL)
Lean CLAY (CL)
depth, ft
ATTERBERG LIMITS TEST RESULTS
PLA
ST
ICIT
Y IN
DE
X (
PI)
INDEX (PI)CLASSIFICATION
CL-ML
PLASTICITY CHART
PLATE B-3
16
21
11
24
CL or OL
PLASTICITY CHART VENTURA C:\USERS\GECKRICH\DESKTOP\ACTIVE PROJECTS\04.62120100 BRIDGE ST. BRIDGE\GINT\04_6212_0100_VQ15B.GPJ 6/1/16 02:26 p
Project No. 04.62120100Quincy Engineering
Bridge Street Bridge RehabilitationArroyo Grande, California
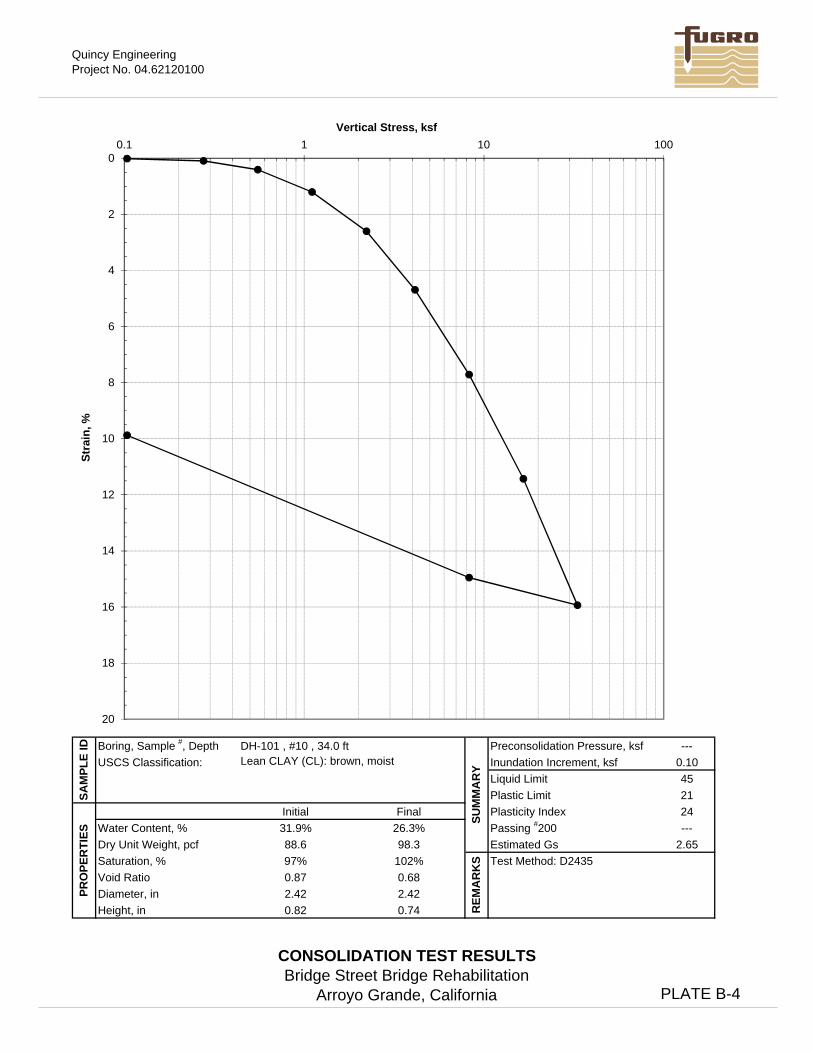
Quincy EngineeringProject No. 04.62120100
X Y X YMax Curvature 4 3Max Curve Tangent 2 2.314802
4 311 4
Horiz Max 4 311 3
Bisect 4 311 3.5
Virgin 6 116 7
Intersect 8.87361 3.393825
Vertical Stress, ksf
---0.10452124---
2.65
SAM
PLE
ID
Water Content, %Dry Unit Weight, pcf
USCS Classification:Boring, Sample #, Depth
Saturation, %
PRO
PER
TIES
97%88.6
31.9%
Diameter, inHeight, in
Void Ratio 0.872.42
DH-101 , #10 , 34.0 ft
0.82
26.3%98.3
102%0.682.420.74
Lean CLAY (CL): brown, moist
FinalInitialPassing #200Estimated Gs
SUM
MA
RY
REM
AR
KS Test Method: D2435
Plasticity Index
Inundation Increment, ksfPreconsolidation Pressure, ksf
Liquid LimitPlastic Limit
0
2
4
6
8
10
12
14
16
18
20
0.1 1 10 100
Stra
in, %
Vertical Stress, ksf
CONSOLIDATION TEST RESULTSBridge Street Bridge Rehabilitation
Arroyo Grande, California PLATE B-4

Quincy EngineeringProject No. 04.62120100
Unit Dependent TextCompressive Strength, ksfUndrained Shear Strength, ksf94.0 ftDry Unit Weight, pcfDiameter, inHeight, in
Sieve Size % Passing3/8-in. (9.5mm) --- ---#4 (4.75mm) --- ---#16 (1.18mm) --- ---#30 (0.6mm) --- 2.65#100 (0.150mm) ---
46.0% #200 (0.075mm) ---73.297%1.262.415.03
Height/Diameter 2.09
Test Method: ASTM D2166
JB
Diameter, in
Estimated Gs
Liquid Limit
4.020.90
Plasticity Index
CLA
SSIF
ICA
TIO
N
USCS Classification:
Sample Number.:Plastic Limit
Other ParametersDH-101
9.3
SAM
PLE
PRO
PER
TIES
Void Ratio
Water Content, %Dry Unit Weight, pcfSaturation, %
Axial Strain at Failure, %Strain Rate, %/min
Date Tested: 7/29/15
4.7
Tested By:
Compressive Strength, ksfUndrained Shear Strength, ksf
Boring Number.:
Sample Depth:
SAM
PLE
IMA
GES
REM
AR
KS
TEST
SU
MM
AR
Y
Height, in
SAM
PLE
ID
Fat CLAY (CH): white, moist
22A94.0 ft
0
1
2
3
4
5
6
7
8
9
10
0.0 0.5 1.0 1.5 2.0 2.5 3.0 3.5 4.0 4.5 5.0 5.5 6.0 6.5 7.0 7.5 8.0 8.5 9.0 9.5 10.0
Com
pres
sive
Str
engt
h, k
sf
Axial Strain, %
Interpreted Point of Failure
UNCONFINED COMPRESSION TEST RESULTSBridge Street Bridge Rehabilitation
Arroyo Grande, California PLATE B-5a

Quincy EngineeringProject No. 04.62120100
Unit Dependent TextCompressive Strength, ksfUndrained Shear Strength, ksf94.5 ftDry Unit Weight, pcfDiameter, inHeight, in
Sieve Size % Passing3/8-in. (9.5mm) --- ---#4 (4.75mm) --- ---#16 (1.18mm) --- ---#30 (0.6mm) --- 2.65#100 (0.150mm) ---
47.0% #200 (0.075mm) ---71.595%1.312.416.04
Height/Diameter 2.51
Test Method: ASTM D2166
Boring Number.:
Sample Depth:
SAM
PLE
IMA
GES
REM
AR
KS
TEST
SU
MM
AR
Y
Height, in
6.1
SAM
PLE
PRO
PER
TIES
Void Ratio
Water Content, %Dry Unit Weight, pcfSaturation, %
Axial Strain at Failure, %Strain Rate, %/min
Date Tested: 8/6/15
3.1
Tested By:
SAM
PLE
ID
Fat CLAY (CL): white, moist
Compressive Strength, ksfUndrained Shear Strength, ksf
22b94.5 ft
Plasticity Index
CLA
SSIF
ICA
TIO
N
USCS Classification:
Sample Number.:Plastic Limit
Other ParametersDH-101
JB
Diameter, in
Estimated Gs
Liquid Limit
2.380.80
0
1
2
3
4
5
6
7
0.0 0.5 1.0 1.5 2.0 2.5 3.0 3.5 4.0 4.5 5.0 5.5 6.0 6.5 7.0 7.5 8.0 8.5 9.0 9.5 10.0
Com
pres
sive
Str
engt
h, k
sf
Axial Strain, %
Interpreted Point of Failure
UNCONFINED COMPRESSION TEST RESULTSBridge Street Bridge Rehabilitation
Arroyo Grande, California PLATE B-5b

Quincy EngineeringProject No. 04.62120100
Confining Stress: 10.7 ksf
Sieve Size % Passing3/8-in. (9.5mm) --- ---#4 (4.75mm) --- ---#16 (1.18mm) --- ---#30 (0.6mm) --- 2.65#100 (0.150mm) --- ---#200 (0.075mm) --- ---
35.7%78.886%1.102.415.82
Test Method: ASTM 2850
RE
MA
RK
S
Saturation, %
SA
MP
LE
ID
Boring Number:
Sample Depth:USCS Classification:
Sample Number:DH-10121
Fat CLAY (CH): white, moistEstimated GsSu from Tv, ksfSu from PP, ksf
21.510.7
Liquid LimitPlastic Limit89.0 ft
SA
MP
LE
IM
AG
ES
Diameter, inHeight, in
SA
MP
LE
PR
OP
ER
TIE
S
Void Ratio
Water Content, %Dry Unit Weight, pcf
10.7
Plasticity Index
CL
AS
SIF
ICA
TIO
N
Other Parameters
AS8/24/15
Tested By:
Axial Strain at Failure, %
TE
ST
SU
MM
AR
Y
Strain Rate, %/min
Date Tested:
Maximum Deviator Stress, ksfUndrained Shear Strength, ksf
Cell Pressure, ksf
8.50.7
0
5
10
15
20
25
30
0 1 2 3 4 5 6 7 8 9 10 11 12 13 14 15
Dev
iato
r S
tres
s (σ
1-σ
3), k
sf
Axial Strain, %
Confining Stress: 10.7 ksf
Interpreted Point of Failure
UNCONSOLIDATED, UNDRAINED TRIAXIAL TEST RESULTSBridge Street Bridge Rehabilitation
Arroyo Grande, CaliforniaPLATE B-6a

Quincy EngineeringProject No. 04.62120100
Confining Stress: 7.0 ksf
Sieve Size % Passing3/8-in. (9.5mm) --- ---#4 (4.75mm) --- ---#16 (1.18mm) --- ---#30 (0.6mm) --- 2.65#100 (0.150mm) --- ---#200 (0.075mm) --- ---
37.8%78.791%1.102.425.14
Test Method: ASTM 2850
RE
MA
RK
S
Saturation, %
SA
MP
LE
ID
Boring Number:
Sample Depth:USCS Classification:
Sample Number:DH-10124
Fat CLAY (CH): gray, moistEstimated GsSu from Tv, ksfSu from PP, ksf
16.28.1
Liquid LimitPlastic Limit100.0 ft
SA
MP
LE
IM
AG
ES
Diameter, inHeight, in
SA
MP
LE
PR
OP
ER
TIE
S
Void Ratio
Water Content, %Dry Unit Weight, pcf
7.0
Plasticity Index
CL
AS
SIF
ICA
TIO
N
Other Parameters
JB4/4/17
Tested By:
Axial Strain at Failure, %
TE
ST
SU
MM
AR
Y
Strain Rate, %/min
Date Tested:
Maximum Deviator Stress, ksfUndrained Shear Strength, ksf
Cell Pressure, ksf
10.80.7
0
5
10
15
20
25
30
0 1 2 3 4 5 6 7 8 9 10 11 12 13 14 15
Dev
iato
r S
tres
s (σ
1-σ
3), k
sf
Axial Strain, %
Confining Stress: 7.0 ksf
Interpreted Point of Failure
UNCONSOLIDATED, UNDRAINED TRIAXIAL TEST RESULTSBridge Street Bridge Rehabilitation
Arroyo Grande, California PLATE B-6b

Quincy EngineeringProject No. 04.62120100
Confining Stress: 7.0 ksf
Sieve Size % Passing3/8-in. (9.5mm) --- ---#4 (4.75mm) --- ---#16 (1.18mm) --- ---#30 (0.6mm) --- 2.65#100 (0.150mm) --- ---#200 (0.075mm) --- ---
45.2%74.999%1.212.435.06
Test Method: ASTM 2850
RE
MA
RK
S
Saturation, %
SA
MP
LE
ID
Estimated GsSu from Tv, ksfSu from PP, ksf
16.88.4
Boring Number:
Sample Depth:USCS Classification:
Sample Number:DH-10126b
Fat CLAY (CH): gray, moist
Liquid LimitPlastic Limit115.0 ft
SA
MP
LE
IM
AG
ES
Diameter, inHeight, in
SA
MP
LE
PR
OP
ER
TIE
S
Void Ratio
Water Content, %Dry Unit Weight, pcf
7.0
Plasticity Index
CL
AS
SIF
ICA
TIO
N
Other Parameters
JB4/4/17
Tested By:
Axial Strain at Failure, %
TE
ST
SU
MM
AR
Y
Strain Rate, %/min
Date Tested:
Maximum Deviator Stress, ksfUndrained Shear Strength, ksf
Cell Pressure, ksf
11.60.8
0
5
10
15
20
25
30
0 1 2 3 4 5 6 7 8 9 10 11 12 13 14 15
Dev
iato
r S
tres
s (σ
1-σ
3), k
sf
Axial Strain, %
Confining Stress: 7.0 ksf
Interpreted Point of Failure
UNCONSOLIDATED, UNDRAINED TRIAXIAL TEST RESULTSBridge Street Bridge Rehabilitation
Arroyo Grande, California PLATE B-6c

100
105
110
115
120
125
130
135
0 5 10 15 20 25
OPTIMUM WATERCONTENT, %
MOISTURE CONTENT, %
UN
IT D
RY
WE
IGH
T, p
cf
LEGENDMAXIMUM UNIT
DRY WEIGHT, pcf
Test Method: ASTM D1557(Gs = 2.65 to 2.75)
CLASSIFICATION
114.0 8.5
depth, ft
PLATE B-7
COMPACTION TEST RESULTS
(location)
Clayey SAND (SC)
ZERO AIR VOIDS CURVES
0.0DH-101
COMPACTION TEST VENTURA C:\USERS\GECKRICH\DESKTOP\ACTIVE PROJECTS\04.62120100 BRIDGE ST. BRIDGE\GINT\04_6212_0100_VQ15B.GPJ 6/1/16 02:27 p
Project No. 04.62120100Quincy Engineering
Bridge Street Bridge RehabilitationArroyo Grande, California
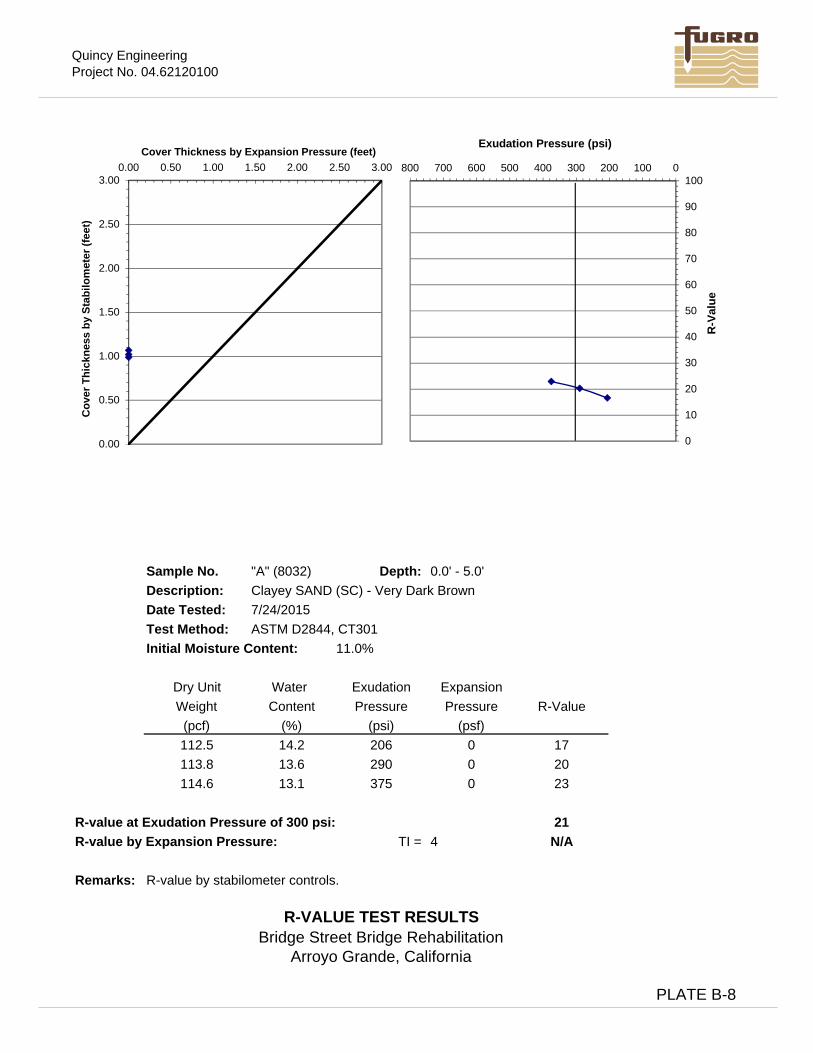
Quincy EngineeringProject No. 04.62120100
Sample No. "A" (8032) Depth: 0.0' - 5.0'Description: Clayey SAND (SC) - Very Dark BrownDate Tested: 7/24/2015 Test Method: ASTM D2844, CT301Initial Moisture Content: 11.0%
Dry Unit Water Exudation ExpansionWeight Content Pressure Pressure R-Value
(pcf) (%) (psi) (psf)112.5 14.2 206 0 17113.8 13.6 290 0 20114.6 13.1 375 0 23
R-value at Exudation Pressure of 300 psi: 21R-value by Expansion Pressure: TI = 4 N/A
Remarks: R-value by stabilometer controls.
R-VALUE TEST RESULTSBridge Street Bridge Rehabilitation
Arroyo Grande, California
PLATE B-8
0
10
20
30
40
50
60
70
80
90
1000100200300400500600700800
R-V
alue
Exudation Pressure (psi)
0.00
0.50
1.00
1.50
2.00
2.50
3.000.00 0.50 1.00 1.50 2.00 2.50 3.00
Cov
er T
hick
ness
by
Stab
ilom
eter
(fee
t)
Cover Thickness by Expansion Pressure (feet)

QUINCY ENGINEERING, INC. BRIDGE STREET BRIDGE REHABILITATION ARROYO GRANDE, CALIFORNIA
Fugro Project No. 04.62120100 Appendices
APPENDIX C REFERENCED EXISTING SUBSURFACE DATA