bridge foundation design
TRANSCRIPT

1
CIVL 5452
Bridge Foundation Design Report
The University of Sydney CIVL 5452
Foundation Engineering
Zhongyan Yu
311071651

2
Contents 1. INTRODUCTION .................................................................................................................................................... 3
1.1 Project Overview ..................................................................................................................................................... 3
1.2 Important Assumptions ........................................................................................................................................... 3
2. DEVELOPMENT OF GEOTECHNICAL MODEL .................................................................................................... 4
2.1 Classification of Rocks ........................................................................................................................................... 4
2.2 Subsurface Profile Establishment using Information in Boreholes ........................................................................ 4
2.3 Interpretation of Geotechnical Investigation ........................................................................................................... 5
2.4 Formulation of the Geotechnical Model Parameters in Geotechnical Model ......................................................... 5
3. ANALYSIS AND DESIGN OF FOUNDATION SYSTEMS ..................................................................................... 6
3.1 Design Criteria ........................................................................................................................................................ 6
3.2 Design Results ........................................................................................................................................................ 6
4. CONCLUSIONS ....................................................................................................................................................... 6
4.1 Important Outcomes ................................................................................................................................................ 6
4.2 Final Recommendations forthe Piles ...................................................................................................................... 7
REFERENCES ................................................................................................................................................................. 7
APPENDICES .................................................................................................................................................................. 8
Appendix 1 Loading Situations on the Foundation Systems (Facts) ............................................................................ 8
Appendix 2 Longitudinal and Plan View of the Bridge Structure (Facts) .................................................................... 9
Appendix 3 The Geotechnical Investigation Results (Facts) ...................................................................................... 10
Appendix 4 Pells et al (1998) Rock Classification Table for Sydney Shale Table (Interpretation) ........................... 16
Appendix 5 Sandstone and Shale Property Table (Interpretation) .............................................................................. 16
Appendix 6 Rock Classification Details (Interpretation) ........................................................................................... 17
Appendix 7 Adopted Average Values of Point Load Strength Indexes (Interpretation) ............................................ 18
Appendix 8Detailed Establishment of Geotechnical Model in Tabulated Form (Interpretation) ............................... 20
Appendix 9 Evaluation of Strength Reduction Factors using AS 2159 (Interpretation) ............................................. 23

3
1. INTRODUCTION 1.1 Project Overview This report comprises the establishment of geotechnical model and foundation system design of a site on which a 20 m wide x 90 m long bridge is constructed. The proposed bridge is composed of three 30 m long spans and it is supported by 2 abutments and 2 piers. The plan view of the structure is shown in the following.
Figure 1 Site Plan of the Proposed Bridge Structure
The additional essential information for design purposes (including loading, longitudinal view,available geotechnical test data) are provided in Appendix 1, 2 and 3.
1.2 Important Assumptions In addition to the assumptions on material properties stipulated in the project brief, the following assumptions are made in this design report in order to appropriately simplify the interpretation, design and analysis processes. Assumptions in interpreting geotechnical test results
1. For BH 01 and 02, the materials at the top (without any point load strength index values available) are weak materials and will be regarded as non-existent (or air) in the design process.
2. All material properties (for both strength and stiffness) can only change along the East-West direction and remain constant along the North-South direction.
3. For any particular depth, the ‘overall’ point load strength index is calculated as the average value of axial index (a) and diametral index (d).
4. Each borehole is divided into 4 – 5 different layers based on the results for point load strength indexes, material descriptions and estimated strengths (the variance of these parameters must be relatively small within one layer). Once the layer division is completely, it is assumed any individual layer has only one constant point load strength index which is the average value of all ‘overall’ point load strength indexes in this layer.
5. In the calculation of pile bearing capacity, the ultimate end bearing of any foundation system is assumed to be 3 times the UCS value at the depth where the pier or abutment is founded on the rock
6. In the acquisition of horizontal and vertical modulus E values, a distinction is made between UCS at horizontal and vertical directions. UCS_horizontal is assumed to be 17 times axial point load strength index (a) and UCS_vertial is assumed to be 17 times the values of dimetral point load strength index (d)(Anthony De Nicola and Mark F. Randolph, 1985).
7. All E (MPa) valuesin the geotechnical model establishment are selected from ‘Table 10: Design values for foundations on shale’ table in Appendix 5. Since the table gives a wide range of stiffness values for a particular class of shale, the exact stiffness is obtained using linear interpreted based on the relative UCS values (the actual UCS value compared with the maximum and minimum UCS values in a particular shale class). The underlying assumption is that the relative UCS of a rock is proportional to the relative stiffness of the rock. The only exceptions to this assumption occur when the calculated UCS turns out to be larger than the maximum UCS value defined in the design table, in which case only the maximum E values in the stiffness rangein the design table would be adopted (AbolfaziEslami and Beng H. Fellnius, 2001).
Assumptions in the Analysis and Design of Pile Systems 1. There are in total 6 piles (abutments or piers) along North-South direction in one particular East-West position
and the tributary width for each pile is exactly 3.5 m.

4
2. All pile systems are assumed to have free head, meaning the load will be evenly distributed among the piles but the settlement and the lateral deflection will differ from one pile to another. The most critical settlement case occurs at the midpoint along the bridge width while the bride edges witnessed the largest horizontal deflection of the structure.
3. In the horizontal deflection analysis, all shales within 16 m below the ground surface are recognized as clay with an equivalent undrained cohesion Cu of 0.5 times the UCS.
4. If a pile foundation penetrates into different rock layers of the rock, the overall stiffness and strength parameters used in analysis is the weighted average stiffness of all reached layers (based on layer thickness). This assumption applies to both Young’s modulus E (MPa) and undrained shear strength Cu (kPa).
5. The values of Poisson’s ratio have negligible influences on the analysis of vertical settlement and horizontal deflections. For example,the analysis results for soil settlement and movement are assumed to be extremely close or identical for v=0.3 and v=0.5 (Champam G.A, Emery D., Haberfield C.M, 2003).
6. All pile length in the design is measured from the top of the proposed headstock. 7. Other additional assumptions made for calculating strength reduction factor is found in Appendix 9.
2. DEVELOPMENT OF GEOTECHNICAL MODEL 2.1 Classification of Rocks The rock classification is conducted in accordance with the Pells (1998) rock classification system shown in Appendix 4. The detailed classification process is carried out in Appendix 6.The interpretation results of the
classification is summarized in the following table (Pells. P.J.N, 1998).
Table 1 Summary of Rock Classification Results
2.2 Subsurface Profile Establishment using Information in Boreholes The essential information for design purposes contained in the geotechnical investigation results (BH01, BH02, BH06, BH07) is transferred into the following subsurface ground profiles.
BH 01 (7.4m) BH 02 (7.0m) BH 06 (20.23m) BH 07 (19.59m) Depth to top of unit (m)
Class of Shale
Depth to top of unit (m)
Class of Shale
Depth to top of unit (m)
Class of Shale
Depth to top of unit (m)
Class of Shale
0 NA 0 NA 0 IV 0 III
2.55 II 2.65 III 4.36 IV 6 III
5 I 4 II 11 III 16 III
14.1 II 17.2 II

5
Figure 2 Subsurface Profile (Section A-A in Figure 1)
Description of Units UNIT 1 –Class III or IV Shale with Fine Grained Sandstone laminae, distinctly laminated at 0-5 degrees with Very Low to Low Stiffness UNIT 2 –Class I or II shale with Medium to Hard Stiffness UNIT 3 – Fill and Residual Soil with Very Low Strength Capacity (Categorically Ignored in the Design)
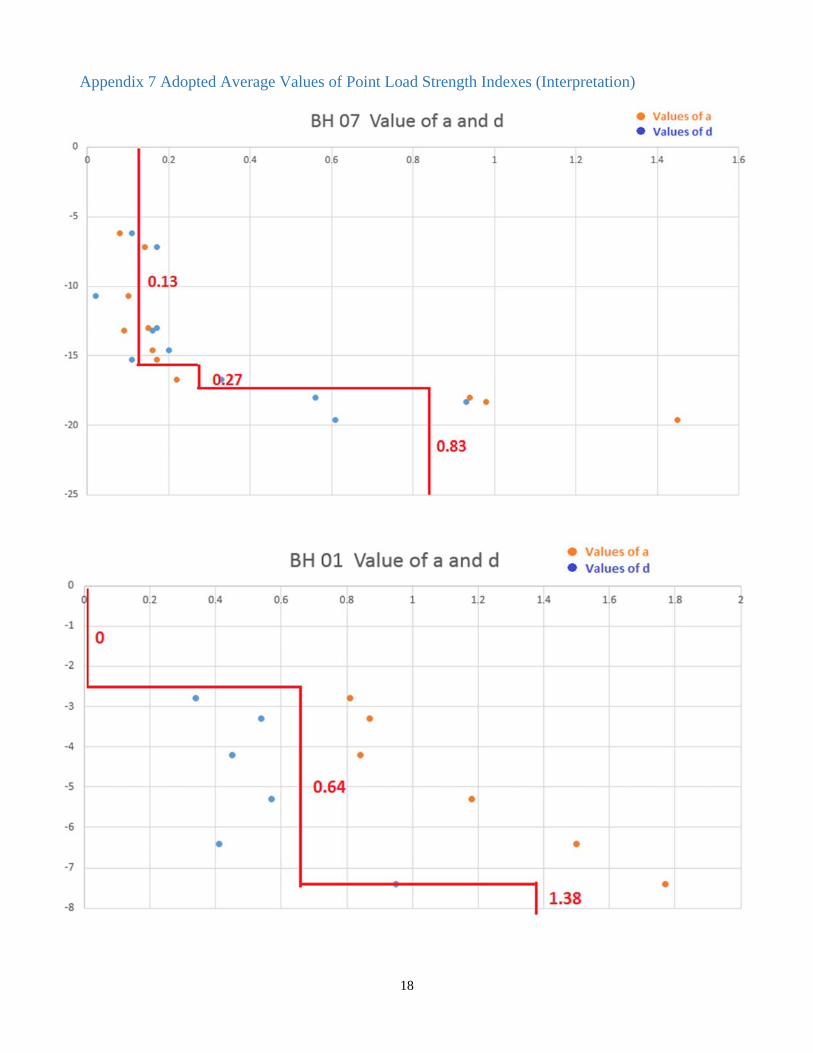
2.3 Interpretation of Geotechnical Investigation The crucial parameters of the geotechnical investigation comprises the axial point load strength index (a) and diamentral strength index (d). In the geotechnical model, an average value of a and d in each layer will be adopted for further estimate of material strength. This process, together with the division of layers based on material type, is illustrated in the following diagrams (only BH01 and BH06 are shown here, the full results are found in Appendix 7).
Figure 3 Plots of Point Load Strength Index Result Interpretation (BH01&BH06)
2.4 Formulation of the Geotechnical Model Parameters in Geotechnical Model Based on the interpretation of point load strength indexes more design parameters can be derived using the assumptions stated in Part 1. The detailed process of parameter derivation is shown in Appendix 8. The completed geotechnical model is summarized in the following table (only BH01 and BH06 are shown here, the full interpretation results are found in Appendix 8).
Test Results Design Parameters
(Vertical) Design Parameters
(Horizontal)
Depth to top of
unit (m)
RL top of unit
(m) Length
(m) Average
a Average
d E_v
(MPa)
End Bearing
(kPa) E_h
(MPa) Cu_h (kPa)
BH01
0 55.2 2.55 0 0 0.0 0 0.0 0.0 2.55 52.65 2.45 0.84 0.44 1097.1 42840 726.2 3740.0
5 50.2 2.4 1.48 0.97 1690.5 75480 1217.6 8245.0 BH06
0 67.3 4.36 0.159 0.063 500.0 8109 82.0 535.5 4.36 62.94 6.64 0.159 0.063 500.0 8109 82.0 535.5 11 56.3 3.1 0.27 0.28 399.2 13770 412.3 2380.0
14.1 53.2 6.13 1.24 1.01 1468.0 63240 1254.7 8585.0 Table 2Summary of the Adopted Geotechnical Model with Relevant Design Parameters (BH01&BH06)
It should be noted that vertical and horizontal modulus are derived differently based on a and d values respectively. In addition, all numbers in the above table are rough estimate of rock properties using reasonable empirical correlations and should not be regarded as exact values.

6
3. ANALYSIS AND DESIGN OF FOUNDATION SYSTEMS 3.1 Design Criteria Analysis and design process is performed on Abutment A and Pier 1 only using ULS (Ultimate Limit State) and SLS (serviceability Limit State) criteria which are specified in the following (Australia Standard 1726-1999).
1. For ULS conditions, the footing is to be designed using the geotechnical strength factors stipulated in AS 2159 (found in Appendix 9). The ultimate state loads (including vertical forces, horizontal forces and total bending moment) must be lower than the factored capacities of the pile.
2. For SLS condition, the pile settlement is to be limited to 10 mm and the horizontal deflection is to be limited to 20 mm.
3.2 Design Results Both Abutment A and Pier 1 are assumed to have a total underground length of 5 m (L=5m) measure from the top of headstock and above-ground length of 2 m (e = 2m). The detailed design and analysis process is carried out in Appendix 10 in the form of hand calculations. The final results are summarized in the following table.
Table 3Summary of Piling Design Results for Abutment A and Pier 1 The result summary table shows that when both the abutment and pier are 5 meter long, all strength and serviceability design requirement can be fulfilled to a satisfactory extent.
4. CONCLUSIONS 4.1 Important Outcomes
1. The site investigation shows that the subsurface condition is generally good for supporting major structures with primarily Class III and II shale (reasonably stiff and strong) existing in the the investigated site.
2. The current configuration of pile distribution (6 pile each row, 4 rows in total) is capable of supporting the structure with integrity.
Pile Criteria Item
Vertical Direction Horizontal Direction
Actual Value
Maximum Allowed
Value
Actual Value
Maximum Allowed
Abutment A
(BH06)
ULS Forces on the Single Pile (kN) 3500 4397 175 231 Forces on the Pile on the Pile Group (kN)
20000 26382 1000 NA
SLS
Forces on the Single Pile (kN) 2625 NA 140 NA Displacements on the Single Pile (mm)
2.57 10 10.75 20
Bending Moment on the Single Pile (kNm)
NA NA 324.8 600
Forces on the Pile on the Pile Group (kM)
15000 NA 800 NA
Displacements the Pile Group (mm)
4.2 10 11.8 20
Bending Moment on th Pile Group (kNm)
NA NA 1856 4200
Pier1 (BH01)
ULS Item
Vertical Horizontal Direction
Actual Value
Maximum Allowed Value
NA
Forces on the Single Pile (kN) 5250 16573 Forces on the Pile Group (kN) 30000 99438
SLS
Forces on the Single Pile (kN) 3850 NA Displacements on the Single Pile (mm)
1.99 10
Forces on the Pile Group (kN) 22000 NA Displacements the Pile Group (mm)
3.1 10

7
4.2 Final Recommendations forthe Piles In order to adequately support the bridge abutments and piers with risks of failure or excessive deformation being control within a satisfactory level, the bridge is to be supported by abutments and pierswith penetration depths of both 5.0 m measured from the top of the proposed headstock OR with respective founding levels of 50.2 m (RL) and 62.3 m(RL). The illustration of this recommendation is shown in Appendix 10.
REFERENCES AbolfaziEslami and Beng H. Fellnius, 2001, Factors Influeencing Selection of Foundation Type
Anthony De Nicola and Mark F. Randolph, 1985, Tensil and Compressive Capacity of Bored Piles
Australia Standard 1726-1999, Geotechnical Site Investigations
Champam G.A, 2003, Emery D., Haberfield C.M, Design of a Piled Raft Foundation for Twin Gold Coast Towers
Harry G. and Poulos M, Behavour of Laterally Loaded Pile Groups
Legget, R.F, 1979, Geology and Geotechnical Engineerg, Geotechnical Engineering Division, Vol 105, No GT3, pp.339-391
Pells. P.J.N, 1998, State of Practice for Design of Socketed Piles in Rock
Robert A. Day, 1992, Fifteen years of geotechnical limit state design in Australia

8
APPENDICES Appendix 1 Loading Situations on the Foundation Systems (Facts) Abutment Pier
ProposedPileFoundation System Singlerowof6 nos.x 0.6 m diameterbored pilesat3.5mcentres
Singlerowof6 nos.x 0.6 m diameterbored piles at3.5mcentres
UltimateLimit State Loads(ULS) Vertical 1,000kN permetrerun
alongthe 20mlong abutment headstock
1,500kNpermetrerun alongthe 20mlong
bridge pierheadstock
Horizontal(longitudinal direction) 50kNpermetrerun alongthe 20mlong
abutment headstock, actingat2mabove the base
ofthe headstock
N/A
Moment (longitudinal direction) From horizontalloading eccentricity as specified
above
N/A
ServiceabilityLimitState Loads(SLS) Vertical 750kNpermetre run
alongthe 20mlong abutment headstock
1,100kNpermetrerun alongthe 20mlong
bridge pierheadstock
Horizontal(longitudinal direction) 40kNpermetrerun alongthe 20mlong
abutment headstock, actingat2mabove the base
ofthe headstock
N/A
Moment (longitudinal direction) From horizontalloading eccentricity as specified
above
N/A

9
Appendix 2 Longitudinal and Plan View of the Bridge Structure (Facts)

10
Appendix 3 The Geotechnical Investigation Results (Facts)

11

12

13

14

15

16
Appendix 4 Pells et al (1998) Rock Classification Table for Sydney Shale Table (Interpretation)
Appendix 5 Sandstone and Shale Property Table (Interpretation)

17
Appendix 6 Rock Classification Details (Interpretation) BH 01
Depth to top of unit (m)
RL top of unit)
Average a Average d
Unconfined Compressive Strength qu (MPa)
Defect Spacing (mm)
Sum of Seams (mm)
Lenth of the Interval (mm)
Seam (%)
Class of Shale
0 55.2 NA NA NA NA NA 2550 2.55 52.65 0.84 0.44 10.9 100-500 40 2450 1.63% 2
5 50.2 1.48 0.97 20.8 300-1000 30 2400 1.25% 1
7.4 47.8 BH 02
Depth to top of unit (m)
RL top of unit)
Average a Average d
Unconfined Compressive Strength qu (MPa)
Defect Spacing (mm)
Sum of Seams (mm)
Lenth of the Interval (mm)
Seam (%)
Class of Shale
0 55.6 NA NA #VALUE! NA NA 2650 2.65 52.95 0.24 0.205 3.7825 70-300 140 1350 10.37% 3
4 51.6 1.2 0.267 12.4695 200-800 40 3000 1.33% 2 7 48.6
BH 06
Depth to top of unit (m)
RL top of unit)
Average a Average d
Unconfined Compressive Strength qu (MPa)
Defect Spacing (mm)
Sum of Seams (mm)
Lenth of the Interval (mm)
Seam (%)
Class of Shale
0 67.3 0.159 0.063 1.887 100-1000 470 4360 7.08% 4
4.36 62.94 0.159 0.063 1.887 100-1000 470 6640 7.08% 4
11 56.3 0.27 0.28 4.675 100-300 0 3100 0.00% 3
14.1 53.2 1.24 1.01 19.125200-1000 0 6130 0.00% 2
20.23 47.07 BH 07
Depth to top of unit (m)
RL top of unit)
Average a Average d
Unconfined Compressive Strength qu (MPa)
Defect Spacing (mm)
Sum of Seams (mm)
Lenth of the Interval (mm)
Seam (%)
Class of Shale
0 68.6 0.127 0.134 2.2185 100-800 420 6000 4.20% 36 62.6 0.127 0.134 2.2185 100-800 420 10000 4.20% 3 16 52.6 0.22 0.33 4.675 100-300 60 1200 5.00% 3
17.2 51.4 1.11 0.7 15.385 200-800 20 2390 0.84% 2 19.59 49.01 0
18
Appendix 7 Adopted Average Values of Point Load Strength Indexes (Interpretation)

19
20
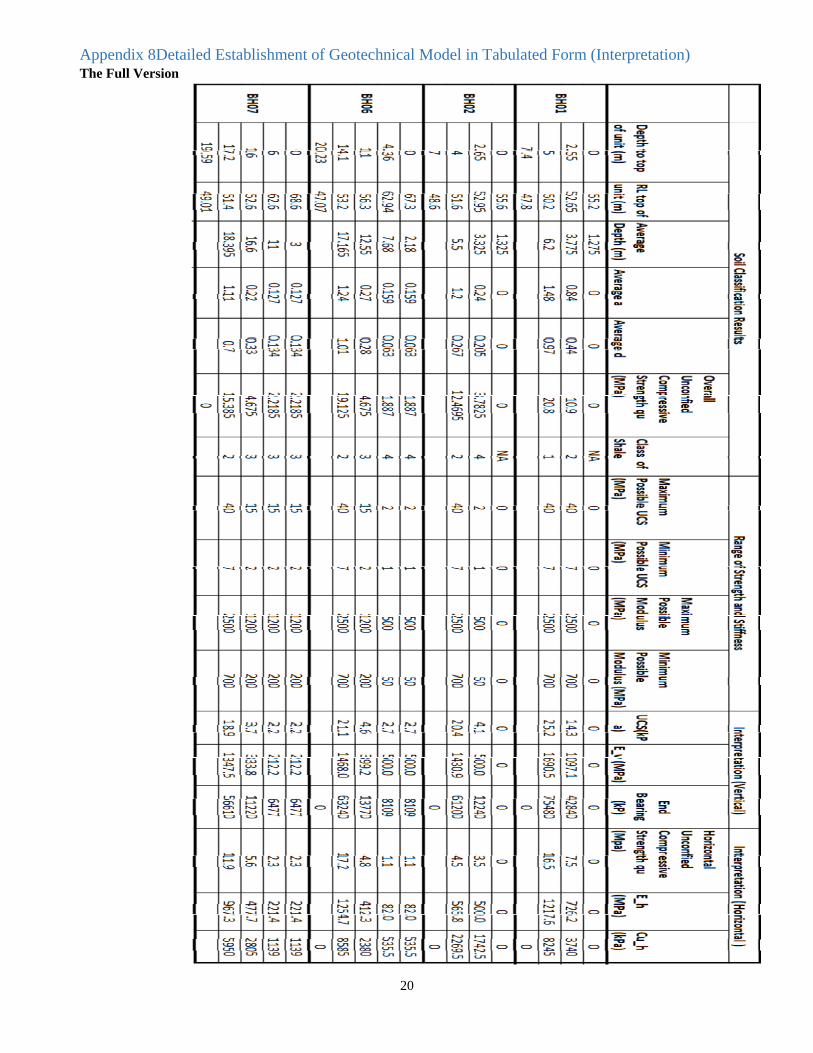
Appendix 8Detailed Establishment of Geotechnical Model in Tabulated Form (Interpretation) The Full Version

21
The Brief Version
Test Results Design Parameters
(Vertical) Design Parameters
(Horizontal)
Depth to top of unit (m)
RL top of unit) Length
Average a
Average d E_v (MPa)
End Bearing
(kPa) E_h (MPa) Cu_h (kPa)
BH01
0 55.2 2.55 0 0 0 0 0.0 0
2.55 52.65 2.45 0.84 0.44 1097 42840 726.2 3740
5 50.2 2.4 1.48 0.97 1691 75480 1217.6 8245
7.4 47.8
BH02
0 55.6 2.65 0 0 0 0 0.0 0
2.65 52.95 1.35 0.24 0.205 500 12240 500.0 1742.5
4 51.6 3 1.2 0.267 1431 61200 565.8 2269.5
7 48.6
BH06
0 67.3 4.36 0.159 0.063 500 8109 82.0 535.5
4.36 62.94 6.64 0.159 0.063 500 8109 82.0 535.5
11 56.3 3.1 0.27 0.28 399 13770 412.3 2380
14.1 53.2 6.13 1.24 1.01 1468 63240 1254.7 8585
20.23 47.07
BH07
0 68.6 6 0.127 0.134 212 6477 221.4 1139
6 62.6 10 0.127 0.134 212 6477 221.4 1139
16 52.6 1.2 0.22 0.33 334 11220 477.7 2805
17.2 51.4 2.39 1.11 0.7 1347 56610 967.3 5950
19.59 49.01

22
One Example to Show the Interpreatation Process (2.55-5 m in BH01)
1. This 2.55-5m is deemed as one layer because the material type description and values of point load strength Index are extremely similar within this interval.
2. The RL (Reduced Level) for this layer is read directly off from the borehole. 3. Average depth = 5-2.55 = 2.45m 4. Average a = 0.84 (average of all axial values within this layer, used to represent the entire layer) 5. Average d = 0.44 (average of all diametral values within this layer, used to represent the entire layer) 6. UCS_overall = 17*(0.84+0.44)/2 = 10.9 MPa 7. Class of Shale – 2 (obtained from the previous rock classification) 8. Max UCS = 40 MPa, Min UCS = 7 MPa (obtained from design tables in Appendix 5) 9. Max E = 2500MPa, Min E = 700MPa (obtained from design tables in Appendix 5) 10. UCS_vertical = average_a*17 = 0.84*17 = 14.3 MPa 11. E_v = (14.3-7)/(40-7)*100% * (2500-700) + 700 = 1097 MPa 12. End Bearing = 3*UCS_vertical = 3*14.3 = 42840 MPa 13. UCS_horizontal = average_d * 17 = 7.5MPa 14. E_h = (7.5-7)/(40-7)*100% * (2500-700) + 700 = 726 MPa 15. Cu = 0.5*UCS_horizontal = 7500*0.5 = 3740 kPa
It is important to note that relative E values, or E_actual/(Emax-Emin) are assumed to be proportional to
relative UCS values, or UCS_actual/(UCS_max – UCS_min)
The establishment of geotechnical model parameters in all other layers in every borehole follows exactly the same process as described above in the example.

23
Appendix 9 Evaluation of Strength Reduction Factors using AS 2159 (Interpretation)
Assumptions in the Evaluation of Strength Reduction Factors 1. There might be some variability over the site, but abrupt changes in stratigraphy exist in the field. 2. There is very limited amount of previous experience with similar foundations similar geological conditions 3. Both SLS and LSL are recognized as well-established and soundly based method of calculations 4. The level of construction control is relatively high. Professional geotechnical supervision is ensured and the
overall construction process are well established and relatively straightforward to be carried out 5. In terms of level of performance, there will be monitoring of the supported structure during and after
construction