fuel cell technologies and hydrogen production ... · cascade mints wp 1.5 common information...
TRANSCRIPT

CASCADE Mints
WP 1.5 Common Information Database
D 1.1 Fuel Cell Technologies and Hydrogen Production/Distribution Options
Wolfram Krewitt, DLR, Institute of Technical Thermodynamics, System Analysis and Technology Assessment
Stephan Schmid
DLR, Institute of Vehicle Concepts
Final Report, 2. September 2005


Contents 1 Fuel Cell Technologies ....................................................................................................1
1.1 Stationary fuel cell systems .....................................................................................2 1.1.1 Polymer electrolyte membrane fuel cells (PEMFC)........................................3 1.1.2 Phosphoric acid fuel cells (PAFC)...................................................................6 1.1.3 Molten Carbonate Fuel Cell (MCFC)..............................................................8 1.1.4 Solid Oxide Fuel Cells (SOFC) .....................................................................11 1.1.5 Other fuel cell technologies for stationary applications ................................16 1.1.6 Stationary fuel cells: summary of technical and economic data....................17
1.2 Fuel cell systems for automotive application ........................................................20 1.2.1 Polymer Electrolyte Fuel Cell (PEFC) system ..............................................20
2 Hydrogen engines for automotive application...............................................................27 2.1 Basic mechanism ...................................................................................................27 2.2 Examples of application.........................................................................................27 2.3 Technical data ........................................................................................................28 2.4 Economic data........................................................................................................29
3 Hydrogen Production Options .......................................................................................31 3.1 Hydrogen from Water ............................................................................................33
3.1.1 Electrolysis.....................................................................................................33 3.2 Hydrogen from Fossil Fuels ..................................................................................36
3.2.1 Natural gas steam reforming..........................................................................36 3.2.2 Partial oxidation of heavy oil.........................................................................38 3.2.3 Coal gasification ............................................................................................40 3.2.4 Pyrolysis.........................................................................................................44
3.3 Hydrogen from biomass.........................................................................................45 3.3.1 Biomass gasification and pyrolysis................................................................46
3.4 Other methods for hydrogen production................................................................50 3.4.1 Photoelectrochemical water splitting.............................................................50 3.4.2 Biological hydrogen production ....................................................................51 3.4.3 Hydrogen production from thermochemical cycle processes........................51
3.5 Summary: technical and economic characteristics of hydrogen production options 53
4 Hydrogen Storage Options.............................................................................................56 4.1 Liquefaction ...........................................................................................................56 4.2 Automotive On-board hydrogen storage ...............................................................61
4.2.1 Liquid hydrogen storage ................................................................................61 4.2.2 Gaseous hydrogen storage .............................................................................62 4.2.3 Storage in Metal Hydrides .............................................................................63 4.2.4 Storage in Metall Hydrides: Hydride Slurries ...............................................64 4.2.5 Other forms of hydrogen storage for automotive applications ......................65
4.3 Bulk storage of hydrogen.......................................................................................67 4.3.1 Liquid hydrogen storage ................................................................................67 4.3.2 Gaseous hydrogen storage in pressure vessels ..............................................71 4.3.3 Gaseous hydrogen storage underground........................................................74
5 Hydrogen delivery infrastructure...................................................................................77 5.1 Transport of hydrogen ...........................................................................................77

5.1.1 Hydrogen road transport ................................................................................77 5.1.2 Hydrogen ship transport.................................................................................82 5.1.3 Pipeline transport ...........................................................................................84
5.2 Dispensing of hydrogen .........................................................................................89 5.2.1 Gaseous hydrogen based filling stations........................................................90 5.2.2 Liquid hydrogen based filling stations...........................................................91
6 Costs of hydrogen production and supply .....................................................................95 7 References......................................................................................................................98


CASCADE Mints D1.1 Fuel cell technologies and H2 production/distribution options
1
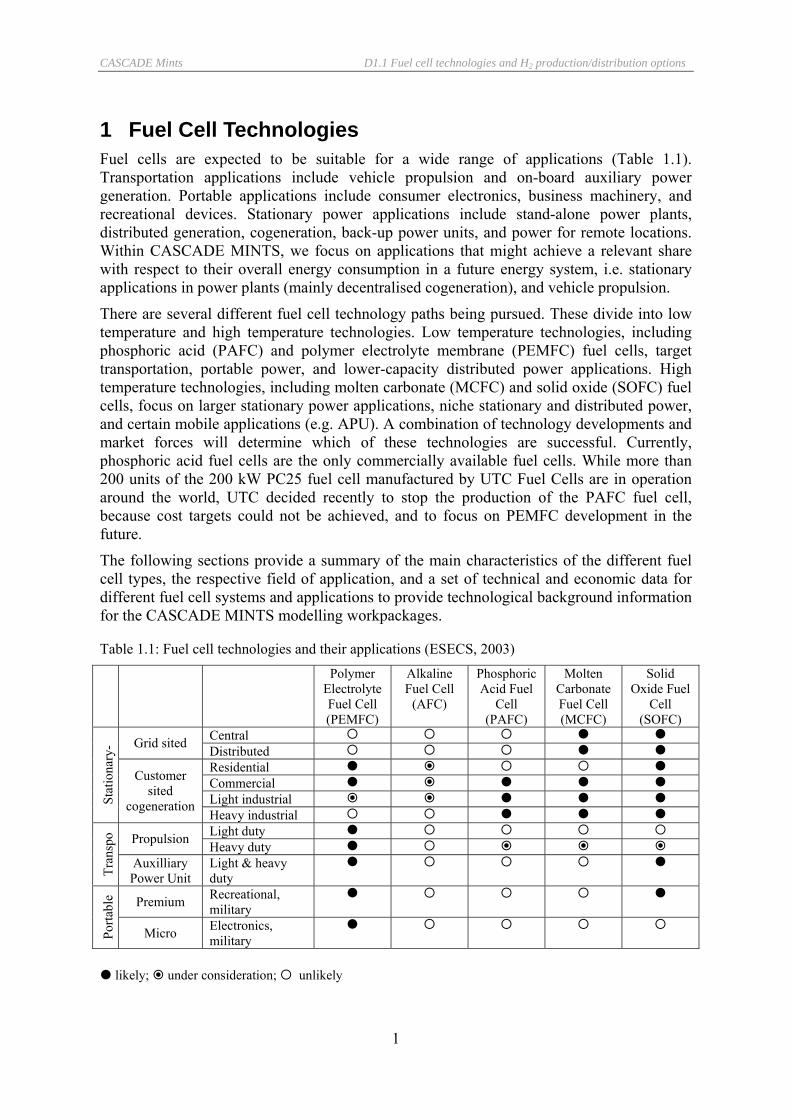
1 Fuel Cell Technologies Fuel cells are expected to be suitable for a wide range of applications (Table 1.1). Transportation applications include vehicle propulsion and on-board auxiliary power generation. Portable applications include consumer electronics, business machinery, and recreational devices. Stationary power applications include stand-alone power plants, distributed generation, cogeneration, back-up power units, and power for remote locations. Within CASCADE MINTS, we focus on applications that might achieve a relevant share with respect to their overall energy consumption in a future energy system, i.e. stationary applications in power plants (mainly decentralised cogeneration), and vehicle propulsion.
There are several different fuel cell technology paths being pursued. These divide into low temperature and high temperature technologies. Low temperature technologies, including phosphoric acid (PAFC) and polymer electrolyte membrane (PEMFC) fuel cells, target transportation, portable power, and lower-capacity distributed power applications. High temperature technologies, including molten carbonate (MCFC) and solid oxide (SOFC) fuel cells, focus on larger stationary power applications, niche stationary and distributed power, and certain mobile applications (e.g. APU). A combination of technology developments and market forces will determine which of these technologies are successful. Currently, phosphoric acid fuel cells are the only commercially available fuel cells. While more than 200 units of the 200 kW PC25 fuel cell manufactured by UTC Fuel Cells are in operation around the world, UTC decided recently to stop the production of the PAFC fuel cell, because cost targets could not be achieved, and to focus on PEMFC development in the future.
The following sections provide a summary of the main characteristics of the different fuel cell types, the respective field of application, and a set of technical and economic data for different fuel cell systems and applications to provide technological background information for the CASCADE MINTS modelling workpackages.
Table 1.1: Fuel cell technologies and their applications (ESECS, 2003)
Polymer Electrolyte Fuel Cell (PEMFC)
Alkaline Fuel Cell
(AFC)
Phosphoric Acid Fuel
Cell (PAFC)
Molten Carbonate Fuel Cell (MCFC)
Solid Oxide Fuel
Cell (SOFC)
Central Grid sited Distributed Residential Commercial Light industrial St
atio
nary
-
Customer sited
cogeneration Heavy industrial Light duty Propulsion Heavy duty
Tran
spo
Auxilliary Power Unit
Light & heavy duty
Premium Recreational, military
Porta
ble
Micro Electronics, military
likely; under consideration; unlikely

CASCADE Mints D1.1 Fuel cell technologies and H2 production/distribution options
2
1.1 Stationary fuel cell systems The following sections provide an overview on the state of the art and the current most relevant development paths with regard to stationary fuel cells. While there is still a considerable variety of competing fuel cell technologies, there are currently two main fields of application for stationary fuel cells: small scale house supply fuel cell heating appliances with a capacity of 1 to 5 kWel, and fuel cells of the 200 to 300 kWel class which can be used as a district heating CHP plant or for power and heat supply for commercial or industrial applications. It is possible that after a first successful market integration of high temperature fuel cells (MCFC,SOFC) of the 300 kWel class these technologies will expand towards the multi-Megawatt class.
All the fuel cell systems discussed below are in a very early phase of market introduction. The UTC 200 kW PAFC is the only stationary fuel cell system commercially available. Most of the other systems are currently tested in field trial programs, while for some fuel cell types there exist only first proof-of-concept demonstration plants. As a consequence, the availability of reliable data is poor. Taking into account the context of early market introduction, it is obvious that technical and economical data are quite sensitive, and thus in general a matter of confidentiality. It is difficult to assess to which extent specific data published by fuel cell manufacturers can be generalised or transferred into another context. Any data on current investment cost is uncertain, and the information on the cost structure given by different manufacturers seems to be partly contradicting.
The data given in the following sections was compiled largely during a recent German research project on long term perspectives of stationary fuel cells in Germany (Krewitt et al. 2004). The technical data and cost data underlying the analysis were reviewed in a workshop that took place in June 2003 in Stuttgart, with participation from fuel cell manufacturers and utilities. Although the workshop did not claim to achieve an explicit agreement on each data set, workshop participants in general agreed to the basic database used in the project. We thus conclude that an updated version of the database elaborated in (Krewitt et al. 2004) is a sound basis for the future work in CASCADE MINTS.
It is difficult to derive reliable estimates on operation and maintenance costs from the current pilot and demonstration plants. We expect that O&M costs during the fuel cell market introduction phase are higher than those of a conventional CHP unit, but that on the lung run O&M costs for the fuel cell system are lower because there are less moving components. We thus assume ‘generic’ O&M costs that are similar for all types of fuel cells, which are 5% of the investment costs per year during the early market introduction phase, and 2% of investment costs per year for a mature system.
Based on the description of the individual fuel cell technologies, section 1.1.6 provides a summary of the main technical and economic data for each type of fuel cell which can be used as an input to the energy models in CASCADE MINTS. Some of the data which are required for a consistent characterisation of the fuel cell technology in the model are not always directly available from the data sources (e.g. availability, stack lifetime), and are thus specified based on expert judgement. As some of the models to be used in CASCADE MINTS might not differ between different fuel cell technologies for the same applications, section 1.1.6 suggests also the specification of two ‘generic’ fuel cells for small scale heating appliances, and for cogeneration units of the 300 kW-class.
CASCADE Mints D1.1 Fuel cell technologies and H2 production/distribution options
3
1.1.1 Polymer electrolyte membrane fuel cells (PEMFC)
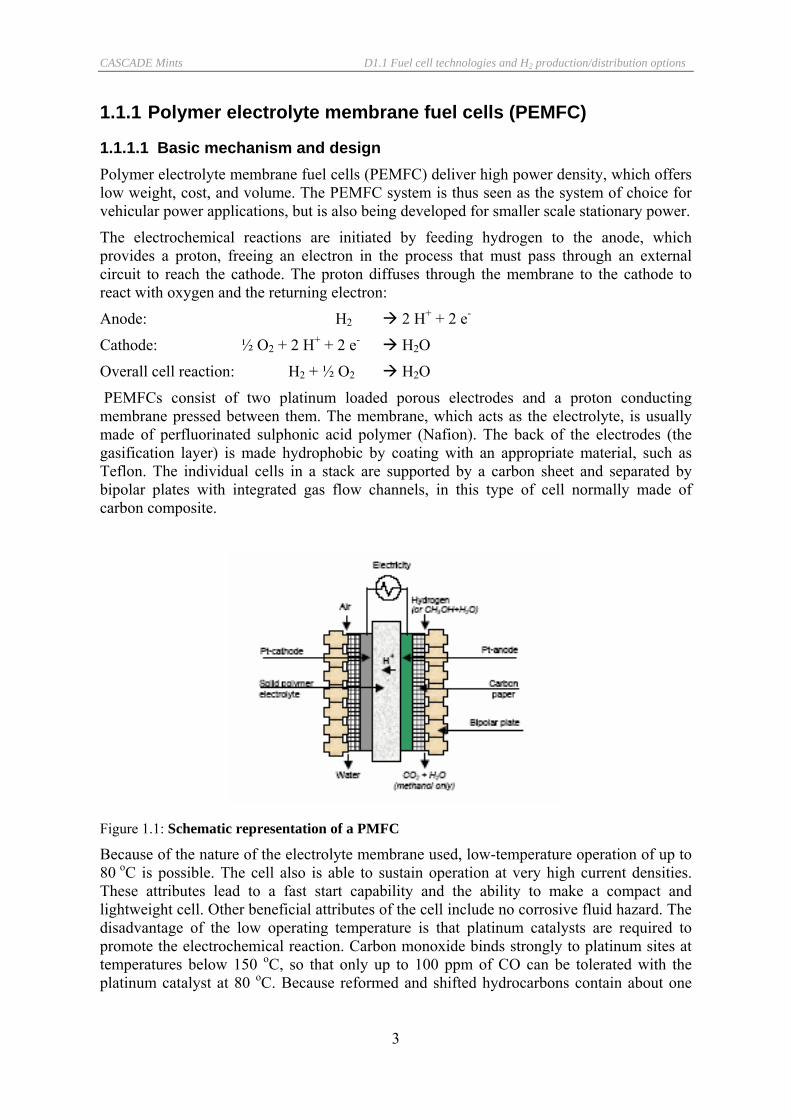
1.1.1.1 Basic mechanism and design Polymer electrolyte membrane fuel cells (PEMFC) deliver high power density, which offers low weight, cost, and volume. The PEMFC system is thus seen as the system of choice for vehicular power applications, but is also being developed for smaller scale stationary power.
The electrochemical reactions are initiated by feeding hydrogen to the anode, which provides a proton, freeing an electron in the process that must pass through an external circuit to reach the cathode. The proton diffuses through the membrane to the cathode to react with oxygen and the returning electron:
Anode: H2 2 H+ + 2 e-
Cathode: ½ O2 + 2 H+ + 2 e- H2O
Overall cell reaction: H2 + ½ O2 H2O
PEMFCs consist of two platinum loaded porous electrodes and a proton conducting membrane pressed between them. The membrane, which acts as the electrolyte, is usually made of perfluorinated sulphonic acid polymer (Nafion). The back of the electrodes (the gasification layer) is made hydrophobic by coating with an appropriate material, such as Teflon. The individual cells in a stack are supported by a carbon sheet and separated by bipolar plates with integrated gas flow channels, in this type of cell normally made of carbon composite.
Figure 1.1: Schematic representation of a PMFC
Because of the nature of the electrolyte membrane used, low-temperature operation of up to 80 oC is possible. The cell also is able to sustain operation at very high current densities. These attributes lead to a fast start capability and the ability to make a compact and lightweight cell. Other beneficial attributes of the cell include no corrosive fluid hazard. The disadvantage of the low operating temperature is that platinum catalysts are required to promote the electrochemical reaction. Carbon monoxide binds strongly to platinum sites at temperatures below 150 oC, so that only up to 100 ppm of CO can be tolerated with the platinum catalyst at 80 oC. Because reformed and shifted hydrocarbons contain about one
CASCADE Mints D1.1 Fuel cell technologies and H2 production/distribution options
4
percent of CO, a gas treatment to reduce the level of CO in the fuel gas is needed. The low temperature of operation also means that no significant contribution of waste heat from the fuel cell is available for any endothermic reforming process.
1.1.1.2 Fields of application A variety of stationary PEM-fuel cell systems are being developed (see section 1.2.1 for mobile applications). Various manufacturers (including e.g. Buderus/IFC, HGC, IDATECH, Nuvera, Vaillant, Plug Power, Ballard, Viessmann) aim at small scale house supply cogeneration systems with a capacity of 1 to 5 kWel. The fuel cell systems in general run on natural gas, and are equipped with a gas reformer integrated into the system. The systems are designed to operate to feed electricity into the utility grid (‘virtual power plant’).
Ballard Generation Systems developed a stationary PEMFC generator with a capacity of 250 kWel (P2B-PEM-FC). The system is designed to deliver power to the onsite power grid and to provide heat. A field trial programme with several units installed in the US and Europe was launched in 1999, and is expected to continue until 2004 (Ballard 2004).
1.1.1.3 Technical data Table 1.2 summarises the key technical data of PEMFC systems used for the two different types of application described above. Data are based on a review of technical data published from the various manufacturers. It should be noted that the electrical, thermal and overall efficiency depend on the intended application of the system (e.g. level of heat supply).
With regard to the house supply system, there are data available e.g. from the Vaillant’s field trial programme in Europe, which is supported by the European Commission. The Vaillant system is based on a PEM-fuel cell provided by Plug Power. A total of 31 Vaillant fuel-cell heating appliances have been installed by now in several European countries and linked with each other via a control centre to analyse how fuel cells can be run as a virtual power plant. 13 units of a 4.7 kWel system (“EURO1” version) were installed in the first half of 2003, and the installation of further 43 units (“EURO2”) started in November 2003. Measurement data from the EURO2 systems suggest that an electrical efficiency of up to 31 %, and a total efficiency of 88-89 % can be achieved. The lifetime of the stack is currently about 6,000 h, according to Vaillant a stack lifetime of 12,000 h seems to be realistic with an acceptable degradation (Klinder 2003). There are no published data available on the system’s availability.
Measured data from the Ballard 250 kWel P2B-PEM-FC operated in Berlin since June 2000, which was the first system installed in Europe, indicate that an electrical net efficiency of 33 to 34 % was achieved, with a total efficiency of more than 70 % (Pokojski 2001). The target electrical efficiency of a pressurised system is 40 %. The availability of the first pilot plant during the first time of operation was still low. There are no data open to the public on stack degradation.
1.1.1.4 Economic data The cost of the Plug Power 5 kWel fuel cell, which is used e.g. in the Vaillant system, is about 55,000 $, the specific costs are thus 11,000 $/kW (Fuel Cell Today 2002). Plug Power expects that still 4 to 7 years are required until a fuel cell heat appliance system is an economically viable option for the end-use costumer. Since January 2001, Vaillant could reduce the manufacturing costs of its fuel cell system by 50 % within 1.5 years (Klinder 2002). Target costs for the Vaillant fuel cell heat appliance system are given as 1,500 €/kW.

CASCADE Mints D1.1 Fuel cell technologies and H2 production/distribution options
5
Based on a detailed costs analysis, Siemens concludes that assuming a production volume of 50,000 units per year the costs for the individual components of a 5 kWel PEMFC system amount to at least 1,550 €/kW. It was assumed that the stack with 100 €/kW contributes to only about 6 % of the total system costs (Kabs 2002). Data from Viessmann indicate that the material costs for the current 2 kWel prototype are 6,100 €/kW if a product volume of 10,000 units per year is achieved, the material costs of the stack contribute about 20% of the total material costs (Britz 2003). The reformer costs contribute to about 8 to 10% of the total costs.
The total cost of the Ballard 250 kWel P2B-PEM-FC pilot plant which was put into operation in June 2000 in Berlin was about 3.8 Mill €, with about 5 % of the total costs allocated for planning and other services (Pokojski 2001). The specific system costs were thus about 14,000 €/kWel. There are no data available on operation and maintenance cost.
According to (Schmidt et al., 2002), stack costs of around 30 $/kW can be achieved in an automated mass production, leading to system costs of about 100 to 200 €/kW. We take this optimistic view as an indication of floor costs for small scale (1-5 kWel) PEM-systems for house applications.
Table 1.2: Technical data of PEMFC systems
1-5 kWel PEMFC fuel cell heat appliance
250 kWel PEMFC
state-of-the-art
long term target
state-of-the-art
long term target
Performance data Electrical capacity kWel 1-5 1-5 250 250 Electrical net efficiency % 28 32 35 42 Overall efficiency % 80 90 76 84 Stack lifetime h 10,000 40,000 40,000 Availability % Fuel processing Fuel natural gas natural gas, biogas Reforming steam reformer Steam reformer
Table 1.3: Cost estimates for PEMFC systems
1-5 kWel PEM-fuel cell heat appliance system
250 kWel PEMFC
Investment costs (system)
Cost estimates for current demonstration plants
€2000/kWel 11,500 14,000
Long term target costs €2000/kWel 1,500
Share of stack costs % 5-20 %
Share of reformer costs % 8-10 8-10
O&M fixed costs % Invest./a 2-5 2-5
O&M variable costs

CASCADE Mints D1.1 Fuel cell technologies and H2 production/distribution options
6
1.1.2 Phosphoric acid fuel cells (PAFC)
1.1.2.1 Basic mechanism and design The phosphoric acid fuel cell (PAFC) is the only fuel cell technology that is in commercialisation. There are over 75 MW of demonstrators worldwide. Most of the plants are in the 50 to 200 kW capacity range, but also larger plants in the multi-MW range have been build, the largest plant operated until today achieved a capacity of 11 MW (Ichihara, Japan; operated by Tokyo Electric Power Company; today out of order).
The electrochemical reactions occurring in PAFCs are the same as in PEMFCs:
Anode: H2 2H+ + 2e-
Cathode: ½ O2 + 2H+ + 2e- H2O
Overall cell reaction: ½ O2 + H2 H2O
The electrochemical reactions occur on highly dispersed electrocatalyst particles supported on carbon black. Platinum (Pt) or Pt alloys are used as the catalyst at both electrodes. To achieve high cell performance, temperatures of about 200 oC and acid concentrations of 100% H3PO4 are commonly used today (EG&G 2000).
The porous electrodes are made from a mixture of the electrocatalyst supported on carbon black and a polymeric binder, usually PTFE, which binds the carbon black particles together to form a mechanically stable but porous structure, which is supported on a porous carbon paper substrate. The carbon paper serves as a structural support for the electrocatalyst layer, as well as the current collector. The composite structure consisting of a carbon black black/PTFE layer on carbon paper substrate forms a stable, three-phase interface in the fuel cell, with H3PO4 electrolyte on one side (electrocatalyst side), and the reactant gas environment on the other side of the carbon paper. A bipolar plate serves to separate the individual cells and electrically connect them in series in a fuel cell stack. Several designs for the bipolar plate and ancillary stack components are used by fuel cell developers. The bipolar plates used in early PAFCs consisted of s single piece of graphite with gas channels machined on either side to direct the flow of fuel and oxidant gases in adjacent cells. In new designs, consisting of multi-component bipolar plates, a thin impervious plate separates the reactant gases in adjacent cells in the stack, and separate porous plates with ribbed channels are used to direct gas flows. In a cell stack, the impervious plate is subdivided into two parts, and each joins one of the porous plates (EG&G 2000).
In PAFC stacks, provision must be included to remove heat generated during cell operation. Heat has been removed by either liquid or gas coolants that are routed through cooling channels located in the cell stack. Liquid cooling requires complex manifolds and connections, but better heat removal is achieved compared to air cooling. The advantage of gas cooling is its simplicity, reliability, and relative low cost, but the size of the cell is limited.
1.1.2.2 Fields of Application The PAFC is available for commercial applications. UTC as the main manufacturer introduced the PC-25 200 kWel system, the world’s first commercially available fuel cell power plant, in 1991. Today, more than 250 units of the PC-25 have been delivered. These power plants operate independently or connected to the grid, partly as a co-generator with heat recovery, and it is used in numerous applications that require ‘premium’ power supply.

CASCADE Mints D1.1 Fuel cell technologies and H2 production/distribution options
7
1.1.2.3 Technical data Table 1.4 summarises the technical data of the current PC25TM as specified by UTC Fuel Cells (UTC 2004). The efficiency of the system is high over a wide range of load settings. The standard PC25 delivers product heat to a heat exchanger designed to provide 60 oC hot water to customer loads, a high-grade heat option is also provided that makes approximately half of the power plant heat available at temperatures up to 120 oC. Overhaul after 40,000 h includes replacement or factory refurbishment of the stack. Experience with the PC25 C system shows that power plant availability is > 90% (King and McDonald 2003). The system is designed to run on natural gas or anaerobic digester gas.
As the costs of the PC25 system could not be reduced as required to achieve significant market penetration, UTC announced in 2002 to phase out the production of PAFC systems. As a consequence we do not report any long term technical development targets.
Table 1.4: Technical data of PAFC system (UTC 2004), (King and McDonald 2003)
state-of-the-art long term target Performance data Electrical capacity kWel 200 Electrical net efficiency % 37 Overall efficiency % 87 Stack lifetime h 40,000 Availability % > 90 Fuel processing Fuel natural gas, anaerobic digester gas Reforming steam reformer
1.1.2.4 Economic data UTC reported costs for the 200 kWel PC25 unit to be approximately 850,000 $, the specific costs for the installed system are thus about 4,250 $/kW (UTC 2002). The cost of the PAFC power plant is approximately three times higher than required for significant market penetration. There is no unique component or system in the power plant that dominates the overall system costs. As mentioned above, in 2002 UTC announced to phase out the production of PAFCs because there is no realistic perspective to bring the costs down to the target costs, and to focus future fuel cell development activities towards the development of PEM-fuel cells.
As a consequence, we do not consider PAFCs as a priority technology for future developments, and we thus do not report technical data and target costs for future configurations.
CASCADE Mints D1.1 Fuel cell technologies and H2 production/distribution options
8
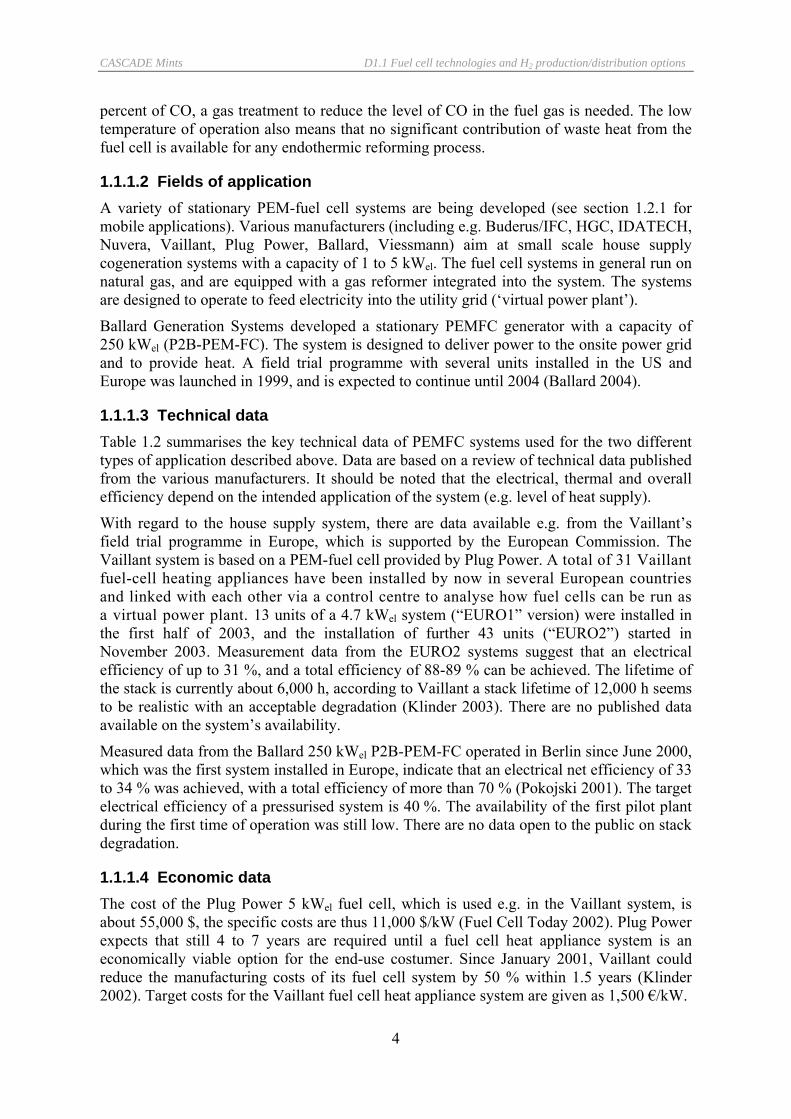
Table 1.5: Cost data for the PC25 fuel cell power plant (UTC 2002; own estimates)
Investment costs (system)
Current system costs €2000/kWel 4,460
Long term target costs €2000/kWel
Share of stack costs % 25
O&M fixed costs % Invest./a 2-5 O&M variable costs
1.1.3 Molten Carbonate Fuel Cell (MCFC)
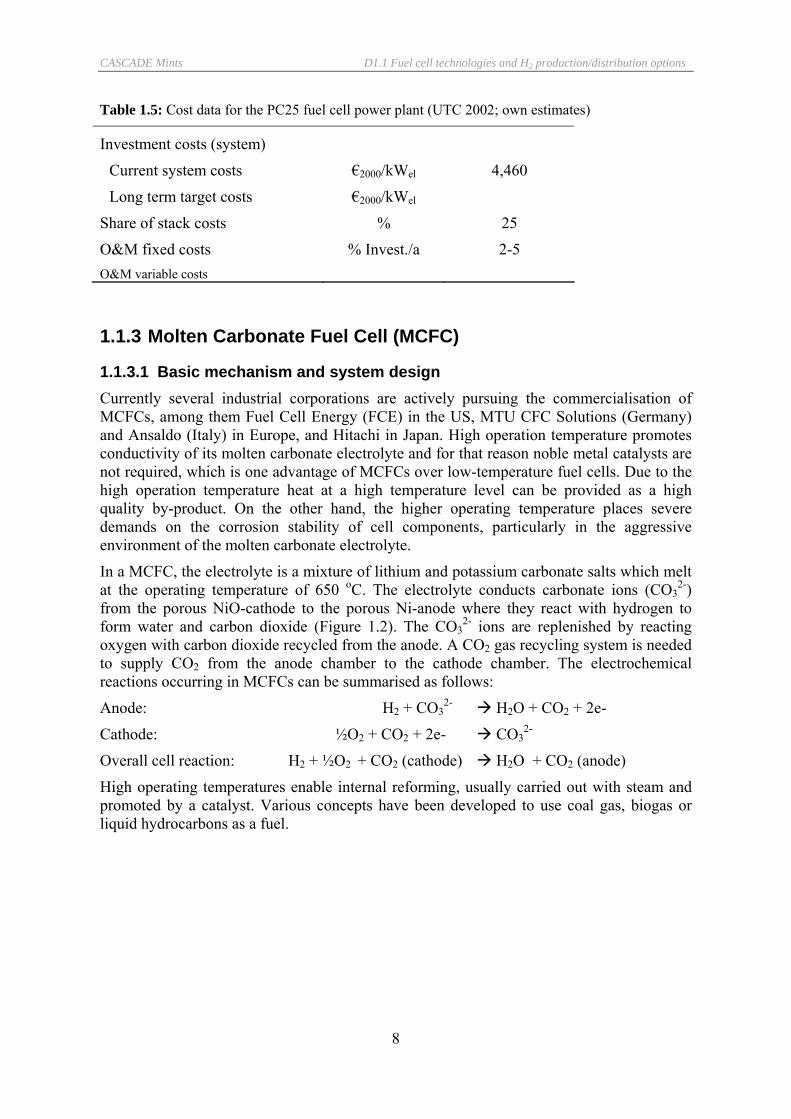
1.1.3.1 Basic mechanism and system design Currently several industrial corporations are actively pursuing the commercialisation of MCFCs, among them Fuel Cell Energy (FCE) in the US, MTU CFC Solutions (Germany) and Ansaldo (Italy) in Europe, and Hitachi in Japan. High operation temperature promotes conductivity of its molten carbonate electrolyte and for that reason noble metal catalysts are not required, which is one advantage of MCFCs over low-temperature fuel cells. Due to the high operation temperature heat at a high temperature level can be provided as a high quality by-product. On the other hand, the higher operating temperature places severe demands on the corrosion stability of cell components, particularly in the aggressive environment of the molten carbonate electrolyte.
In a MCFC, the electrolyte is a mixture of lithium and potassium carbonate salts which melt at the operating temperature of 650 oC. The electrolyte conducts carbonate ions (CO3
2-) from the porous NiO-cathode to the porous Ni-anode where they react with hydrogen to form water and carbon dioxide (Figure 1.2). The CO3
2- ions are replenished by reacting oxygen with carbon dioxide recycled from the anode. A CO2 gas recycling system is needed to supply CO2 from the anode chamber to the cathode chamber. The electrochemical reactions occurring in MCFCs can be summarised as follows:
Anode: H2 + CO32- H2O + CO2 + 2e-
Cathode: ½O2 + CO2 + 2e- CO32-
Overall cell reaction: H2 + ½O2 + CO2 (cathode) H2O + CO2 (anode)
High operating temperatures enable internal reforming, usually carried out with steam and promoted by a catalyst. Various concepts have been developed to use coal gas, biogas or liquid hydrocarbons as a fuel.

CASCADE Mints D1.1 Fuel cell technologies and H2 production/distribution options
9
Figure 1.2: Schematic representation of a MCFC
Figure 1.3: The MTU 250 kWel HotModule (MTU 2004)
1.1.3.2 Fields of application While several years ago according to market requirements development of MCFC power plants aimed at the multi-MW class, currently the 250 kW class for decentralised combined heat and power production is close to commercialisation. The largest number of demonstration plants today is based on the ‘HotModule’ concept developed by MTU CFC Solutions (which is based on cells from FCE), with currently 14 systems installed. Some of them are operated to provide premium power supply and combined heat and power for hospitals, which is a quite challenging supply task in terms of reliability. We thus take the technical data of the HotModule as a reference. Future developments will include an up-

CASCADE Mints D1.1 Fuel cell technologies and H2 production/distribution options
10
scaling of the system (MTU announced to produce a 1 MW system in 2006 (Berger 2003)), and the development of hybrid systems with a steam or gas turbine.
1.1.3.3 Technical data Measurement data on the HotModule demonstration plants, which run on natural gas, confirm that the relatively high electrical efficiency of 47% could be reached (Berger 2003). We assume that the CHP unit achieves an overall efficiency of 83%, with depleted air available at a temperature of 400 oC. There are no public data on availability and on stack degradation, but it is reported that the stack lifetime is still one of the main challenges. Similar to other fuel cell manufacturers, the target for the stack lifetime is given as 40,000 h.
As development activities mainly focus on increasing the electrical efficiency, it is expected that future developments will lead to an increase of the electrical efficiency by 5 percent points to 52%, while the overall efficiency increases to 86%. It is expected that a future hybrid system which combines a MCFC with a steam turbine will achieve an electrical efficiency of 55 to 56%, with an overall efficiency of 90%.
Table 1.6: Technical data of MCFC systems
250 kWel MCFC hybrid MCFC with steam turbine
state-of-the-art
long term target
2010 (?) long term target
Performance data Electrical power kWel 250 250 1,000 1,000 Electrical net efficiency % 47 52 55 56 Overall efficiency % 83 86 90 90 Stack lifetime h << 40,000 40,000 40,000 availability % 80 (?) 90 (80) 90 Fuel processing Fuel natural gas, biogas natural gas, biogas Desulphurisation Reforming internal reforming internal reforming
1.1.3.4 Economic data The system costs of the HotModule 2, which was put into operation 1999, and was the first system which was operated by the customer, were 2.9 Mill €, which is equivalent to specific investment costs of about 12.000 €/kW. The cost of the HotModule installed at the Los Angeles Department for Water and Power (LADWP) headquarters in 2000 was reported to amount to 2.4 Mill $ (MTU 2000). The stack costs are estimated to contribute about 30% of the total system costs. No data are available on operation and maintenance costs.
According to MTU, the target costs for a commercial product are below 1,250 €/kW. MTU expects to achieve this target once the production volume amount to 40 to 50 MW/a (Berger 2003), which is equivalent to the production of 160 to 200 systems per year.
CASCADE Mints D1.1 Fuel cell technologies and H2 production/distribution options
11
Table 1.7: Cost estimates for MCFC systems
250 kW MCFC 1 MW hybrid MCFC with steam turbine
Investment costs (system)
Cost estimates for current demonstration plants
€2000/kWel 12,000
Long term target costs €2000/kWel <1,250 <1,250
Share of stack costs % 30 30
O&M fixed costs % Invest./a 2-5 2-5
O&M variable costs
1.1.4 Solid Oxide Fuel Cells (SOFC)
1.1.4.1 Basic mechanism and system design Solid oxide fuel cells (SOFC) have grown in recognition as a viable high temperature fuel cell technology. There is no liquid electrolyte with its attendant specific corrosion and electrolyte management problems. The operating temperature of > 800 oC allows internal reforming, promotes rapid kinetics with non-precious materials, and produces as a high quality by-product high temperature heat. The high temperature of the SOFC, however, places stringent requirements on its materials, both with regard to the stack and the balance of plant components. The development of suitable low cost materials and the low cost fabrication of ceramic structures are presently the key technical challenges facing SOFCs.
The SOFC cell consists of a solid ceramic electrolyte (yttria stabilised ZrO2) pressed between a Ni/ZrO2 cermet anode (usually stabilised with Y2O3) and a strontium-doped lanthanum manganite cathode. The ionic conduction in SOFCs is by oxygen ions. Carbon monoxide (CO) and hydrocarbons such as methane (CH4) can be used as fuels in SOFCs.
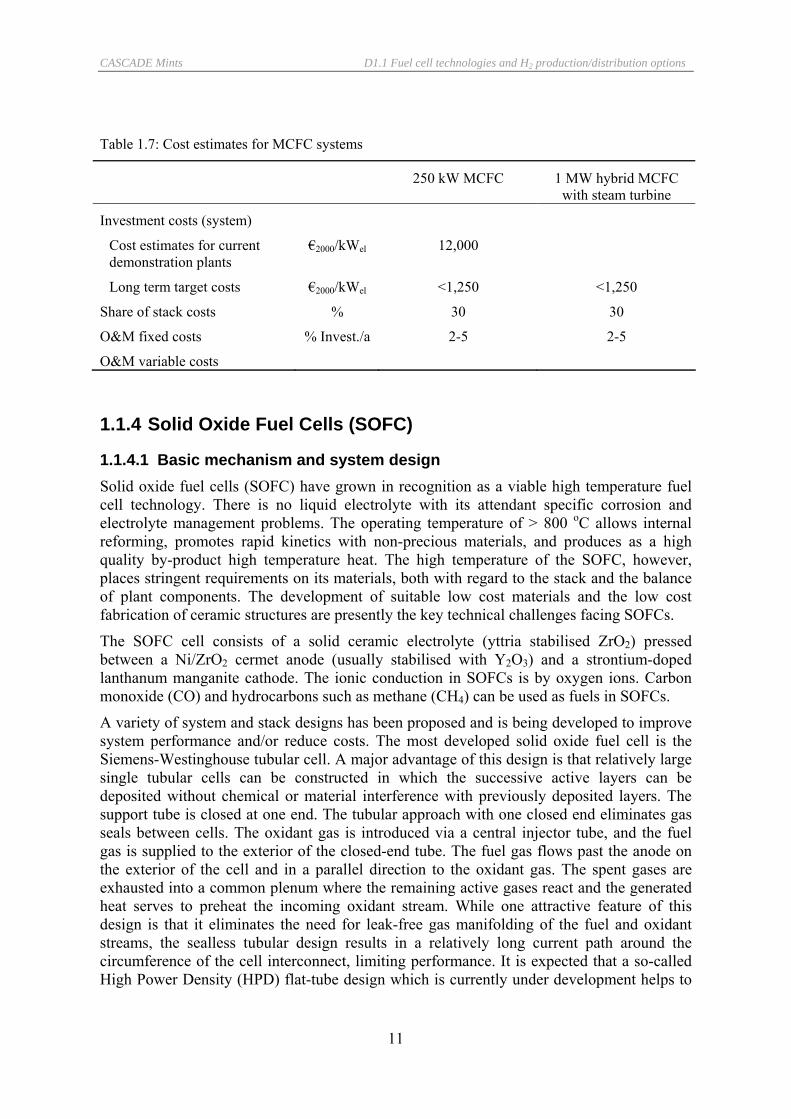
A variety of system and stack designs has been proposed and is being developed to improve system performance and/or reduce costs. The most developed solid oxide fuel cell is the Siemens-Westinghouse tubular cell. A major advantage of this design is that relatively large single tubular cells can be constructed in which the successive active layers can be deposited without chemical or material interference with previously deposited layers. The support tube is closed at one end. The tubular approach with one closed end eliminates gas seals between cells. The oxidant gas is introduced via a central injector tube, and the fuel gas is supplied to the exterior of the closed-end tube. The fuel gas flows past the anode on the exterior of the cell and in a parallel direction to the oxidant gas. The spent gases are exhausted into a common plenum where the remaining active gases react and the generated heat serves to preheat the incoming oxidant stream. While one attractive feature of this design is that it eliminates the need for leak-free gas manifolding of the fuel and oxidant streams, the sealless tubular design results in a relatively long current path around the circumference of the cell interconnect, limiting performance. It is expected that a so-called High Power Density (HPD) flat-tube design which is currently under development helps to
CASCADE Mints D1.1 Fuel cell technologies and H2 production/distribution options
12
overcome this limitations and increases the power density of the current cylindrical-tube cell design by a factor of two.
A bipolar or flat structure in contrast to the tubular concept permits a simple series electrical connection between cells without the need for external cell interconnections. Perpendicular current collection in a cell stack with a bipolar design should have a lower ohmic polarisation than the tubular configuration, and overall stack performance should be improved. However, gas leaks in a SOFC of bipolar configuration with compressive seals are difficult to prevent, and thermal stresses at the interface between dissimilar materials must be accommodated to prevent mechanical degradation of cell components.
If a SOFC is pressurised an increased voltage results, leading to improved performance (operation at 3 atmospheres e.g. increases the power output by ∼ 10%). The expense of pressurisation is in particular justified by the ability to integrate the SOFC with a gas turbine which needs a hot pressurised gas flow to operate. Since the SOFC stack operates at 1000 oC it produces a high temperature exhaust gas. If operated at elevated pressure the exhaust gas becomes a hot pressurised gas flow that can be used to drive the turbine. By integrating a SOFC and a gas turbine, the pressurised air needed by the SOFC is provided by the gas turbine’s compressor, the SOFC acts as the system combustor, and the exhaust from the SOFC drives the turbine, the compressor and the generator. This yields a hybrid cycle power system.
Source: Siemens Power Journal 1/2001
Figure 1.4: The Siemens-Westinghouse tubular SOFC design (Bessette et al. 2001)
CASCADE Mints D1.1 Fuel cell technologies and H2 production/distribution options
13
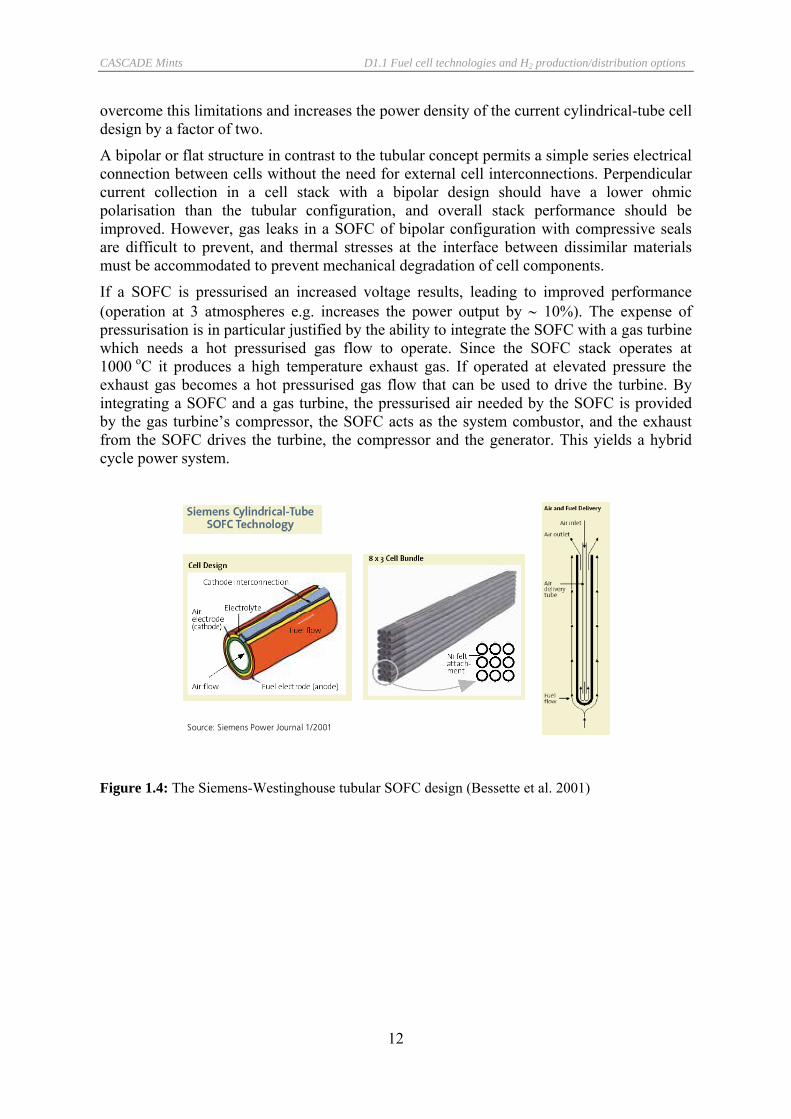
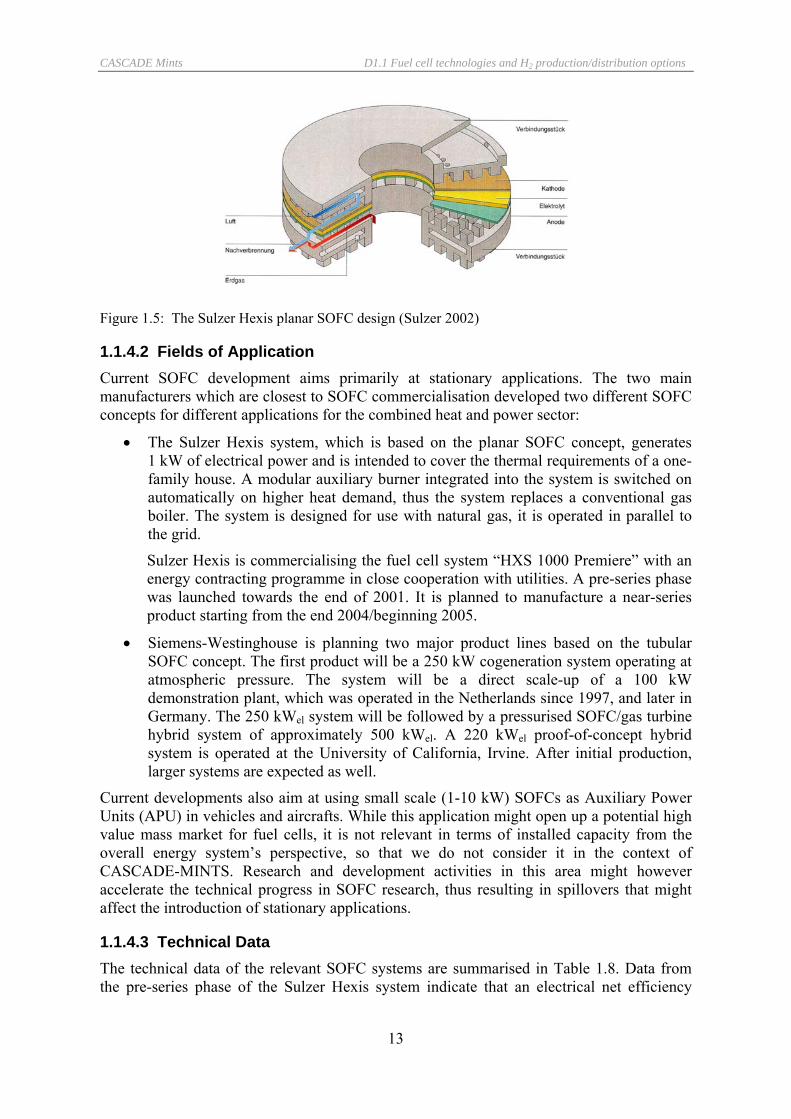
Figure 1.5: The Sulzer Hexis planar SOFC design (Sulzer 2002)
1.1.4.2 Fields of Application Current SOFC development aims primarily at stationary applications. The two main manufacturers which are closest to SOFC commercialisation developed two different SOFC concepts for different applications for the combined heat and power sector:
• The Sulzer Hexis system, which is based on the planar SOFC concept, generates 1 kW of electrical power and is intended to cover the thermal requirements of a one-family house. A modular auxiliary burner integrated into the system is switched on automatically on higher heat demand, thus the system replaces a conventional gas boiler. The system is designed for use with natural gas, it is operated in parallel to the grid.
Sulzer Hexis is commercialising the fuel cell system “HXS 1000 Premiere” with an energy contracting programme in close cooperation with utilities. A pre-series phase was launched towards the end of 2001. It is planned to manufacture a near-series product starting from the end 2004/beginning 2005.
• Siemens-Westinghouse is planning two major product lines based on the tubular SOFC concept. The first product will be a 250 kW cogeneration system operating at atmospheric pressure. The system will be a direct scale-up of a 100 kW demonstration plant, which was operated in the Netherlands since 1997, and later in Germany. The 250 kWel system will be followed by a pressurised SOFC/gas turbine hybrid system of approximately 500 kWel. A 220 kWel proof-of-concept hybrid system is operated at the University of California, Irvine. After initial production, larger systems are expected as well.
Current developments also aim at using small scale (1-10 kW) SOFCs as Auxiliary Power Units (APU) in vehicles and aircrafts. While this application might open up a potential high value mass market for fuel cells, it is not relevant in terms of installed capacity from the overall energy system’s perspective, so that we do not consider it in the context of CASCADE-MINTS. Research and development activities in this area might however accelerate the technical progress in SOFC research, thus resulting in spillovers that might affect the introduction of stationary applications.
1.1.4.3 Technical Data The technical data of the relevant SOFC systems are summarised in Table 1.8. Data from the pre-series phase of the Sulzer Hexis system indicate that an electrical net efficiency

CASCADE Mints D1.1 Fuel cell technologies and H2 production/distribution options
14
between 25 and 30 % were achieved. The development target is to achieve an electrical efficiency > 30 %, so that we assume a 32 % net electrical efficiency and a 90 % overall efficiency as a long term development perspective. The main problem of the per-series product is the high stack degradation, resulting in an average lifetime of the stack of only 2000 hours (Raak 2003). More than 90 % of the demonstration systems had an availability of more than 90 %.
There are currently two demonstration plants that can be used to get an indication of performance data of the Siemens-Westinghouse concept. A 100 kWel SOFC cogeneration unit was first operated by EDB/ELSAM in the Netherlands, and was moved in 2001 to Essen, Germany for operation by RWE. The demonstration plant has been operated since more than 20,000 hours, and achieved an electrical efficiency of 46 %. According to information from Siemens, a stack lifetime of more than 80,000 hours seems to be achievable already now with the Siemens-Westinghouse tubular stack concept (as a conservative estimate, we assume a stack lifetime of 40,000 hours for current state-of-the-art).
The first SOFC/gas turbine hybrid system is operated by Southern California Edison at the University of California. As of January 2002 the system has operated for more than 900 hours and has demonstrated 53 % electrical efficiency (Siemens 2004). It is expected that hybrid systems with a capacity of 1 MW can achieve an electrical capacity of 60 % using simple small gas turbines. At the 2 to 3 MW capacity level with larger, more sophisticated gas turbines analysis indicates that electrical efficiencies of 70 % or more are possible. However, the construction of a 1 MW “Mega-SOFC” in Marbach (near Stuttgart, Germany) which was planned to be brought into operation in 2003, had to be cancelled; the ‘official’ reason was that there was no appropriate micro-gas turbine available, but there are also doubts on whether cost targets could have been achieved.
Table 1.8: Technical data of SOFC systems
1 kWel SOFC single-family house
application
250 kWel atmospheric SOFC
pressurised hybrid SOFC
state-of-the-art
long term target
state-of-the-art
long term target
state-of-the-art
long term target
Performance data Electrical power (fuel cell) kWel 1 1 250 250 244 400 Gas turbine AC power kWel 65 100 Electrical net efficiency % 28 32 47 49 58 60 Overall efficiency % 80 90 80 85 80 85 Stack lifetime h 2,000 40,000 100,000 40,000 100,000 availability % > 90 Fuel processing Fuel natural gas natural gas, biogas natural gas, biogas Desulphurisation activated carbon Reforming steam reformer or
catalytic partial oxidation
internal reforming internal reforming
CASCADE Mints D1.1 Fuel cell technologies and H2 production/distribution options
15
1.1.4.4 Economic data Current cost estimates The costs for the 100 kW Siemens-Westinghouse demonstration plant which was put into operation in the Netherlands in 1998 were estimated to about 100,000 €/kWel by (Kuipers 1998). Investment costs for a today’s demonstration plant are estimated by Siemens to 10,000 to 25,000 $/kW. Costs for a first commercial market introduction shall be reduced to 6,000 $/kW, and the long term target costs are 1,000 kW for a CHP unit, and 500 $/kW for a small scale SOFC system (Kabs 2002), which we consider here as extremely optimistic. Based on the analysis of component costs, Siemens-Westinghouse expects that a turn-key-price of 1,300 $/kW for a 1-3 MW hybrid system (SOFC/gas turbine) can be realised if series production of 50 units per year is achieved (George a. Bessette 1998). Tanaka et al. (Tanaka et al. 2000) however estimate the investment costs for a 1 MW pressurised hybrid system to 4,900 $/kW. The costs for the stack are estimated to about 25 to 50 % of the total system costs, while the share of the gas turbine is about 35 %.
For planar concepts, prices for electrolyte-supported cells produced in batch wise series are in the range of 2,500 to 5,000 $/kW, whereas the prices of prototypes of anode-supported cells are in the order of 12,000 $/kW (Stöver et al. 2003). It is obvious that an order of magnitude cost reduction is still required to achieve commercially acceptable prices for the cells. Sulzer Hexis expects to reduce costs for the 1 kWel HXS Premiere system to 3,600 CHF until 2010 (Sulzer Hexis 2001).
Table 1.9: Cost estimates for SOFC systems
1 kW single-family house application
250 kW atmospheric CHP
unit
500 kW pressurised hybrid
CHP unit
Investment costs (system)
Cost estimates for current demonstration plants
€2000/kWel > 10,000 10,000-25,000 10,000-25,000
Target costs for market introduction
€2000/kWel 2,300 6,000 6,000
Long term target costs €2000/kWel ~ 1,000 ~ 1,000
Share of stack costs % 20-50 20-50
O&M fixed costs % Invest./a 2-5 2-5 2-5
O&M variable costs
Cost reduction perspectives In Siemens-Westinghouse tubular cells, the cost of powder for the cathode support structure dominates the material costs. Siemens is currently developing the so-called High-Power-Density (HPD)-tubes with a significantly higher power output per cell. It is expected that due to the new design the material costs can be reduced up to 50% (Stöver et al. 2003). For planar cells, the material cost per kW is already low compared to tubular cells. Materials cost reduction is probably only achievable through the use of cheaper (more impure) raw materials, or due to the introduction of innovative cell designs, which however would

CASCADE Mints D1.1 Fuel cell technologies and H2 production/distribution options
16
require the development of a completely new technology (comparable e.g. with crystalline silicon PV cells versus the development of thin film PV cells).
A reduction of tubular fuel cell manufacturing costs can be achieved by replacing the expensive electrochemical vapour deposition (EVD) process for depositing thin electrode and electrolyte layers, e.g. by plasma spraying. In combination with the use of HPD-tubes and the use of cheap cathode powders, and assuming mass production of at least 200,000 cells per year (i.e. 20 MWel/a), it is expected that the cell target costs of < 250 $/kWel might be reached (Stöver et al. 2003).
Large-scale manufacturing of planar SOFC components shows many similarities with manufacturing electronic components in the semi-conductor industry. Materials use of planar SOFC components are relatively small compared to tubular cells and manufacturing techniques such as tape casting and screen-printing are often cheap. However, in trying to reach the target costs, high volume manufacturing is probably not enough, but technical breakthrough will have to occur to further reduce manpower and material costs (Stöver et al. 2003). According to (Visco et al. 2003; Williams 2005), the cost goals of the US Solid State Energy Conversion Alliance (SECA) for planar solid oxide fuel cell systems are 400 $/kW, resulting in stack target costs of 140 $/kW. A recent modelling of SOFC stack costs by (Carlson et al. 2004), which is based on a detailed assessment of material and fabrication costs, suggests that stack costs of around 90 $/kW can be achieved at a production volume of 250 MW per annum. From our point of view these cost targets should be considered as very optimistic. We suggest to use them in CASCADE as an indication of floor costs for the generic large cogeneration fuel cell unit, which thus is around 300 €/kW.
Current manufacturing capacity for tubular fuel cells at Siemens Westinghouse is in the order of 3-15 MWel/a. For planar cells, several companies have invested in manufacturing capacities, with a total installed capacity worldwide in the order of 3-30 MWel/a of semi-continuous production lines.
1.1.5 Other fuel cell technologies for stationary applications In addition to the fuel cell technologies described above in detail, there are other fuel cell technologies that have been of importance in the past, or that are discussed as a future option. In the following we briefly discuss these fuel cell technologies, and we give some reasoning on why we do not include them as a promising option for further consideration in CASCADE MINTS:
Alkaline Fuel Cell (AFC). Like PEMFCs, alkaline fuel cells (AFC) are also low-temperature cells. They use an aqueous solution of potassium hydroxide (KOH) as the electrolyte, with concentrations ranging from 35-85 %, depending on the operating temperature. AFCs contain less noble metal catalyst material than PEMFCs. A major operating constraint for AFCs is the requirement for low carbon dioxide concentrations in the feed oxidant stream.
Although AFCs were one of the first fuel cells to be developed and used mainly in space and military applications, the interest in this type of fuel cells has diminished over the years. AFCs were considered to be too costly for commercial applications, and there are no significant advantages over PEM-fuel cells, so that current R&D activities clearly favour PEMFCs for low temperature fuel cell applications. Several companies however are examining ways to reduce costs and improve flexibility.

CASCADE Mints D1.1 Fuel cell technologies and H2 production/distribution options
17
Protonic Ceramic Fuel Cell (PCFC). This type of fuel cell is based on a ceramic electrolyte material that exhibits high protonic conductivity at elevated temperatures. PCFCs share the thermal and kinetic advantages of high temperature operation with molten carbonate and solid oxide fuel cells, but will not be able to use CO or hydrocarbons directly. Up to now there are no pilot applications from which any technical data of a future fuel cell system can be derived. The advantage over the well advanced MCFC and SOFC is not obvious.
1.1.6 Stationary fuel cells: summary of technical and economic data
The following Table 1.10 provides a summary of the key technical and economic data of the various fuel cell technologies for stationary application to be used as an input into the CASCADE-MINTS database. Note that data refer to the use of natural gas as a fuel. If the energy system models require a more aggregated representation of stationary fuel cells, based on the detailed data of the different types of fuel cells Table 1.11 suggests a specification of a generic small scale fuel cell heating application (1 to 5 kWel) and a larger fuel cell cogeneration unit (200 kWel to 5 MWel)

CASCADE Mints D1.1 Fuel cell technologies and H2 production/distribution options
18
Table 1.10: Stationary fuel cells: summary of technical and economic characteristics
Capacity elect. efficiency
overall efficiency
availability plant lifetime (system/stack)
investment costs
fixed O&M costs
variable O&M costs
kWel % % % a €2000/kWel % Invest./a PEMFC 1-5 kWel house supply system ‘today’ 1-5 28 80 < 80 15/2 11,500 5 2030 1-5 32 90 90 20/10 2 250 kWel system ‘today’ 250 35 76 < 80 15/2 14,000 5 2030 250 42 84 90 20/10 2 SOFC 1-5 kWel house supply system ‘today’ 1 28 80 80 15/1 10,000 5 2030 1 32 90 90 20/10 2 atmospheric SOFC, CHP unit ‘today’ 250 47 80 80 15/5 10,000 5 2030 250 49 85 90 20/10 2 pressurised hybrid SOFC ‘today’ 300 58 80 80 15/5 10,000 5 2030 500 60 85 90 20/10 2 PAFC PC25 200 kWel ‘today’ 200 37 87 90 15/2 4,500 3 MCFC 250 kWel system ‘today’ 250 47 83 80 15/3 12,000 5 2030 250 52 86 90 20/10 2 1 MW hybrid system 2010 (?) 1,000 55 90 80 15/5 5 2030 1,000 56 90 90 20/10 2

CASCADE Mints D1.1 Fuel cell technologies and H2 production/distribution options
19
Table 1.11: Characterisation of ‘generic’ stationary fuel cells for CASCADE MINTS
Capacity elect. efficiency
overall efficiency
availability lifetime (system/ stack)
investment costs
fixed O&M costs
variable O&M costs
Floor costs
kWel % % % a €2000/kWel % Invest./a €2000/kWel Small scale fuel cell heating appliance
‘today’ 1-5 28 80 80 15/2 11,000 5 2030 1-5 32 90 90 20/10 2 150 Fuel cell cogeneration unit ‘today’ (atmospheric system) 200-500 46 80 80 15/5 12,000 5 2030 (pressurised hybrid system) 200-5,000 58 87 90 20/10 2 300

CASCADE Mints D1.1 Fuel cell technologies and H2 production/distribution options
20
1.2 Fuel cell systems for automotive application
1.2.1 Polymer Electrolyte Fuel Cell (PEFC) system
1.2.1.1 Basic mechanism The basic mechanism of polymer electrolyte membrane fuel cells (PEFC) is described in section 1.1.1. on stationary fuel cell systems. For automotive applications PEFC can be applied also, however the main difference between stationary and automotive applications lies in the high degree of integration of system components in order to comply with the available space in a passenger car.
In order to operate a fuel cell stack in general, supplementary technical equipment is necessary. These equipment is composed of a stack cooling system, a cathode air supply compressor, sensors and control valves. In addition so called ancillary components or ‘Balance of plant’ (BOP) and efforts are needed to operate the fuel cell stack within an application: e.g. an electronic controller, a start-up battery, electrical equipment, safety equipment and system packaging. The figure below illustrates such a PEFC system with the stack and the surrounding controls.
Figure 1.6: 1.5 kW PEFC system (Source: DLR-FK)
1.2.1.2 Fields of application Polymer electrolyte fuel cell stacks are preferably used in fuel cell engines which are designed to be easily integrated into electric vehicles. Today, most of the fuel cell demonstration vehicles are custom build with an individual integration of components in the vehicle. Development towards modularisation and system integration however is the way forward in the future in order to fit in the concept of automobile manufacturing.
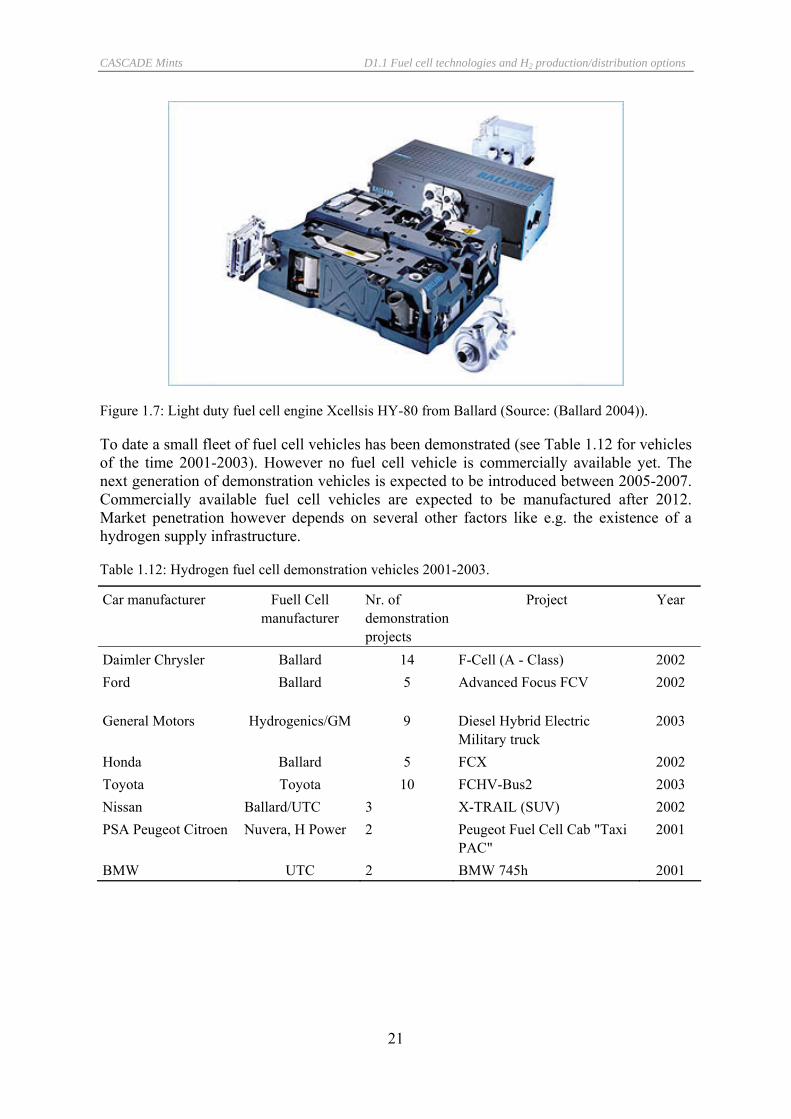
Fuel cell engines typically consist of the system module, the stack module, a control unit, power distribution unit (PDU) and a cooling pump, as shown in Figure 1.7 from Ballard. Ballard is today the world leader as a fuel cell system integrator.
CASCADE Mints D1.1 Fuel cell technologies and H2 production/distribution options
21
Figure 1.7: Light duty fuel cell engine Xcellsis HY-80 from Ballard (Source: (Ballard 2004)).
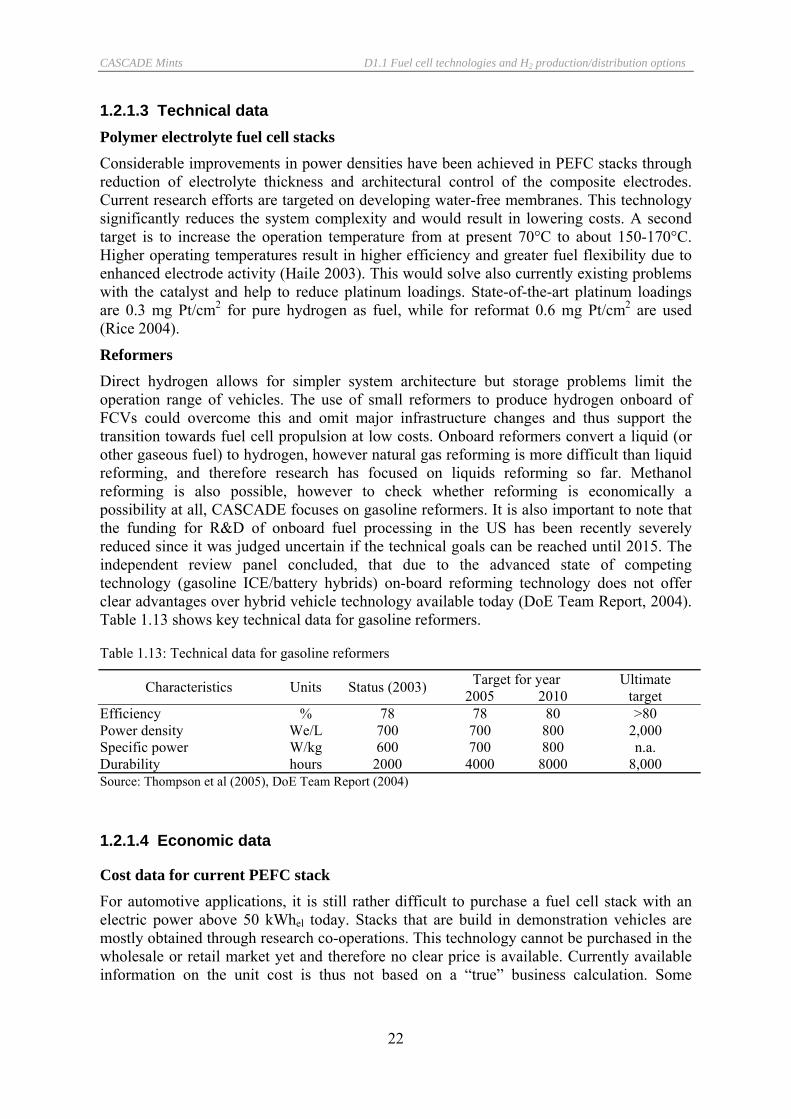
To date a small fleet of fuel cell vehicles has been demonstrated (see Table 1.12 for vehicles of the time 2001-2003). However no fuel cell vehicle is commercially available yet. The next generation of demonstration vehicles is expected to be introduced between 2005-2007. Commercially available fuel cell vehicles are expected to be manufactured after 2012. Market penetration however depends on several other factors like e.g. the existence of a hydrogen supply infrastructure.
Table 1.12: Hydrogen fuel cell demonstration vehicles 2001-2003.
Car manufacturer Fuell Cell manufacturer
Nr. of demonstration projects
Project Year
Daimler Chrysler Ballard 14 F-Cell (A - Class) 2002 Ford Ballard 5 Advanced Focus FCV 2002
General Motors Hydrogenics/GM 9 Diesel Hybrid Electric Military truck
2003
Honda Ballard 5 FCX 2002 Toyota Toyota 10 FCHV-Bus2 2003 Nissan Ballard/UTC 3 X-TRAIL (SUV) 2002 PSA Peugeot Citroen Nuvera, H Power 2 Peugeot Fuel Cell Cab "Taxi
PAC" 2001
BMW UTC 2 BMW 745h 2001
CASCADE Mints D1.1 Fuel cell technologies and H2 production/distribution options
22
1.2.1.3 Technical data Polymer electrolyte fuel cell stacks Considerable improvements in power densities have been achieved in PEFC stacks through reduction of electrolyte thickness and architectural control of the composite electrodes. Current research efforts are targeted on developing water-free membranes. This technology significantly reduces the system complexity and would result in lowering costs. A second target is to increase the operation temperature from at present 70°C to about 150-170°C. Higher operating temperatures result in higher efficiency and greater fuel flexibility due to enhanced electrode activity (Haile 2003). This would solve also currently existing problems with the catalyst and help to reduce platinum loadings. State-of-the-art platinum loadings are 0.3 mg Pt/cm2 for pure hydrogen as fuel, while for reformat 0.6 mg Pt/cm2 are used (Rice 2004).
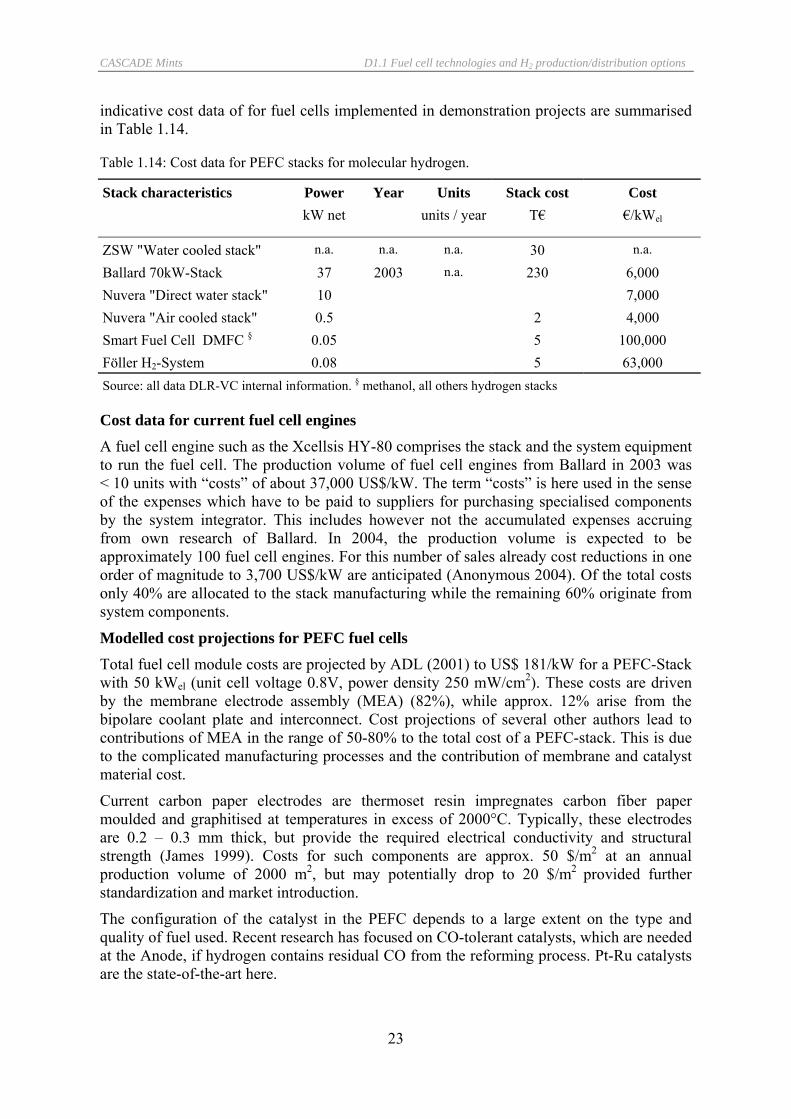
Reformers Direct hydrogen allows for simpler system architecture but storage problems limit the operation range of vehicles. The use of small reformers to produce hydrogen onboard of FCVs could overcome this and omit major infrastructure changes and thus support the transition towards fuel cell propulsion at low costs. Onboard reformers convert a liquid (or other gaseous fuel) to hydrogen, however natural gas reforming is more difficult than liquid reforming, and therefore research has focused on liquids reforming so far. Methanol reforming is also possible, however to check whether reforming is economically a possibility at all, CASCADE focuses on gasoline reformers. It is also important to note that the funding for R&D of onboard fuel processing in the US has been recently severely reduced since it was judged uncertain if the technical goals can be reached until 2015. The independent review panel concluded, that due to the advanced state of competing technology (gasoline ICE/battery hybrids) on-board reforming technology does not offer clear advantages over hybrid vehicle technology available today (DoE Team Report, 2004). Table 1.13 shows key technical data for gasoline reformers.
Table 1.13: Technical data for gasoline reformers
Target for year Ultimate Characteristics Units Status (2003) 2005 2010 target Efficiency % 78 78 80 >80 Power density We/L 700 700 800 2,000 Specific power W/kg 600 700 800 n.a. Durability hours 2000 4000 8000 8,000 Source: Thompson et al (2005), DoE Team Report (2004)
1.2.1.4 Economic data
Cost data for current PEFC stack For automotive applications, it is still rather difficult to purchase a fuel cell stack with an electric power above 50 kWhel today. Stacks that are build in demonstration vehicles are mostly obtained through research co-operations. This technology cannot be purchased in the wholesale or retail market yet and therefore no clear price is available. Currently available information on the unit cost is thus not based on a “true” business calculation. Some
CASCADE Mints D1.1 Fuel cell technologies and H2 production/distribution options
23
indicative cost data of for fuel cells implemented in demonstration projects are summarised in Table 1.14.
Table 1.14: Cost data for PEFC stacks for molecular hydrogen.
Stack characteristics Power Year Units Stack cost Cost kW net units / year T€ €/kWel
ZSW "Water cooled stack" n.a. n.a. n.a. 30 n.a. Ballard 70kW-Stack 37 2003 n.a. 230 6,000 Nuvera "Direct water stack" 10 7,000 Nuvera "Air cooled stack" 0.5 2 4,000 Smart Fuel Cell DMFC § 0.05 5 100,000 Föller H2-System 0.08 5 63,000 Source: all data DLR-VC internal information. § methanol, all others hydrogen stacks
Cost data for current fuel cell engines A fuel cell engine such as the Xcellsis HY-80 comprises the stack and the system equipment to run the fuel cell. The production volume of fuel cell engines from Ballard in 2003 was < 10 units with “costs” of about 37,000 US$/kW. The term “costs” is here used in the sense of the expenses which have to be paid to suppliers for purchasing specialised components by the system integrator. This includes however not the accumulated expenses accruing from own research of Ballard. In 2004, the production volume is expected to be approximately 100 fuel cell engines. For this number of sales already cost reductions in one order of magnitude to 3,700 US$/kW are anticipated (Anonymous 2004). Of the total costs only 40% are allocated to the stack manufacturing while the remaining 60% originate from system components.
Modelled cost projections for PEFC fuel cells Total fuel cell module costs are projected by ADL (2001) to US$ 181/kW for a PEFC-Stack with 50 kWel (unit cell voltage 0.8V, power density 250 mW/cm2). These costs are driven by the membrane electrode assembly (MEA) (82%), while approx. 12% arise from the bipolare coolant plate and interconnect. Cost projections of several other authors lead to contributions of MEA in the range of 50-80% to the total cost of a PEFC-stack. This is due to the complicated manufacturing processes and the contribution of membrane and catalyst material cost.
Current carbon paper electrodes are thermoset resin impregnates carbon fiber paper moulded and graphitised at temperatures in excess of 2000°C. Typically, these electrodes are 0.2 – 0.3 mm thick, but provide the required electrical conductivity and structural strength (James 1999). Costs for such components are approx. 50 $/m2 at an annual production volume of 2000 m2, but may potentially drop to 20 $/m2 provided further standardization and market introduction.
The configuration of the catalyst in the PEFC depends to a large extent on the type and quality of fuel used. Recent research has focused on CO-tolerant catalysts, which are needed at the Anode, if hydrogen contains residual CO from the reforming process. Pt-Ru catalysts are the state-of-the-art here.
CASCADE Mints D1.1 Fuel cell technologies and H2 production/distribution options
24
Almost all of the membranes contain the toxic element fluor. Therefore, the manufacturing process needs dedicated precautions to protect the environment, which adds also to the total costs for such systems. Research on fluor-free membranes is currently under way (e.g. by AXIVA). However interim results are not yet available since such membranes are still in development (Gerl 2002). Cost targets To compete with existing automotive propulsion systems, fuel cell systems for vehicle application will have to reach costs between $45 and $60/kW with a lifetime of 3,000 to 5,000 hours (Freund 2003). Current costs of conventional power trains are in the order of 35 €/kW.
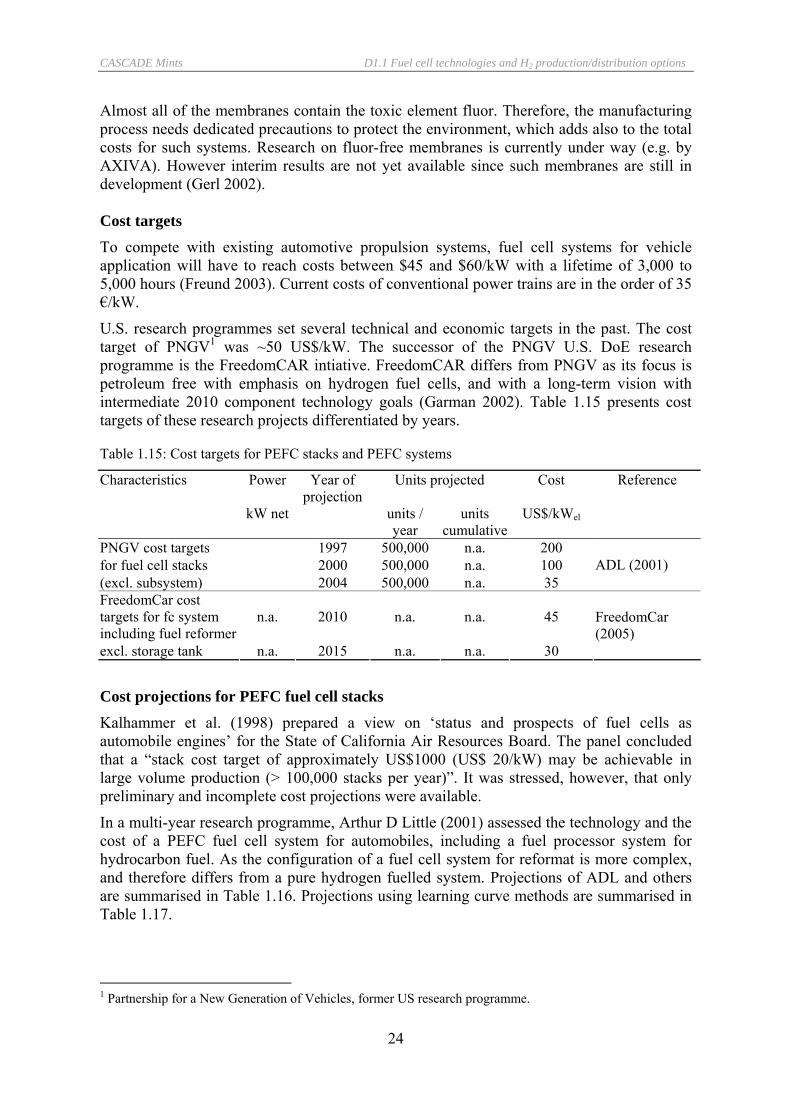
U.S. research programmes set several technical and economic targets in the past. The cost target of PNGV1 was ~50 US$/kW. The successor of the PNGV U.S. DoE research programme is the FreedomCAR intiative. FreedomCAR differs from PNGV as its focus is petroleum free with emphasis on hydrogen fuel cells, and with a long-term vision with intermediate 2010 component technology goals (Garman 2002). Table 1.15 presents cost targets of these research projects differentiated by years.
Table 1.15: Cost targets for PEFC stacks and PEFC systems
Characteristics Power Year of projection
Units projected Cost Reference
kW net units / year
units cumulative
US$/kWel
PNGV cost targets 1997 500,000 n.a. 200 for fuel cell stacks 2000 500,000 n.a. 100 (excl. subsystem) 2004 500,000 n.a. 35
ADL (2001)
FreedomCar cost targets for fc system including fuel reformer
n.a. 2010 n.a. n.a. 45
excl. storage tank n.a. 2015 n.a. n.a. 30
FreedomCar (2005)
Cost projections for PEFC fuel cell stacks Kalhammer et al. (1998) prepared a view on ‘status and prospects of fuel cells as automobile engines’ for the State of California Air Resources Board. The panel concluded that a “stack cost target of approximately US$1000 (US$ 20/kW) may be achievable in large volume production (> 100,000 stacks per year)”. It was stressed, however, that only preliminary and incomplete cost projections were available.
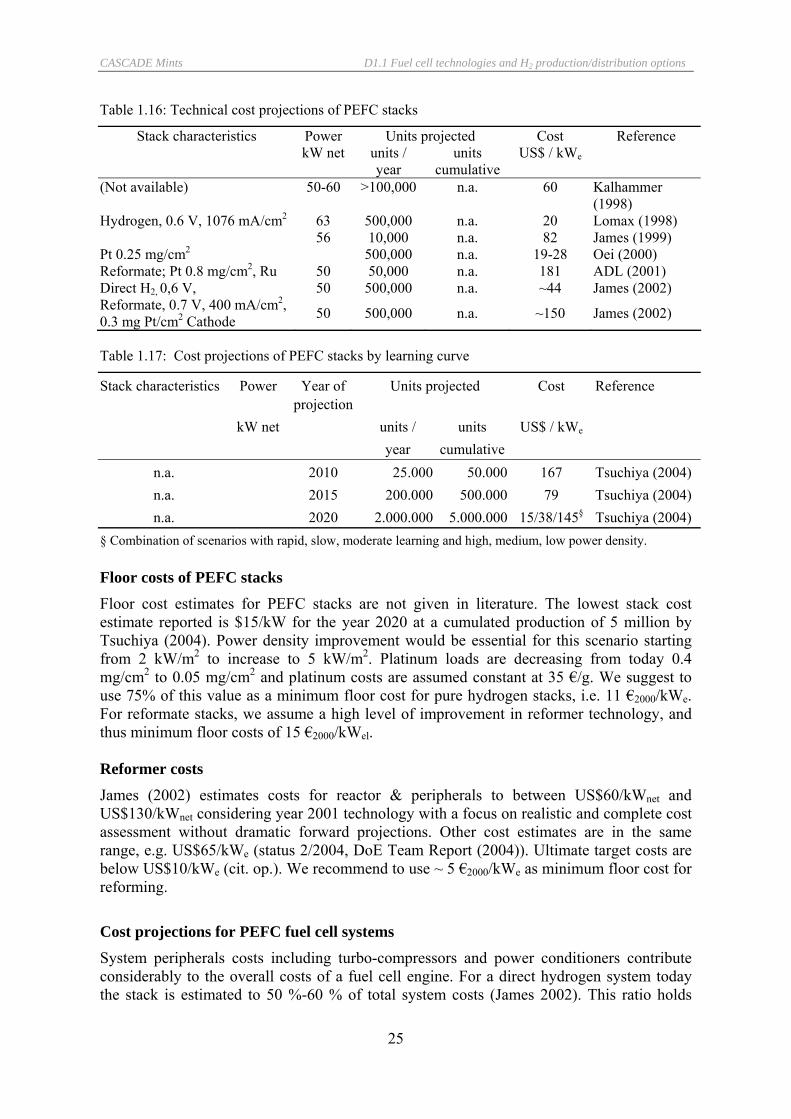
In a multi-year research programme, Arthur D Little (2001) assessed the technology and the cost of a PEFC fuel cell system for automobiles, including a fuel processor system for hydrocarbon fuel. As the configuration of a fuel cell system for reformat is more complex, and therefore differs from a pure hydrogen fuelled system. Projections of ADL and others are summarised in Table 1.16. Projections using learning curve methods are summarised in Table 1.17.
1 Partnership for a New Generation of Vehicles, former US research programme.
CASCADE Mints D1.1 Fuel cell technologies and H2 production/distribution options
25
Table 1.16: Technical cost projections of PEFC stacks
Stack characteristics Power Units projected Cost Reference kW net units /
year units
cumulative US$ / kWe
(Not available) 50-60 >100,000 n.a. 60 Kalhammer (1998)
Hydrogen, 0.6 V, 1076 mA/cm2 63 500,000 n.a. 20 Lomax (1998) 56 10,000 n.a. 82 James (1999) Pt 0.25 mg/cm2 500,000 n.a. 19-28 Oei (2000) Reformate; Pt 0.8 mg/cm2, Ru 50 50,000 n.a. 181 ADL (2001) Direct H2, 0,6 V, 50 500,000 n.a. ~44 James (2002) Reformate, 0.7 V, 400 mA/cm2, 0.3 mg Pt/cm2 Cathode 50 500,000 n.a. ~150 James (2002)
Table 1.17: Cost projections of PEFC stacks by learning curve
Stack characteristics Power Year of projection
Units projected Cost Reference
kW net units / year
units cumulative
US$ / kWe
n.a. 2010 25.000 50.000 167 Tsuchiya (2004) n.a. 2015 200.000 500.000 79 Tsuchiya (2004) n.a. 2020 2.000.000 5.000.000 15/38/145§ Tsuchiya (2004)
§ Combination of scenarios with rapid, slow, moderate learning and high, medium, low power density. Floor costs of PEFC stacks Floor cost estimates for PEFC stacks are not given in literature. The lowest stack cost estimate reported is $15/kW for the year 2020 at a cumulated production of 5 million by Tsuchiya (2004). Power density improvement would be essential for this scenario starting from 2 kW/m2 to increase to 5 kW/m2. Platinum loads are decreasing from today 0.4 mg/cm2 to 0.05 mg/cm2 and platinum costs are assumed constant at 35 €/g. We suggest to use 75% of this value as a minimum floor cost for pure hydrogen stacks, i.e. 11 €2000/kWe. For reformate stacks, we assume a high level of improvement in reformer technology, and thus minimum floor costs of 15 €2000/kWel. Reformer costs James (2002) estimates costs for reactor & peripherals to between US$60/kWnet and US$130/kWnet considering year 2001 technology with a focus on realistic and complete cost assessment without dramatic forward projections. Other cost estimates are in the same range, e.g. US$65/kWe (status 2/2004, DoE Team Report (2004)). Ultimate target costs are below US$10/kWe (cit. op.). We recommend to use ~ 5 €2000/kWe as minimum floor cost for reforming.
Cost projections for PEFC fuel cell systems System peripherals costs including turbo-compressors and power conditioners contribute considerably to the overall costs of a fuel cell engine. For a direct hydrogen system today the stack is estimated to 50 %-60 % of total system costs (James 2002). This ratio holds
CASCADE Mints D1.1 Fuel cell technologies and H2 production/distribution options
26
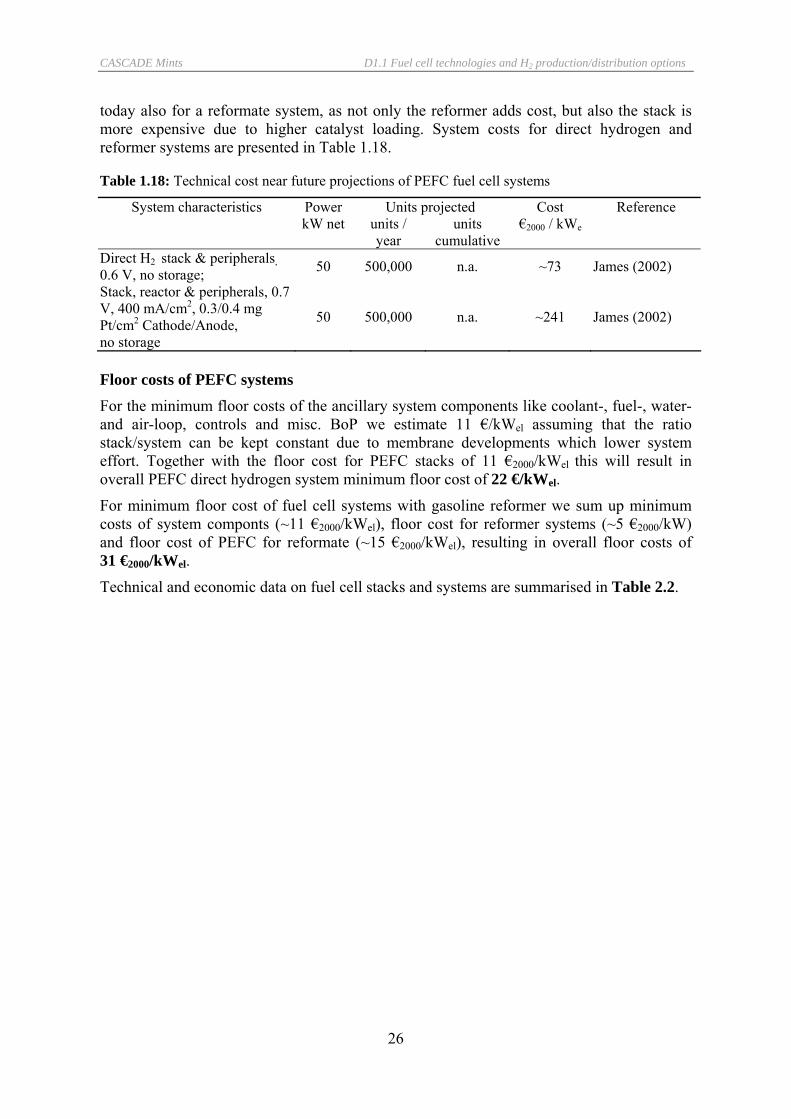
today also for a reformate system, as not only the reformer adds cost, but also the stack is more expensive due to higher catalyst loading. System costs for direct hydrogen and reformer systems are presented in Table 1.18.
Table 1.18: Technical cost near future projections of PEFC fuel cell systems
System characteristics Power Units projected Cost Reference kW net units /
year units
cumulative €2000 / kWe
Direct H2 stack & peripherals, 0.6 V, no storage; 50 500,000 n.a. ~73 James (2002)
Stack, reactor & peripherals, 0.7 V, 400 mA/cm2, 0.3/0.4 mg Pt/cm2 Cathode/Anode, no storage
50 500,000 n.a. ~241 James (2002)
Floor costs of PEFC systems For the minimum floor costs of the ancillary system components like coolant-, fuel-, water- and air-loop, controls and misc. BoP we estimate 11 €/kWel assuming that the ratio stack/system can be kept constant due to membrane developments which lower system effort. Together with the floor cost for PEFC stacks of 11 €2000/kWel this will result in overall PEFC direct hydrogen system minimum floor cost of 22 €/kWel.
For minimum floor cost of fuel cell systems with gasoline reformer we sum up minimum costs of system componts (~11 €2000/kWel), floor cost for reformer systems (~5 €2000/kW) and floor cost of PEFC for reformate (~15 €2000/kWel), resulting in overall floor costs of 31 €2000/kWel.
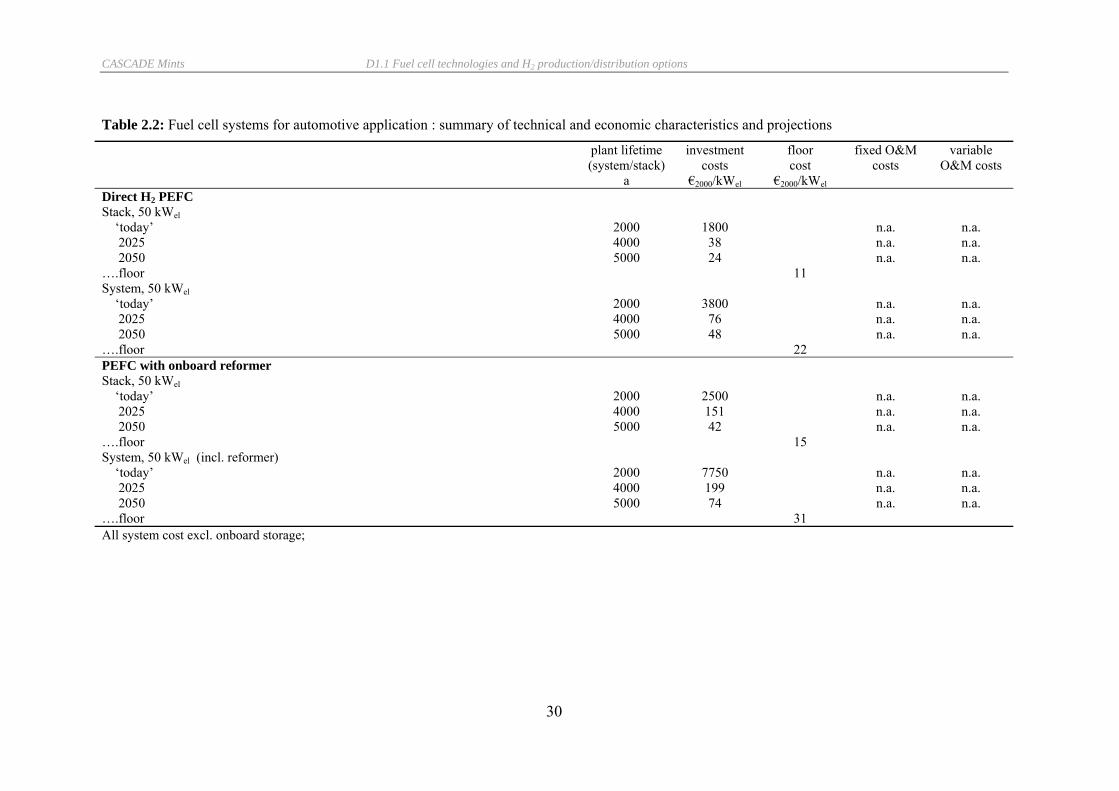
Technical and economic data on fuel cell stacks and systems are summarised in Table 2.2.
CASCADE Mints D1.1 Fuel cell technologies and H2 production/distribution options
27
2 Hydrogen engines for automotive application
2.1 Basic mechanism Hydrogen can be used as a fuel for internal combustion engines (H2ICE). The combination of hydrogen as an energy carrier with proven and well understood engine technologies is seen as an ultimate near-term solution which could bridge the gap up to the full development of fuel cell vehicles. Combustion of H2 in air produces water, non-methane volatile organic compounds and carbon monoxide below SULEV2 standard, but significant amounts of oxides of nitrogen. However given the inherent inefficiency of the internal combustion engine, H2ICE will not be able to provide such substantial emission reductions ‘well-to-wheel’ and efficient energy use than a fuel cell powered vehicle.
The use of hydrogen as an engine fuel has been addressed on a rather limited basis with varying degrees of success over several decades (Karim 2003). Hydrogen can be applied in conventional spark ignited piston engines as well as in compression ignition engines of dual fuel type, homogenous charge compression ignition engines (HCCI) and engines where ignition is effected through surface or catalytic ignition (Karim 2003).
There are numerous positive features of hydrogen as an ICE fuel, mostly related to its high burning rates. However there are also some disadvantages and limitations. Engines fuelled with hydrogen suffer from reduced power output, due mainly to the very low heating value of hydrogen on volume basis (Karim 2003). A hydrogen engine when operated stoichiometrically needs to be 40-60% larger in size than for gasoline for the same power and torque output. Knock is seen as problem in SI engines caused by auto-ignition of unburned mixture of gas (Karim 2003) however seems to be solved by engine manufacturers. Due to the volatile nature of the gas, there are serious potential operational problems with uncontrolled pre-ignition and back-firing on the intake manifold, which need to be addressed.
High temperatures may lead to high emissions of oxides of nitrogen. NOx emissions of 0.5 g/km are reported (RICARDO 2002) thus requiring a lean NOx trap or other NOx aftertreatment to meet EURO 4 and 5 standards.
2.2 Examples of application Prototype vehicles using hydrogen internal combustion engines have been demonstrated in the past by BMW, DaimlerCrysler, Mazda and Ford. BMW certainly has put the highest effort in H2ICEs, starting in 1979 and meanwhile presenting vehicles in the forth Generation (Scheuerer 2003). BMW presented a dual-fuel V12 hydrogen engine at IAA Frankfurt Motor Show 2003. DaimlerCrysler has stopped research on H2ICE and switched to FC engines.
Mazda, the world’s only manufacturer of rotary engines, has presented at the 2003 Tokyo Motor Show the hydrogen-powered version of the RENESIS as an example of a hydrogen-gasoline dual-fuel system (www.carpages.co.uk). The rotary engine can run on hydrogen with very little modification. It has the injection, compression, ignition and exhaust areas separated from each other so no pre-ignition of the gas occurs. Since the engine requires few
2 California’s "Super Ultra Low Emission Vehicle" standard for tailpipe emissions.
CASCADE Mints D1.1 Fuel cell technologies and H2 production/distribution options
28
modifications to run on hydrogen, it could enable production of a relatively low-cost hydrogen-powered alternative-fuel vehicle.
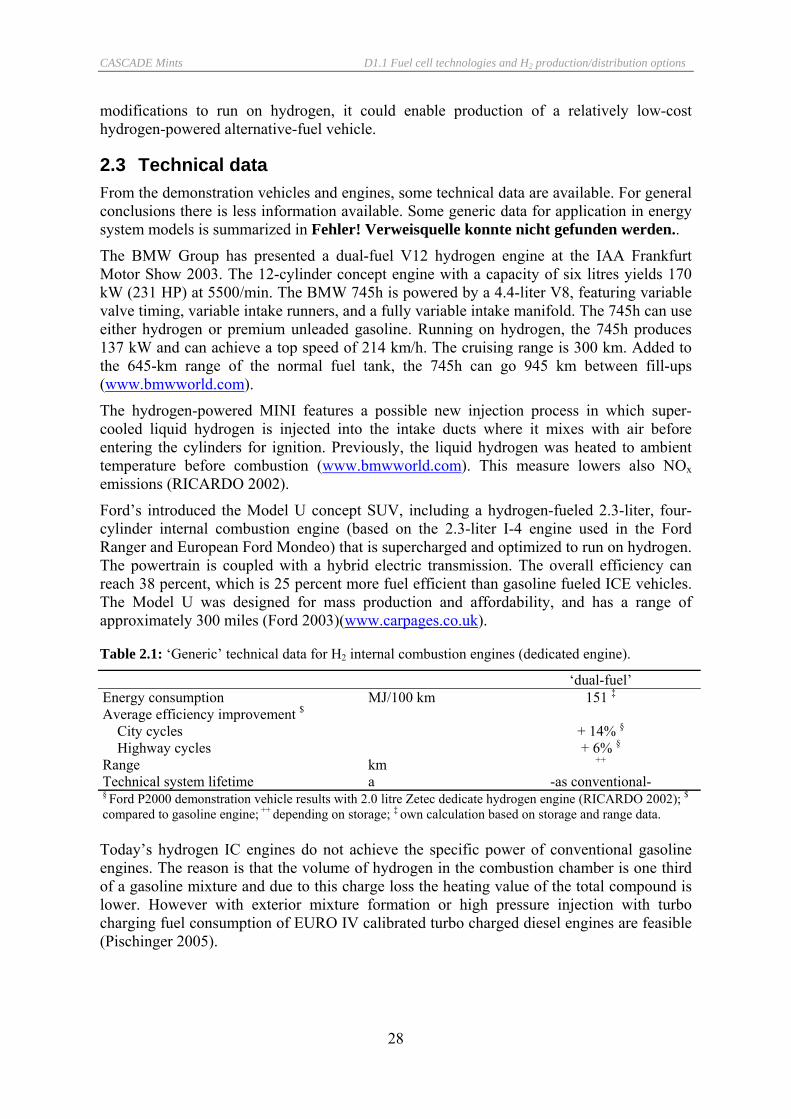
2.3 Technical data From the demonstration vehicles and engines, some technical data are available. For general conclusions there is less information available. Some generic data for application in energy system models is summarized in Fehler! Verweisquelle konnte nicht gefunden werden..
The BMW Group has presented a dual-fuel V12 hydrogen engine at the IAA Frankfurt Motor Show 2003. The 12-cylinder concept engine with a capacity of six litres yields 170 kW (231 HP) at 5500/min. The BMW 745h is powered by a 4.4-liter V8, featuring variable valve timing, variable intake runners, and a fully variable intake manifold. The 745h can use either hydrogen or premium unleaded gasoline. Running on hydrogen, the 745h produces 137 kW and can achieve a top speed of 214 km/h. The cruising range is 300 km. Added to the 645-km range of the normal fuel tank, the 745h can go 945 km between fill-ups (www.bmwworld.com).
The hydrogen-powered MINI features a possible new injection process in which super-cooled liquid hydrogen is injected into the intake ducts where it mixes with air before entering the cylinders for ignition. Previously, the liquid hydrogen was heated to ambient temperature before combustion (www.bmwworld.com). This measure lowers also NOx emissions (RICARDO 2002).
Ford’s introduced the Model U concept SUV, including a hydrogen-fueled 2.3-liter, four-cylinder internal combustion engine (based on the 2.3-liter I-4 engine used in the Ford Ranger and European Ford Mondeo) that is supercharged and optimized to run on hydrogen. The powertrain is coupled with a hybrid electric transmission. The overall efficiency can reach 38 percent, which is 25 percent more fuel efficient than gasoline fueled ICE vehicles. The Model U was designed for mass production and affordability, and has a range of approximately 300 miles (Ford 2003)(www.carpages.co.uk).
Table 2.1: ‘Generic’ technical data for H2 internal combustion engines (dedicated engine).
‘dual-fuel’ Energy consumption MJ/100 km 151 ‡ Average efficiency improvement $ City cycles + 14% § Highway cycles + 6% § Range km ++
Technical system lifetime a -as conventional- § Ford P2000 demonstration vehicle results with 2.0 litre Zetec dedicate hydrogen engine (RICARDO 2002); $
compared to gasoline engine; ++ depending on storage; ‡ own calculation based on storage and range data. Today’s hydrogen IC engines do not achieve the specific power of conventional gasoline engines. The reason is that the volume of hydrogen in the combustion chamber is one third of a gasoline mixture and due to this charge loss the heating value of the total compound is lower. However with exterior mixture formation or high pressure injection with turbo charging fuel consumption of EURO IV calibrated turbo charged diesel engines are feasible (Pischinger 2005).
CASCADE Mints D1.1 Fuel cell technologies and H2 production/distribution options
29
2.4 Economic data Economic data on hydrogen internal combustion engines are scarce. Difiglio (2003) suggest additional cost in a range between of $0-1,000 over conventional ICE. RICARDO (2002) used a reduction of 400 €2000 in their analysis for the year 2008 for an advanced H2ICE compared to a Diesel engine with expensive fuel injection system. However at this stage already 800 € were include for the lean NOx trap (LNT) and a Diesel particle filter. RICARDO (2002) concludes also: “there would be a cost penalty due to the introduction of an LNT and addition of a boosting system”.
Therefore we suggest until better data is available to use additional costs of 750 € compared to conventional gasoline engines due to the boosting system and LNT for energy system modelling. On the long run, no additional costs for the engine compared to a future diesel engine with supercharging can be assumed.
We don’t see any significant changes on O&M fixed and O&M variable costs for the H2ICE compared to conventional gasoline engines. Operation on hydrogen has no fundamental implications on cost, durability and recyclability of the engine (RICARD 2002).
CASCADE Mints D1.1 Fuel cell technologies and H2 production/distribution options
30
Table 2.2: Fuel cell systems for automotive application : summary of technical and economic characteristics and projections
plant lifetime (system/stack)
investment costs
floor cost
fixed O&M costs
variable O&M costs
a €2000/kWel €2000/kWel Direct H2 PEFC Stack, 50 kWel ‘today’ 2000 1800 n.a. n.a. 2025 4000 38 n.a. n.a. 2050 5000 24 n.a. n.a. ….floor 11 System, 50 kWel ‘today’ 2000 3800 n.a. n.a. 2025 4000 76 n.a. n.a. 2050 5000 48 n.a. n.a. ….floor 22 PEFC with onboard reformer Stack, 50 kWel ‘today’ 2000 2500 n.a. n.a. 2025 4000 151 n.a. n.a. 2050 5000 42 n.a. n.a. ….floor 15 System, 50 kWel (incl. reformer) ‘today’ 2000 7750 n.a. n.a. 2025 4000 199 n.a. n.a. 2050 5000 74 n.a. n.a. ….floor 31 All system cost excl. onboard storage;
CASCADE Mints D1.1 Fuel cell technologies and H2 production/distribution options
31
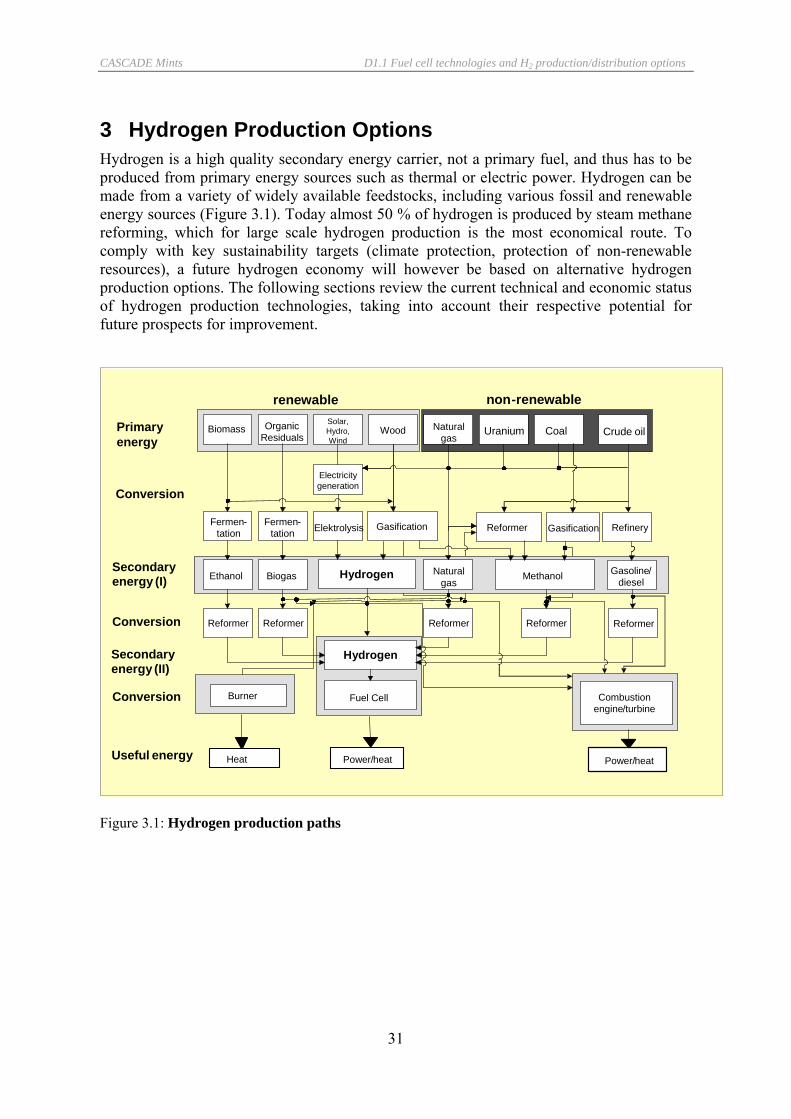
3 Hydrogen Production Options Hydrogen is a high quality secondary energy carrier, not a primary fuel, and thus has to be produced from primary energy sources such as thermal or electric power. Hydrogen can be made from a variety of widely available feedstocks, including various fossil and renewable energy sources (Figure 3.1). Today almost 50 % of hydrogen is produced by steam methane reforming, which for large scale hydrogen production is the most economical route. To comply with key sustainability targets (climate protection, protection of non-renewable resources), a future hydrogen economy will however be based on alternative hydrogen production options. The following sections review the current technical and economic status of hydrogen production technologies, taking into account their respective potential for future prospects for improvement.
Biomass OrganicResiduals
Solar, Hydro, Wind
Wood Naturalgas
Uranium Coal Crude oil
Fermen-tation
Fermen-tation Elektrolysis Gasification GasificationReformer
Reformer Reformer Reformer Reformer Reformer
renewable non-renewable
Ethanol Biogas Methanol Gasoline/ diesel
Naturalgas
Hydrogen
Hydrogen
Fuel Cell
Primaryenergy
Secondaryenergy (I)
Secondaryenergy (II)
Useful energy
Refinery
Electricitygeneration
Conversion
Power/heat
Combustionengine/turbine
Power/heat
Burner
Heat
Conversion
Conversion
Figure 3.1: Hydrogen production paths
CASCADE Mints D1.1 Fuel cell technologies and H2 production/distribution options
32
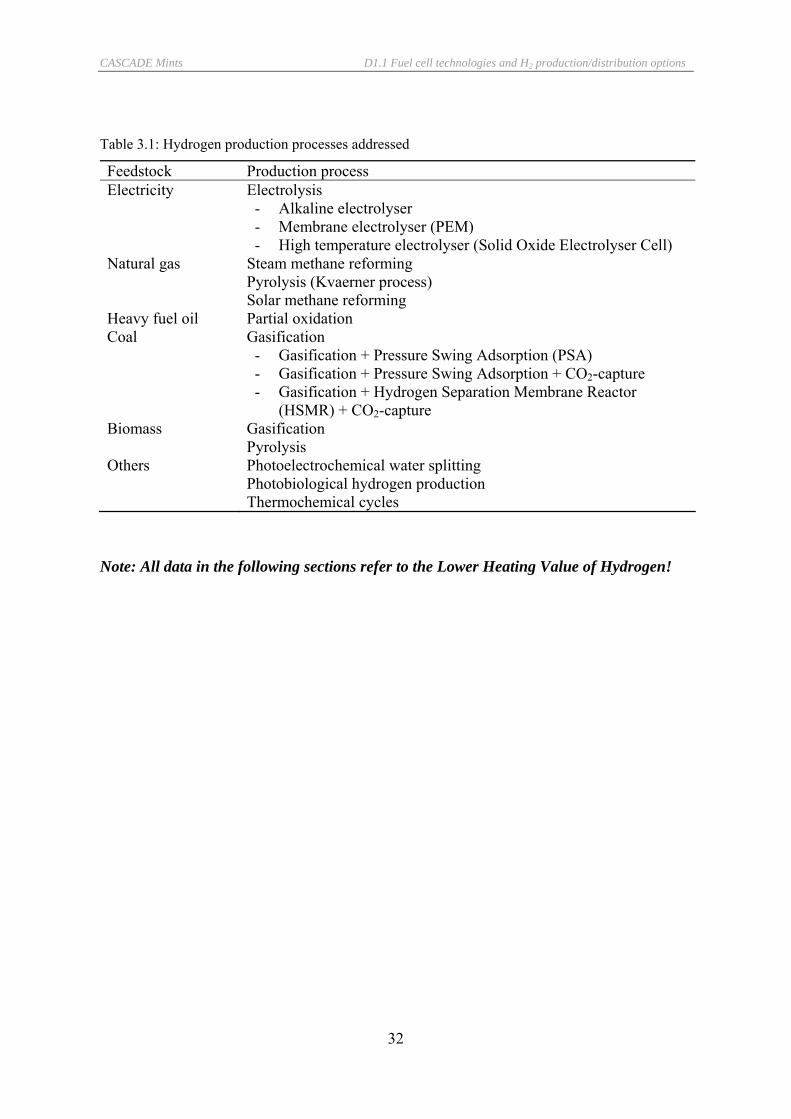
Table 3.1: Hydrogen production processes addressed
Feedstock Production process Electricity Electrolysis
- Alkaline electrolyser - Membrane electrolyser (PEM) - High temperature electrolyser (Solid Oxide Electrolyser Cell)
Natural gas Steam methane reforming Pyrolysis (Kvaerner process) Solar methane reforming
Heavy fuel oil Partial oxidation Coal Gasification
- Gasification + Pressure Swing Adsorption (PSA) - Gasification + Pressure Swing Adsorption + CO2-capture - Gasification + Hydrogen Separation Membrane Reactor
(HSMR) + CO2-capture Biomass Gasification
Pyrolysis Others Photoelectrochemical water splitting
Photobiological hydrogen production Thermochemical cycles
Note: All data in the following sections refer to the Lower Heating Value of Hydrogen!
CASCADE Mints D1.1 Fuel cell technologies and H2 production/distribution options
33
3.1 Hydrogen from Water
3.1.1 Electrolysis
3.1.1.1 Basic mechanism Water is electrolysed in an electrochemical cell to produce hydrogen and oxygen. Water electrolysis was one of the main means of hydrogen production before the steam reforming process was introduced..
Water can be electrolysed by passing direct current (DC) through it in the presence of a suitable electrolyte, causing positively charged hydrogen ions to migrate to the negatively charged cathode, where they reduce to form hydrogen. Similarly, oxygen is formed at the positively charged anode. Chemically inert conductors such as platinum are used as electrodes to avoid unwanted reactions and the production of impurities in the hydrogen gas.
Anode: 2 H2O O2 + 4 H+ + 4 e-
Cathode: 4 H+ + 4 e- 2 H2
Overall reaction: 2 H2O 2 H2 + O2
Three different process versions have been developed for electrolytic water dissociation:
• Alkaline water electrolysers are in use commercially for long times. Alkaline electrolysers work at atmospheric or low pressure (0-8 bar) or at pressure (up to 30 bar).
• Proton Exchange Membrane (PEM) electrolysers (reverse reaction of PEM-fuel cell) use an organic membrane instead of alkaline aqueous solution, which leads to a significant volume reduction. PEM electrolysers exhibit higher efficiency while operating at significantly higher current densities when compared to the advanced alkaline electrolysers (but system costs are still very high, see below). Mitsubishi Corporation is developing a ‘High-pressure Hydrogen Energy Generator’ (HHEG), which is based on a proton exchange membrane stack in a high pressure vessel, which stores high-compressed hydrogen generated by electrolysis. The advantage of the system is that it produces high-pressure hydrogen by itself without the need for further compression.
• High-temperature steam electrolysis operates between 700 and 1000 oC, using oxygen ion-conducting stabilised ZrO2-ceramics as an electrolyte (reverse reaction of Solid Oxide Fuel Cell). The water to be dissociated is entered on the cathode side as steam, which forms a steam hydrogen mixture during electrolytic dissociation (Winter and Nitsch 1988). The dissociation of steam theoretically requires less electrical energy than the dissociation of water. The energy required for water evaporation can be supplied by thermal energy and thus allows the use of various energy sources. The driving force for the development of the high-temperature electrolysis process in the 1980s was to use waste heat from high temperature nuclear reactors for hydrogen production, but most research activities were reduced significantly since then. Because of the improvements in Solid Oxide Fuel Cell technologies, there is a new interest in this technology, which can be combined with high temperature solar heat. Solid Oxide Fuel Cells (SOFC) used in electrolysis
CASCADE Mints D1.1 Fuel cell technologies and H2 production/distribution options
34
mode, called Solid Oxide Electrolyser Cells (SOEC), have the potential to become an efficient electrolyser technology.
3.1.1.2 Fields of application Electrolysis is scaleable from few Nm3/h to several 10,000 Nm3/h, so that it can be used for decentralised on-site hydrogen production as well as for large scale centralised hydrogen plants. On-site hydrogen production can use existing electrical infrastructure and has the advantage that no additional infrastructure for hydrogen distribution is required. Due to their flexibility in operation (start and stop on demand) electrolysers can support the load management in the electricity grid and thus facilitate the integration of fluctuating energy sources.
Because of the additional high temperature heat requirements from a nuclear reactor or a solar thermal facility, early process design studies for a high temperature steam electrolysis process assumed a hydrogen production capacity of several 10,000 Nm3/h (Dönitz 1988). A Solid Oxide Electrolyser Cell will be scaleable over a broad capacity range, thus also allowing the decentralised hydrogen production.
3.1.1.3 Technical data As mentioned before, the capacity of electrolysers is scaleable from small-scale on site hydrogen production to large-scale centralised hydrogen plants near the electricity source. The efficiency of the process is largely unaffected by the variation in size (EUCAR 2003), so that we do not have to differentiate between different size classes. The outlet pressure of commercially available pressurised electrolysers range between 1.1 and 30 bar, and the efficiency ranges between 62 and 70 % related to the LHV of the delivered hydrogen (see e.g. EUCAR 2003; Stuart Energy 2004; BOC 2004). Future long term developments are expected to result in an efficiency of close to 80 % (Dreier and Wagner, 2000).
Membrane electrolysers are still in the development stage. A version is offered by Proton Energy Systems, USA, for the production of ultra-high purity hydrogen gas for industrial and laboratory applications, but the energy efficiency of 45 % is rather low (Proton 2004), and the lifetime of the stack is only 3 to 4 years. Mitsubishi Corporation recently announced the successful application of the ‘High-pressure Hydrogen Energy Generator’ (HHEG) prototype PERM-electrolyser (Mitsubishi 2004), producing hydrogen at a pressure of up to 350 bar without a compressor. The capacity of the prototype is 2.5 Nm3/h, and Mitsubishi plans to have a commercial product with a capacity of 30 Nm3/h and a pressure of 400 bar available in the next years. There are currently no data available on efficiency, stack lifetime, or costs of HHEG system.
Bench scale tests and a pilot plant design of a high temperature steam electrolysis process have been performed in the 1980s in particular in Germany, but research activities were slowed down (high costs, termination of the high temperature nuclear reactor programme in Germany). As discussed above, current research activities (e.g. at RISO, Denmark) on high temperature electrolysis focus on Solid Oxide Electrolyser Cells. The splitting of steam into hydrogen and oxygen at 1000 oC in a SOFC operated in the electrolysis mode has been successfully demonstrated in the laboratory (Jensen et al. 2003). The durability of the system is however limited, and much more work is necessary to achieve an acceptable lifetime of the cells.
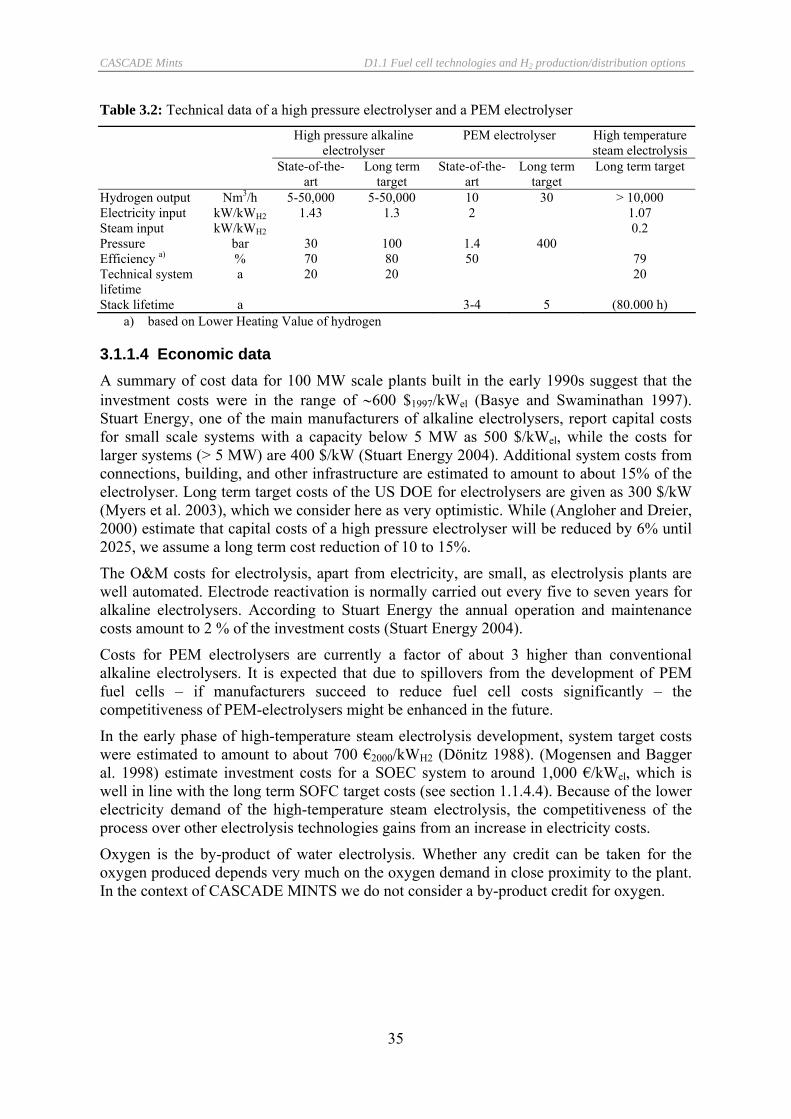
CASCADE Mints D1.1 Fuel cell technologies and H2 production/distribution options
35
Table 3.2: Technical data of a high pressure electrolyser and a PEM electrolyser
High pressure alkaline electrolyser
PEM electrolyser High temperature steam electrolysis
State-of-the-art
Long term target
State-of-the-art
Long term target
Long term target
Hydrogen output Nm3/h 5-50,000 5-50,000 10 30 > 10,000 Electricity input kW/kWH2 1.43 1.3 2 1.07 Steam input kW/kWH2 0.2 Pressure bar 30 100 1.4 400 Efficiency a) % 70 80 50 79 Technical system lifetime
a 20 20 20
Stack lifetime a 3-4 5 (80.000 h) a) based on Lower Heating Value of hydrogen
3.1.1.4 Economic data A summary of cost data for 100 MW scale plants built in the early 1990s suggest that the investment costs were in the range of ∼600 $1997/kWel (Basye and Swaminathan 1997). Stuart Energy, one of the main manufacturers of alkaline electrolysers, report capital costs for small scale systems with a capacity below 5 MW as 500 $/kWel, while the costs for larger systems (> 5 MW) are 400 $/kW (Stuart Energy 2004). Additional system costs from connections, building, and other infrastructure are estimated to amount to about 15% of the electrolyser. Long term target costs of the US DOE for electrolysers are given as 300 $/kW (Myers et al. 2003), which we consider here as very optimistic. While (Angloher and Dreier, 2000) estimate that capital costs of a high pressure electrolyser will be reduced by 6% until 2025, we assume a long term cost reduction of 10 to 15%.
The O&M costs for electrolysis, apart from electricity, are small, as electrolysis plants are well automated. Electrode reactivation is normally carried out every five to seven years for alkaline electrolysers. According to Stuart Energy the annual operation and maintenance costs amount to 2 % of the investment costs (Stuart Energy 2004).
Costs for PEM electrolysers are currently a factor of about 3 higher than conventional alkaline electrolysers. It is expected that due to spillovers from the development of PEM fuel cells – if manufacturers succeed to reduce fuel cell costs significantly – the competitiveness of PEM-electrolysers might be enhanced in the future.
In the early phase of high-temperature steam electrolysis development, system target costs were estimated to amount to about 700 €2000/kWH2 (Dönitz 1988). (Mogensen and Bagger al. 1998) estimate investment costs for a SOEC system to around 1,000 €/kWel, which is well in line with the long term SOFC target costs (see section 1.1.4.4). Because of the lower electricity demand of the high-temperature steam electrolysis, the competitiveness of the process over other electrolysis technologies gains from an increase in electricity costs.
Oxygen is the by-product of water electrolysis. Whether any credit can be taken for the oxygen produced depends very much on the oxygen demand in close proximity to the plant. In the context of CASCADE MINTS we do not consider a by-product credit for oxygen.
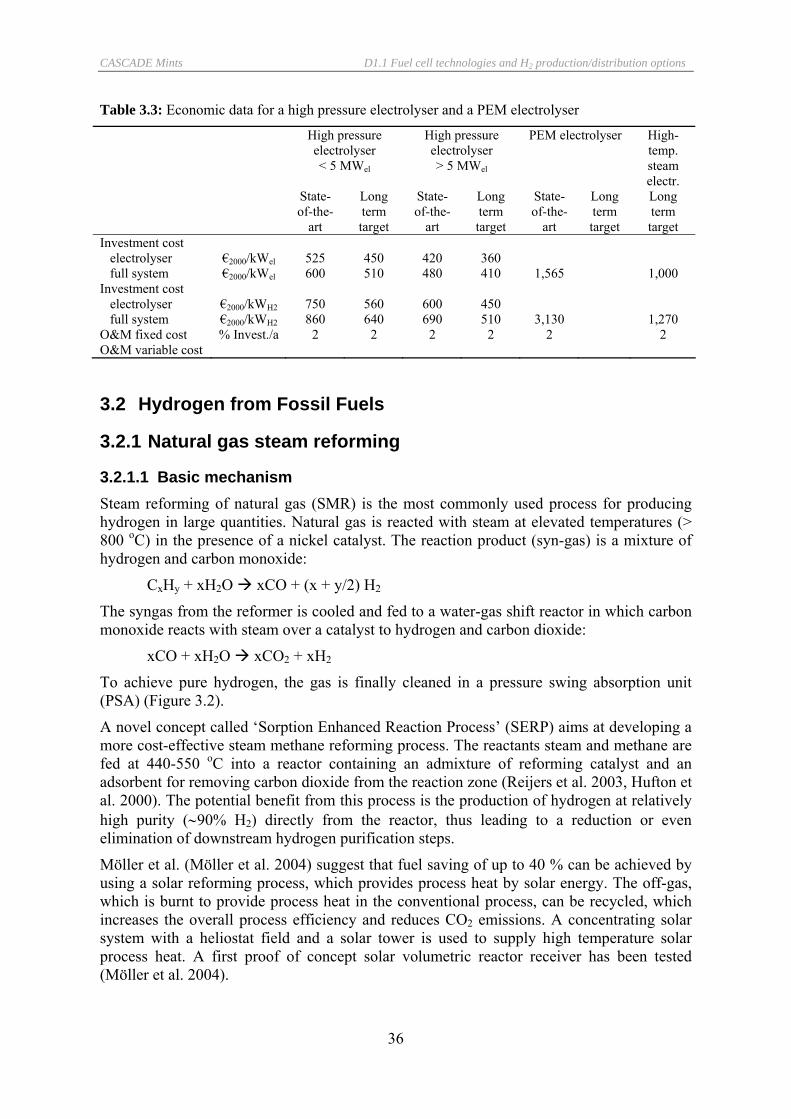
CASCADE Mints D1.1 Fuel cell technologies and H2 production/distribution options
36
Table 3.3: Economic data for a high pressure electrolyser and a PEM electrolyser
High pressure electrolyser < 5 MWel
High pressure electrolyser > 5 MWel
PEM electrolyser High-temp. steam electr.
State-of-the-
art
Long term target
State-of-the-
art
Long term target
State-of-the-
art
Long term target
Long term target
Investment cost electrolyser full system
€2000/kWel €2000/kWel
525 600
450 510
420 480
360 410
1,565
1,000 Investment cost electrolyser full system
€2000/kWH2 €2000/kWH2
750 860
560 640
600 690
450 510
3,130
1,270 O&M fixed cost % Invest./a 2 2 2 2 2 2 O&M variable cost
3.2 Hydrogen from Fossil Fuels
3.2.1 Natural gas steam reforming
3.2.1.1 Basic mechanism Steam reforming of natural gas (SMR) is the most commonly used process for producing hydrogen in large quantities. Natural gas is reacted with steam at elevated temperatures (> 800 oC) in the presence of a nickel catalyst. The reaction product (syn-gas) is a mixture of hydrogen and carbon monoxide:
CxHy + xH2O xCO + (x + y/2) H2
The syngas from the reformer is cooled and fed to a water-gas shift reactor in which carbon monoxide reacts with steam over a catalyst to hydrogen and carbon dioxide:
xCO + xH2O xCO2 + xH2
To achieve pure hydrogen, the gas is finally cleaned in a pressure swing absorption unit (PSA) (Figure 3.2).
A novel concept called ‘Sorption Enhanced Reaction Process’ (SERP) aims at developing a more cost-effective steam methane reforming process. The reactants steam and methane are fed at 440-550 oC into a reactor containing an admixture of reforming catalyst and an adsorbent for removing carbon dioxide from the reaction zone (Reijers et al. 2003, Hufton et al. 2000). The potential benefit from this process is the production of hydrogen at relatively high purity (∼90% H2) directly from the reactor, thus leading to a reduction or even elimination of downstream hydrogen purification steps.
Möller et al. (Möller et al. 2004) suggest that fuel saving of up to 40 % can be achieved by using a solar reforming process, which provides process heat by solar energy. The off-gas, which is burnt to provide process heat in the conventional process, can be recycled, which increases the overall process efficiency and reduces CO2 emissions. A concentrating solar system with a heliostat field and a solar tower is used to supply high temperature solar process heat. A first proof of concept solar volumetric reactor receiver has been tested (Möller et al. 2004).

CASCADE Mints D1.1 Fuel cell technologies and H2 production/distribution options
37
Desulphuri-sation
Desulphuri-sation ReformerReformer CO-shiftCO-shift CO2 removal PSAPSA
HydrogenNatural gas
Steam Steam
CO2
Figure 3.2: Schematic diagram of natural gas steam reforming
3.2.1.2 Fields of application Today, hydrogen is produced industrially in large-scale steam reformers at rates in the order of 100,000 Nm3/h at high pressures (20-40 bar). Decentralised on-site production e.g. at a gas station or in a residential district requires small-scale SMR facilities with a production rate between 1,000 and 4,000 Nm3/h. Small scale stationary and mobile reformers which are developed as being part of a fuel cell package are not considered here.
3.2.1.3 Technical data Table 3.4 summarises key technical data for two steam reforming facilities of different size, which are considered as representative for small scale on-site hydrogen production, and for large scale industrial applications. As SMR is a well established and mature technology, the potential for technical improvement is limited. According to (Dreier and Wagner 2000) we assume that today’s process efficiency of 67% (small scale) and 74% (large scale) (related to LHV of hydrogen) can still be slightly increased in the future.
Results from first Sorption Enhanced Reaction Process laboratory plants do not yet fulfil the expected performance objectives (Hufton et al. 2000), so that the potential for improvement is difficult to assess. We suggest to not consider this new process here as long as there is no further technical evidence that the theoretical targets can be met.
Technical data for the solar reforming process are based on a system design study by (Möller et al. 2004). The plant has a solar thermal capacity of 50 MWth, and a hydrogen production rate of 50,000 Nm3/h. The current concept aims at a ‘solar only’ operation mode without storage for night time operation, resulting in only 2,000 full load hours per year. The system requires 0.25 Nm3 of CH4 per Nm3 of H2, and 0.32 kWh solarthermal energy per Nm3 of H2, resulting in an overall reformer efficiency of 87 %.
Table 3.4: Technical data for steam methane reforming (SMR) (Dreier and Wagner 2000, Möller et al. 2004)
Small scale on-site SMR Large scale SMR Solar reformer
State-of-the-art
Long term target
State-of-the-art
Long term target
Long term target
Capacity natural gas kW 4,500 4,275 405,000 385,000 125,000 Solar heat kW 47,700 Hydrogen output Nm3/h 1,000 1,000 100,000 100,000 50,000 Pressure bar 16 16 30 30 Efficiency a) % 67 70 74 78 87 Technical system lifetime
a 25 25 25 25 20
Utilisation time h/a 8,000 8,000 8,000 8,000 2,000 a) based on Lower Heating Value of hydrogen

CASCADE Mints D1.1 Fuel cell technologies and H2 production/distribution options
38
3.2.1.4 Economic data A literature review by (Basye and Swaminathan 1997) suggest capital costs for large hydrogen production plants (1.4 to 2.8 million Nm3/d) in the range of 160 to 490 $1997/kWH2, indicating that economies of scale plays an important role even in these large scale plants. More recent data from (Dreier and Wagner 2000) suggest capital costs of 335 €2000/kWH2 for large scale steam methane reforming plants. Capital costs for decentralised small scale applications are significantly higher, and according to (Dreier and Wagner 2000) amount to 690 €2000/kWH2 for the 1,000 Nm3/h reference plant. As the process of steam reforming is well established, (Angloher and Dreier, 2000) do not expect a substantial potential for further cost reduction. We assume that on the long term specific investment costs will be reduced by 5%.
A review of O&M costs from various studies in (Basye and Swaminathan 1997) suggests that normalised O&M costs for large scale plants are between 0.45 and 0.6 $-cents1997/Nm3. We thus assume O&M costs of 0.55 Euro-Cent2000/Nm3, not including feedstock costs. There are no reliable data available on O&M costs for small scale facilities. As the operating costs for smaller SMR plants do not decrease with plant size and the raw material needs per unit of hydrogen produced remains similar, we assume the same O&M costs for all plant sizes.
The economics of a first Sorption Enhanced Reaction demonstration process were found to be non-competitive with conventional technology (Hufton 2000).
The costs of the solar natural gas reforming process were estimated by (Möller et al. 2004) to amount to 370 €/kWH2, including the heliostat field, the solar tower and receiver, but not including the land cost. We consider the cost estimates of Möller et al., which are only slightly higher as the investment cost of a current large scale SMR plant, as a long term target. Annual O&M costs are estimated to amount to 7 % of the investment costs.
Table 3.5: Economic data for a steam reformer system
Small scale on-site SMR (1,000 Nm3/h)
Large scale SMR (100,000 Nm3/h)
Solar reformer
State-of-the-art
Long term target
State-of-the-art
Long term target
Long term target
Investment cost €2000/kWH2 690 655 335 320 370 O&M fixed cost % Invest./a 5 5 2 2 5,5 O&M variable cost €2000/Nm3 0.003 0.003 0.003 0.003 0,013
3.2.2 Partial oxidation of heavy oil
3.2.2.1 Basic mechanism Partial oxidation is used in refineries for the conversion of residues (liquid, highly viscous hydrocarbons) essentially into hydrogen, CO, CO2 and water. Heavy hydrocarbon's low volatility and often high sulphur content prevents using steam reforming. Instead, heavy hydrocarbons are transferred to hydrogen by partial oxidation, leading to an exothermic conversion of heavy fuel oil with oxygen:
CxHy + x/2 O2 x CO + y/2 H2
Partial oxidation takes place at a temperature of 1300-1500 oC and a pressure of 30 to 100 bar without the need for a catalyst. The partial oxidation process is followed by a

CASCADE Mints D1.1 Fuel cell technologies and H2 production/distribution options
39
desulphurisation process, the CO-shift and a final CO2-removal (Figure 3.3). In contrast to steam reforming, the partial oxidation process does not pose any specific requirements towards the quality of the feedstock.
Partial oxidation
Partial oxidation
Desulphuri-sation CO-shiftCO-shift CO2 removalCO2 removal PSAPSA
HydrogenHeavy fuel oil
Steam
SteamAir
separationAir
separationAir
O2
N2
Figure 3.3: Partial Oxidation process
3.2.2.2 Fields of application Partial oxidation is not widely utilized for the production of hydrogen unless the only available feedstock is a heavy hydrocarbon. The process is most commonly considered for the production of carbon monoxide or for applications where the desired H2/CO ratio is 1.6 - 1.8 or less. Partial oxidation is used in refineries for the conversion of residues (liquid, highly viscous hydrocarbons) essentially into hydrogen, CO, CO2 and water. The products can be used as synthesis gas, fuel gas or feed for hydrogen recovery. Partial oxidation is relevant only for large scale hydrogen production.
3.2.2.3 Technical data Partial oxidation of heavy hydrocarbons is a well established process based on the Texaco Gasification Process (TGP) (see e.g. EPA 1995) or the Shell Gasification Process (SGP) (see e.g. Heurich and Higman 1993). As a reference, we take technical data given by (Angloher and Dreier 2000) for a partial oxidation plant with a capacity of 100,000 Nm3/h hydrogen output. The data given in Table 3.6 refer to a plant in which electricity covers about 5 % of the energy demand. As the primary energy for electricity generation is not considered when calculating the process efficiency it results in a higher efficiency compared to steam reforming.
Although partial oxidation is a well established process, it is expected that a further optimisation of system integration may result in a reduction of fuel input by 5 %, and a reduction of the electricity requirement by 10 %, leading to an improvement of the total efficiency from today 73 % to 77 % in the future.
3.2.2.4 Economic data Capital costs for partial oxidation are higher than for steam reforming, while the feedstock price (heavy oil) is lower. Consequently, capital costs begin to contribute more to the overall production costs. Partial oxidation of heavy oil is a commercial process, so that cost estimates are based on considerable experiences. According to (Angloher and Dreier 2000), capital costs for a current heavy fuel partial oxidation plant are 500 €2000/kWH2. They do not expect that capital costs can significantly be reduced in the future due to technological

CASCADE Mints D1.1 Fuel cell technologies and H2 production/distribution options
40
improvements, but like in the case of steam reforming we assume a future 5% reduction of capital costs.
There are unfortunately no reliable data on O&M costs available. (Basye and Swaminathan 1997) report O&M costs of 1.9 $1997/GJ based on a quite old study by (Steinberg and Cheng 1989), which are also quoted elsewhere throughout the relevant literature. We consider annual O&M costs in the range of 10 % of the capital costs as too high, and suggest to use fixed annual O&M costs of 5 % of total capital costs, which is more in line with similar facilities in the energy sector. Variable operation costs resulting from electricity consumption depend on the electricity costs. Assuming electricity costs of 5 ct/kWh, the electricity costs amount to 0.95 ct/Nm3
H2.
Table 3.6: Technical data of a heavy oil partial oxidation plant (Angloher and Dreier 2000)
State-of-the-art Long term target Capacity heavy oil kW 390,400 370,900 Electricity requirement kW 19,000 17,100 Hydrogen output Nm3/h 100,000 100,000 Pressure bar 50 50 Efficiency a) % 73 77 Technical system lifetime a 25 25 Utilisation time h/a 8,000 8,000 a) based on Lower Heating Value of hydrogen, does not take into account primary energy requirement for electricity input
Table 3.7: Economic data of a heavy fuel partial oxidation plant (100.000 Nm3/h)
State-of-the-art Long term target Investment cost €2000/kWH2 500 475 O&M fixed cost % Invest./a 5 5 O&M variable cost €2000/Nm3 0.0095 0.0085
3.2.3 Coal gasification Coal continues to be a strategic indigenous primary energy source in a number of countries, and its global reserves and resources are abundant and more evenly distributed than oil or natural gas. Countries like China and India are likely to base the development of their energy systems, at least in the short and medium term, on indigenous coal resources. Clean-coal technologies - in particular when carbon capture and storage is applied - might play a complementary role to the decarbonisation of the energy supply mix and efficiency improvements in both the supply and demand sides (Yamashita and Barreto 2003). However, carbon capture technologies are currently under development and still face a number of challenges, in particular they must become less energy-intensive and more cost-effective. In addition, today we still know little about the storage potential of different reservoirs, their leakage characteristics and associated risks and costs.
3.2.3.1 Basic mechanism Coal gasification is a process that converts solid coal into a synthetic gas composed mainly of carbon monoxide and hydrogen. Coal can be gasified in various ways by properly controlling the mix of coal, oxygen, and steam within the gasifier. There are also several
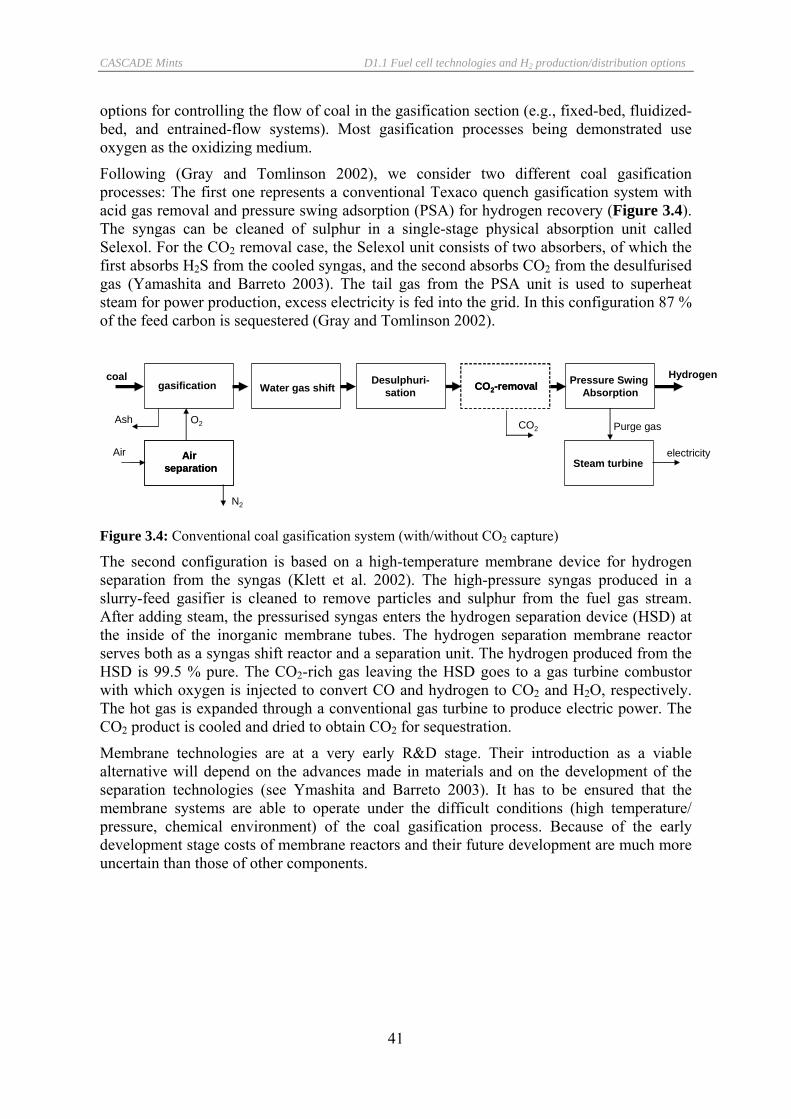
CASCADE Mints D1.1 Fuel cell technologies and H2 production/distribution options
41
options for controlling the flow of coal in the gasification section (e.g., fixed-bed, fluidized-bed, and entrained-flow systems). Most gasification processes being demonstrated use oxygen as the oxidizing medium.
Following (Gray and Tomlinson 2002), we consider two different coal gasification processes: The first one represents a conventional Texaco quench gasification system with acid gas removal and pressure swing adsorption (PSA) for hydrogen recovery (Figure 3.4). The syngas can be cleaned of sulphur in a single-stage physical absorption unit called Selexol. For the CO2 removal case, the Selexol unit consists of two absorbers, of which the first absorbs H2S from the cooled syngas, and the second absorbs CO2 from the desulfurised gas (Yamashita and Barreto 2003). The tail gas from the PSA unit is used to superheat steam for power production, excess electricity is fed into the grid. In this configuration 87 % of the feed carbon is sequestered (Gray and Tomlinson 2002).
gasification Water gas shiftDesulphuri-
sation CO2-removalCO2-removal Pressure SwingAbsorption
Hydrogencoal
Air separation
Air separation
Air
O2
N2
Ash
Steam turbine
Purge gas
electricity
CO2
Figure 3.4: Conventional coal gasification system (with/without CO2 capture)
The second configuration is based on a high-temperature membrane device for hydrogen separation from the syngas (Klett et al. 2002). The high-pressure syngas produced in a slurry-feed gasifier is cleaned to remove particles and sulphur from the fuel gas stream. After adding steam, the pressurised syngas enters the hydrogen separation device (HSD) at the inside of the inorganic membrane tubes. The hydrogen separation membrane reactor serves both as a syngas shift reactor and a separation unit. The hydrogen produced from the HSD is 99.5 % pure. The CO2-rich gas leaving the HSD goes to a gas turbine combustor with which oxygen is injected to convert CO and hydrogen to CO2 and H2O, respectively. The hot gas is expanded through a conventional gas turbine to produce electric power. The CO2 product is cooled and dried to obtain CO2 for sequestration.
Membrane technologies are at a very early R&D stage. Their introduction as a viable alternative will depend on the advances made in materials and on the development of the separation technologies (see Ymashita and Barreto 2003). It has to be ensured that the membrane systems are able to operate under the difficult conditions (high temperature/ pressure, chemical environment) of the coal gasification process. Because of the early development stage costs of membrane reactors and their future development are much more uncertain than those of other components.

CASCADE Mints D1.1 Fuel cell technologies and H2 production/distribution options
42
gasification Desulphuri-sation
H2 separationmembrane
reactor
Hydrogencoal
Air separation
Air separation
Air
O2
N2
Ash
O2 combustor/turbine expander
electricity
CO2-rich gas (CO2, H2O, CO, H2)
CO2
CO2, H2O
O2
Figure 3.5: Coal gasification system with a hydrogen separation membrane reactor and CO2 capture
The Zero Emission Carbon (ZEC) concept proposed by Los Alamos National Laboratory is an integrated power production concept with a potential of achieving a high efficiency (Ziock et al. 2003). A hydrogasification process converts coal or other carbon feedstocks to a synthesis gas of mainly methane and hydrogen. This synthesis gas is reformed with steam at pressure and temperature to produce a relatively pure hydrogen stream through the use of a CaO carbonation reaction. The carbonation reaction removes the CO2 and supplies energy needed to drive the reforming reaction. Electric power is produced from the product hydrogen in a solid oxide fuel cell, which needs to be especially designed for the coal-synthesis gas. A calcinations reaction, driven by process heat from the SOFC recycles the CaO and produces a stream of CO2.
The installation of a ZEC pilot plant installation is planned in 2005/2006 (ZECA 2004). While the current ZEC concept aims at the integrated coal gasification and electricity generation, the process also offers the possibility to produce hydrogen and a ‘pure’ stream of CO2 from any carbon fuel and water. First cost estimates published by ZECA Corporation address the integrated ZEC gasification and power plant process. Due to the very early stage of the development phase any data on costs and technical performance seem to be very indicative only. For the time being, we do not consider this process as a priority within CASCADE MINTS.
3.2.3.2 Fields of application Coal gasification for hydrogen production is likely to be applied only for large scale centralised facilities. Current developments however mainly focus towards the optimisation and integration of the gasification process for electricity production in an IGCC power plant. Some authors support the idea of co-producing hydrogen and electricity from a coal gasification system, but the expected benefits from such a configuration remain vague.
3.2.3.3 Technical data Table 3.8 summarises the technical data of the three coal gasification processes considered. Data on the conventional state-of-the-art gasification process with PSA hydrogen separation are well in line with various references (e.g. Angloher and Dreier 2000, Klett et al. 2002). The overall efficiency of the process is reduced by about 4 %-points when CO2 capture is introduced. A significant increase of the overall efficiency is expected by substituting the conventional syngas treatment process by a hydrogen membrane separation reactor, some authors like e.g. (Klett et al. 2002) assume an even higher efficiency as the one given in Table 3.8. As mentioned above, significant improvement of membrane technology and

CASCADE Mints D1.1 Fuel cell technologies and H2 production/distribution options
43
performance is still required to put this process into practice, so that we suggest to consider the data given in Table 3.8 as indicative targets only which are still very uncertain.
Table 3.8: Technical data of coal gasification systems for hydrogen production (based on Gray and Tomlinson 2001)
Future State-of-the-art Gasification+PSA Gasification+PSA
+CO2 capture Gasification+HSMRb)
+CO2 capture Capacity hard coal MW 800 800 (800) Hydrogen output Nm3/h 150,000 137,000 (178,000) Electricity output MW 20 27 (25) CO2 removal efficiency % 87 (100) Efficiency a) % 59 55 (70) Tech. system lifetime a 25 25 (25) Utilisation time h/a 8,000 8,000 (8,000) a) based on Lower Heating Value of hydrogen b) Hydrogen Separation Membrane Reactor
3.2.3.4 Cost data According to (Gray and Tomlinson 2001), investment costs for the state-of-the-art gasification system with PSA are 890 €/kWH2, which is significantly higher than costs for a steam methane reformer or a heavy oil partial oxidation plant. Despite the lower feedstock costs, at current fuel prices coal gasification with its high capital costs is more expensive than the POX process of heavy fuels or hydrogen production from steam reforming. CO2 capture leads to an increase of investment costs by about 30 % (not including costs for CO2 disposal!). Klett et al. (Klett et al. 2002) estimate that the costs for a gasification plant with a hydrogen separation membrane reactor are in the same order of magnitude as the gasification plant with conventional syngas treatment, so that no extra costs for CO2 capture would occur. Because of the early development stage of this process any cost estimates are very uncertain, and the estimates by (Klett et al. 2002) seem to be very optimistic. We suggest to not use these estimates until there is no further evidence for the technical feasibility of the process, but to keep in mind the remaining potential for further cost reduction resulting from the introduction of the membrane technology.
Table 3.9: Economic data of coal gasification systems for hydrogen production (Gray and Tomlinson 2001; Klett et al. 2002)
State-of-the-art Gasification+PSA
Future Gasification+PSA+CO2 capture
Investment cost €2000/kWH2, LHV 890 1140 O&M fixed cost % Invest./a 5 5 O&M variable cost €2000/Nm3 0.007 0.007

CASCADE Mints D1.1 Fuel cell technologies and H2 production/distribution options
44
3.2.4 Pyrolysis
3.2.4.1 Process mechanism Hydrocarbons can be converted to hydrogen without producing carbon dioxide, if they are decomposed at a sufficiently high temperature in the absence of oxygen. Methane can be ‘cracked’ for example in the presence of a catalyst such as carbon felt. Carbon black can either be sequestered or used further by a number of industries. This process has been developed commercially by the Norwegian firm KVAERNER ENGINEERING S.A. under the process name “Kvaerner Carbon Black and Hydrogen Process”. The raw materials for this process are hydrocarbon compounds that originate from a range of sources from light gases to heavy oil fractions. In a high temperature reactor, the temperature necessary for splitting hydrocarbons is supplied by a plasma burner that uses recirculated hydrogen from the process as plasma gas. The formula for the process using methane as a feed is
CH4 C + 2H2
The main product of the Kvaerner process is carbon black, which is mainly used for making car tyres, and in the metallurgical industry. Traditional methods for producing carbon black only utilise 30-60 % of the raw material, while the Kvaerner process enables 100 % of the raw material to be used, leading to a significant reduction of environmental pollution. Hydrogen is considered as a by-product of the process. The current demand for carbon black is about 1 Mill. t/a in Europe, and 6 Mill. t/a world wide, with an expected increase in demand [Pehnt 2002]. A carbon black demand of 6 Mill. t/a is equivalent to a hydrogen production of about 160 PJ/a, which shows that the potential for hydrogen production is limited. Because of the environmental benefits of the process this potential however is worthwhile to be exploited.
3.2.4.2 Fields of application A first commercial plant based on the Kvaerner process started operation in June 1999 in Canada. The plant was designed to initially produce 20,000 t/a of highest quality carbon black (to be expanded to up to 90,000 t/a). Hydrogen is considered as a by-product.
3.2.4.3 Technical data A first pilot plant in operation since 1992 produced about 500 kg/h carbon black and 2,000 Nm3/h hydrogen from 1,000 Nm3/h natural gas and 2,100 kWel. Another by-product is the production of about 1,000 kW high temperature steam. Considering all potential usable products, the plant works with almost 100 % efficiency, made up of 48 % hydrogen, about 10 % steam and 40 % carbon black.
The commercial plant put into operation in Canada in 1999 had an initial annual capacity of 20,000 tonnes of carbon black, which can be expanded to up to 90,000 t/a. As a by-product the plant produces 50 Mill. Nm3 per year (Kvaerner 1997). No data on plant efficiency and feedstock requirement are available. For the commercial plant, the hydrogen to carbon black ratio of the product stream seems to be significantly lower than for the pilot plant.
Due to the early phase of development a significant potential for technological improvement can be expected. As the overall efficiency is already almost 100 % (taking into account the use of all by-products), any technical improvement is likely to lead to a reduction of costs. Depending on the prices for the two main products, a further process optimisation might lead to changes in the carbon black to hydrogen ratio of the two output streams. It should be
CASCADE Mints D1.1 Fuel cell technologies and H2 production/distribution options
45
mentioned again that the potential for an increase in production capacity and thus for technological learning is limited.
Table 3.10: Technical data of the Kvaerner process (Wurster and Zittel 1994; Kvaerner 1997)
demonstration plant State of the art Hydrogen output Nm3/h 2,000 6,300 Carbon black output kg/h 500 2500 Feedstock (natural gas) input Nm3/h 1,000 Electricity requirement kW 2,100 Efficiency a) % 48 Technical system lifetime a 20 20 Utilisation time h/a 8,000 8,000 a) related to Lower Heating Value of hydrogen output
3.2.4.4 Economic data The costs for the first commercial plant built in Canada were about 43 Mill US$ (Kvaerner 1997). Although hydrogen is considered as a by-product of the Kvaerner process, hydrogen production costs may be estimated by normalising the capital cost of the plant to the hydrogen output, resulting in 2,300 $/kWH2 (2,600 €2000/kWH2) (Table 3.11), and considering carbon black as a by-product. The price for different grades of carbon black is in the range of 600 to 900 €/t (Chemical Market Reporter 2002), because of the high quality carbon black produced from the Kvaerner process we assume a price of 800 €/t. If in our context we consider hydrogen as the main product, 0.4 kg of carbon black are produced per Nm3 hydrogen, resulting in a credit for carbon black production of 0.32 €/Nm3
H2. There are no data available on O&M costs. We assume fixed annual O&M costs to amount to 5 % of the capital cost.
Table 3.11: Economic data of a Kvaerner carbon black plant (Kvaerner 1997; own estimates)
State-of-the-art
Long term target
Total investment cost Mill. €2000 49 Specific investment cost €2000/kWH2 2,600 Credit for carbon black €2000/Nm3
H2 0.32 O&M fixed cost % Invest./a 5 O&M variable cost €2000/Nm3
3.3 Hydrogen from biomass Reducing the demand on fossil resources remains a significant concern for future energy supply. For the near- and mid-term, generating hydrogen from biomass may be the most practicable and viable renewable and potentially carbon neutral option for hydrogen production. Biomass has the potential to accelerate the realisation if hydrogen as a major fuel of the future. Since biomass is renewable and consumes atmospheric CO2 during growth, it can have a small net CO2 impact compared to fossil fuels. Biomass gasification, however, is still in its infancy. Currently only a small number of demonstration facilities are in place and many issues must still be addressed before the technology can be expected to reach an adequate technical performance and hence become economically competitive. The

CASCADE Mints D1.1 Fuel cell technologies and H2 production/distribution options
46
yield of hydrogen is low from biomass since the hydrogen content in biomass is low, and also the energy content is low due to the 40 % oxygen content of biomass. The low yield of hydrogen on a weight basis might however be misleading, as the energy conversion efficiency has been demonstrated to be high (> 55% in the laboratory today).
Process for the production of hydrogen from biomass can be divided into three categories:
• Direct production routes (e.g. gasification)
• Conversion of storable intermediates, and
• Metabolic processing to split water via photosynthesis, or to perform the shift reaction by photo biological organisms.
The availability of biomass for competing utilisation is of course a critical issue in developing long term scenarios. A rough estimate provided by (IE, 2004) suggests that the total biomass potential in the EU-25 countries is about 6,600 PJ/a, including forest and industrial wood residuals, straw, and energy crops. (Frey et al. 2004) estimate the biomass potential in the EU-15 countries to amount to 7,000 PJ/a in 2050.
3.3.1 Biomass gasification and pyrolysis
3.3.1.1 Basic mechanism Gasification is a two-step process in which a solid fuel is thermochemically converted to a low- or medium-energy-content gas (see also 3.2.3). In the first reaction (pyrolysis), the dissociated and volatile components of the fuel are vaporised at temperatures as low as 600 oC. Included in the volatile vapours are hydrocarbon gases, hydrogen, carbon monoxide, carbon dioxide, tar, and water vapour. Because biomass fuels tend to have more volatile components (70-86 % on a dry basis) than coal (30 %), pyrolysis plays a larger role in biomass gasification than in coal gasification. Gas phase thermal cracking of the volatiles occurs, reducing the levels of tar. Char (fixed carbon) and ash are the pyrolysis by-products that are not vaporised. In the second step, the char is gasified through reactions with oxygen, steam, and hydrogen (Milne et al. 2002).
One gasification option is based on a low pressure, indirectly-heated gasifier, in which the heat necessary for the endothermic gasification reaction is supplied e.g. by hot sand circulating between the char combustor and the gasification vessel (Spath et al. 2003). After clean-up, the syngas is cooled so that it can be compressed to the pressure required for the pressure swing adsorption (PSA) unit. Following compression, the gasifier product gas is steam reformed and passed through a water-gas shift reactor to produce a gas concentrated in H2 and CO2. Finally, the hydrogen is purified in the PSA prior to storage and distribution (Figure 3.6).
By including oxygen in the reaction gas the separate supply of energy is not required, but the product gas is diluted with carbon dioxide. An example of this process is the GTI High-Pressure Oxygen-Blown Gasifier (Bowen 2003). The major system components include biomass handling and drying, followed by gasification for which an air separation unit is required, hot gas clean-up, reforming, shift conversion, and hydrogen purification.
Makihira et al. (Makihira et al. 2003) suggest that from combining a biomass gasification system with carbon removal and sequestration technologies even a net removal of carbon from the atmosphere can be achieved, which might make sense from an economic point of

CASCADE Mints D1.1 Fuel cell technologies and H2 production/distribution options
47
view if the credit gained for CO2-reduction from a CO2 emission trading scheme compensates the extra costs for carbon capture.
CO-shift PSAHydrogen
Air separation
Air
O2
N2
Catalytic steam
reforming
CompressionCompressionGas clean-up
Gas clean-up
Gasification(1 bar)
Gasification(1 bar)
Biomass
Gas clean-up
Gas clean-up
Gasification(35 bar)
Gasification(35 bar)
Biomass
CO-shift PSAHydrogenCatalytic
steam reforming
Figure 3.6: Schematic diagram of biomass gasification options Fluidised Bed
Catalytic Steam
Reforming
SeparationSeparationPyrolysisPyrolysisBiomass
CO-shift PSAHydrogen
Co-products
truck
Figure 3.7: Schematic diagram of hydrogen production from biomass pyrolysis
Instead of the direct gasification of biomass, a fast pyrolysis of biomass can be used to produce a liquid intermediate product called bio-oil, from which hydrogen can be produced in a steam reforming process after a co-product separation. Biomass is first dried and then converted to an oil by very quick exposure to heated particles in a fluidised bed:
Biomass + Energy Bio-oil + Char + Gas
The char and gases produced are combusted to supply heat to the reactor, while the product oils are cooled and condensed. Catalytic steam reforming of bio-oil takes place at a temperature of 750-850 oC over a nickel-based catalyst (Figure 3.7).
The concept of fast pyrolysis combined with downstream steam reforming is expected to have advantages over the traditional gasification/water-gas shift technology. Bio-oil is much easier to transport than solid biomass, offering the possibility that bio-oil can be produced at smaller plants which are closer to the sources of biomass, such that lower cost feedstocks can be obtained. The bio-oil is then shipped by truck to the hydrogen production facility. It is more economical to produce bio-oil at remote locations and then ship the oil, since the energy density of bio-oil is higher than biomass (Spath et al. 2003). A second advantage is the potential production and recovery of higher-value co-products from bio-oil. The lignin-derived fraction can be separated from bio-oil and used as a phenol substitute in phenol-formaldehyde adhesives, while the carbohydrate-derived fraction is catalytically steam reformed to produce hydrogen. According to (Spath et al. 2003), the substitution of the current world wide consumption of phenol by a bio-oil based co-product translates in hydrogen production of about 60 million kg per year, thus the potential is significant.
CASCADE Mints D1.1 Fuel cell technologies and H2 production/distribution options
48
At present, the amount of biomass-derived liquids available for reforming is rather limited, but a viable way to increase the production of hydrogen in a biomass-based plant could be co-reforming of pyrolysis liquid with natural gas, similar to co-firing of biomass with coal for power generation (Czernik et al. 2002).
3.3.1.2 Fields of application Since biomass is low in density, the transportation costs for both the feedstock and the hydrogen must be balanced with the savings from employing economy of scale. In contrast to hydrogen production from fossil energy carriers, the size of a biomass gasification plant is limited by the regional availability of biomass feedstock. Economic operation is possible only if transportation costs are limited, which practically excludes the trans-regional transport of biomass. It is expected that future large, but decentralised biomass gasification plants will have a thermal capacity of around 25 MWth, but depending on the specific context also larger facilities are possible.
3.3.1.3 Technical data Technologies for hydrogen production from biomass are still in the R&D or demonstration phase and thus not yet commercially available. Milne et al. (Milne et al. 2002) provide a detailed overview on research activities in the field. Several authors provide technical characteristics of a future commercial plant configuration based on process simulation, which is based on the experience gained in demonstration processes as well as on the use of similar data from coal gasification processes.
State-of-the-art data given in Table 3.12 refer to a projected small size biomass gasification plant described by (Angloher and Dreier 2000). The allothermic gasifier is operated at a pressure of 6 bar. Model simulations result in an overall plant efficiency of 69 %, suggesting that there is a potential for increasing efficiency by the further use of low-temperature process heat. It is assumed that the size of a future commercial application is around 25 MWth, which is expected to achieve an efficiency of 72 %. Different studies suggest that due to differences in process design and biomass feedstock there is some variation in process efficiency, but data from (Spath et al. 2003) indicate that in general the differences in the overall process efficiency between systems operating with e.g. an indirectly-heated low pressure gasifier and a direct-fired high pressure gasifier are small. According to system design data from (Spath et al. 2003), the steam reforming of the bio-oil produced from fast pyrolysis achieves an efficiency of 49%, while the overall efficiency with regard to the biomass feedstock is only 28%.
Table 3.12: Technical data for biomass gasification (Angloher and Dreier 2000) and pyrolysis (Spath et al. 2003)
Gasification Pyrolysis State-of-the-art Long term target Long term target
Biomass feedstock b) Mg/d 12 120 1,806c)/1035d) Hydrogen output Nm3/h 610 6,400 35,130 Electricity requirement kW 160 1,500 Efficiency a) % 69 72 28c)/49d) Technical system lifetime a 20 25 25 Utilisation time h/a 7,500 8,000 8000 a) related to Lower Heating Value of hydrogen output; b) bone dry; heating value assumed to be 5 kWh/kg; c) refers to biomass feed-rate; d) refers to bio-oil feed-rate

CASCADE Mints D1.1 Fuel cell technologies and H2 production/distribution options
49
3.3.1.4 Economic data Data on investment costs of a future commercial biomass gasification system differ significantly. Based on data of a projected 2.5 MWth demonstration plant, (Angloher and Dreier 2000) estimate investment costs to amount to 2,660 €/kWH2, which is at the upper end of cost data given in the literature. They expect that costs for a ‘small scale’ plant (25 MWth, or 6,400 Nm3/h hydrogen production) are reduced to about 1,500 €/kWH2 until 2025. Based on process simulation, Bowen (Bowen 2003) from the Gas Technology Institute estimates capital costs for the GTI gasification process between 850 $/kWH2 (feedstock: bagasse; hydrogen production: 350,000 Nm3/day) and 490 $/kWH2 (feedstock: switchgrass; hydrogen production: 1,650,000 Nm3/day). These estimates clearly are at the lower end of cost estimates published in the literature. Spath et al. (Spath et al. 2003) estimate investment costs for the GTI process to amount to 1,300 to 2,050 $/kWH2, depending on the system’s capacity (12,000 Nm3/h and 58,000 Nm3/h, respectively). According to their estimates, the costs for a system with an endothermic, low pressure gasifier are slightly lower as for the GTI process.
While their seems to be a significant potential for reducing the investment costs by increasing the size of the gasification system, there is a trade-off with increasing transportation costs for the low density biomass feedstock. As discussed above, the cost-effective supply of biomass in most cases will limit the capacity of a biomass gasification system to a hydrogen production rate of 10,000 to 20,000 Nm3/h, while large scale gasification plants with a capacity of >> 20,000 Nm3/h hydrogen production are more likely to be an exception. On the other hand, because of the process similarities it is likely that on the medium term costs for a biomass gasification system, which can be operated a lower temperature as a coal gasifier, are at least similar to a current coal gasification system, and can be lower if developed further. We thus consider investment costs of about 900 €/kWH2 as a reasonable estimate for future large scale gasification plants for hydrogen production, which is also well within the range of the various estimates from the literature discussed above.
Depending on the size of the facility, (Spath et al. 2003) estimate the capital costs for the bio-oil reformer to 510 to 535 $/kWH2. These costs include the extraction of the bio-oil, the conversion of the carbohydrate-fraction to hydrogen, and the hydrogen purification, i.e. the costs of pyrolyzing the biomass is rolled into the price of the bio-oil feedstock. Spath et al. assumed a pyrolysis bio-oil feed price of 0.12 $/kg, but this price depends on a number of different parameters.
There are no data available on O&M costs for a biomass gasification system. In analogy to the coal gasification process we estimate annual O&M costs to amount to 7 %, and in the future to 6 % of the investment costs.
Table 3.13: Economic data of biomass gasification systems for hydrogen production
Gasification Bio-oil reforming
Long term target Long term target
State-of-the-art
(small scale demo plant)
< 10,000 Nm3/h >> 10,000 Nm3/h
Investment cost €2000/kWH2, LHV 2,660 1,500 900 530 a) O&M fixed cost % Invest./a 7 6 6 6 O&M variable cost €2000/Nm3 a) capital costs for bio-oil reformer, does not include costs for pyrolyzing biomass; bio-oil feed price is assumed to be 0.12 $/kg (~7€/GJ)
CASCADE Mints D1.1 Fuel cell technologies and H2 production/distribution options
50
3.4 Other methods for hydrogen production The following sections summarise further processes for hydrogen production, which today are in a basic research phase and thus quite far away from a technical implementation. Although some authors already provide cost estimates for specific processes, we consider them as being highly unreliable, as there is still significant basic research required to understand and to set up a reliable technical process. This does not mean that some of these processes might not evolve further during the 50 years time horizon covered in CASCADE MINTS, but for the time being there is no basis for a sound technical and economic characterisation that is required to include these processes into the energy system models addressed in CASCADE MINTS.
3.4.1 Photoelectrochemical water splitting Photoelectrolysis of water is the process whereby light is used to directly split water into hydrogen and oxygen. This can be achieved by illuminating a wet semiconductor device either directly or via dye sensitisation. Such systems eliminate the need for two separate systems regarding power generation and electrolysis, and hence offer the potential for cost reduction of electrolytically produced hydrogen compared with conventional two-step technologies. The direct production of hydrogen via water splitting by sunlight requires a light-harvesting device in conjunction with water-splitting catalysts. The necessary semiconductor-based light-sensitive device is similar to a PV solar cell.
For direct photoelectrochemical decomposition of water to occur, several key criteria of the semiconductor must be met: the semiconductor system must generate sufficient voltage to split water, the energetic of the semiconductor must overlap that of the hydrogen and oxygen redox reactions, the semiconductor must be stable in aqueous electrolytes, and finally the charge transfer from the surface of the semiconductor must be fast enough not only to prevent corrosion, but also reduce energy losses due to overvoltage.
Research and development programs on Photoelectrolysis of water are in place in several countries such as the United States, Japan, Sweden or Switzerland. Photoelectrochemical hydrogen production is in an early stage of development, and it depends on a breakthrough in materials development. One of the main technical problems related to the use of photoelectrochemical cells is the stability of electrodes against corrosion. Research activities focus on the development of appropriate semiconducting materials and surface treatment to increase the semiconductor’s stability. Amorphous silicon (Varner et al. 2002) or gallium based materials (Turner 2003 et al.) are being considered for this technology. Different coating options are analysed to increase the stability of the semiconductor.
While the efficiency of the electrolysis in a photoelectrochemical system can be higher than in a conventional electrolysis due to the lower voltage required, theoretically the overall efficiency for photoelectrochemical water splitting is around 24 % (Winter and Nitsch 1988). System efficiencies of 10 to 12 % have been achieved in the laboratory, but these high efficiency systems have extremely short lifetimes (< 20 hours). A solar-to-hydrogen efficiency of 16%—the highest reported efficiency to date—was achieved using a tandem photo-electrochemical cell (IEA 2004a). The materials used in this cell are still too costly for this to be an economically competitive technology in the near term. A potential future system will likely be a compromise between efficiency and lifetime. Current research targets are to achieve a 10 % solar-to-hydrogen efficiency at a 10 year cell lifetime, with hydrogen production costs of 3 $/kg (Turner 2003).

CASCADE Mints D1.1 Fuel cell technologies and H2 production/distribution options
51
Assuming an efficiency of 5 to 10 %, the potential for hydrogen production with photo-electrochemical water splitting methods is comparable to that of solar cells combined with electrolysis. Today, with research still focused on the development of appropriate stable semiconductor materials, it is not possible to give a definitive statement about the technical feasibility or a possible point in time when such a system might become practical.
3.4.2 Biological hydrogen production Green algae capture energy from sunlight. Under anaerobic conditions, the green algae produce a hydrogenase enzyme which produces hydrogen from water by a process known as bio-photolysis. The conditions must be carefully regulated, since the hydrogenase enzyme works in the dark phase and is sensitive to the presence of oxygen produced from photosynthesis. Basic research, which is progressing under the IEA Task 15 ‘Photobiological Production of Hydrogen’ is still in a very early stage. The overall objective set out for the IEA Task 15 program is to ‘sufficiently advance the basic and early stage applied science in this area of research to allow an evaluation of the potential of such a technology to be developed as a practical renewable energy source for the 21st century’ (IEA 2004b). Current laboratory work demonstrates the feasibility of using algal cultures to photoproduce hydrogen continuously for 3-4 days (Ghirardi et al. 2002). The major research challenges however still are to increase hydrogen production by a factor of at least 10, and to increase the solar energy conversion efficiency from 5 % to at least 10 % (Dutton 2002).
The second main biological pathway to hydrogen uses fermentation without the need for light. This is a dark, anaerobic process carried out by many species of bacteria, one of which (Clostridia) has been singled out for particular attention. The reaction involves a hydrogenase enzyme acting on carbohydrates to produce hydrogen and carbon dioxide (Dutton 2002):
C6H12O6 + 2H2O CH3COOH + 2CO2 + 4H2
Laboratory studies have concentrated on pure microbial cultures, sterile feedstocks, and batch operation. Potential feedstocks include sugar cane or the organic fraction of municipal waste. The theoretical yield is 0.5 m3 H2/kg carbohydrate, although this is yet to be achieved, largely because the reaction is hindered by increasing hydrogen concentration. Fermentative bacteria can multiply rapidly and produce high quantities of hydrogen, but the design and the operational parameters of the process are not yet well established, so that there is still basic research required to further understand and improve the process.
3.4.3 Hydrogen production from thermochemical cycle processes Water can be split thermally only at very high temperatures above 2,000 K. To avoid materials problems occurring at these high temperatures, in contrast to direct thermal water splitting, thermochemical cycle processes utilise the coupling of several equilibrium reactions which in separate process steps and at different temperature levels permit the separate release of hydrogen and oxygen at temperatures of less than 1,200 K. Thermochemical cycles are Carnot-limited, for an upper temperature of 1,000 K and a lower temperature of 300 K the maximum theoretical efficiency is 88 %.
During the 1970/80ies, some 2,000 to 3,000 cycles have been ‘invented’ and analysed in theory (Wendt and Bauer 1988). After examining their feasibility with respect to reaction and process technology, only some 20 to 30 remained, some of which were examined in some detail as to their reaction technology. They were grouped in ‘families’ according to the
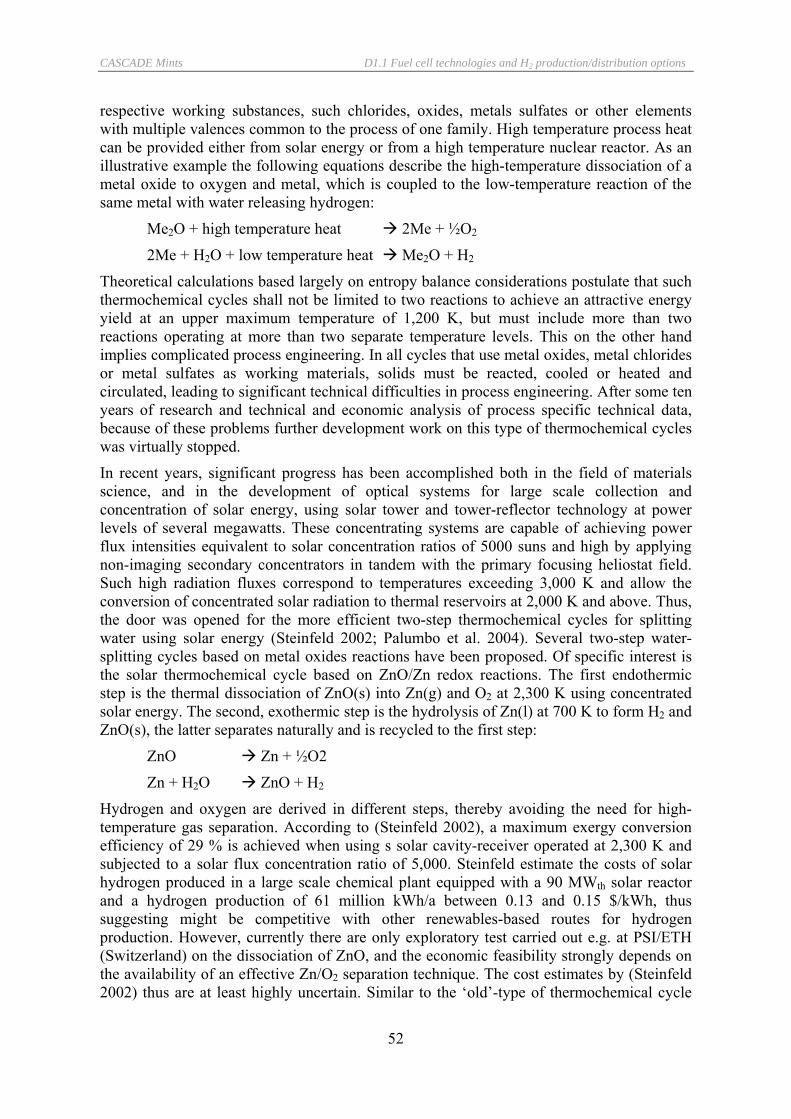
CASCADE Mints D1.1 Fuel cell technologies and H2 production/distribution options
52
respective working substances, such chlorides, oxides, metals sulfates or other elements with multiple valences common to the process of one family. High temperature process heat can be provided either from solar energy or from a high temperature nuclear reactor. As an illustrative example the following equations describe the high-temperature dissociation of a metal oxide to oxygen and metal, which is coupled to the low-temperature reaction of the same metal with water releasing hydrogen:
Me2O + high temperature heat 2Me + ½O2
2Me + H2O + low temperature heat Me2O + H2
Theoretical calculations based largely on entropy balance considerations postulate that such thermochemical cycles shall not be limited to two reactions to achieve an attractive energy yield at an upper maximum temperature of 1,200 K, but must include more than two reactions operating at more than two separate temperature levels. This on the other hand implies complicated process engineering. In all cycles that use metal oxides, metal chlorides or metal sulfates as working materials, solids must be reacted, cooled or heated and circulated, leading to significant technical difficulties in process engineering. After some ten years of research and technical and economic analysis of process specific technical data, because of these problems further development work on this type of thermochemical cycles was virtually stopped.
In recent years, significant progress has been accomplished both in the field of materials science, and in the development of optical systems for large scale collection and concentration of solar energy, using solar tower and tower-reflector technology at power levels of several megawatts. These concentrating systems are capable of achieving power flux intensities equivalent to solar concentration ratios of 5000 suns and high by applying non-imaging secondary concentrators in tandem with the primary focusing heliostat field. Such high radiation fluxes correspond to temperatures exceeding 3,000 K and allow the conversion of concentrated solar radiation to thermal reservoirs at 2,000 K and above. Thus, the door was opened for the more efficient two-step thermochemical cycles for splitting water using solar energy (Steinfeld 2002; Palumbo et al. 2004). Several two-step water-splitting cycles based on metal oxides reactions have been proposed. Of specific interest is the solar thermochemical cycle based on ZnO/Zn redox reactions. The first endothermic step is the thermal dissociation of ZnO(s) into Zn(g) and O2 at 2,300 K using concentrated solar energy. The second, exothermic step is the hydrolysis of Zn(l) at 700 K to form H2 and ZnO(s), the latter separates naturally and is recycled to the first step:
ZnO Zn + ½O2
Zn + H2O ZnO + H2
Hydrogen and oxygen are derived in different steps, thereby avoiding the need for high-temperature gas separation. According to (Steinfeld 2002), a maximum exergy conversion efficiency of 29 % is achieved when using s solar cavity-receiver operated at 2,300 K and subjected to a solar flux concentration ratio of 5,000. Steinfeld estimate the costs of solar hydrogen produced in a large scale chemical plant equipped with a 90 MWth solar reactor and a hydrogen production of 61 million kWh/a between 0.13 and 0.15 $/kWh, thus suggesting might be competitive with other renewables-based routes for hydrogen production. However, currently there are only exploratory test carried out e.g. at PSI/ETH (Switzerland) on the dissociation of ZnO, and the economic feasibility strongly depends on the availability of an effective Zn/O2 separation technique. The cost estimates by (Steinfeld 2002) thus are at least highly uncertain. Similar to the ‘old’-type of thermochemical cycle

CASCADE Mints D1.1 Fuel cell technologies and H2 production/distribution options
53
processes, the ZnO/Zn process has to face the challenge of handling large volume streams of solid materials for producing a relevant amount of hydrogen. Further development work is currently focused on solar chemical reactor modelling, and on designing a better quench method for recovering Zn. The benchmark against which the process has to prove its technical and economic viability in the future is hydrogen production from electrolysis with electricity from solar thermal power plants.
3.5 Summary: technical and economic characteristics of hydrogen production options
To provide a consistent set of input data to the CASCADE MINTS modelling activities, Table 3.15 summarises the key technical and economic parameters of the various hydrogen production options discussed above. While the underlying literature in some cases indicates a broad range of different values, the present recommendations are based on a thorough analysis of the relevant literature, plausibility considerations, a discussion process with relevant experts, and expert judgement. It is recommended to carry out some sensitivity analysis within the CASCADE MINTS modelling activities on key parameters that turn out to have a major influence on the final results.
The learning curve approach followed in CASCADE MINTS requires the specification of floor costs, which are difficult to derive for some of the technologies considered. For the other hydrogen production options, which in many cases are based on the further development of well established technologies, no bottom-up estimates of floor costs were available. For the purpose of the present study we assume that floor costs are around 75% of the given long term target costs, which in general is in line with very optimistic estimates of long term target costs. This assumption shall be revisited in a sensitivity analysis if the subsequent modelling will result in a strong influence of the assumed floor costs on the modelling results.
Table 3.14: Floor cost estimates for hydrogen production options
€/kWH2
Electrolyser - small scale on-site - large scale
480 380
Steam methane reforming - small scale - large scale - Solar methane reforming
490 240 280
Heavy oil partial oxidation 360
Coal gasification 670
Biomass gasification 675
Bio oil reforming (from Pyrolysis) 400
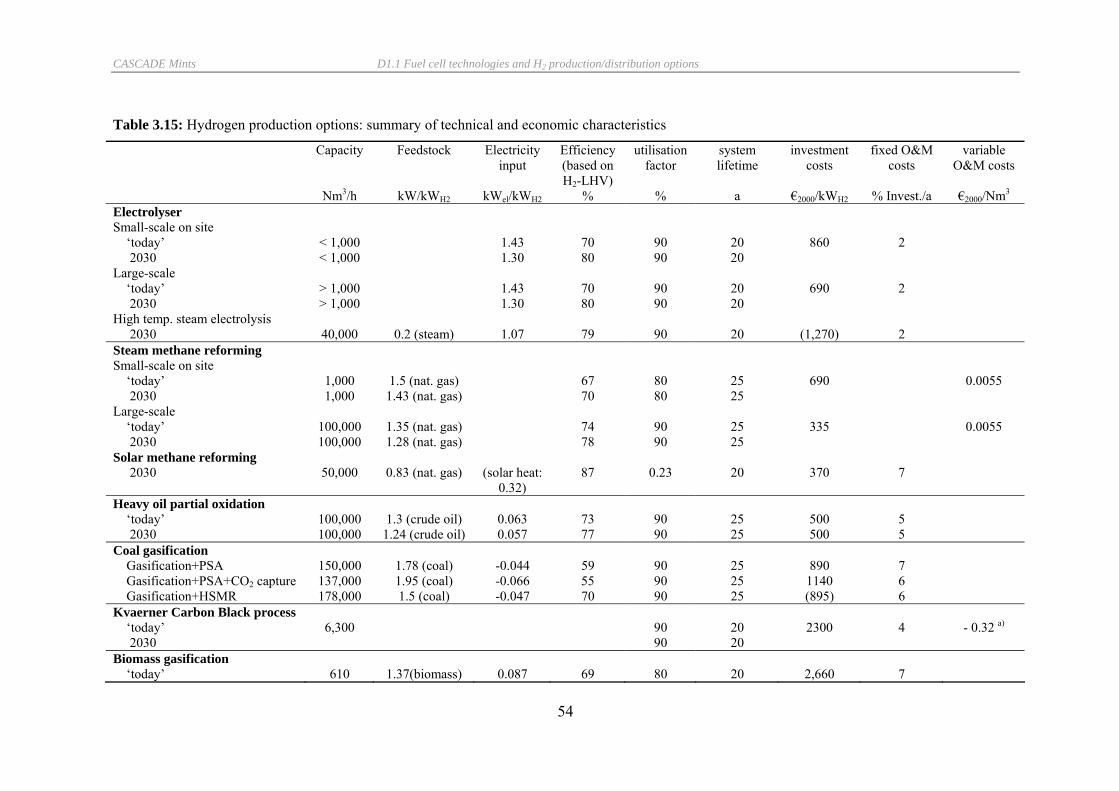
CASCADE Mints D1.1 Fuel cell technologies and H2 production/distribution options
54
Table 3.15: Hydrogen production options: summary of technical and economic characteristics
Capacity
Nm3/h
Feedstock
kW/kWH2
Electricity input
kWel/kWH2
Efficiency (based on H2-LHV)
%
utilisation factor
%
system lifetime
a
investment costs
€2000/kWH2
fixed O&M costs
% Invest./a
variable O&M costs
€2000/Nm3
Electrolyser Small-scale on site ‘today’ < 1,000 1.43 70 90 20 860 2 2030 < 1,000 1.30 80 90 20 Large-scale ‘today’ > 1,000 1.43 70 90 20 690 2 2030 > 1,000 1.30 80 90 20 High temp. steam electrolysis 2030 40,000 0.2 (steam) 1.07 79 90 20 (1,270) 2 Steam methane reforming Small-scale on site ‘today’ 1,000 1.5 (nat. gas) 67 80 25 690 0.0055 2030 1,000 1.43 (nat. gas) 70 80 25 Large-scale ‘today’ 100,000 1.35 (nat. gas) 74 90 25 335 0.0055 2030 100,000 1.28 (nat. gas) 78 90 25 Solar methane reforming 2030 50,000 0.83 (nat. gas) (solar heat:
0.32) 87 0.23 20 370 7
Heavy oil partial oxidation ‘today’ 100,000 1.3 (crude oil) 0.063 73 90 25 500 5 2030 100,000 1.24 (crude oil) 0.057 77 90 25 500 5 Coal gasification Gasification+PSA 150,000 1.78 (coal) -0.044 59 90 25 890 7 Gasification+PSA+CO2 capture 137,000 1.95 (coal) -0.066 55 90 25 1140 6 Gasification+HSMR 178,000 1.5 (coal) -0.047 70 90 25 (895) 6 Kvaerner Carbon Black process ‘today’ 6,300 90 20 2300 4 - 0.32 a) 2030 90 20 Biomass gasification ‘today’ 610 1.37(biomass) 0.087 69 80 20 2,660 7

CASCADE Mints D1.1 Fuel cell technologies and H2 production/distribution options
55
Capacity
Nm3/h
Feedstock
kW/kWH2
Electricity input
kWel/kWH2
Efficiency (based on H2-LHV)
%
utilisation factor
%
system lifetime
a
investment costs
€2000/kWH2
fixed O&M costs
% Invest./a
variable O&M costs
€2000/Nm3
2030 6,400 1.30(biomass) 0.078 72 90 25 900 6 Biomass Pyrolysis/bio-oil reforming
‘today’ 2030 35,130 2.04 b) 49 90 25 530 c) 6 a) credit for carbon black; b) pyrolysis bio-oil feed; c) capital costs for bio-oil reformer, does not include costs for pyrolyzing biomass

CASCADE Mints D1.1 Fuel cell technologies and H2 production/distribution options
56
4 Hydrogen Storage Options
4.1 Liquefaction
4.1.1.1 Basic mechanism The process to liquefy hydrogen is complex and energy intensive. Theoretically, about 14.2 MJ/kg H2 have to be removed to cool hydrogen gas from 298 K (25°C) to 20.3 K and to condense the gas at 20.3 K and atmospheric pressure (Bossel, Elliasson et al. 2003; Quark 2004). Different thermodynamic processes are applied to cool hydrogen to very low temperatures and finally expand the gas in a Joule-Thompson valve or a cryogenic turbine.
Linde AG uses in the lower capacity range between 150 and 1000 l/h the helium process to cool the hydrogen. In the range of 1000 l/h up to 20,000 l/h a hydrogen Claude process with expansion and liquid nitrogen pre-cooling is used (Linde, web). Key components of the technical realisation of these processes are dry piston or oil injected screw recycle compressors, oil bearing turbo expanders, liquefier cold box, liquid nitrogen pre-cooling, multi-stage ortho-para conversion with up to 98% p-LH2 and low temperature absorber for final purification.
The difference between Ortho and Para hydrogen is the orientation of their nuclear spin. It is important to transfer normal hydrogen (75% Ortho, 25% Para) completely into Para hydrogen (99.8%), because conversion releases energy higher than the heat of evaporation and thus contributes to boil-off in the storage vessel. Catalytic processes are used for ortho-para conversion.
4.1.1.2 Fields of application Liquid hydrogen today is produced because of advantages in transportation. There are 10 hydrogen liquefaction plants in the U.S. with production rates of 5,400 to 32,000 kg/d (Drnevich 2003), and 3 plants in Europe with capacities of 5,000 kg/d (NL), 10,500 kg/d (FR) and 4,400 kg/d (DE) (Tzimas, Filiou et al. 2003).
Figure 4.1: North America liquid hydrogen capacity (Source: Drnevich (2003)).
t / d
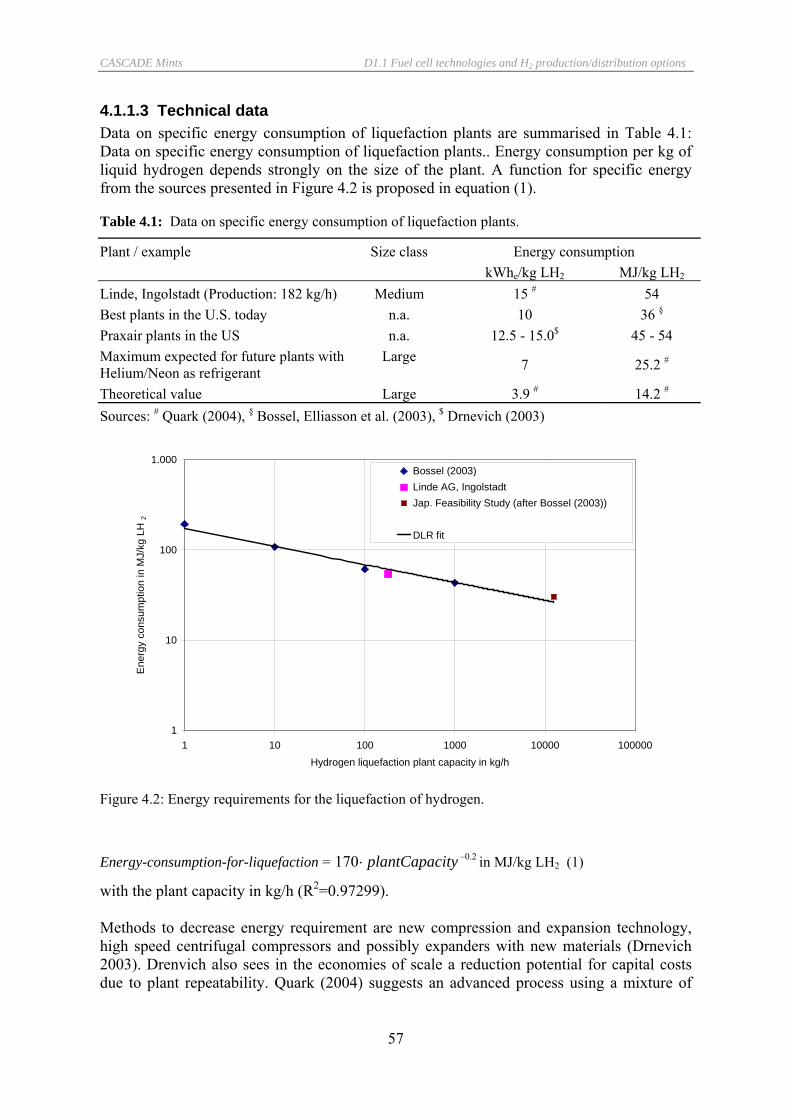
CASCADE Mints D1.1 Fuel cell technologies and H2 production/distribution options
57
4.1.1.3 Technical data Data on specific energy consumption of liquefaction plants are summarised in Table 4.1: Data on specific energy consumption of liquefaction plants.. Energy consumption per kg of liquid hydrogen depends strongly on the size of the plant. A function for specific energy from the sources presented in Figure 4.2 is proposed in equation (1).
Table 4.1: Data on specific energy consumption of liquefaction plants.
Plant / example Size class Energy consumption kWhe/kg LH2 MJ/kg LH2 Linde, Ingolstadt (Production: 182 kg/h) Medium 15 # 54 Best plants in the U.S. today n.a. 10 36 § Praxair plants in the US n.a. 12.5 - 15.0$ 45 - 54 Maximum expected for future plants with Helium/Neon as refrigerant
Large 7 25.2 #
Theoretical value Large 3.9 # 14.2 # Sources: # Quark (2004), § Bossel, Elliasson et al. (2003), $ Drnevich (2003)
1
10
100
1.000
1 10 100 1000 10000 100000Hydrogen liquefaction plant capacity in kg/h
Ene
rgy
cons
umpt
ion
in M
J/kg
LH
2
Bossel (2003)Linde AG, IngolstadtJap. Feasibility Study (after Bossel (2003))
DLR fit
Figure 4.2: Energy requirements for the liquefaction of hydrogen.
Energy-consumption-for-liquefaction = 2.0170 −⋅ ityplantCapac in MJ/kg LH2 (1)
with the plant capacity in kg/h (R2=0.97299). Methods to decrease energy requirement are new compression and expansion technology, high speed centrifugal compressors and possibly expanders with new materials (Drnevich 2003). Drenvich also sees in the economies of scale a reduction potential for capital costs due to plant repeatability. Quark (2004) suggests an advanced process using a mixture of

CASCADE Mints D1.1 Fuel cell technologies and H2 production/distribution options
58
helium and neon as refrigerant. In his analysis, he finds an energy consumption of 6.5 kWh/kg (23.3 MJ/kg), and concludes that 7 kWh/kg LH2 including auxiliary power use should be technical feasible. Completely new approaches for low temperature refrigeration are magnetic refrigerators and acoustic refrigerators. Magneto caloric cooling may reduce liquefaction energy to 5.0 kWh/kg (Dutton 2003).
4.1.1.4 Economic data Costs for liquefaction are driven in the first place by capital costs (today: 63%), then energy costs (29%), and in the third place O&M (8%) (Drnevich 2003). Energy costs on the other hand are strong functions of the liquefier efficiency and less dependent on the production rate. In small plants, energy and non-energy costs are comparable. At large scale plants the energy costs become more important. Investment cost estimates are presented in Figure 4.3. We derive from the given information the following equation on specific investment costs: Specific investment cost for liquefier = ( ) 48.0.313,828 −⋅ capacityprod in €2000/(kg/h) (2)
1.000
10.000
100.000
10 100 1.000 10.000Production capacity in kg/h
Inve
stm
ent c
ost i
n € 2
000/(
kg/h
)
Taylor (1986)Amos (1998) functionSimbeck (2002)DLRNitsch (1989)
Figure 4.3: Investment cost for liquefaction battery (excl. storage).
Table 4.2: Cost estimates for liquefaction plants
Small Plants of ‘today’ Large Capacity kg/h 100 1000 10,000 Investment cost €2000/ (kg/h) 91,000 30,000 10,000 O&M % Total cost/a 8 § § Drnevich (2003)

CASCADE Mints D1.1 Fuel cell technologies and H2 production/distribution options
59
Methods to decrease capital costs are to build larger scale plants (350,000 kg/h) and to use the effect of building multiple plants of the same design. The following challenges for more cost effective LH2 production systems are (Drnevich 2003):
o System modularization for traditional sized units o Larger scale equipment o Higher efficiency compressors and expanders o More efficient refrigeration o Lower cost high-efficiency insulation

CASCADE Mints D1.1 Fuel cell technologies and H2 production/distribution options
60
Table 4.3: Hydrogen liquefaction: summary on technical and economic characteristic
Capacity Electricity input
Cooling water
Efficiency §
Utilisation System lifetime
Investment costs
O&M fixed costs
O&M variable
costs Nm3/h kWel/kgLH2 m3/kgLH2 % % a €2000/kWLH2 % Invest./a % Invest./a Liquefaction Small-scale
State-of-the-art > 1,000 15 1,6 69 74 25 2,730 8 Plants of ‘today’
State-of-the-art > 10,000 10 1,6 77 74 25 900 8 Long-term-target > 10,000 9 1,6 79 74 25
Large plants Long-term-target ~ 100,000 7 1,6 83 74 25
§ related to LHV
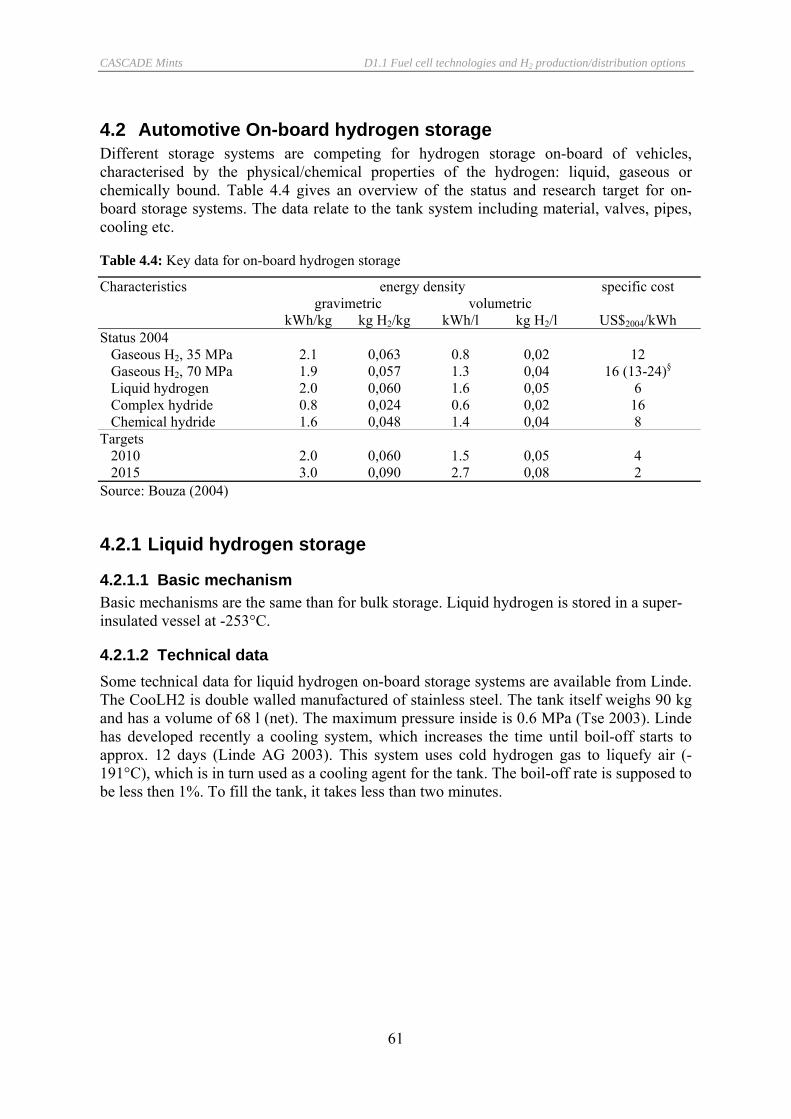
CASCADE Mints D1.1 Fuel cell technologies and H2 production/distribution options
61
4.2 Automotive On-board hydrogen storage Different storage systems are competing for hydrogen storage on-board of vehicles, characterised by the physical/chemical properties of the hydrogen: liquid, gaseous or chemically bound. Table 4.4 gives an overview of the status and research target for on-board storage systems. The data relate to the tank system including material, valves, pipes, cooling etc.
Table 4.4: Key data for on-board hydrogen storage
Characteristics energy density specific cost gravimetric volumetric kWh/kg kg H2/kg kWh/l kg H2/l US$2004/kWh
Status 2004 Gaseous H2, 35 MPa 2.1 0,063 0.8 0,02 12 Gaseous H2, 70 MPa 1.9 0,057 1.3 0,04 16 (13-24)§ Liquid hydrogen 2.0 0,060 1.6 0,05 6 Complex hydride 0.8 0,024 0.6 0,02 16 Chemical hydride 1.6 0,048 1.4 0,04 8 Targets 2010 2.0 0,060 1.5 0,05 4 2015 3.0 0,090 2.7 0,08 2 Source: Bouza (2004)
4.2.1 Liquid hydrogen storage
4.2.1.1 Basic mechanism Basic mechanisms are the same than for bulk storage. Liquid hydrogen is stored in a super-insulated vessel at -253°C.
4.2.1.2 Technical data Some technical data for liquid hydrogen on-board storage systems are available from Linde. The CooLH2 is double walled manufactured of stainless steel. The tank itself weighs 90 kg and has a volume of 68 l (net). The maximum pressure inside is 0.6 MPa (Tse 2003). Linde has developed recently a cooling system, which increases the time until boil-off starts to approx. 12 days (Linde AG 2003). This system uses cold hydrogen gas to liquefy air (-191°C), which is in turn used as a cooling agent for the tank. The boil-off rate is supposed to be less then 1%. To fill the tank, it takes less than two minutes.

CASCADE Mints D1.1 Fuel cell technologies and H2 production/distribution options
62
Figure 4.4: Model of the advanced CooLH2 vehicle fuel tank for liquid hydrogen by Linde AG (Source: www.linde-gas.de)
4.2.1.3 Economic data Costs for automotive liquid hydrogen storage are reported to 308 €/kWh (Grahl 2000). Assuming a volume of 70 l (Grahl 2000), this results to approximate investment costs of 50,000 €2000 for this kind of prototype tank system today.
There are no estimates of floor costs available.
4.2.2 Gaseous hydrogen storage
4.2.2.1 Basic mechanism To store hydrogen on-board of automobiles in gaseous form is currently the most simplest, technically mature and cheapest storage method. Compressed H2 tanks with pressures ranging from approx. 35 MPa up to approx. 70 MPa have been certified worldwide according to ISO 11439 (Europe), NGV 2 (U.S.), and Reijikijun Betten (Iceland) standards and approved by TÜV (Germany) and The High-Pressure Gas Safety Institute of Japan (KHK) (DoE 2003).
Lightweight pressure vessels, with minimum permeation losses, have been designed and fabricated. These vessels use lightweight bladder liners that act as inflatable mandrels for composite overwrap and as permeation barriers for gas storage. These tank systems have demonstrated 12 wt% hydrogen storage at 70 MPa (DoE 2004), together with a safety factor of 2.35 (158 MPa burst pressure) as required by the European Integrated Hydrogen Project specifications.
4.2.2.2 Economic data Compressed hydrogen storage systems at 35 MPa are the only systems which are currently available commercially. Storage units for buses fabricated from carbon composites cost about US$1000/kg H2 (Burke 2005). However it seems unlikely that these systems can
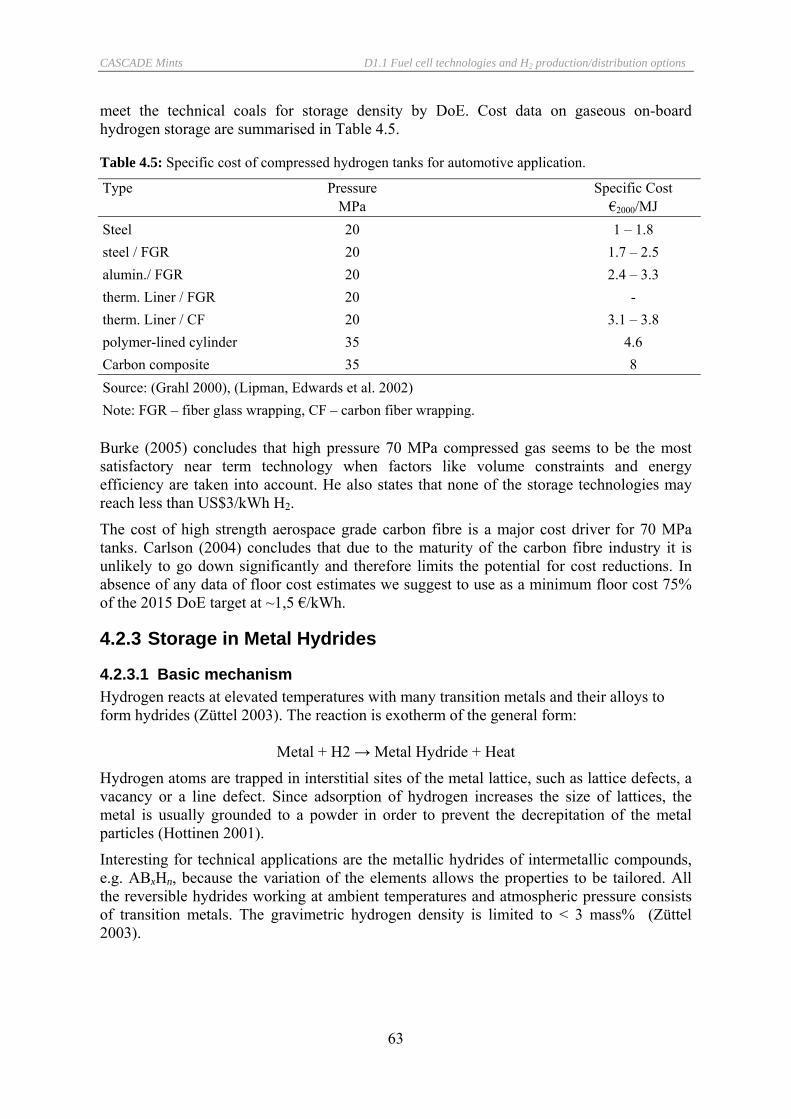
CASCADE Mints D1.1 Fuel cell technologies and H2 production/distribution options
63
meet the technical coals for storage density by DoE. Cost data on gaseous on-board hydrogen storage are summarised in Table 4.5.
Table 4.5: Specific cost of compressed hydrogen tanks for automotive application.
Type Pressure Specific Cost MPa €2000/MJ Steel 20 1 – 1.8 steel / FGR 20 1.7 – 2.5 alumin./ FGR 20 2.4 – 3.3 therm. Liner / FGR 20 - therm. Liner / CF 20 3.1 – 3.8 polymer-lined cylinder 35 4.6 Carbon composite 35 8 Source: (Grahl 2000), (Lipman, Edwards et al. 2002) Note: FGR – fiber glass wrapping, CF – carbon fiber wrapping. Burke (2005) concludes that high pressure 70 MPa compressed gas seems to be the most satisfactory near term technology when factors like volume constraints and energy efficiency are taken into account. He also states that none of the storage technologies may reach less than US$3/kWh H2.
The cost of high strength aerospace grade carbon fibre is a major cost driver for 70 MPa tanks. Carlson (2004) concludes that due to the maturity of the carbon fibre industry it is unlikely to go down significantly and therefore limits the potential for cost reductions. In absence of any data of floor cost estimates we suggest to use as a minimum floor cost 75% of the 2015 DoE target at ~1,5 €/kWh.
4.2.3 Storage in Metal Hydrides
4.2.3.1 Basic mechanism Hydrogen reacts at elevated temperatures with many transition metals and their alloys to form hydrides (Züttel 2003). The reaction is exotherm of the general form:
Metal + H2 → Metal Hydride + Heat
Hydrogen atoms are trapped in interstitial sites of the metal lattice, such as lattice defects, a vacancy or a line defect. Since adsorption of hydrogen increases the size of lattices, the metal is usually grounded to a powder in order to prevent the decrepitation of the metal particles (Hottinen 2001).
Interesting for technical applications are the metallic hydrides of intermetallic compounds, e.g. ABxHn, because the variation of the elements allows the properties to be tailored. All the reversible hydrides working at ambient temperatures and atmospheric pressure consists of transition metals. The gravimetric hydrogen density is limited to < 3 mass% (Züttel 2003).

CASCADE Mints D1.1 Fuel cell technologies and H2 production/distribution options
64
4.2.3.2 Economic data The system for hydrogen storage in metal hydrides consist of the material itself, a pressure vessel and an integrated heat exchanger for cooling and heating during absorption and desorption (Amos, 1998). As the developments are in a laboratory phase, nothing is known about the cost of the equipment. Carpetis (1994) states that much of the capital cost is for hydride material itself. Amos (1998) starts his analysis with base costs for metal hydride of 2,200 €2000/kg with a sizing exponent of 1.
Table 4.6: Economic data for metal hydride storage
Size Size Cost Cost / kg Source kg Nm3 € 2000 € 2000 /kg n/a 2,100 Carpetis 1994 * n/a 2,500 - 3,100 Carpetis 1994 * 0.036 70,900 Hydrogen Components Inc.
1997 * 1,000 - 1,500 Oy 1992 * 8.9-890 1,700 - 2,100 Oy 1992 * 2.7 3,700 - 14,400 Zittel and Wurster 1996 * 0.089 7,100 - 26,000 Zittel and Wurster 1996 * 0.89 2,400 - 13,000 Zittel and Wurster 1996 * 8.9 2,600 - 9,700 Zittel and Wurster 1996 * 1 400-1500 LBST 10 200-750 LBST 100 150-550 LBST *cited from Amos (1998)
4.2.4 Storage in Metall Hydrides: Hydride Slurries
4.2.4.1 Basic mechanism The limiting factor in the kinetics of hydrides is the conductivity of the heat needed in the sorption reactions of hydrogen. One way of solving this problem is to suspend the hydride powder in to an inert solution forming a pumable slurry. An essential feature of this approach is the recovery and recycling of the spent hydride in centralised plants (Hottinen 2001).
Three approaches are discussed by DOE for hydrogen storage for automotive fuel cells (Milliken, Petrovic et al. 2002).
• Borax: 20-35% sol. Stabilized with 1-3% NaOH to from Borax in NaOH (Millenium Cell/DaimlerChrysler)
NaBH4 + 2H2O → NaBO2 + 4H2
CASCADE Mints D1.1 Fuel cell technologies and H2 production/distribution options
65
• Lithium hydride slurry, suspended in light mineral oil, is transformed with water into lithium hydroxide and pure hydrogen. A hydrogen capacity of 15.3% can be achieved with this reaction (Hottinen 2001) (“Thermopower”)
2LiH + 2H2O → 2LiOH + 2H2
• Polyethylene-coated pellets, mechanically cut to expose Na (“Powerball”)
2Na + 2H2O → 2NaOH + H2
4.2.4.2 Economic data Economic data on hydride slurries are presently not available to the authors.
4.2.5 Other forms of hydrogen storage for automotive applications
4.2.5.1 Zeolites Zeolites are microporous inorganic compounds with an effective pore size of about 0.3 – 1.0 nm. The pore size is sufficient to permit the diffusion of some small molecules, such as hydrogen, under elevated temperatures and pressures. However most of the pores are smaller than the kinetic size of a hydrogen molecule in ambient temperature. Thus reducing the temperature the hydrogen is trapped into cavities of the molecular sieve host (Hottinen 2001).
The hydrogen storage capacity of zeolites is quite poor. At temperatures of 200 – 300 °C and pressures of about 100-600 bar about 0.1 – 0.8 wt% of hydrogen is adsorbed. The cyclic stability of zeolites has not been really studied. Ernst (1995) suggested that by applying sophisticated techniques of synthesis and modification there may be a potential in zeolites (Hottinen 2001).
For CASCADE MINTS, zeolites may not play a relevant role because of the poor storage capabilities.
4.2.5.2 Glass spheres Glass spheres are small hollow glass micro-balloons whose diameter vary from 25 um to 500 um and whose wall thickness is about 1 um. The spheres are filled with hydrogen at high pressure and temperature of about 200 – 400°C. High temperature makes the glass wall permeable and the hydrogen is able to fill in. Once the glass is cooled down to ambient temperature, the hydrogen is trapped inside the spheres.
The hydrogen can be released by heating or crushing the spheres. The crushing naturally prevents the reuse of spheres. The storage capacity of spheres is about 5 –6 wt% at 200 – 490 bar (Hottinen 2001).
4.2.5.3 Chemically stored hydrogen Hydrogen can be stored in chemical form, which is also a kind of storage. Examples are methanol CH2OH, ammonia NH3 and methylcyclohexane CH3C6H12. In ambient condition, these compounds are liquid and thus are good to handle. However the application of these NH3 or CH3C6H12 in large scale is unlikely because of environmental hazards (Hottinen 2001).
CASCADE Mints D1.1 Fuel cell technologies and H2 production/distribution options
66
Hydrogen storage capacities of these chemical compounds are good
8.9 wt% for CH2OH
15.1 wt% for NH3
13.2 wt% for CH3C6H12.
4.2.5.4 Hydrogen storage in carbon structures Carbon nanotubes A nanotube is a graphite sheet rolled up in a seamless cylinder with a diameter in a scale of nanometers. Hydrogen can be stored in nanotubes by chemisorption or physisorption. The mechanisms of how the hydrogen is trapped are not known accurately.
Recent experimental results on hydrogen uptake of single-walled nanotubes are promising. At 0.67 bar and 600 K about 7 wt% of hydrogen have been adsorbed and desorbed with a good cycling stability (Alleman, 2000).
The price of nanotubes is quite high. Depending on the manufacturer, the amount of nanotubes purchased, and the purity of nanotubes the price varies between 55 – 550 €/g.
Even though the price of nanotubes is still high, they have a good potential in storing hydrogen (Hottinen 2001). Other forms of carbon (Hottinen 2001)
Storage in other forms of carbon is also known. There are graphite nanofibers, fullerenes and activated carbon. Graphite nanofibers are graphite sheets arranged in parallel, perpendicular or at angle rotation structure. One author reported high uptake of hydrogen, however others have not been able to reproduce the high results. More research will be necessary.
Fullerenes are synthesized carbon molecules usually shaped like a football, such as C60 and C70. Fullerenes are able to hydrogenate, where approx. 6wt% of hydrogen can be adsorbed. Usually temperatures of over 400°C are needed to desorb the hydrogen. However one author claims this works also at 225°C. Besides, the cyclic stabilities have shown poor performance.
Bulky carbon with high surface area is called activated carbon, which is able to adsorb hydrogen in its macroscopic pores. However cryogenic temperatures and pressures of about 50 – 60 bar are needed.

CASCADE Mints D1.1 Fuel cell technologies and H2 production/distribution options
67
4.3 Bulk storage of hydrogen
4.3.1 Liquid hydrogen storage
4.3.1.1 Basic mechanism Storage of larger quantities of liquid hydrogen can either be necessary at liquefaction plants or at distribution centres, like e.g. fuelling stations. Hydrogen is only liquid at extreme low temperatures ~ 20 K (-253°C) at 0,1 MPa. Therefore the storage vessel has to be of cold-resistant austenitic or alloy steels and non-metal materials. If there is any increase in temperature, hydrogen evaporates and increases the pressure in the vessel; this phenomenon is also called the boil-off. To avoid high pressures, the vessels are usually designed as open systems. To minimise boil-off, liquid storage systems are extremely insulated: vacuum insulation, vapor-cooled radiation shields and multi-layer insulation are applied to diminish conductive, convective and radiative heat transfer into the liquid. However, some losses are unavoidable, and the boil-off is apart from the costs the most significant factor.
Figure 4.5: Sketch of the insulation of a cryogenic tank for liquid hydrogen (according to (Hottinen 2001)).
4.3.1.2 Fields of application Storage vessels for liquid hydrogen are state-of-the-art technology today. Large-scale applications are developed by the space programs in the U.S. and the USSR. NASA uses tanks up to 3.8 x 10³ m3 of about 22 m in diameter with a capacity of 230 t to store liquid hydrogen for the Space Shuttle, which burns 1535 m3 (120 t) of liquid hydrogen per start. This is the largest known tank in the world (Tzimas, Filiou et al. 2003). For the ‘Energia’ space project with the “Buran” shuttle type spacecraft (1976-1988) several storages where build up to a total volume 8,300 m3 (CRYOGENMASH 2004).
The commercial world market for cryogenic equipment is currently shared by just a few companies such as Linde AG (Germany), Air Liquide (France), Air Products, Praxair (U.S.A), British Oxygen Company (U.K.), Kobe Steel (Japan), and JSC Cryogenmash (Russia).
High vacuum vapor- or liquidcooled radiationshield
Multi-layer insulation of reflective,low-emittance heat shieldingmaterial, such as Mylar
High vacuum
Liquid hydrogenat T = -253°C
T = 300°C

CASCADE Mints D1.1 Fuel cell technologies and H2 production/distribution options
68
Figure 4.6: Liquid hydrogen storage of Linde AG in Ingolstadt, Germany (Source: Schmidtchen (2003)).
4.3.1.3 Technical data The boil-off rate is a function of size, shape and thermal insulation of the vessel. Therefore most vessels are spherical and thus minimize the surface area for the given volume. On the other hand, the bigger the volume, the lower the surface-to-volume ratio. Therefore boil-off for large vessels is generally lower than for smaller ones. Züttel (2003) provides average values for double-walled, vacuum-insulated spherical dewars of 50, 100 and 20,000 m3 volume to 0.4%, 0.2% and 0.06% respectively.
0,01
0,1
1
10
10 100 1000 10000 100000
Storage capacity in m3
boil-
off i
n %
Domashenko (2002)
Züttel
DLR
Figure 4.7: Boil-off rate of large liquid hydrogen storage tanks.
Estimated storage densities of liquid hydrogen are in the range of 4.2 – 5.6 MJ/liter (Thomas und Keller 2003).

CASCADE Mints D1.1 Fuel cell technologies and H2 production/distribution options
69
Storage can be built and used modular of the size of the largest tanks of ‘today’, or build larger. Storage volumes of approx. 60 m3 are appropriate to be used for local storage at filling stations or other consumers and therefore labelled ‘local’.
Table 4.7: Technical data of liquid hydrogen storage tanks.
‘Local’ Large/‘today’ Large/‘long-term’Storage volume m3 60 3,000 100,000 Storage capacity t 3.8 191 6,371 Thermal capacity MWhth 127 6,370 212,349 Technical system lifetime a 30 30 30 Utilisation by volume % 90 90 90 Utilisation by time § h/a 8400 8400 Evaporation loss (boil-off) % 0,4 0,07 0,01 § Amos (1998).
4.3.1.4 Economic data Costs for liquid hydrogen storage are often presented together with the liquefier costs in the literature. It should be noted that both cost items are presented separately here.
Costs for liquid storage are driven by the installation costs of the tank. In addition, interconnecting pipes, valves and pumps are needed. Capital costs per kg of installed capacity are summarised in Figure 4.8. Until better data is available, the function for the total investment cost, adapted from Amos (1998) is recommended:
Capital cost of liquid storage tank = 7.0
45445,23 ⎟
⎠⎞
⎜⎝⎛⋅
kgincapacity in €2000
10
100
1.000
100 1.000 10.000 100.000 1.000.000 10.000.000
Storage capacity in kg
Inve
stm
ent c
ost i
n € 2
000/k
g
Amos (1996), function
Taylor (1986), Scenario II assumption
Taylor (1986), vacuum-perlite spheres, various source
Figure 4.8: Investment cost for the installation of liquid hydrogen tanks for bulk storage. Again there are no data available for floor costs. As liquid hydrogen storage is a proven technology and considerable capacity has been installed already, however the number of installation sites world-wide would of course increase dramatically if used in a hydrogen

CASCADE Mints D1.1 Fuel cell technologies and H2 production/distribution options
70
economy. Therefore we suggest to use for modelling purposes 75% of current costs for minimum floor costs.
Specific investment costs depend on the size and the usage of the storage. Different scenarios are calculated and presented in Table 4.8. Time-of-storage is defined as the time period liquid hydrogen can be derived from the storage at net production rate. The boil-off is calculated assuming steady-state where the boil-off rate depends only on the size and quality of the storage vessel (according to Amos (1998)). If the storage situated at a liquefaction plant, the cold gas due to boil-off would generally be taken back to the liquefier. At combined liquid-to-liquid and liquid-to-gas filling stations, it is used in the gas loop. In other case provisions might be taken to use the gaseous hydrogen differently. For future application, it might be possible to insulate the storage in addition with liquid nitrogen or air which however requires additional energy expenses.
Table 4.8: Scenarios for liquid hydrogen storage utilisation
prod
uctio
n flo
w-to
-sto
rage
(in
cl. b
oil-o
ff)
net p
rodu
ctio
n ra
te
Tim
e of
stor
age
Boi
l-off
rate
Stor
age
capa
city
Stor
age
capa
city
net p
rodu
ctio
n ra
te
Invs
etm
ent c
ost
Col
d ga
s bac
k to
liq
uefie
r or l
oss
kg/h kg/h d % m3 kg kW €2000/kW kg H2/h
10 10 1 1.55 4 240 333 227 0.15
101 100 1 0.52 37 2,400 3,333 114 0.52
1,002 1,000 1 0.18 373 24,000 33,333 57 1.77
10,006 10,000 1 0.06 3,729 240,000 333,333 29 6.01
10 10 2 1.12 7 480 333 369 0.22
101 100 2 0.38 75 4,800 3,333 185 0.75
1,003 1,000 2 0.13 746 48,000 33,333 93 2.56
10,009 10,000 2 0.04 7,459 480,000 333,333 46 8.68
10 10 8 0.58 30 1,920 333 973 0.45
102 100 8 0.20 298 19,200 3,333 488 1.56
1,005 1,000 8 0.07 2,983 192,000 33,333 244 5.33
10,018 10,000 8 0.02 29,835 1,920,000 333,333 123 18.09
11 10 30 0.31 112 7,200 333 2,455 0.90
103 100 30 0.11 1,119 72,000 3,333 1,230 3.13
1,011 1,000 30 0.04 11,188 720,000 33,333 617 10.71
10,036 10,000 30 0.01 111,880 7,200,000 333,333 309 36.42
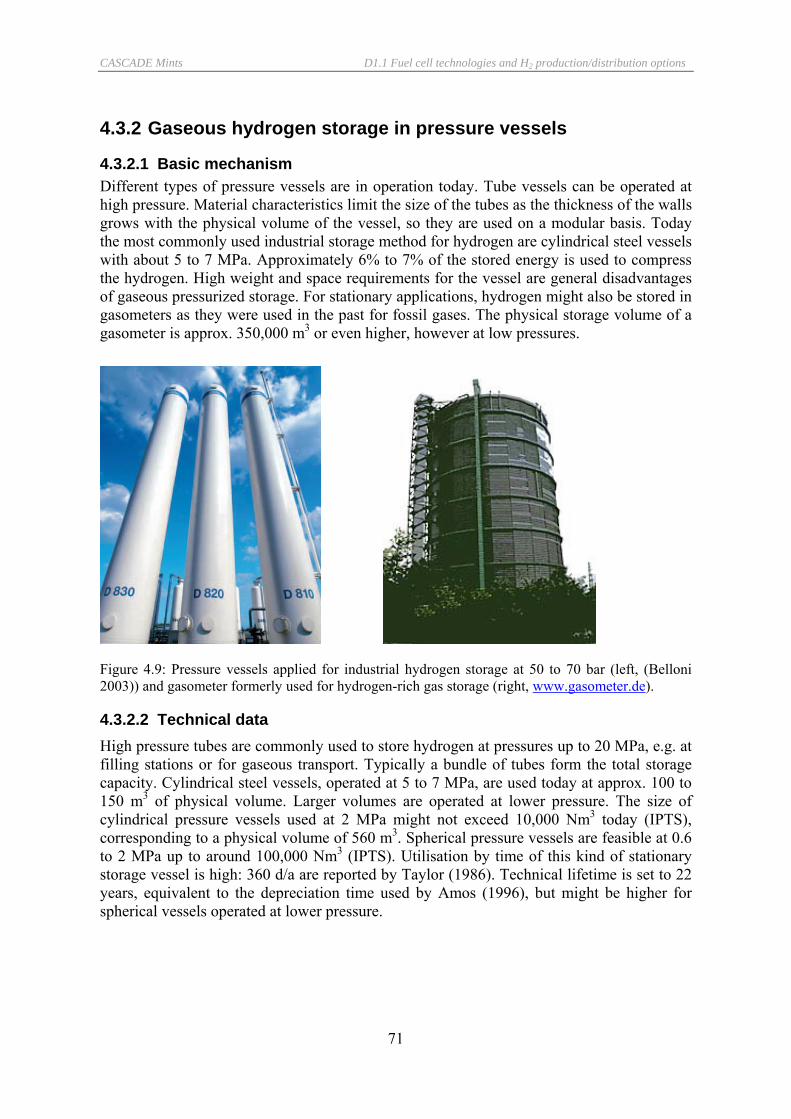
CASCADE Mints D1.1 Fuel cell technologies and H2 production/distribution options
71
4.3.2 Gaseous hydrogen storage in pressure vessels
4.3.2.1 Basic mechanism Different types of pressure vessels are in operation today. Tube vessels can be operated at high pressure. Material characteristics limit the size of the tubes as the thickness of the walls grows with the physical volume of the vessel, so they are used on a modular basis. Today the most commonly used industrial storage method for hydrogen are cylindrical steel vessels with about 5 to 7 MPa. Approximately 6% to 7% of the stored energy is used to compress the hydrogen. High weight and space requirements for the vessel are general disadvantages of gaseous pressurized storage. For stationary applications, hydrogen might also be stored in gasometers as they were used in the past for fossil gases. The physical storage volume of a gasometer is approx. 350,000 m3 or even higher, however at low pressures.
Figure 4.9: Pressure vessels applied for industrial hydrogen storage at 50 to 70 bar (left, (Belloni 2003)) and gasometer formerly used for hydrogen-rich gas storage (right, www.gasometer.de).
4.3.2.2 Technical data High pressure tubes are commonly used to store hydrogen at pressures up to 20 MPa, e.g. at filling stations or for gaseous transport. Typically a bundle of tubes form the total storage capacity. Cylindrical steel vessels, operated at 5 to 7 MPa, are used today at approx. 100 to 150 m3 of physical volume. Larger volumes are operated at lower pressure. The size of cylindrical pressure vessels used at 2 MPa might not exceed 10,000 Nm3 today (IPTS), corresponding to a physical volume of 560 m3. Spherical pressure vessels are feasible at 0.6 to 2 MPa up to around 100,000 Nm3 (IPTS). Utilisation by time of this kind of stationary storage vessel is high: 360 d/a are reported by Taylor (1986). Technical lifetime is set to 22 years, equivalent to the depreciation time used by Amos (1996), but might be higher for spherical vessels operated at lower pressure.
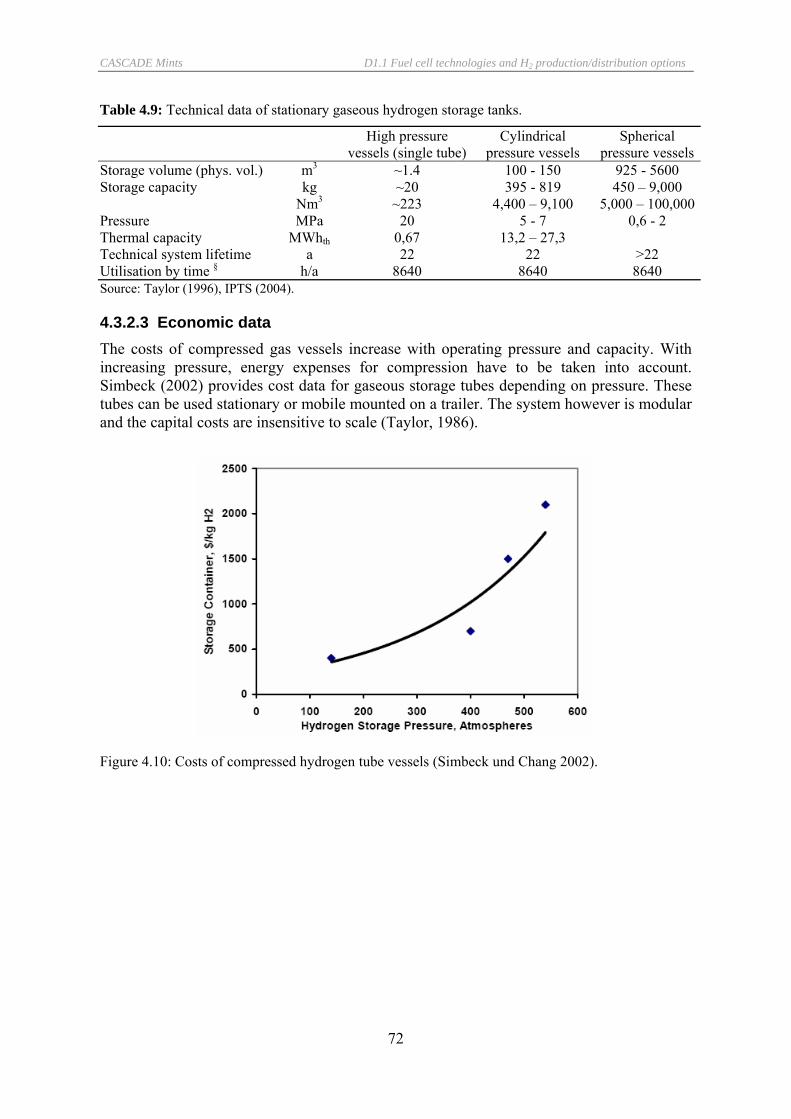
CASCADE Mints D1.1 Fuel cell technologies and H2 production/distribution options
72
Table 4.9: Technical data of stationary gaseous hydrogen storage tanks.
High pressure vessels (single tube)
Cylindrical pressure vessels
Spherical pressure vessels
Storage volume (phys. vol.) m3 ~1.4 100 - 150 925 - 5600 Storage capacity kg ~20 395 - 819 450 – 9,000 Nm3 ~223 4,400 – 9,100 5,000 – 100,000Pressure MPa 20 5 - 7 0,6 - 2 Thermal capacity MWhth 0,67 13,2 – 27,3 Technical system lifetime a 22 22 >22 Utilisation by time § h/a 8640 8640 8640 Source: Taylor (1996), IPTS (2004).
4.3.2.3 Economic data The costs of compressed gas vessels increase with operating pressure and capacity. With increasing pressure, energy expenses for compression have to be taken into account. Simbeck (2002) provides cost data for gaseous storage tubes depending on pressure. These tubes can be used stationary or mobile mounted on a trailer. The system however is modular and the capital costs are insensitive to scale (Taylor, 1986).
Figure 4.10: Costs of compressed hydrogen tube vessels (Simbeck und Chang 2002).

CASCADE Mints D1.1 Fuel cell technologies and H2 production/distribution options
73
10
100
1.000
10.000
100.000
1 10 100 1.000 10.000 100.000
Storage capacity in kg
Inve
stm
ent c
ost i
n € 2
000/k
g
"Amos (1998) , 20MPa""Taylor (1986)"Linde, 4 MPa""Amos, 4 MPa""Amos, 2 MPa"
4 MPa
20 MPa 4 MPa2 MPa
Figure 4.11: Investment costs for hydrogen gaseous storage vessels from different sources.
There are no floor cost estimates for gaseous hydrogen storage available to the authors. As these systems are considered mature technology which are applied for all kind of industrial gases world wide, there might not be a big potential for cost reduction. Therefore for modelling purposes minimum floor costs of 90% of current cost estimates are considered.
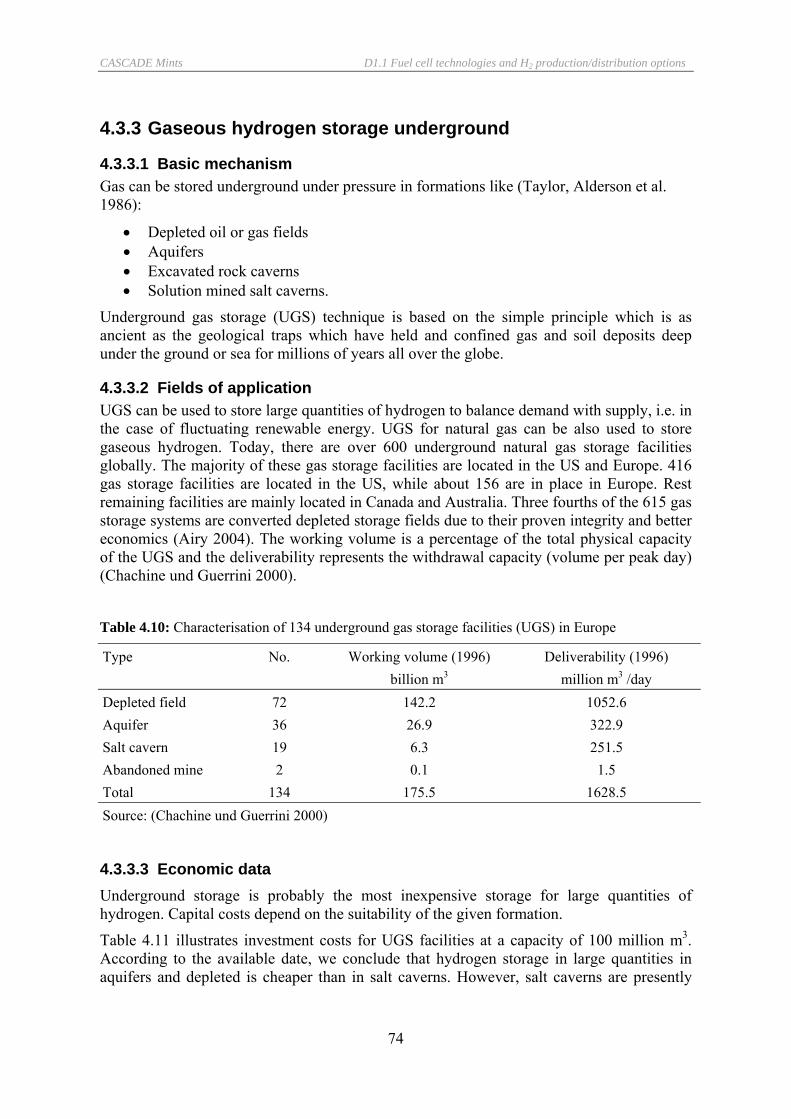
CASCADE Mints D1.1 Fuel cell technologies and H2 production/distribution options
74
4.3.3 Gaseous hydrogen storage underground
4.3.3.1 Basic mechanism Gas can be stored underground under pressure in formations like (Taylor, Alderson et al. 1986):
• Depleted oil or gas fields • Aquifers • Excavated rock caverns • Solution mined salt caverns.
Underground gas storage (UGS) technique is based on the simple principle which is as ancient as the geological traps which have held and confined gas and soil deposits deep under the ground or sea for millions of years all over the globe.
4.3.3.2 Fields of application UGS can be used to store large quantities of hydrogen to balance demand with supply, i.e. in the case of fluctuating renewable energy. UGS for natural gas can be also used to store gaseous hydrogen. Today, there are over 600 underground natural gas storage facilities globally. The majority of these gas storage facilities are located in the US and Europe. 416 gas storage facilities are located in the US, while about 156 are in place in Europe. Rest remaining facilities are mainly located in Canada and Australia. Three fourths of the 615 gas storage systems are converted depleted storage fields due to their proven integrity and better economics (Airy 2004). The working volume is a percentage of the total physical capacity of the UGS and the deliverability represents the withdrawal capacity (volume per peak day) (Chachine und Guerrini 2000).
Table 4.10: Characterisation of 134 underground gas storage facilities (UGS) in Europe
Type No. Working volume (1996) Deliverability (1996) billion m3 million m3 /day
Depleted field 72 142.2 1052.6 Aquifer 36 26.9 322.9 Salt cavern 19 6.3 251.5 Abandoned mine 2 0.1 1.5 Total 134 175.5 1628.5 Source: (Chachine und Guerrini 2000)
4.3.3.3 Economic data Underground storage is probably the most inexpensive storage for large quantities of hydrogen. Capital costs depend on the suitability of the given formation.
Table 4.11 illustrates investment costs for UGS facilities at a capacity of 100 million m3. According to the available date, we conclude that hydrogen storage in large quantities in aquifers and depleted is cheaper than in salt caverns. However, salt caverns are presently
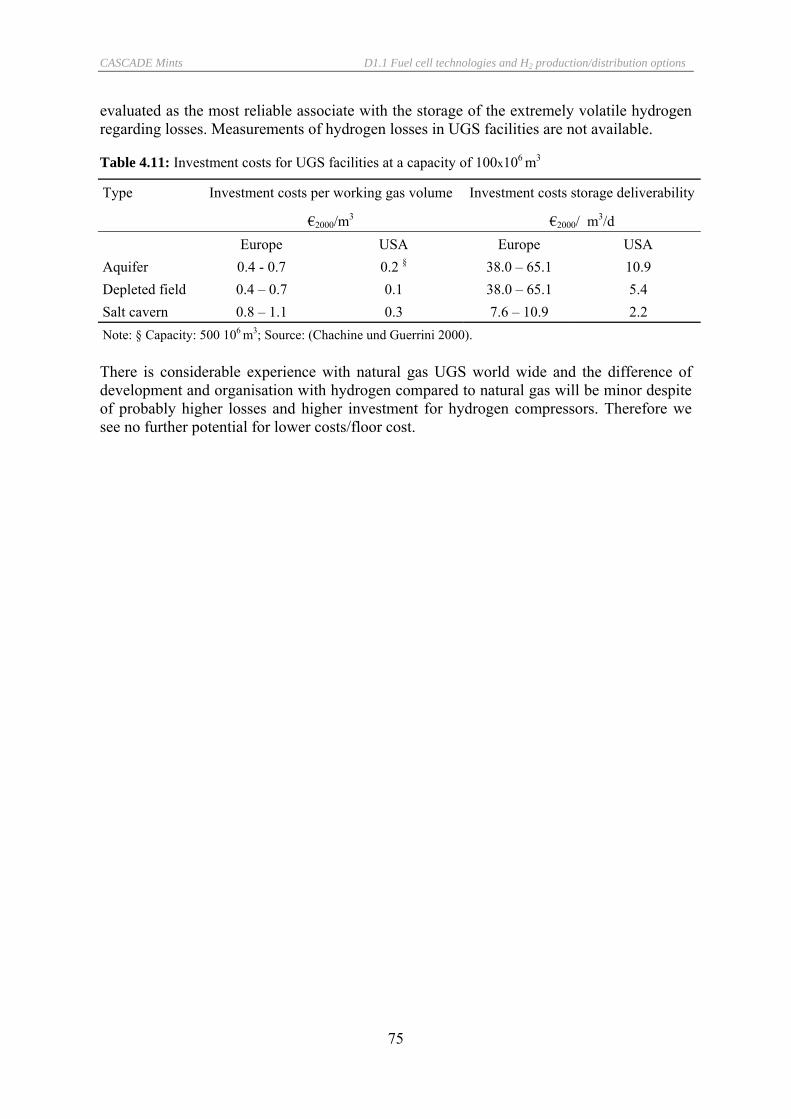
CASCADE Mints D1.1 Fuel cell technologies and H2 production/distribution options
75
evaluated as the most reliable associate with the storage of the extremely volatile hydrogen regarding losses. Measurements of hydrogen losses in UGS facilities are not available.
Table 4.11: Investment costs for UGS facilities at a capacity of 100x106 m3
Type Investment costs per working gas volume Investment costs storage deliverability
€2000/m3 €2000/ m3/d Europe USA Europe USA Aquifer 0.4 - 0.7 0.2 § 38.0 – 65.1 10.9 Depleted field 0.4 – 0.7 0.1 38.0 – 65.1 5.4 Salt cavern 0.8 – 1.1 0.3 7.6 – 10.9 2.2 Note: § Capacity: 500 106 m3; Source: (Chachine und Guerrini 2000). There is considerable experience with natural gas UGS world wide and the difference of development and organisation with hydrogen compared to natural gas will be minor despite of probably higher losses and higher investment for hydrogen compressors. Therefore we see no further potential for lower costs/floor cost.
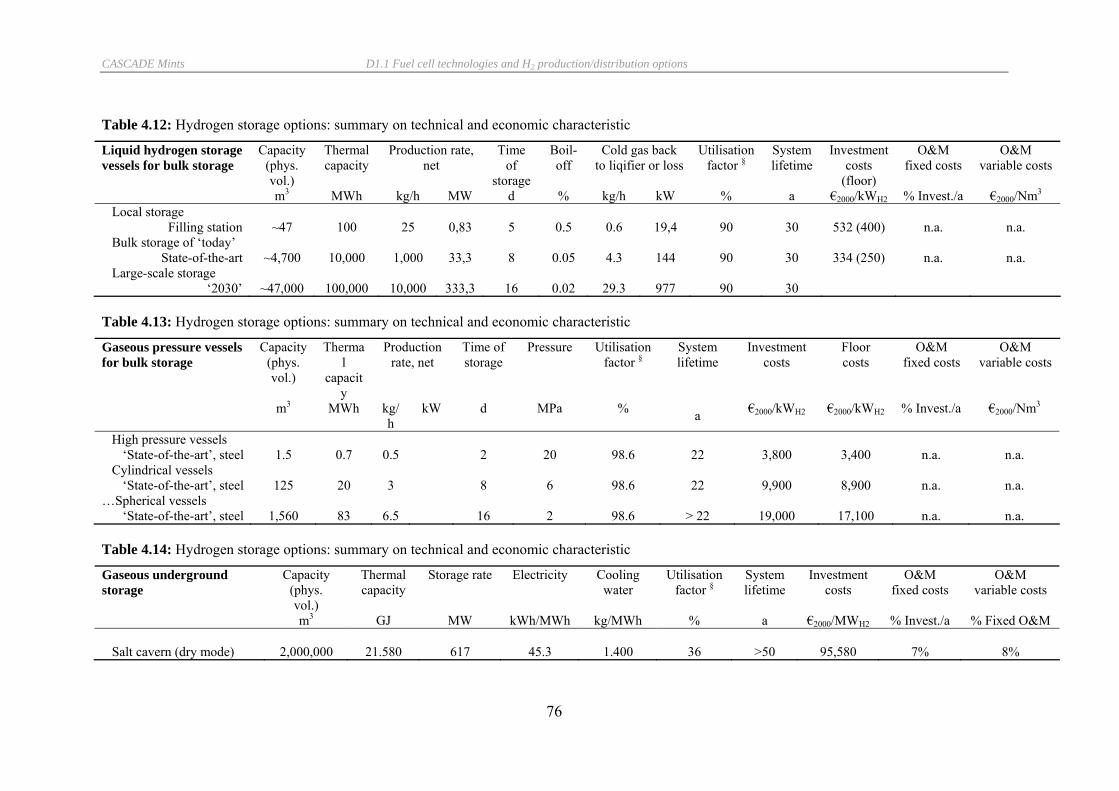
CASCADE Mints D1.1 Fuel cell technologies and H2 production/distribution options
76
Table 4.12: Hydrogen storage options: summary on technical and economic characteristic
Liquid hydrogen storage vessels for bulk storage
Capacity (phys. vol.)
Thermal capacity
Production rate, net
Time of
storage
Boil-off
Cold gas back to liqifier or loss
Utilisation factor §
System lifetime
Investment costs
(floor)
O&M fixed costs
O&M variable costs
m3 MWh kg/h MW d % kg/h kW % a €2000/kWH2 % Invest./a €2000/Nm3 Local storage
Filling station ~47 100 25 0,83 5 0.5 0.6 19,4 90 30 532 (400) n.a. n.a. Bulk storage of ‘today’
State-of-the-art ~4,700 10,000 1,000 33,3 8 0.05 4.3 144 90 30 334 (250) n.a. n.a. Large-scale storage
‘2030’ ~47,000 100,000 10,000 333,3 16 0.02 29.3 977 90 30
Table 4.13: Hydrogen storage options: summary on technical and economic characteristic
Gaseous pressure vessels for bulk storage
Capacity (phys. vol.)
Thermal
capacity
Production rate, net
Time of storage
Pressure Utilisation factor §
System lifetime
Investment costs
Floor costs
O&M fixed costs
O&M variable costs
m3 MWh kg/h
kW d MPa % a €2000/kWH2 €2000/kWH2 % Invest./a €2000/Nm3
High pressure vessels ‘State-of-the-art’, steel 1.5 0.7 0.5 2 20 98.6 22 3,800 3,400 n.a. n.a.
Cylindrical vessels ‘State-of-the-art’, steel 125 20 3 8 6 98.6 22 9,900 8,900 n.a. n.a.
…Spherical vessels ‘State-of-the-art’, steel 1,560 83 6.5 16 2 98.6 > 22 19,000 17,100 n.a. n.a.
Table 4.14: Hydrogen storage options: summary on technical and economic characteristic
Gaseous underground storage
Capacity (phys. vol.)
Thermal capacity
Storage rate Electricity Cooling water
Utilisation factor §
System lifetime
Investment costs
O&M fixed costs
O&M variable costs
m3 GJ MW kWh/MWh kg/MWh % a €2000/MWH2 % Invest./a % Fixed O&M Salt cavern (dry mode) 2,000,000 21.580 617 45.3 1.400 36 >50 95,580 7% 8%
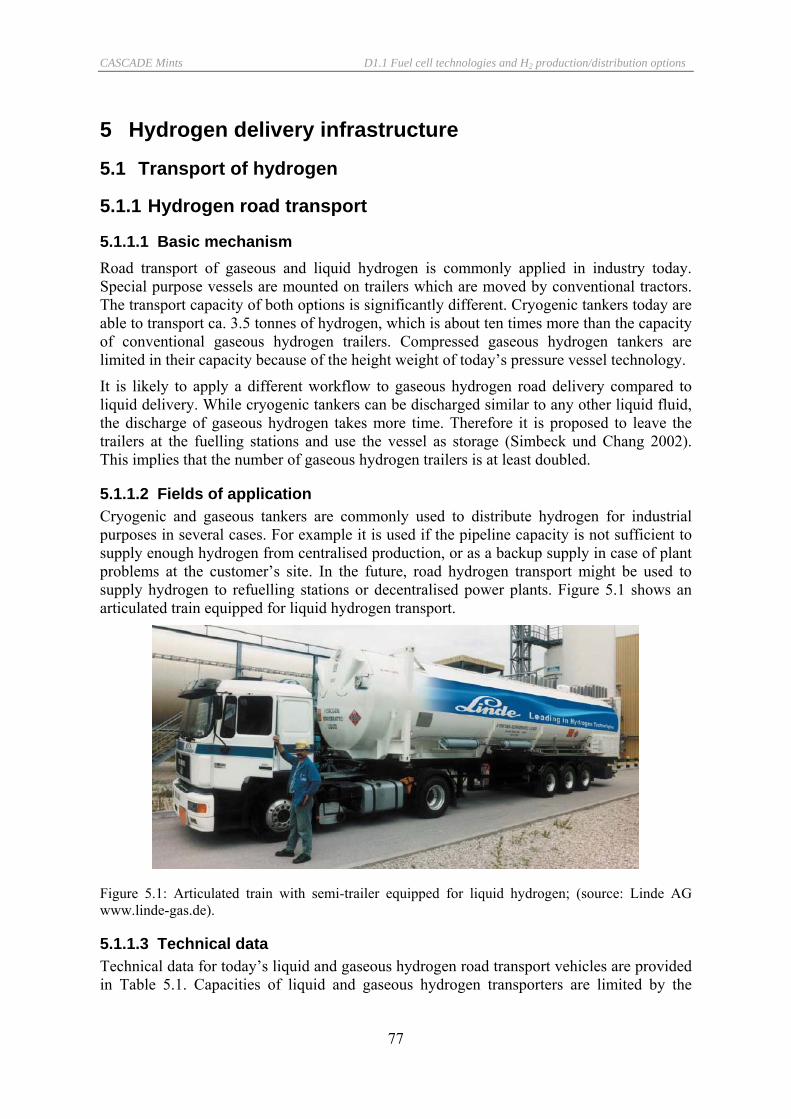
CASCADE Mints D1.1 Fuel cell technologies and H2 production/distribution options
77
5 Hydrogen delivery infrastructure
5.1 Transport of hydrogen
5.1.1 Hydrogen road transport
5.1.1.1 Basic mechanism Road transport of gaseous and liquid hydrogen is commonly applied in industry today. Special purpose vessels are mounted on trailers which are moved by conventional tractors. The transport capacity of both options is significantly different. Cryogenic tankers today are able to transport ca. 3.5 tonnes of hydrogen, which is about ten times more than the capacity of conventional gaseous hydrogen trailers. Compressed gaseous hydrogen tankers are limited in their capacity because of the height weight of today’s pressure vessel technology.
It is likely to apply a different workflow to gaseous hydrogen road delivery compared to liquid delivery. While cryogenic tankers can be discharged similar to any other liquid fluid, the discharge of gaseous hydrogen takes more time. Therefore it is proposed to leave the trailers at the fuelling stations and use the vessel as storage (Simbeck und Chang 2002). This implies that the number of gaseous hydrogen trailers is at least doubled.
5.1.1.2 Fields of application Cryogenic and gaseous tankers are commonly used to distribute hydrogen for industrial purposes in several cases. For example it is used if the pipeline capacity is not sufficient to supply enough hydrogen from centralised production, or as a backup supply in case of plant problems at the customer’s site. In the future, road hydrogen transport might be used to supply hydrogen to refuelling stations or decentralised power plants. Figure 5.1 shows an articulated train equipped for liquid hydrogen transport.
Figure 5.1: Articulated train with semi-trailer equipped for liquid hydrogen; (source: Linde AG www.linde-gas.de).
5.1.1.3 Technical data Technical data for today’s liquid and gaseous hydrogen road transport vehicles are provided in Table 5.1. Capacities of liquid and gaseous hydrogen transporters are limited by the
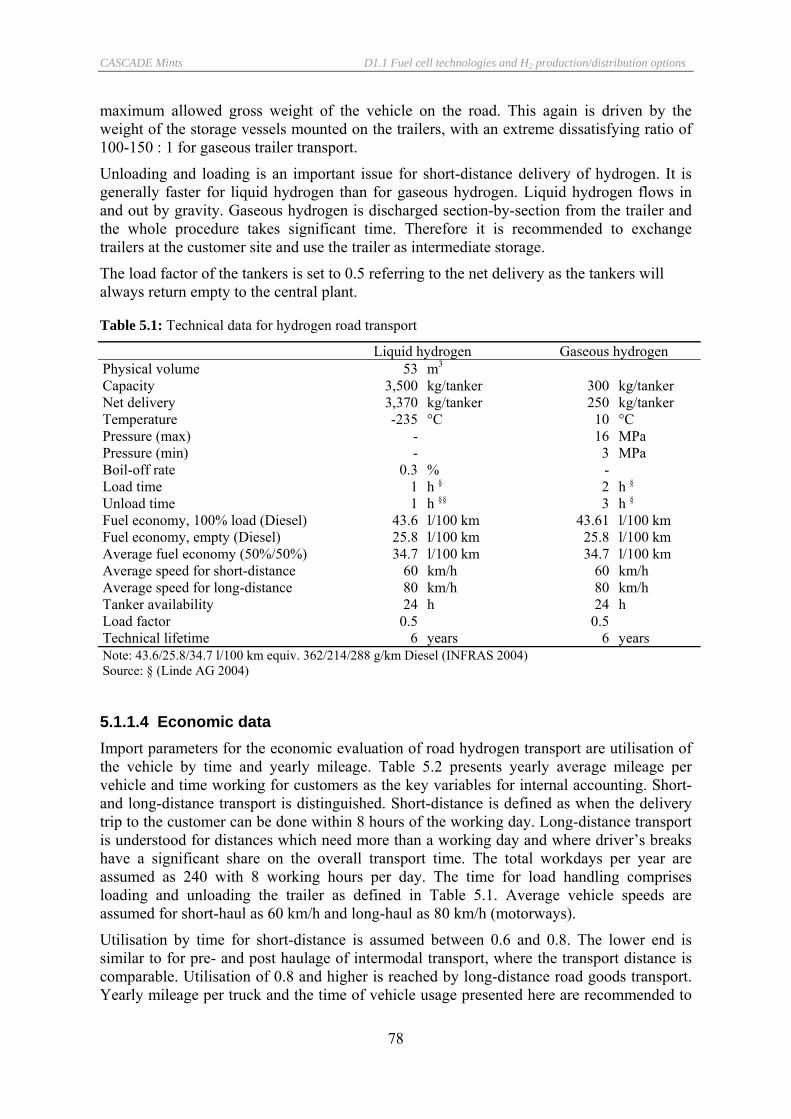
CASCADE Mints D1.1 Fuel cell technologies and H2 production/distribution options
78
maximum allowed gross weight of the vehicle on the road. This again is driven by the weight of the storage vessels mounted on the trailers, with an extreme dissatisfying ratio of 100-150 : 1 for gaseous trailer transport.
Unloading and loading is an important issue for short-distance delivery of hydrogen. It is generally faster for liquid hydrogen than for gaseous hydrogen. Liquid hydrogen flows in and out by gravity. Gaseous hydrogen is discharged section-by-section from the trailer and the whole procedure takes significant time. Therefore it is recommended to exchange trailers at the customer site and use the trailer as intermediate storage.
The load factor of the tankers is set to 0.5 referring to the net delivery as the tankers will always return empty to the central plant.
Table 5.1: Technical data for hydrogen road transport
Liquid hydrogen Gaseous hydrogen Physical volume 53 m3 Capacity 3,500 kg/tanker 300 kg/tanker Net delivery 3,370 kg/tanker 250 kg/tanker Temperature -235 °C 10 °C Pressure (max) - 16 MPa Pressure (min) - 3 MPa Boil-off rate 0.3 % - Load time 1 h § 2 h § Unload time 1 h §§ 3 h § Fuel economy, 100% load (Diesel) 43.6 l/100 km 43.61 l/100 km Fuel economy, empty (Diesel) 25.8 l/100 km 25.8 l/100 km Average fuel economy (50%/50%) 34.7 l/100 km 34.7 l/100 km Average speed for short-distance 60 km/h 60 km/h Average speed for long-distance 80 km/h 80 km/h Tanker availability 24 h 24 h Load factor 0.5 0.5 Technical lifetime 6 years 6 years Note: 43.6/25.8/34.7 l/100 km equiv. 362/214/288 g/km Diesel (INFRAS 2004) Source: § (Linde AG 2004)
5.1.1.4 Economic data Import parameters for the economic evaluation of road hydrogen transport are utilisation of the vehicle by time and yearly mileage. Table 5.2 presents yearly average mileage per vehicle and time working for customers as the key variables for internal accounting. Short- and long-distance transport is distinguished. Short-distance is defined as when the delivery trip to the customer can be done within 8 hours of the working day. Long-distance transport is understood for distances which need more than a working day and where driver’s breaks have a significant share on the overall transport time. The total workdays per year are assumed as 240 with 8 working hours per day. The time for load handling comprises loading and unloading the trailer as defined in Table 5.1. Average vehicle speeds are assumed for short-haul as 60 km/h and long-haul as 80 km/h (motorways).
Utilisation by time for short-distance is assumed between 0.6 and 0.8. The lower end is similar to for pre- and post haulage of intermodal transport, where the transport distance is comparable. Utilisation of 0.8 and higher is reached by long-distance road goods transport. Yearly mileage per truck and the time of vehicle usage presented here are recommended to
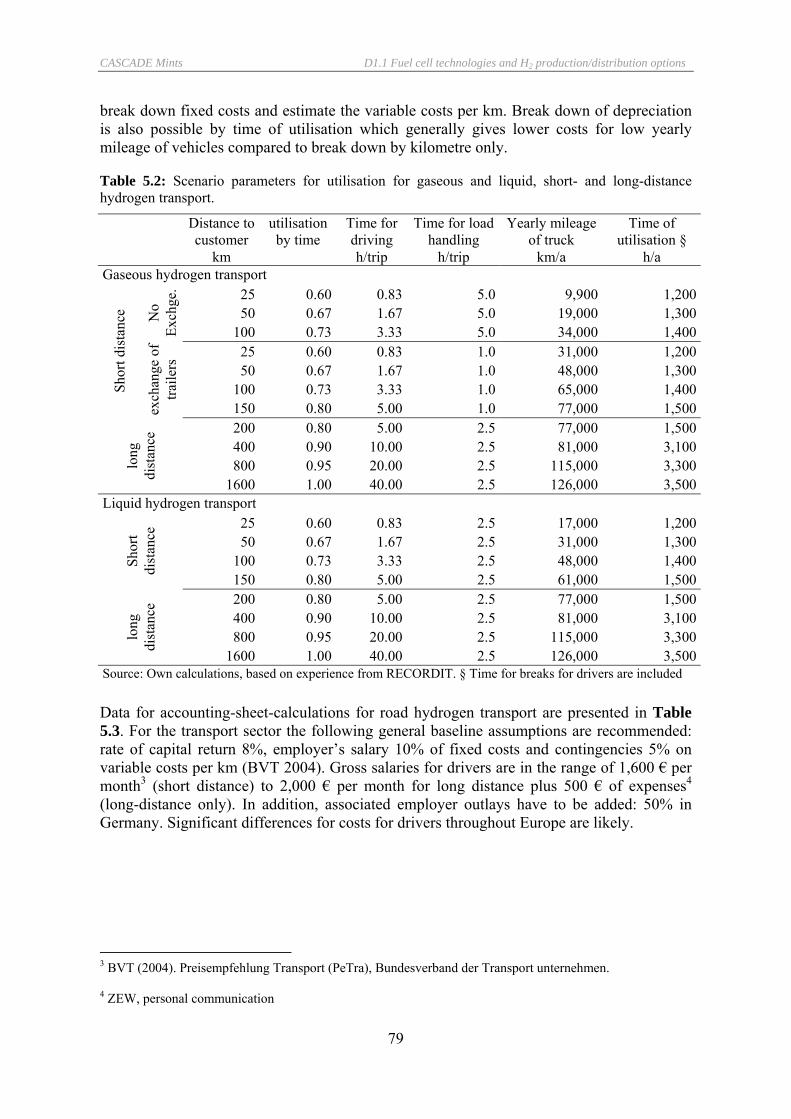
CASCADE Mints D1.1 Fuel cell technologies and H2 production/distribution options
79
break down fixed costs and estimate the variable costs per km. Break down of depreciation is also possible by time of utilisation which generally gives lower costs for low yearly mileage of vehicles compared to break down by kilometre only.
Table 5.2: Scenario parameters for utilisation for gaseous and liquid, short- and long-distance hydrogen transport.
Distance to customer
utilisation by time
Time for driving
Time for load handling
Yearly mileage of truck
Time of utilisation §
km h/trip h/trip km/a h/a Gaseous hydrogen transport
25 0.60 0.83 5.0 9,900 1,20050 0.67 1.67 5.0 19,000 1,300N
o Ex
chge
.
100 0.73 3.33 5.0 34,000 1,40025 0.60 0.83 1.0 31,000 1,20050 0.67 1.67 1.0 48,000 1,300
100 0.73 3.33 1.0 65,000 1,400Shor
t dis
tanc
e
exch
ange
of
traile
rs
150 0.80 5.00 1.0 77,000 1,500200 0.80 5.00 2.5 77,000 1,500400 0.90 10.00 2.5 81,000 3,100800 0.95 20.00 2.5 115,000 3,300lo
ng
dist
ance
1600 1.00 40.00 2.5 126,000 3,500Liquid hydrogen transport
25 0.60 0.83 2.5 17,000 1,20050 0.67 1.67 2.5 31,000 1,300
100 0.73 3.33 2.5 48,000 1,400Shor
t di
stan
ce
150 0.80 5.00 2.5 61,000 1,500200 0.80 5.00 2.5 77,000 1,500400 0.90 10.00 2.5 81,000 3,100800 0.95 20.00 2.5 115,000 3,300lo
ng
dist
ance
1600 1.00 40.00 2.5 126,000 3,500Source: Own calculations, based on experience from RECORDIT. § Time for breaks for drivers are included Data for accounting-sheet-calculations for road hydrogen transport are presented in Table 5.3. For the transport sector the following general baseline assumptions are recommended: rate of capital return 8%, employer’s salary 10% of fixed costs and contingencies 5% on variable costs per km (BVT 2004). Gross salaries for drivers are in the range of 1,600 € per month3 (short distance) to 2,000 € per month for long distance plus 500 € of expenses4 (long-distance only). In addition, associated employer outlays have to be added: 50% in Germany. Significant differences for costs for drivers throughout Europe are likely.
3 BVT (2004). Preisempfehlung Transport (PeTra), Bundesverband der Transport unternehmen. 4 ZEW, personal communication
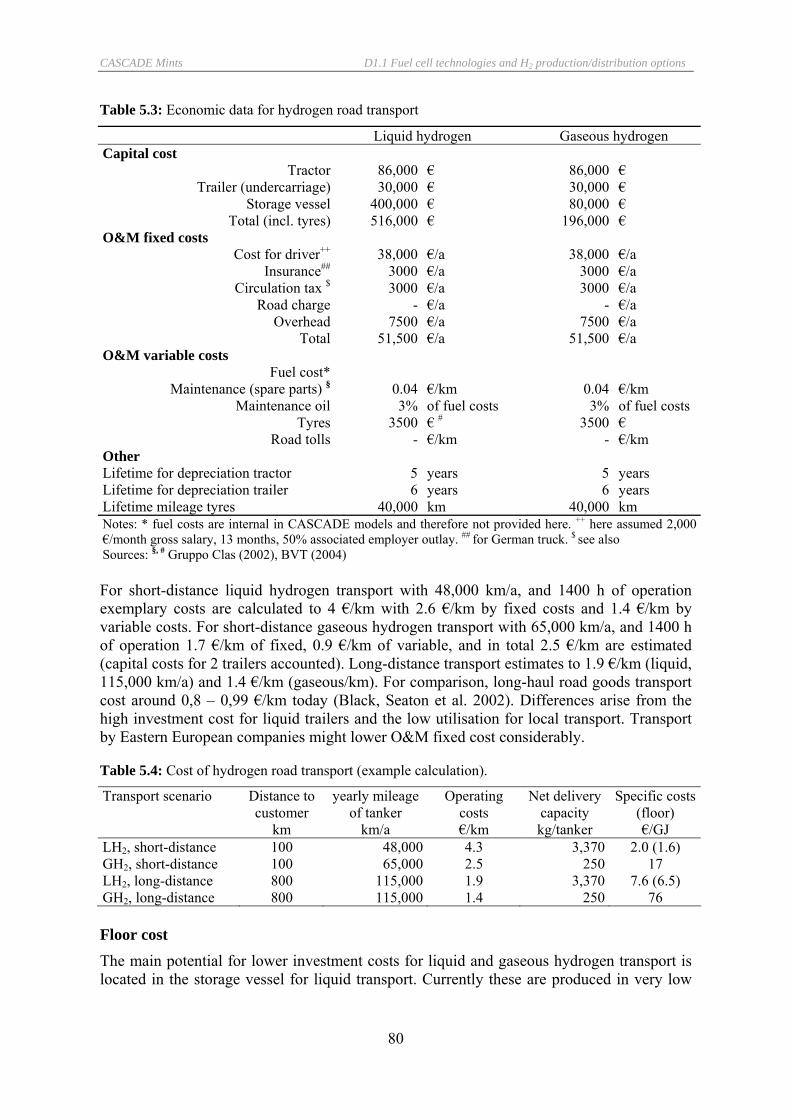
CASCADE Mints D1.1 Fuel cell technologies and H2 production/distribution options
80
Table 5.3: Economic data for hydrogen road transport
Liquid hydrogen Gaseous hydrogen Capital cost
Tractor 86,000 € 86,000 € Trailer (undercarriage) 30,000 € 30,000 €
Storage vessel 400,000 € 80,000 € Total (incl. tyres) 516,000 € 196,000 €
O&M fixed costs Cost for driver++ 38,000 €/a 38,000 €/a
Insurance## 3000 €/a 3000 €/a Circulation tax $ 3000 €/a 3000 €/a
Road charge - €/a - €/a Overhead 7500 €/a 7500 €/a
Total 51,500 €/a 51,500 €/a O&M variable costs
Fuel cost* Maintenance (spare parts) § 0.04 €/km 0.04 €/km
Maintenance oil 3% of fuel costs 3% of fuel costs Tyres 3500 € # 3500 €
Road tolls - €/km - €/km Other Lifetime for depreciation tractor 5 years 5 years Lifetime for depreciation trailer 6 years 6 years Lifetime mileage tyres 40,000 km 40,000 km Notes: * fuel costs are internal in CASCADE models and therefore not provided here. ++ here assumed 2,000 €/month gross salary, 13 months, 50% associated employer outlay. ## for German truck. $ see also Sources: §, # Gruppo Clas (2002), BVT (2004)
For short-distance liquid hydrogen transport with 48,000 km/a, and 1400 h of operation exemplary costs are calculated to 4 €/km with 2.6 €/km by fixed costs and 1.4 €/km by variable costs. For short-distance gaseous hydrogen transport with 65,000 km/a, and 1400 h of operation 1.7 €/km of fixed, 0.9 €/km of variable, and in total 2.5 €/km are estimated (capital costs for 2 trailers accounted). Long-distance transport estimates to 1.9 €/km (liquid, 115,000 km/a) and 1.4 €/km (gaseous/km). For comparison, long-haul road goods transport cost around 0,8 – 0,99 €/km today (Black, Seaton et al. 2002). Differences arise from the high investment cost for liquid trailers and the low utilisation for local transport. Transport by Eastern European companies might lower O&M fixed cost considerably.
Table 5.4: Cost of hydrogen road transport (example calculation).
Transport scenario Distance to customer
yearly mileage of tanker
Operating costs
Net delivery capacity
Specific costs(floor)
km km/a €/km kg/tanker €/GJ LH2, short-distance 100 48,000 4.3 3,370 2.0 (1.6) GH2, short-distance 100 65,000 2.5 250 17 LH2, long-distance 800 115,000 1.9 3,370 7.6 (6.5) GH2, long-distance 800 115,000 1.4 250 76
Floor cost The main potential for lower investment costs for liquid and gaseous hydrogen transport is located in the storage vessel for liquid transport. Currently these are produced in very low
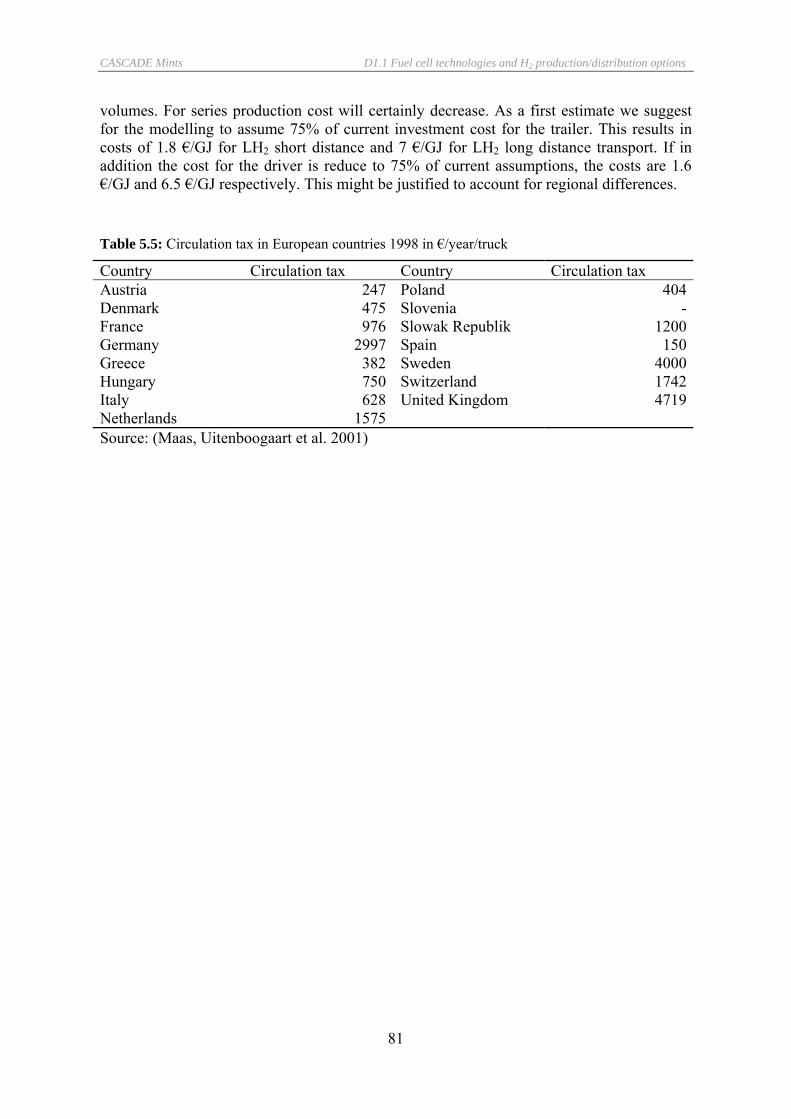
CASCADE Mints D1.1 Fuel cell technologies and H2 production/distribution options
81
volumes. For series production cost will certainly decrease. As a first estimate we suggest for the modelling to assume 75% of current investment cost for the trailer. This results in costs of 1.8 €/GJ for LH2 short distance and 7 €/GJ for LH2 long distance transport. If in addition the cost for the driver is reduce to 75% of current assumptions, the costs are 1.6 €/GJ and 6.5 €/GJ respectively. This might be justified to account for regional differences.
Table 5.5: Circulation tax in European countries 1998 in €/year/truck
Country Circulation tax Country Circulation tax Austria 247 Poland 404Denmark 475 Slovenia -France 976 Slowak Republik 1200Germany 2997 Spain 150Greece 382 Sweden 4000Hungary 750 Switzerland 1742Italy 628 United Kingdom 4719Netherlands 1575 Source: (Maas, Uitenboogaart et al. 2001)
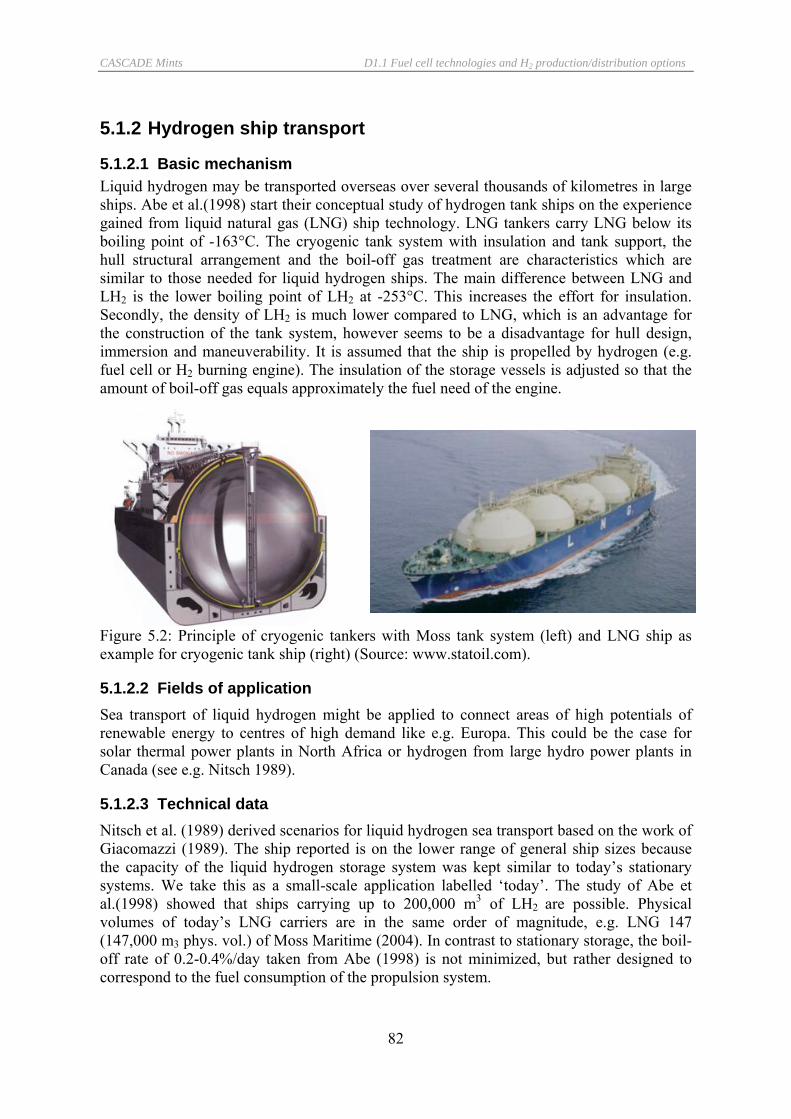
CASCADE Mints D1.1 Fuel cell technologies and H2 production/distribution options
82
5.1.2 Hydrogen ship transport
5.1.2.1 Basic mechanism Liquid hydrogen may be transported overseas over several thousands of kilometres in large ships. Abe et al.(1998) start their conceptual study of hydrogen tank ships on the experience gained from liquid natural gas (LNG) ship technology. LNG tankers carry LNG below its boiling point of -163°C. The cryogenic tank system with insulation and tank support, the hull structural arrangement and the boil-off gas treatment are characteristics which are similar to those needed for liquid hydrogen ships. The main difference between LNG and LH2 is the lower boiling point of LH2 at -253°C. This increases the effort for insulation. Secondly, the density of LH2 is much lower compared to LNG, which is an advantage for the construction of the tank system, however seems to be a disadvantage for hull design, immersion and maneuverability. It is assumed that the ship is propelled by hydrogen (e.g. fuel cell or H2 burning engine). The insulation of the storage vessels is adjusted so that the amount of boil-off gas equals approximately the fuel need of the engine.
Figure 5.2: Principle of cryogenic tankers with Moss tank system (left) and LNG ship as example for cryogenic tank ship (right) (Source: www.statoil.com).
5.1.2.2 Fields of application Sea transport of liquid hydrogen might be applied to connect areas of high potentials of renewable energy to centres of high demand like e.g. Europa. This could be the case for solar thermal power plants in North Africa or hydrogen from large hydro power plants in Canada (see e.g. Nitsch 1989).
5.1.2.3 Technical data Nitsch et al. (1989) derived scenarios for liquid hydrogen sea transport based on the work of Giacomazzi (1989). The ship reported is on the lower range of general ship sizes because the capacity of the liquid hydrogen storage system was kept similar to today’s stationary systems. We take this as a small-scale application labelled ‘today’. The study of Abe et al.(1998) showed that ships carrying up to 200,000 m3 of LH2 are possible. Physical volumes of today’s LNG carriers are in the same order of magnitude, e.g. LNG 147 (147,000 m3 phys. vol.) of Moss Maritime (2004). In contrast to stationary storage, the boil-off rate of 0.2-0.4%/day taken from Abe (1998) is not minimized, but rather designed to correspond to the fuel consumption of the propulsion system.

CASCADE Mints D1.1 Fuel cell technologies and H2 production/distribution options
83
Table 5.6: Technical data for hydrogen ship transport.
Small-scale (‘today’) Large-scale (‘future’) Physical volume 11,400 m3 147,000 m3 Capacity 810 t/tanker 10,500 t/tanker Net delivery 750 9,718 t/tanker Temperature -235 °C -235 °C Spherical tanks 4 4 Boil-off rate 0.03 %/day 0.2-0.4 %/day Engine power n.a. 80,000 HP Ship speed 20 kt 21 kt Propulsion efficiency 32 % Load factor by time 0.5 Technical lifetime 30 years 30 years
5.1.2.4 Economic data Amos (1998) analysed container shipping in his study of hydrogen transportation, which has an advantage in inter-modal distribution chain to the customer. It is however less efficient for long-distance liquid hydrogen transport because the more complicated handling of the boil-off losses. Nitsch et al. (1989) give cost data for ‘small-scale’ liquid hydrogen tanker scenarios with investment cost of approx. 162 million €2000. For large-scale sea transport we consider information on conventional state-of-the-art LNG technology. Investment cost for LNG tankers are reported in the order of 1.5 billion NOK (Statoil 2004) which corresponds to 180 millon Euro. Because of lack of further detailed information on the differential costs between LNG and LH2 equipment, we suggest to use a scaling of 25% for the additional equipment needed to handle cryogenic temperatures of -253°C for liquid hydrogen (Christiansen, 2004).
For the transport of liquid hydrogen derived from solar thermal power plants in North Africa, the following scenario assumptions are used. Taken as a basis a distance of 3,330 km (e.g. Algier – Hamburg), and ship speeds of 28 km/h and 39 km/h, ‘small-scale’ and ‘large-scale’ respectively, 5 and 3,5 days per single trip are needed, resulting in 26 and 33 transport cycles per year. Net delivery of hydrogen would amount to 742 GWhth and 10,400 GWhth per year.
Table 5.7: Cost estimates for liquefied hydrogen ship transport.
Small-scale (‘today’) Large-scale (‘future’) Investment cost €2000 162,000,000 225,000,000 Specific investment cost €/MWh O&M fixed cost % Invest./a 5 5 O&M variable cost % Invest./a 4 4 Floor cost As no detail bottom-up calculation of the investment cost for hydrogen ships is available, no estimate floor costs can be made. However it is as a bottom line the investment cost for LNG tankers can be used, i.e. multiplication by a factor 0.8.
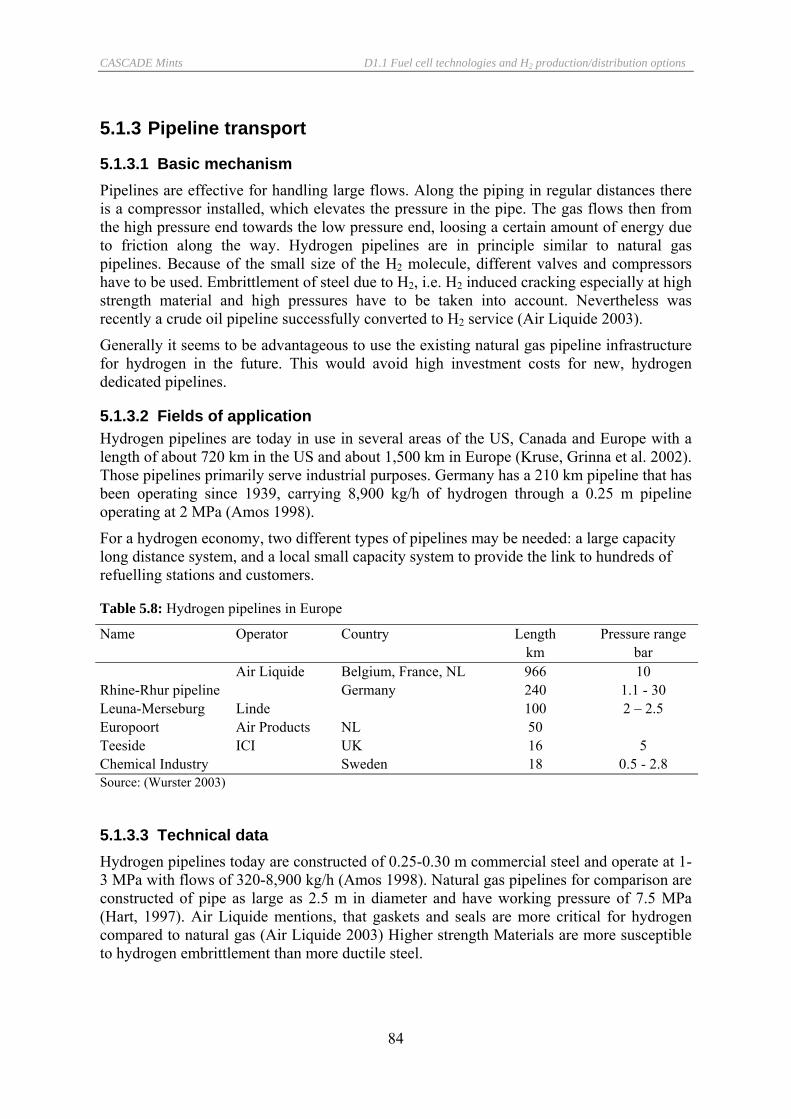
CASCADE Mints D1.1 Fuel cell technologies and H2 production/distribution options
84
5.1.3 Pipeline transport
5.1.3.1 Basic mechanism Pipelines are effective for handling large flows. Along the piping in regular distances there is a compressor installed, which elevates the pressure in the pipe. The gas flows then from the high pressure end towards the low pressure end, loosing a certain amount of energy due to friction along the way. Hydrogen pipelines are in principle similar to natural gas pipelines. Because of the small size of the H2 molecule, different valves and compressors have to be used. Embrittlement of steel due to H2, i.e. H2 induced cracking especially at high strength material and high pressures have to be taken into account. Nevertheless was recently a crude oil pipeline successfully converted to H2 service (Air Liquide 2003).
Generally it seems to be advantageous to use the existing natural gas pipeline infrastructure for hydrogen in the future. This would avoid high investment costs for new, hydrogen dedicated pipelines.
5.1.3.2 Fields of application Hydrogen pipelines are today in use in several areas of the US, Canada and Europe with a length of about 720 km in the US and about 1,500 km in Europe (Kruse, Grinna et al. 2002). Those pipelines primarily serve industrial purposes. Germany has a 210 km pipeline that has been operating since 1939, carrying 8,900 kg/h of hydrogen through a 0.25 m pipeline operating at 2 MPa (Amos 1998).
For a hydrogen economy, two different types of pipelines may be needed: a large capacity long distance system, and a local small capacity system to provide the link to hundreds of refuelling stations and customers.
Table 5.8: Hydrogen pipelines in Europe
Name Operator Country Length Pressure range km bar Air Liquide Belgium, France, NL 966 10 Rhine-Rhur pipeline Germany 240 1.1 - 30 Leuna-Merseburg Linde 100 2 – 2.5 Europoort Air Products NL 50 Teeside ICI UK 16 5 Chemical Industry Sweden 18 0.5 - 2.8 Source: (Wurster 2003)
5.1.3.3 Technical data Hydrogen pipelines today are constructed of 0.25-0.30 m commercial steel and operate at 1-3 MPa with flows of 320-8,900 kg/h (Amos 1998). Natural gas pipelines for comparison are constructed of pipe as large as 2.5 m in diameter and have working pressure of 7.5 MPa (Hart, 1997). Air Liquide mentions, that gaskets and seals are more critical for hydrogen compared to natural gas (Air Liquide 2003) Higher strength Materials are more susceptible to hydrogen embrittlement than more ductile steel.

CASCADE Mints D1.1 Fuel cell technologies and H2 production/distribution options
85
Natural gas pipeline can be used for hydrogen transport, depending on the pipe material, however because the hydraulic characteristics of hydrogen and natural gas are not the same, the transport capacity is different. Transporting hydrogen via an existing natural gas pipeline leads to a capacity de-rating of approximately 20-25% on a delivered energy basis. The same amount of energy requires increased compression to deliver the larger volume of gas. Therefore natural gas compressors will need to be replaced (Air Liquide 2003).
Leakage of hydrogen pipelines Zittel and Altmann (1996) report about 0.1 % loss of gaseous hydrogen from the existing industrial hydrogen distribution grid in Germany. This is the only data on losses for dedicated hydrogen pipelines known to us.
For plausibility it is interesting to look at leakage of natural gas pipelines. Lelieveld et. al (2005) measured methan leakage from Russian natural gas long-distance pipelines and found them as high as 0.7% (with a range of 0.4-1.6%) including compressor stations, valve knots and machine halls. They also reported in addition 0.5-0.8% losses for the low pressure NG distribution networks from U.S. literature. Schultz et. al (2003) estimated a factor 3 higher leak rates if existing NG grids were used for hydrogen without further adaptations (such as new fittings or inline coating).
However for different reasons, e.g. embrittlement and safety, dedicated hydrogen pipelines are built of different materials and fittings compared to natural gas pipelines. Therefore it is likely that the leakage of natural gas pipelines can at least be met in spite of the more difficult situation with hydrogen, suggesting 1.7% as overall average (with a range of 0.9%-2.4%) for non-industrial hydrogen pipeline systems.
5.1.3.4 Economic data Pipelines are capital intensive. Amos (1998) estimates hydrogen pipeline costs based on natural gas pipeline costs, stating that a large fraction of the pipeline is assumed for installation, probably also the right-of-way (Simbeck und Chang 2002). Recent estimates for unit costs of hydrogen pipelines are given by Mintz (2002), differenced by pipeline diameter and installation technology. Traditional cut and cover technology is about a factor of 1.2 more expensive than innovative trenchless technology (see Table 5.9).
Cost data on 54 recent natural gas pipeline projects in the US for expanding or building natural gas pipelines in different regions are available from Tobin (2003). The values range from as low as 0.29 M€/km to 2.11 M€/km, resulting in a cross-average of 0,78 M€2000/km for project costs, i.e. incl. auxiliary equipment.
From the information given, we recommend for general calculations to use the average costs of both technologies given by Mintz (Table 5.9).
Table 5.9: Investment cost for hydrogen pipelines by pipe diameter and technology
Pipe diameter Cut – Cover Trenchless Average m €2000/km €2000/km €2000/km
0.08 260,000 200,000 230,000 0.23 590,000 460,000 525,000 0.31 650,000 590,000 620,000 0.36 910,000 750,000 830,000 2.0 2,000,000 § - 2,000,000
Source: § Nitsch (1989), others: Mintz (2002)

CASCADE Mints D1.1 Fuel cell technologies and H2 production/distribution options
86
Compressors are needed in order to move the hydrogen in the pipeline, if the pressure at the central plant is not sufficient. They are sized depending on inlet and outlet pressure, and flow rate. Typically for natural gas, they are installed every 100-150 km (Voß 2001). In practise for all gases, the installation layout is an optimum problem of investment cost, operating costs and production rate. For diameter below optimum, the dominating costs are compressor capital and operating costs, for larger diameters than optimum, pipe total cost will prevail (Oney, Veziroglu et al. 1994).
Reciprocating compressors are most commonly used for hydrogen applications (Amos 1998). It is practical to power the compressors by hydrogen engines with a small amount of hydrogen taken from the pipeline, as it is done for natural gas pipelines. The given numbers below are based on a reciprocating compressor with gas engine including normal auxiliary equipment with purchase costs taken from Peters et al.(2003), adjusted for power by the methodology used in Amos (1998). This results in investment costs by size from 760 to 4,600 €2000/kW.
The major operating cost for hydrogen pipelines is compressor power and maintenance. Some hydrogen losses may occur in the piping network, but for natural gas piping systems, these losses are less than 1% (Hart, 1997 in Amos, 1998). Gas energy demand for compressor power is calculated for the exemplary layouts and can be used to estimate operation costs for compressing. The energy demand ranges from 0.01% to 4.5% of the transported energy.
Floor costs Natural gas pipelines are considered a mature technology. Hydrogen pipelines will need adjustments at compressing stations and piping material, therefore will be more expensive at first. Therefore the investment costs for NG pipelines can be used as minimum floor costs. NG pipelines are roughly a factor 1.5 more expensive than H2 pipelines with trenchless technology (Mintz, 2002). We take this factor to estimate minimum floor costs of hydrogen pipelines.
Cost summary for pipelines Cost data are summarized for several pipeline layouts for different purposes. 3 inch pipes are calculated representative for connecting pipes to fuelling stations, while large diameters may be used for long-distance pipelines. The inlet pressure of the compressor was set equal to the delivery pressure of 2 MPa. Therefore each section may be multiplied in order to cover greater distances. The compressor outlet pressure was calculated to overcome frictional losses, maintaining the given production rate. Energy demand is calculated from the adiabatic head for the given pressure delta, modelling hydrogen as real gas (Jacobsen, Penoncello et al. 1997). Compressor efficiency is set to 0.78 (Lüdtke 2004) and the gas engine efficiency is set to 0.33 (Peters, Timmerhaus et al. 2003).
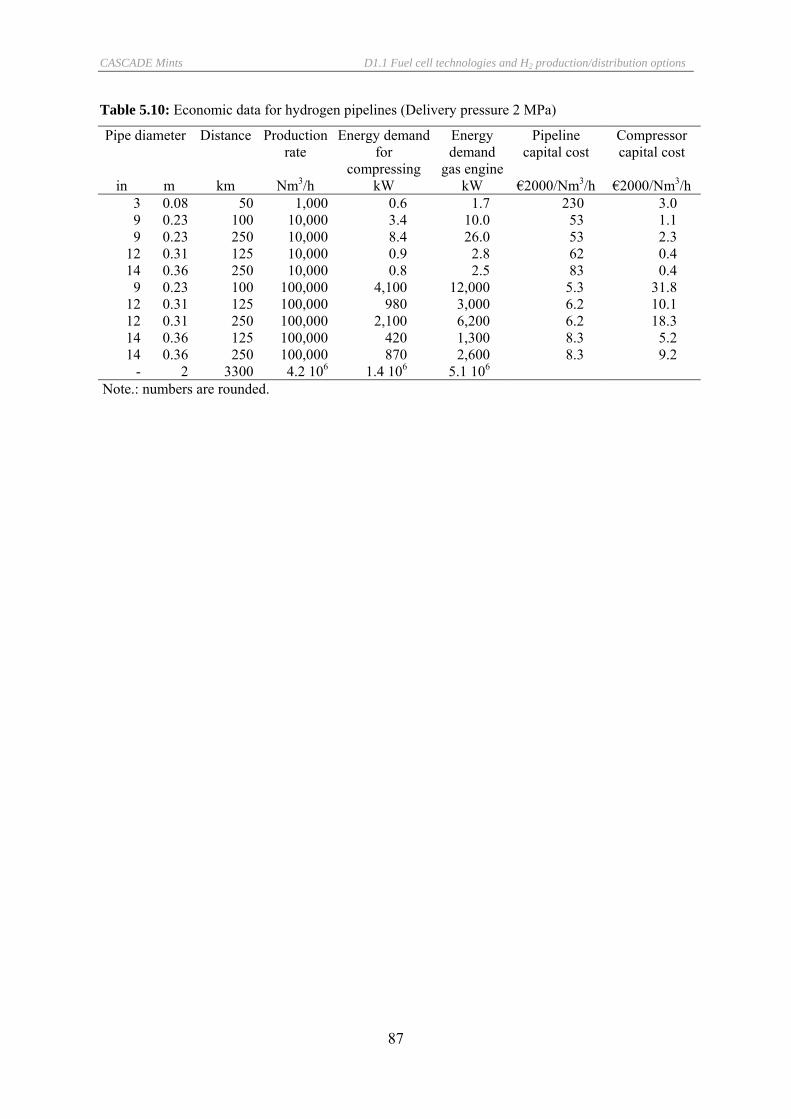
CASCADE Mints D1.1 Fuel cell technologies and H2 production/distribution options
87
Table 5.10: Economic data for hydrogen pipelines (Delivery pressure 2 MPa)
Pipe diameter Distance Production rate
Energy demand for
compressing
Energy demand
gas engine
Pipeline capital cost
Compressor capital cost
in m km Nm3/h kW kW €2000/Nm3/h €2000/Nm3/h 3 0.08 50 1,000 0.6 1.7 230 3.0 9 0.23 100 10,000 3.4 10.0 53 1.1 9 0.23 250 10,000 8.4 26.0 53 2.3
12 0.31 125 10,000 0.9 2.8 62 0.4 14 0.36 250 10,000 0.8 2.5 83 0.4
9 0.23 100 100,000 4,100 12,000 5.3 31.8 12 0.31 125 100,000 980 3,000 6.2 10.1 12 0.31 250 100,000 2,100 6,200 6.2 18.3 14 0.36 125 100,000 420 1,300 8.3 5.2 14 0.36 250 100,000 870 2,600 8.3 9.2
- 2 3300 4.2 106 1.4 106 5.1 106 Note.: numbers are rounded.

CASCADE Mints D1.1 Fuel cell technologies and H2 production/distribution options
88
Table 5.11: Transport of hydrogen: characterisation of ‘generic’ road transport scenarios.
Road transport Net delivery
Transport distance
Fuel use Yearly mileage
Utilisation factor$
System lifetime%
Investment costs (floor)
Fixed O&M costs
Variable O&M costs
kg km g/km km/a a k€2000 €2000/a €2000/km Liquid transport by road Short distance 3,370 100 288 66,000 0.73 6/10 516 (416) 52,000 * 0.20 ‡ Long distance 3,370 800 288 121,000 0.95 6/10 516 (416) 52,000 * 0.18 ‡ Gaseous transport by road Short distance ++ 250 100 288 66,000 0.73 6/10 196 51,000 * 0.18 ‡ Long distance 250 800 288 121,000 0.95 6/10 196 51,000 * 0.16 ‡ ++ with exchange of trailers at the filling station; $ by kilometre; % tractor/trailer; * excl. capital cost, incl. labour, german case; ‡ excl. fuel cost
Table 5.12: Transport of hydrogen: characterisation of ‘generic’ sea shipping scenarios.
Sea transport Net delivery
Transport distance
Transport cycles
Transport efficiency
Yearly mileage
Utilisation factor
System lifetime
Investment costs
(floor)
Fixed O&M costs‡
Variable O&M costs
GWh/a km 1/a % km/a a 106 €2000 % Invest./a % Invest./a Long-distance ‘small-scale’ § 742 3300 33 172,000 0,5 30 162 (123) 5 4 Long-distance ‘large-scale’ § 10,355 3300 26 218,000 0,5 30 225 (180) 5 4 § Transport scenario: Algier – Rotterdam; $ by time: return trip empty; ‡incl. 2,5% for insurance;
Table 5.13: Transport of hydrogen: characterisation of ‘generic’ pipeline scenarios.
Pipeline Capacity Pipeline length
Delivery distance
Transport efficiency
Utilisation factor
System lifetime
Investment costs (floor)
Fixed O&M costs
Variable O&M costs
Nm3/h km km % % a €2000/kWCGH2 % Invest./a % Invest./a Local connection 10,000 100 - 70 30 1,900 (1,300) 2,5 1 Distribution network, 4 arms 100,000 600 150 70 30 3,600 (2,400) 2,5 1 North Africa - Central Europe 4.17·106 3,300 - 88,9 69§ 30 640 (430) 2,5 1 § depends on buffer storage at pipeline head;
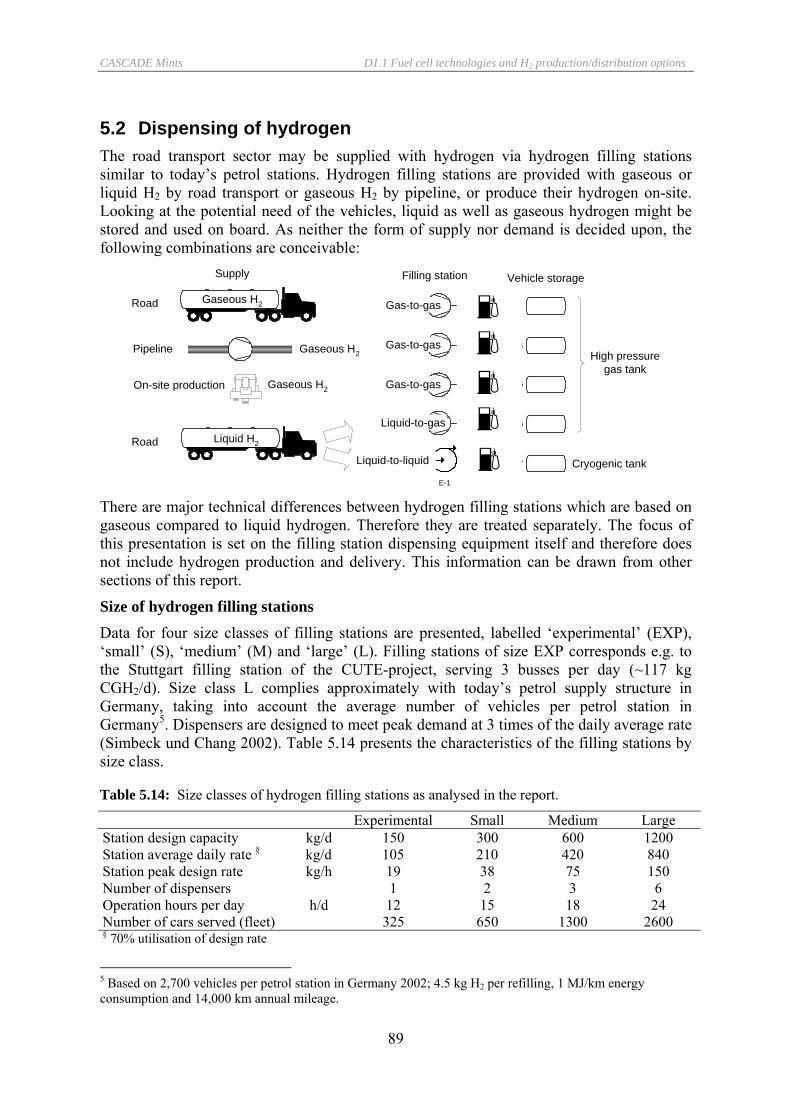
CASCADE Mints D1.1 Fuel cell technologies and H2 production/distribution options
89
5.2 Dispensing of hydrogen The road transport sector may be supplied with hydrogen via hydrogen filling stations similar to today’s petrol stations. Hydrogen filling stations are provided with gaseous or liquid H2 by road transport or gaseous H2 by pipeline, or produce their hydrogen on-site. Looking at the potential need of the vehicles, liquid as well as gaseous hydrogen might be stored and used on board. As neither the form of supply nor demand is decided upon, the following combinations are conceivable:
E-1
Gas-to-gas E-6
Liquid H2
Gaseous H2
E-113MM Ø 3MM x 3MM
Gaseous H2Pipeline
Road
Road
On-site production
E-14
E-15
E-16
E-17 Cryogenic tank
High pressuregas tank
Vehicle storageSupply Filling station
Gaseous H2
Liquid-to-liquid
Gas-to-gas
Gas-to-gas
Liquid-to-gas
There are major technical differences between hydrogen filling stations which are based on gaseous compared to liquid hydrogen. Therefore they are treated separately. The focus of this presentation is set on the filling station dispensing equipment itself and therefore does not include hydrogen production and delivery. This information can be drawn from other sections of this report.
Size of hydrogen filling stations Data for four size classes of filling stations are presented, labelled ‘experimental’ (EXP), ‘small’ (S), ‘medium’ (M) and ‘large’ (L). Filling stations of size EXP corresponds e.g. to the Stuttgart filling station of the CUTE-project, serving 3 busses per day (~117 kg CGH2/d). Size class L complies approximately with today’s petrol supply structure in Germany, taking into account the average number of vehicles per petrol station in Germany5. Dispensers are designed to meet peak demand at 3 times of the daily average rate (Simbeck und Chang 2002). Table 5.14 presents the characteristics of the filling stations by size class.
Table 5.14: Size classes of hydrogen filling stations as analysed in the report.
Experimental Small Medium Large Station design capacity kg/d 150 300 600 1200 Station average daily rate § kg/d 105 210 420 840 Station peak design rate kg/h 19 38 75 150 Number of dispensers 1 2 3 6 Operation hours per day h/d 12 15 18 24 Number of cars served (fleet) 325 650 1300 2600 § 70% utilisation of design rate
5 Based on 2,700 vehicles per petrol station in Germany 2002; 4.5 kg H2 per refilling, 1 MJ/km energy consumption and 14,000 km annual mileage.
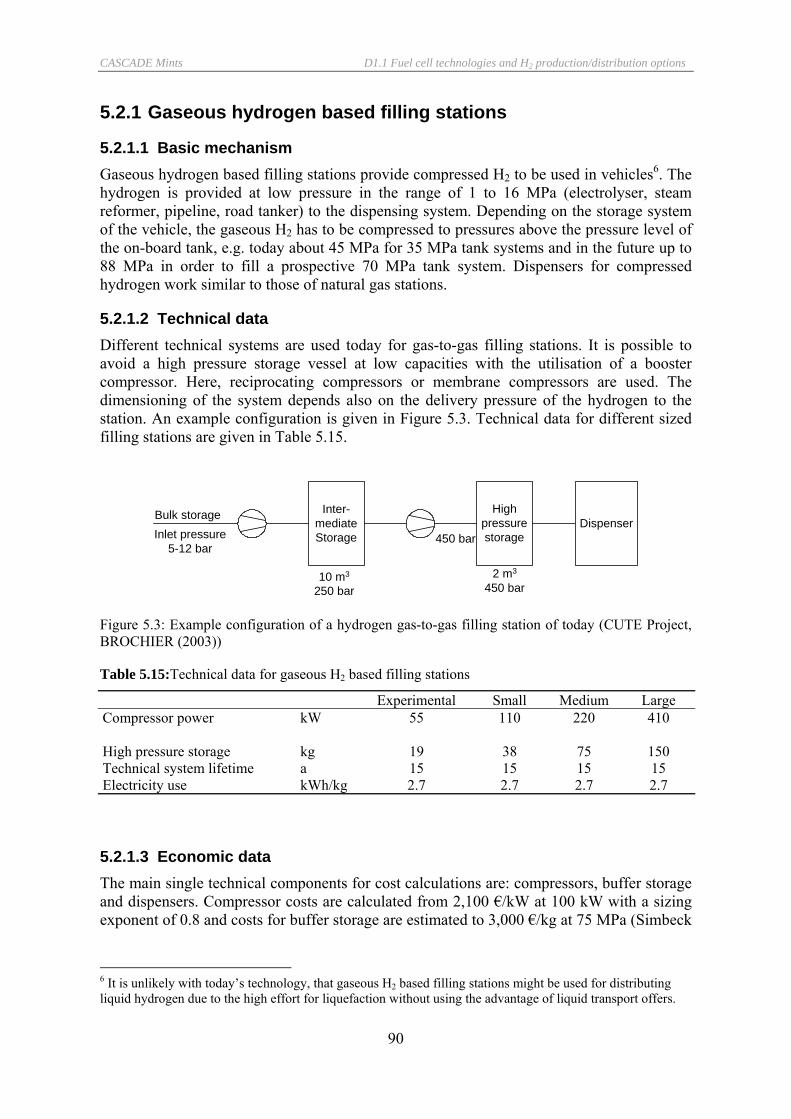
CASCADE Mints D1.1 Fuel cell technologies and H2 production/distribution options
90
5.2.1 Gaseous hydrogen based filling stations
5.2.1.1 Basic mechanism Gaseous hydrogen based filling stations provide compressed H2 to be used in vehicles6. The hydrogen is provided at low pressure in the range of 1 to 16 MPa (electrolyser, steam reformer, pipeline, road tanker) to the dispensing system. Depending on the storage system of the vehicle, the gaseous H2 has to be compressed to pressures above the pressure level of the on-board tank, e.g. today about 45 MPa for 35 MPa tank systems and in the future up to 88 MPa in order to fill a prospective 70 MPa tank system. Dispensers for compressed hydrogen work similar to those of natural gas stations.
5.2.1.2 Technical data Different technical systems are used today for gas-to-gas filling stations. It is possible to avoid a high pressure storage vessel at low capacities with the utilisation of a booster compressor. Here, reciprocating compressors or membrane compressors are used. The dimensioning of the system depends also on the delivery pressure of the hydrogen to the station. An example configuration is given in Figure 5.3. Technical data for different sized filling stations are given in Table 5.15.
Inter-mediateStorage
10 m3
250 bar
Inlet pressure5-12 bar
450 bar
Highpressurestorage
2 m3
450 bar
DispenserBulk storage
Figure 5.3: Example configuration of a hydrogen gas-to-gas filling station of today (CUTE Project, BROCHIER (2003))
Table 5.15:Technical data for gaseous H2 based filling stations
Experimental Small Medium Large Compressor power kW 55 110 220 410 High pressure storage kg 19 38 75 150 Technical system lifetime a 15 15 15 15 Electricity use kWh/kg 2.7 2.7 2.7 2.7
5.2.1.3 Economic data The main single technical components for cost calculations are: compressors, buffer storage and dispensers. Compressor costs are calculated from 2,100 €/kW at 100 kW with a sizing exponent of 0.8 and costs for buffer storage are estimated to 3,000 €/kg at 75 MPa (Simbeck
6 It is unlikely with today’s technology, that gaseous H2 based filling stations might be used for distributing liquid hydrogen due to the high effort for liquefaction without using the advantage of liquid transport offers.
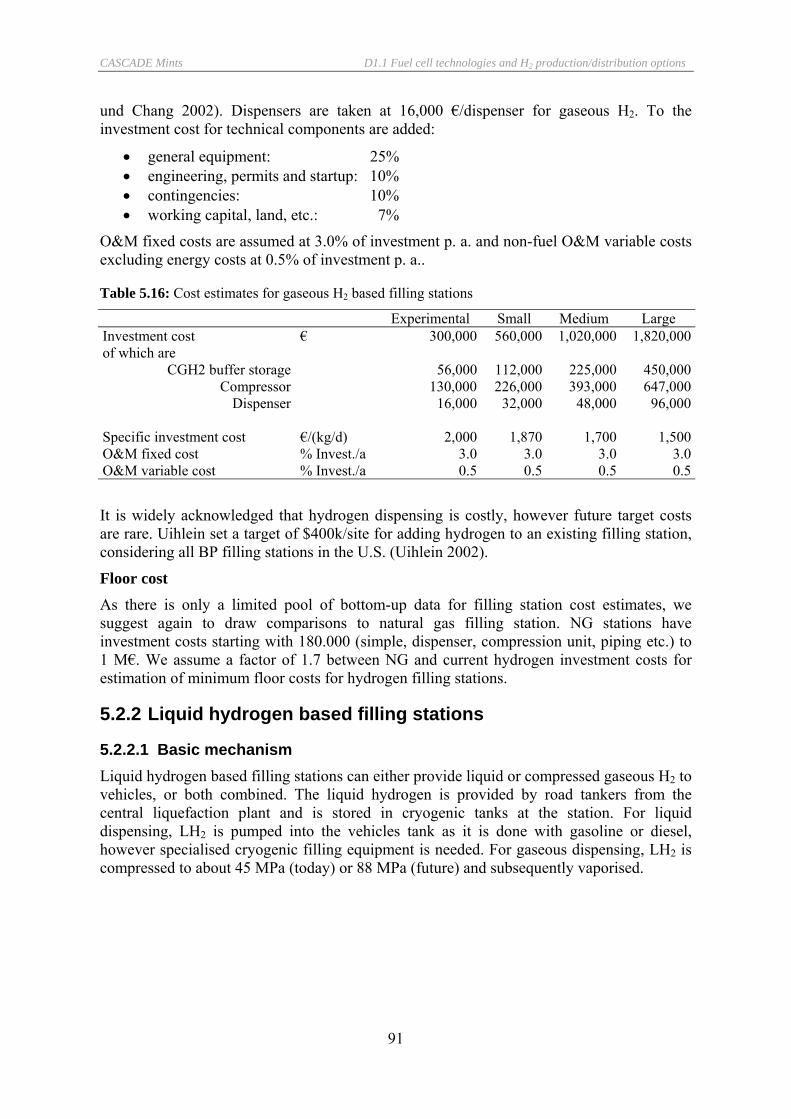
CASCADE Mints D1.1 Fuel cell technologies and H2 production/distribution options
91
und Chang 2002). Dispensers are taken at 16,000 €/dispenser for gaseous H2. To the investment cost for technical components are added:
• general equipment: 25% • engineering, permits and startup: 10% • contingencies: 10% • working capital, land, etc.: 7%
O&M fixed costs are assumed at 3.0% of investment p. a. and non-fuel O&M variable costs excluding energy costs at 0.5% of investment p. a..
Table 5.16: Cost estimates for gaseous H2 based filling stations
Experimental Small Medium Large Investment cost € 300,000 560,000 1,020,000 1,820,000of which are
CGH2 buffer storage 56,000 112,000 225,000 450,000Compressor 130,000 226,000 393,000 647,000
Dispenser 16,000 32,000 48,000 96,000
Specific investment cost €/(kg/d) 2,000 1,870 1,700 1,500O&M fixed cost % Invest./a 3.0 3.0 3.0 3.0O&M variable cost % Invest./a 0.5 0.5 0.5 0.5
It is widely acknowledged that hydrogen dispensing is costly, however future target costs are rare. Uihlein set a target of $400k/site for adding hydrogen to an existing filling station, considering all BP filling stations in the U.S. (Uihlein 2002).
Floor cost As there is only a limited pool of bottom-up data for filling station cost estimates, we suggest again to draw comparisons to natural gas filling station. NG stations have investment costs starting with 180.000 (simple, dispenser, compression unit, piping etc.) to 1 M€. We assume a factor of 1.7 between NG and current hydrogen investment costs for estimation of minimum floor costs for hydrogen filling stations.
5.2.2 Liquid hydrogen based filling stations
5.2.2.1 Basic mechanism Liquid hydrogen based filling stations can either provide liquid or compressed gaseous H2 to vehicles, or both combined. The liquid hydrogen is provided by road tankers from the central liquefaction plant and is stored in cryogenic tanks at the station. For liquid dispensing, LH2 is pumped into the vehicles tank as it is done with gasoline or diesel, however specialised cryogenic filling equipment is needed. For gaseous dispensing, LH2 is compressed to about 45 MPa (today) or 88 MPa (future) and subsequently vaporised.
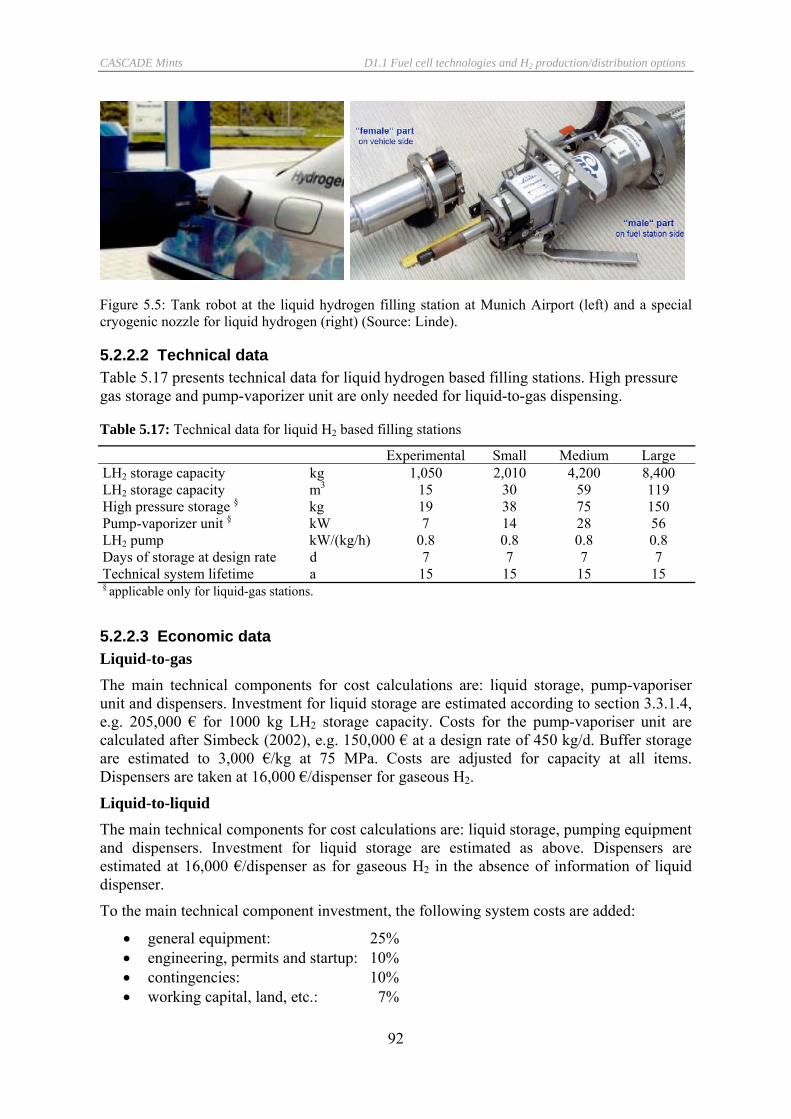
CASCADE Mints D1.1 Fuel cell technologies and H2 production/distribution options
92
Figure 5.5: Tank robot at the liquid hydrogen filling station at Munich Airport (left) and a special cryogenic nozzle for liquid hydrogen (right) (Source: Linde).
5.2.2.2 Technical data Table 5.17 presents technical data for liquid hydrogen based filling stations. High pressure gas storage and pump-vaporizer unit are only needed for liquid-to-gas dispensing.
Table 5.17: Technical data for liquid H2 based filling stations
Experimental Small Medium Large LH2 storage capacity kg 1,050 2,010 4,200 8,400 LH2 storage capacity m3 15 30 59 119 High pressure storage § kg 19 38 75 150 Pump-vaporizer unit § kW 7 14 28 56 LH2 pump kW/(kg/h) 0.8 0.8 0.8 0.8 Days of storage at design rate d 7 7 7 7 Technical system lifetime a 15 15 15 15 § applicable only for liquid-gas stations.
5.2.2.3 Economic data Liquid-to-gas The main technical components for cost calculations are: liquid storage, pump-vaporiser unit and dispensers. Investment for liquid storage are estimated according to section 3.3.1.4, e.g. 205,000 € for 1000 kg LH2 storage capacity. Costs for the pump-vaporiser unit are calculated after Simbeck (2002), e.g. 150,000 € at a design rate of 450 kg/d. Buffer storage are estimated to 3,000 €/kg at 75 MPa. Costs are adjusted for capacity at all items. Dispensers are taken at 16,000 €/dispenser for gaseous H2.
Liquid-to-liquid The main technical components for cost calculations are: liquid storage, pumping equipment and dispensers. Investment for liquid storage are estimated as above. Dispensers are estimated at 16,000 €/dispenser as for gaseous H2 in the absence of information of liquid dispenser.
To the main technical component investment, the following system costs are added:
• general equipment: 25% • engineering, permits and startup: 10% • contingencies: 10% • working capital, land, etc.: 7%
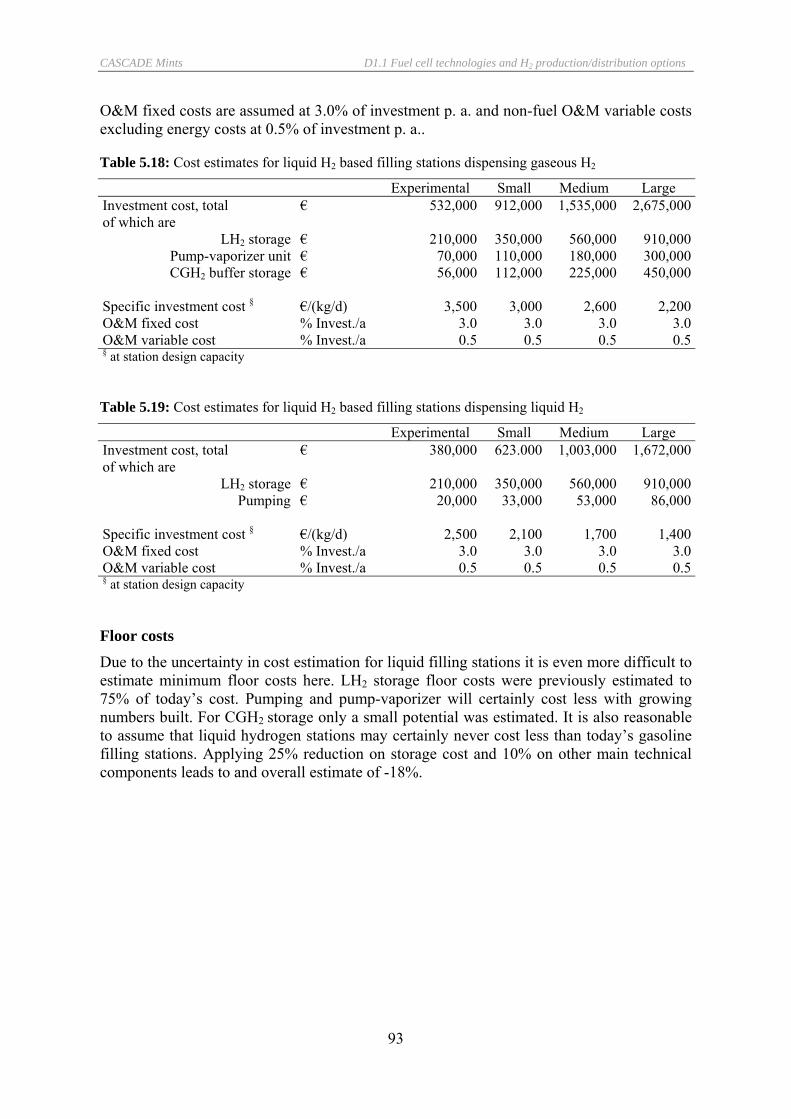
CASCADE Mints D1.1 Fuel cell technologies and H2 production/distribution options
93
O&M fixed costs are assumed at 3.0% of investment p. a. and non-fuel O&M variable costs excluding energy costs at 0.5% of investment p. a..
Table 5.18: Cost estimates for liquid H2 based filling stations dispensing gaseous H2
Experimental Small Medium Large Investment cost, total € 532,000 912,000 1,535,000 2,675,000of which are
LH2 storage € 210,000 350,000 560,000 910,000Pump-vaporizer unit € 70,000 110,000 180,000 300,000CGH2 buffer storage € 56,000 112,000 225,000 450,000
Specific investment cost § €/(kg/d) 3,500 3,000 2,600 2,200O&M fixed cost % Invest./a 3.0 3.0 3.0 3.0O&M variable cost % Invest./a 0.5 0.5 0.5 0.5§ at station design capacity
Table 5.19: Cost estimates for liquid H2 based filling stations dispensing liquid H2
Experimental Small Medium Large Investment cost, total € 380,000 623.000 1,003,000 1,672,000of which are
LH2 storage € 210,000 350,000 560,000 910,000Pumping € 20,000 33,000 53,000 86,000
Specific investment cost § €/(kg/d) 2,500 2,100 1,700 1,400O&M fixed cost % Invest./a 3.0 3.0 3.0 3.0O&M variable cost % Invest./a 0.5 0.5 0.5 0.5§ at station design capacity
Floor costs Due to the uncertainty in cost estimation for liquid filling stations it is even more difficult to estimate minimum floor costs here. LH2 storage floor costs were previously estimated to 75% of today’s cost. Pumping and pump-vaporizer will certainly cost less with growing numbers built. For CGH2 storage only a small potential was estimated. It is also reasonable to assume that liquid hydrogen stations may certainly never cost less than today’s gasoline filling stations. Applying 25% reduction on storage cost and 10% on other main technical components leads to and overall estimate of -18%.

CASCADE Mints D1.1 Fuel cell technologies and H2 production/distribution options
94
Table 5.20: Hydrogen dispensing options: characterisation of ‘generic’ filling stations
Design capacity Electricity use
Utilisation Investment costs
Floor cost Fixed O&M costs
Variable O&M costs
kg/day kWh/kg €2000/(kg/d) €2000/(kg/d) % Invest./a % Invest./a Liquid-to-liquid Small-scale ‘today’ 300 0.8 0.7 2,100 1,700 3 0.5 Large-scale ‘today’ 1,200 0.8 0.7 1,400 1,100 3 Liquid-to-gas Small-scale ‘today’ 300 0.8 0.7 3,000 2,500 3 0.5 Large-scale ‘today’ 1,200 0.8 0.7 2,200 1,800 3 Gas-to-gas Small-scale ‘today’ 300 2.7 0.7 1,900 1,100 3 0.5 Large-scale ‘today’ 1,200 2.7 0.7 1,500 900 3 0.5

CASCADE Mints D1.1 Fuel cell technologies and H2 production/distribution options
95
6 Costs of hydrogen production and supply Based on the assumptions on energy prices and on the potential costs of CO2-emissions given in Table 6.1, Figure 6.1 clearly shows that today natural gas steam reforming is the most economic option for producing hydrogen, followed by coal gasification and partial oxidation of heavy fuel oil. The costs for ‘green’ hydrogen produced by electrolysis using electricity from renewable energy sources today are still much higher. Biomass gasification still needs technical development before it can be considered as a reliable option for hydrogen production.
On the long term, this picture will change because of increasing prices of energy carriers, and the expected costs of CO2 emission certificates. On the long term, the most economic renewable options for large scale electricity generation are offshore wind parks and concentrating solarthermal power plants. Until 2050, hydrogen production costs from electrolysis using electricity from these renewable energies will be compatible with natural gas steam reforming or coal gasification. Biomass gasification still is in an early stage of technology development, so that cost estimates are uncertain and depend on improvements in commercial scale production. In addition, the costs of hydrogen from biomass gasification very much depend on the availability of low cost biomass feedstock.
Carbon capture and storage technologies are in a very early – basically conceptual - stage of development, so that up to now there is very limited experience on reliable cost data. Figure 6.2 shows the future maximum costs for carbon capture and storage, which still allow the production of hydrogen from natural gas steam reforming and coal gasification at competitive costs compared with hydrogen production from electrolysis using offshore wind electricity (base year 2050).
Table 6.1: Assumptions on the future development of energy prices and carbon costs
2000 2025 2050 Natural gas €/GJ 2,91 4,84 8,72 Crude oil €/GJ 4,44 5,33 9,76 Coal €/GJ 1,4 1,7 2,4 Biomass €/GJ 2,2 4,7 5,3 Electricity - wind offshore ct/kWh 10,9 4,4 4,0 - solar thermal power plant with desalination facility
ct/kWh 5,8 3,8
Carbon costs €/tCO2 - 25 50
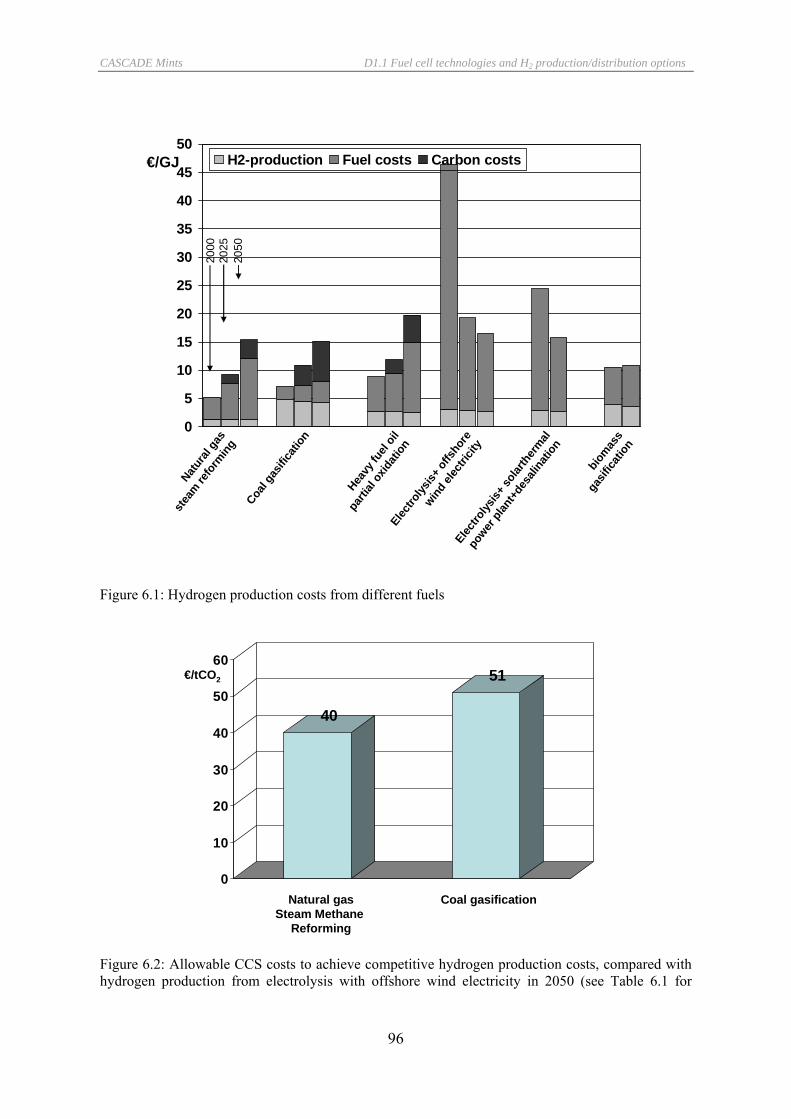
CASCADE Mints D1.1 Fuel cell technologies and H2 production/distribution options
96
0
5
10
15
20
25
30
35
40
45
50H2-production Fuel costs Carbon costs
Natura
l gas
steam
refo
rming
Coal g
asific
ation
Heavy
fuel
oil
parti
al ox
idatio
nElec
trolys
is+ of
fshor
e
wind el
ectri
city
Electro
lysis+
solar
ther
mal
power
plan
t+de
salin
ation
biomas
s
gasif
icatio
n
€/GJ
2000
2025
2050
Figure 6.1: Hydrogen production costs from different fuels
40
51
0
10
20
30
40
50
60
Natural gasSteam Methane
Reforming
Coal gasification
€/tCO2
Figure 6.2: Allowable CCS costs to achieve competitive hydrogen production costs, compared with hydrogen production from electrolysis with offshore wind electricity in 2050 (see Table 6.1 for

CASCADE Mints D1.1 Fuel cell technologies and H2 production/distribution options
97
underlying assumptions) Hydrogen supply costs
It is commonly acknowledge that it is difficult and costly to deliver hydrogen to the customer (e.g. Uihlein (2002)). This section provides some selected scenarios by combining the infrastructure building blocks and giving some indicative cost data per unit hydrogen resulting from the cost data as of today. Lowering of costs can be expected in the future with a broad introduction of hydrogen to the energy sector. The evaluation of prospective future costs will be established in other working packages of the CASACADE MINTS project.
Table 6.2: Scenarios for hydrogen supply by combination of different infrastructure blocks.
Scenario A B C D E Liquefaction Liquefaction LiquefactionLong-distance transport CGH2
Pipeline (3300 km)
LH2 Sea transport
(3300 km) Bulk-buffer-storage Salt cavern LH2 LH2 Salt cavern LH2 Regional transport CGH2
Pipeline (100 km)
LH2 road transport (100 km)
LH2 road transport (100 km)
Regional pipeline network
LH2 road transport (100 km)
Dispensing CGH2 (35 MPa)
LH2 (liquid-liquid)
LH2 (liquid-gas)
CGH2 (35 MPa)
LH2 (liquid-liquid)
0
5
10
15
20
25
30
35
40
DispensingTransport to customerBulk-buffer-storageLong-distance transportLiquefaction
€/GJ
A B C D E
2000
2025
2050
Figure 6.3: Costs for different hydrogen supply scenarios (exemplary calculation)
CASCADE Mints D1.1 Fuel cell technologies and H2 production/distribution options
98
7 References Abe, A., M. Nakamura, et al. (1998): “Studies of the large-scale sea transportation of liquid hydrogen.” International Journal of Hydrogen Energy 23(2): 115-121.
ADL (2001): Cost Analysis of Fuel Cell System for Transportation. 2001 System Cost Estimate. Task 3 Report to Department of Energy. Cambridge, Massachusetts, Arthur D. Little, Acom Park.
Angloher, J., Dreier, T. (2000): Techniken und Systeme zur Wasserstoffbereitstellung. Perspektiven einer Wasserstoff-Energiewirtschaft (Teil 1). Wiba Koordinationsstelle der Wasserstoff-Initiative Bayern. Lehrstuhl für Energiewirtschaft und Anwendungstechnik. München, Februar 2000
Air Liquide (2003): Hydrogen Delivery Technologies and Systems: Pipeline Transmission of Hydrogen. Strategic Initiatives for Hydrogen Delivery Workshop, U.S. Department of Energy �¡ Hydrogen, Fuel Cells, and Infrastructure Technologies Program.
Airy, A. (2004): “Strategic natural gas storage at $100 M in pipeline.” Financial Express.
Amos, W. A. (1998): Costs of Storing and Transporting Hydrogen.
Anonymous (2004): Personal communication with representative of fuel cell industry. S. Schmid. Hannover Fair.
Ballard (2004): Light duty fuel cell engine Xcellsis HY-80, Ballard. 2004.
Ballard (2004): fuel cell technology – 250 kW stationary generator field trial. http://www.ballard.com/tD.asp?pgid=35&dbid=0 (March 2004)
Basye and Swaminathan (1997): Hydrogen Production Costs – A Survey. SENTECH, Inc., Bethesda, December 1997
Belloni, A., Ed. (2003): Linde Technology. Berichte aus Technik und Wissenschaft, Linde AG.
Berger, P. (2003): Die MTU Brennstoffzelle: Zielmärkte und Ergebnisse des Feldversuchs. In: Proceedings of f-cell 2003. 29.-30.9.2003, Stuttgart
Bessette, Norman F.; Borglum, Brian P.; Schichl, Hermann; Schmidt, Douglas S. 2001: Siemens SOFC Technology on the Way to Economic Competitiveness. In: Siemens PG (Hrsg.). 1/2001, S. 10-13
Black, I., R. Seaton, et al. (2002): RECORDIT Final Report: Actions to Promote Intermodal transport, University of Cranfield & ISIS.
Block, D.L. (1998): Comparative Costs of Hydrogen Produced from Photovoltaic Electrolysis and from Photoelectrochemical Processes. Proceedings of the 12th World Hydrogen Energy Conference, 21-25 June, 1998, Buenos Aires, Argentina
BMWA (2003): Forschungs- und Entiwcklungskonzept für emissionsarme fossil befeuerte Karftwerke. Bericht der COORETEC-Arbeitsgruppen. Bundesministerium für Wirtschaft und Arbeit, Dokumentation Nr. 527. Dezember 2003
BOC (2004): IMET Hydrogen Generators. https://b2.boc.com/catweb/CATweb.nsf/noteid/444A

CASCADE Mints D1.1 Fuel cell technologies and H2 production/distribution options
99
Bossel, U., B. Elliasson, et al. (2003). The Future of the Hydrogen Economy: Bright or Bleak?
Bouza, A., C. J. Read, et al. (2004). Hydrogen Storage: 2004 Annual DOE Hydrogen Program Review. Office of Hydrogen, Fuel Cells and Infrastructure Technologies.
Bowen, D. (2003): A Techno-Economic Assessment of Hydrogen Production by Gasificiation of Biomass. Poster presented at the 2003 DOE Hydrogen and Fuel Cell Merit Review and Peer Evaluation. Berkley, California, May 19-22, 2003; http://www.eere.energy.gov/hydrogenandfuelcells/hydrogen/pdfs/30_gti_david_bowen.pdf
Breault, R.D. (2003): Stack materials and stack design. In: Vielstich et al. (Eds.): Handbook of Fuel Cells – Fundamentals, Technology and Application. Wiley, Chichester, 2003
Britz (2003): Das Viessmann Brennstoffzellenheizgerät in der Erprobungsphase. In: Proceedings of f-cell 2003. 29.-30.9.2003, Stuttgart
BROCHIER (2003). Wasserstofftankstellen für Brennstoffzellentechnologie, Brochier Deutschland Anlagenplanung.
Burke, A. und M. Gardnier (2005). Hydrogen Storage Options: Technologies and Comparisons for Light-Duty Vehicle Applications. Davis, University of California.
BVT (2004). Preisempfehlung Transport (PeTra), Bundesverband der Transport unternehmen.
Carlson, E., Sriramulu, S., Teagan, W., Yang, Y. (2004): Modeling the Cost of SOFC Technology. Fuel Cell Seminar Presentation, San Antonio, TX, November 3, 2004.
Carlson, E., P. Kopf, et al. (2004). DoE Hydrogen Programme FY2004 Progress Report. Cambridge, MA, TIAX LLC.
Chachine, A. und Y. Guerrini (2000). More underground storage for increased gas consumption, UN/ECE. 2004.
Chemical Market Reporter (2002) Carbon Black.
Christiansen, P. (2004). Liquid hydrogen carriers (Moss Maritime). Personal communication with S. Schmid.
CRYOGENMASH (2004). Website http://www.cryogenmash.ru, Cryogenmash. 2004.
Czernik, S., French, R., Feik, C., Chornet, E. (2002): Production of hydrogen by co-reforming biomass pyrolysis liquids and natural gas. ACS Fuel Chemistry Division Preprints 2002, 47(1), 372-373
D. Stöver, H.P. Buchkremer, J.P.P. Huijsmans (2003): MEA/cell production methods: Europe/USA. In: Vielstich et al. (Eds.): Handbook of Fuel Cells – Fundamentals, Technology and Application. Wiley, Chichester, 2003
Difiglio, C. (2003). Hydrogen and Transportation. Alternative Scenarios. 2004.
DoE (2003). U.S. Department of Energy. Technical plan - hydrogen storage.
DoE (2004). website.
DoE Team Report (2004). ON-BOARD FUEL PROCESSING GO/NO-GO DECISION, Department of Energy, United States of America.

CASCADE Mints D1.1 Fuel cell technologies and H2 production/distribution options
100
Dönitz, W., et al. (1988): Hochtemperaturelektorlyse von Wasserdamp, HOT ELLY Phase IIA. Forschungsbericht 03E-4187-B für das Bundesministerium für Forschung und Technologie, Dornier System GmbH, Friedrichshafen
Dreier, T., Wagner, U. (2000): Perspektiven einer Wasserstoff-Energiewirtschaft. Teil 1: Techniken und Systeme zur Wasserstofferzeugung. BWK Bd. 52 (2000) Nr. 12, pp.41-46
Drnevich, R. (2003). Hydrogen Delivery, Liquefaction & Compression. Strategic Initiatives for Hydrogen Delivery Workshop.
Dutton, G. (2002): Hydrogen Energy Technology. Tyndall Centre for Climate Change Reseach, Working Paper 17, Chilton, Didcot, Oxon. April 2002
Dutton, G. (2003). Hydrogen transitions- a UK perspective.
EG&G (2000): Fuel Cell Handbook (5th edition). EG&G Services Parsons, Inc., Science Applications International Corporation. Under Contract No. DE-AM26-99FT40575, US Department of Energy, Office of Fossil Eenrgy, National Energy Technology Laboratory, October 2000
EPA (1995): Texaco Gasification Process Innovative Technology Evaluation Report. EPA/540/R-94/514. National Risk Management Research Laboratory, US Environmental Protection Agency. Cincinnati, Ohio, July 1995
Ernst, S., m. Fritz, et al. (1995). “Zeolites as Media for Hydrogen Storage.” Int. J. Hydrogen Energy Vol. 20(No. 12): pp. 967-970.
ESECS 2003: Fuel Cell Report to Congress (ESECS EE-1973). http://www.eere.energy.gov/hydrogenandfuelcells/pdfs/fc_report_congress_feb2003.pdf
EUCAR (2003): Well-to-wheel analysis of future automotive fuels and powertrains in the European context. Well-to-Tank report, Version 1. EUCAR, CONCAWE, JRC/IES, December 2003 (available at http://ies.jrc.cec.eu.int/Download/eh)
Ford (2003). 2003 Research and Advanced Engineering Technology Report. 2004.
FreedomCar Web Site (2005). FreedomCar and Vehicle Technolgoies Programme, US Department of Energy. 2005.
Freund, E. (2003). CO2 Sequestration. 1st European Hydrogen Energy Conference.
Frey, Lako, Pittermann, Pospischil,Reisinger (2004): VLEEM II – Monograph on Biomass. Report prepared within the VLEEM-2 project, EC/DG Research, contract ENG1-CT 2002-00645.
Fuel Cell Today (2002): Fuel Cell Industry Developments, June 27, 2002. www.fuelcelltoday.com
Garman, D. (2002). FreedomCAR: Energy Security for America's Transportation, David Garman, Assistant Secretary, Energy Efficiency and Renewable Energy, U.S. Department of Energy. 2004.
Gerl, B. (2002). Innovative Automobilantriebe.
Ghirardi, M., Kosourov, S., Tsygankov, A., Rubin, A., Seibert, M. (2002): Cyclic photobiological algal H2-Production. Proceedings of the 2002 U.S. DOE Hydrogen Program Review. NREL/CP-610-32405
CASCADE Mints D1.1 Fuel cell technologies and H2 production/distribution options
101
Giacomazzi, G. (1989). “Prospects for intercontinental seaborne transportation of hydrogen.” International Journal of Hydrogen Energy 14(8): 603-616.
Grahl, M. K. (2000). Ökonomische Systemanalyse zum Antrieb von Personenwagen mit Polymer-Elektrolyt-Brennstoffzellen unter Verwendung neuer Kraftstoffe. Fakultät III für Prozesswissenschaften. Berlin, Technischen Universität Berlin.
Gray and Tomlinson (2002): Hydrogen from Coal. Mitrek Technical Paper MTR 2002-31. July 2002
Gruppo Clas (2002). Real cost reduction for door-to-door intermodal transport. Ressource cost calculation for selected corridors. Deliverable 3 of the RECORDIT project. Milan, Gruppo Clas.
H. Kabs (2002): Stationäre Anwendungsgebiete von Brennstoffzellen – Überblick. f-cell 2002. 2. Forum für Produzenten und Anwender. Stuttgart, 14./15. Oktober 2002.
Haile, S. M. (2003). “Fuel cell materials and components.” Acta Materialia 51(19): 5981-6000.
Heurich, H., Higman, C. (1993): Partial Oxidation in the Refinery Hydrogen Management Scheme. Presentation at AIChE Spring Meeting, Symposium on Recent Advances in Petroleum Refining. Houston, 30th March 1993.
Hendriks, C., Graus, W., van Bergen, F. (2004): Global Carbon Dioxide Storage Potential and Costs. Report prepared by Ecofys and TNO, EEP-02001. ECOFYS, Utrecht, The Netherlands.
Hottinen, T. (2001). Technical Review and Economic Aspects of Hydrogen Storage Technologies. Department of Engineering, Physics and Mathematics, Helsinki University of Technology.
Hufton, J., Waldron, W., Weigel, S., Rao, M., Nataraj, S., Sircar, S. (2000): Sorption enhanced reaction process (SERP) for the production of hydrogen. Proceedings of the 2000 US Department of Energy Hydrogen Program Review, NREL/CP-570-28890, 2000
IE (2004): Entwicklung einer Gesamtstrategie zur Einführung alternativer Kraftstoffe, insbesondere regenerativ erzeugtem Wasserstoff als Kraftstoff für den mobilen Bereich – Biogene Kraftstoffe. Unpublished Report, UFOPLAN, FKZ 203 45 118, Institut für Energetig unf Umwelt gGmbH, Leipzig, April 2004.
IEA (2004a): IEA Hydrogen Program. Task 14: Photoelectrolytic Production of Hydrogen. http://www.eere.energy.gov/hydrogenandfuelcells/hydrogen/iea/tasks/task14.html
IEA (2004b): IEA Hydrogen Program. Task 15: Photobiological Production of Hydrogen. http://www.eere.energy.gov/hydrogenandfuelcells/hydrogen/iea/tasks/task15.html
INFRAS (2004). HBEFA: Handbuch Emissionsfaktoren des Strassenverkehrs / Handbook Emission Factors for Road Transport. Bern, BUWAL / Umweltbundesamt Berlin, Umweltbundesamt Austria.
J. Kuipers (1998): 100 kW SOFC System Experience From A User Point of View. In: Fuel Cells – Clean Energy for Today’s World. 1998 Fuel Cell Seminar. Palm Springs, 16.-19. November 1998
Jacobsen, R. T., S. G. Penoncello, et al. (1997). Thermodynamic Properties of Cryogenic Fluids, Plenum Press.
CASCADE Mints D1.1 Fuel cell technologies and H2 production/distribution options
102
James, B. D., G. D. Ariff, et al. (2002). DFMA Cost Estimates of Fuel-Cell/Reformer Systens at Low/Medium/High Production Rates. Future Car Congress.
Jensen, S., Hogh, J., Barford, R., Mogensen, M. (2003): High Temperature Electrolysis of Steam and Carbon Dioxide. Materials Research Department, Riso National Laboratory, Roskilde, Denmark
Karim, G. A. (2003). “Hydrogen as a spark ignition engine fuel.” International Journal of Hydrogen Energy 28(5): 569-577.
K. Tanaka, C. Wen, K. Yamada (2000): Design and evaluation of combined cycle system with solid oxide fuel cell and gas turbine. Fuel 79 (2000) 1493-1507
Kabs (2002): Stationäre Anwendungsgebiete von Brennstoffzellen – Überblick. In: Proceedings of f-cell 2002. Stuttgart, 14./14. October 2002
Kalhammer, F. R., P. R. Prokopius, et al. (1998). STATUS AND PROSPECTS OF FUEL CELLS AS AUTOMOBILE ENGINES. A REPORT OF THE FUEL CELL TECHNICAL ADVISORY PANEL, Prepared for State of California Air Resources Board Sacramento, California.
King, J.M., McDonald, B. (2003): Experience with 200 kW PC25 fuel cell power plant. In: Vielstich et al. (Eds.): Handbook of Fuel Cells – Fundamentals, Technology and Application. Wiley, Chichester, 2003
Klett, M.G., White, J.S., Schoff, R.L., Buchanan, T.L. (2002): Hydrogen Production Facilities – Plant Performance and Cost Comparisons. Final Report prepared for the United States Department of Energy under Contract No. DE-AM26-99FT40465. Parsons Infrastructure and Technology Group Inc., Reading, Pennsylvania, 2002
Klinder (2002): Mikro-KWK mit Brennstoffzellen – Das Vaillant Brennstoffzellen-Heizgerät im Praxistest. In: Proceedings of f-cell 2002. Stuttgart, 14./14. October 2002
Klinder, K. (2003): Feldtesterfahrung mit Vaillant Brennstoffzellen-Heizgeräten der 3. Generation. In: Proceedings of f-cell 2003. 29.-30.9.2003, Stuttgart
Krewitt, W., Pehnt, M., Fischedick, M., Temming, H. (Eds.) (2004): Fuel Cells in Combined Heat and Power Production – Life Cycle Assessment, Scenarios, Market Potentials (in German). Erich Schmidt Verlag, Berlin, 2004
Kruse, B., S. Grinna, et al. (2002). Bellona-Hydrogen.
Kvaerner (1997): http://www.akerkvaerner.com/internet/mediacentre/pressreleases/all/1997/ak_pr_3305.htm
Lelieveld, J., S. Lechtenbohmer, et al. (2005). “Greenhouse gases Low methane leakage from gas pipelines.” 434(7035): 841-842.
Linde AG (2003). Modell des CooLH2 Fahrzeugtanks.
Linde AG (2004). Personal communication. S. Schmid.
Lipman, T. E., J. L. Edwards, et al. (2002). Economic Analysis of Hydrogen Energy Station Concepts: Are "H2E-Stations" a Key Link to a Hydrogen Fuel Cell Vehicle Infrastructure?, University of California, Berkeley.
Lüdtke, K. H. (2004). Process Centrifugal Compressors, Springer.

CASCADE Mints D1.1 Fuel cell technologies and H2 production/distribution options
103
Maas, N., J. E. Uitenboogaart, et al. (2001). Identification and calculation of taxes, charges and subsidies. Deliverable D5 of RECORDIT project, TNO Inro Department of Logistics and Transport.
Makihira, A., Barreto, L., Riahi, K. (2003): Assessment of Alternative Hydrogen Pathways: Natural Gas and Biomass. Interim Report IR-03-037, International Institute for Applied System Analysis, Laxenburg, Austria
Milliken, J., J. Petrovic, et al. (2002). Hydrogen storage issues for automotive fuel cells. International workshop on hydrogen in materials, Newport News, Virginia.
Milne, T., Elam, C., Evans, R. (2002): Hydrogen from Biomass. State of the Art and Research Challenges. Report prepared for the International Energy Agency, IEA/H2/TR-02/001. National Renewable Energy Laboratory, Golden, CO USA
Mintz, M., S. Folga, et al. (2002). Cost of Some Hydrogen Fuel Infrastructure Options.
Mitsubishi (2004): Mitsubishi Corporation Succeeds in Generating 35MPa High-Pressure Hydrogen without a Compressor. http://www.mitsubishicorp.com/en/pdf/pr/mcpr040416e2.pdf
Mogensen, M., Bagger, C. (1998): SOFC: The key to make renewable energy profitable? Proceedings of 1998 Fuel cell seminar, Palm Springs, CA (US), 16-19 Nov 1998. Courtesy Associates Inc., Washington, DC, 1998, p. 96-99
Möller, S., Kaucic, D., Sattler, C. (2004): Hydrogen production by solar reforming of natural gas: a cost study. Proceedings of 2004 Solar Conference, July 11-14, Portland, Oregon, USA
Moss Maritime (2004). Moss Maritime Web Site. 2004.
MTU (20000): Presseinfo 25.10.2000 http://www.mtu-friedrichshafen.com/de/ps/pr131.10.00_1.htm
MTU (2004): The Fuel Cell Power Plant hotmodule http://www.mtu-online.com/cfc/en/down/pics/broschuere.pdf
Myers, D.B., Ariff, G.D., James, B.D., Kuhn, R.C. (2003): Hydrogen from Renewable Energy Sources: Pathways to 10 Quads for Transportation Uses in 2030 to 2050. Task 3 Final Report prepared for The Hydrogen Program Office, US Department of Energy, Washington, under Grant No. DE-FG01-99EE3509
Nitsch, J., Ed. (1989). Solare Großanlagen und Import solarer Energieträger. Stuttgart, DLR.
Oney, F., T. N. Veziroglu, et al. (1994). “Evaluation of pipeline transportation of hydrogen and natural gas mixtures.” International Journal of Hydrogen Energy 19(10): 813-822.
Padro C.E.G., Putsche V. (1999): Survey of the Economics of Hydrogen Technologies. NREL/TP-570-27079, National Renewable Energy Laboratory, September 1999
Palumbo, R., Keunecke, M., Möller, S., Steinfeld, A. (2004): Reflections on the design of solar thermal chemical reactors: thoughts in transformation. Energy 29 (2004) 727-744
Pehnt, M. (2002): Ganzheitliche Bilanzierung von Brennstoffzellen in der Energie- und Verkehrstechnik. Fortschritt-Berichte VDI, Reihe 6 Energietechnik, Nr. 476. VDI Verlag, Düsseldorf, 2002

CASCADE Mints D1.1 Fuel cell technologies and H2 production/distribution options
104
Peters, M. S., K. D. Timmerhaus, et al. (2003). Plant Design and Economics for Chemical Engineers, McGraw Hill.
Pischinger, S., M. Umierski, et al. (2005). Multi-fuel Brennverfahren für Benzin, Erdgas und Wasserstoff. 6. Internationales Stuttgarter Symposium Kraftfahrwesen und Verbrennungsmotoren, Stuttgart, expert Verlag.
Pokojski (2001): Die erste 250 kW PEM Brennstoffzelle in Europa – erste Betriebserfahrungen. In: Stationäre brennstoffzellenanlagen – Markteinführung. VDI-Berichte 1596, VDI Verlag, Düsseldorf, 2001
Proton (2004): Proton’s HOGEN Generators: A Family of On-Site Hydrogen Generation Solutions http://www.protonenergy.com/index.php/html/gasproducts
Quark, H. (2004). Website. 2004.
R.A. George, N.F. Bessette (1998): Reducing the manufacturing cost of tubular SOFC technology. Journal of Power Sources 71 (1998) 131-137
Raak H. (2003): Erfahrungen mit dem SOFC-Vorseriensystem für Einfamilienhäuser. F-cell, 3. Forum für Produzenten und Anwender, 29.-30.9.2003, Stuttgart
Reijers, H.T.J., Roskam-Bakker, D.F., Dijkstra, J.W. de Smidt, R.P., de Groot, A., van den Brink, R.W. (2003): Hydrogen production through sorption enhanced reforming. First European Hydrogen Energy Conference, Grenoble, 2-5 September 2003
Rice, G. (2004). Hannover Fair "hydrogen & fuel cells", 2004. S. Schmid.
Scheuerer, K. (2003). Bewährtes mit Zukunftspotential. Linde Technology 2/2003. L. AG, Linde AG.
Schmidt, H., Buchner, P., Datz, A., Dennerlein, K., Lang, S., Waidhas, M. (2002): Low-cost air cooled PEFC stacks. Journal of Power Sources 105 (2002) 243-249.
Schmidtchen, U. (2003). Liquid storage of hydrogen: Status and Outlook. SAPIO Firenze.
Schultz, M. G., T. Diehl, et al. (2003). “Air Pollution and Climate-Forcing Impacts of a Global Hydrogen Economy.” Science 302.
Siemens (2004): Siemens Power Generation. References and Demonstrations. http://www.pg.siemens.com/en/fuelcells/demo/index.cfm
Simbeck, D. und E. Chang (2002). Hydrogen Supply: Cost Estimate for Hydrogen Pathways - Scoping Analysis. Moutnain View, California, SFA Pacific Inc. for National Renewable Energy Laboratory.
Spath, P., Lane, J., Mann, M., Amos, W. (2000): Update of Hydrogen from Biomass – Determination of the Delivered Cost of Hydrogen. Milestone Report for the US Department of Energy’s Hydrogen Program. National Renewable Energy Laboratory, Golden, CO USA
Statoil (2004). Investment cost for LNG carriers. S. Schmid.
Steinfeld, A. (2002): Solar hydrogen production via a two-step water-splitting thermochemical cycle based on Zn/ZnO redox reactions. Int. J. of Hydrogen Energy 27 (2002) 611-619
Stuart Energy (2004): Hydrogen Generation. http://www.stuartenergy.com/main_our_products.html
CASCADE Mints D1.1 Fuel cell technologies and H2 production/distribution options
105
Sulzer 2002: Sulzer Hexis (2001): „Weltweit führende Brennstoffzellentechnologie zur Strom- und Wärmeerzeugung im Haushalt“, Firmenpräsentation 2001
Taylor, J. B., J. E. A. Alderson, et al. (1986). “Technical and economic assessment of methods for the storage of large quantities of hydrogen.” International Journal of Hydrogen Energy 11(1): 5-22.
Thomas, G. und J. Keller (2003). Hydrogen Storage-Overview. H2 Delivery and Infrastructure Workshop.
Thompson, L., M. Woolridge, et al. (2005). Fuel Processors for PEM Fuel Cells, University of Michigan.
Tobin, J. (2003). Expansion and Change on the U.S. Natural Gas Pipeline Network – 2002, EIA.
Tse, L. (2003). “Hydrogen Storage - Cryogenic Liquid.” Visionengineer.
Tsuchiya, H. und O. Kobayashi (2004). “Mass production cost of PEM fuel cell by learning curve.” International Journal of Hydrogen Energy 29(10): 985-990.
Turner, J. (2003): Photoelectrochemical water splitting. http://www.eere.energy.gov/hydrogenandfuelcells/hydrogen/pdfs/15_nrel_john_turner.pdf
Turner, J. et al. (2003): Photoelectrochemical systems for H2 production. FY 2003 Progress report. NREL, Golden CO
Tzimas, E., C. Filiou, et al. (2003). Hydrogen Storage: State-of-the-Art and Future Perspectives, European Commission, DG JRC, Institute of Energy, Petten, The Netherlands.
UTC (2002): UTC Fuel Cells, Commercial Power Systems. http://www.internationalfuelcells.com/commercial/faq.shtml (11.2.2002)
UTC (2004): UTC Fuel Cells, Features/Options http://www.utcfuelcells.com/commercial/features.shtm (4.3.2004)
Uihlein, J. P. (2002). Hearing on hydrogen and fuel cells. The United States House of Representatives. June 24, 2002.
Varner, K., Warren, S., Turner, J.A. (2002): Photoelectrochemical systems for hydrogen production. Proceedings of the 2002 U.S. DOE Hydrogen Program Review. NREL/CP-610-32405
Visco S.J., C.P. Jacobson, L.C. De Jonghe (2003): LBNL Activity Overview. Presented at the SECA Workshop, February 20th, 2003
Voß, A. (2001). Energiesysteme II. Stuttgart, IER, Institute of Energy Economics and the Rationale Use of Energy.
Wendt, H., Bauer, G. (1988): Water-Splitting Methods. In: Winter, C.-J., Nitsch, J. (Eds.) (1988): Hydrogen as an Energy Carrier – Technologies, Systems, Economy. Springer Verlag Berlin
Williams, M., Strakey, J., Surdoval, W. (2005): The U.S. Department of Energy, Office of Fossil Energy - Stationary Fuel Cell Program. Journal of Power Sources 143 (2005) 191-196.
Winter, C.-J., Nitsch, J. (Eds.) (1988): Hydrogen as an Energy Carrier – Technologies, Systems, Economy. Springer Verlag Berlin

CASCADE Mints D1.1 Fuel cell technologies and H2 production/distribution options
106
Wurster, R. (2003). Möglichkeiten der Wasserstoffbereitstellung und das Tankstellennetz der Zukunft.
Wurster,R. Zittel,W. (1994): Hydrogen Energy. Published at the Workshop on Energy technologies to reduce CO2 emissions in Europe: prospects, synergy. ECN Petten, April 11-12, 1994
Yamashita and Barreto (2003): Integrated Energy Systems for the 21st Century: Coal Gasification for Co-producing Hydrogen, Electricity and Liquid Fuels. Interim Report IR-03-039, International Institute for Applied System Analysis, Laxenburg, 2003
ZECA (2004): Process Overview. ZECA Corporation. http://www.zeca.org/process_overview/process_overview.html
Ziock et al. (2003): Technical Progress in the Development of Zero Emission Coal Technologies. LA-UR-02-5969. (http://www.zeca.org/pdfs/Progress_ZEC_Techn_09-02.pdf)
Zittel, W. und M. Altmann (1996). MOLECULAR HYDROGEN AND WATER VAPOUR EMISSIONS IN A GLOBAL HYDROGEN ENERGY ECONOMY. 11th World Hydrogen Energy Conference, Stuttgart, Germany.
Züttel, A. (2003). “Materials for hydrogen storage.” Materials Today 6(9): 24-33.
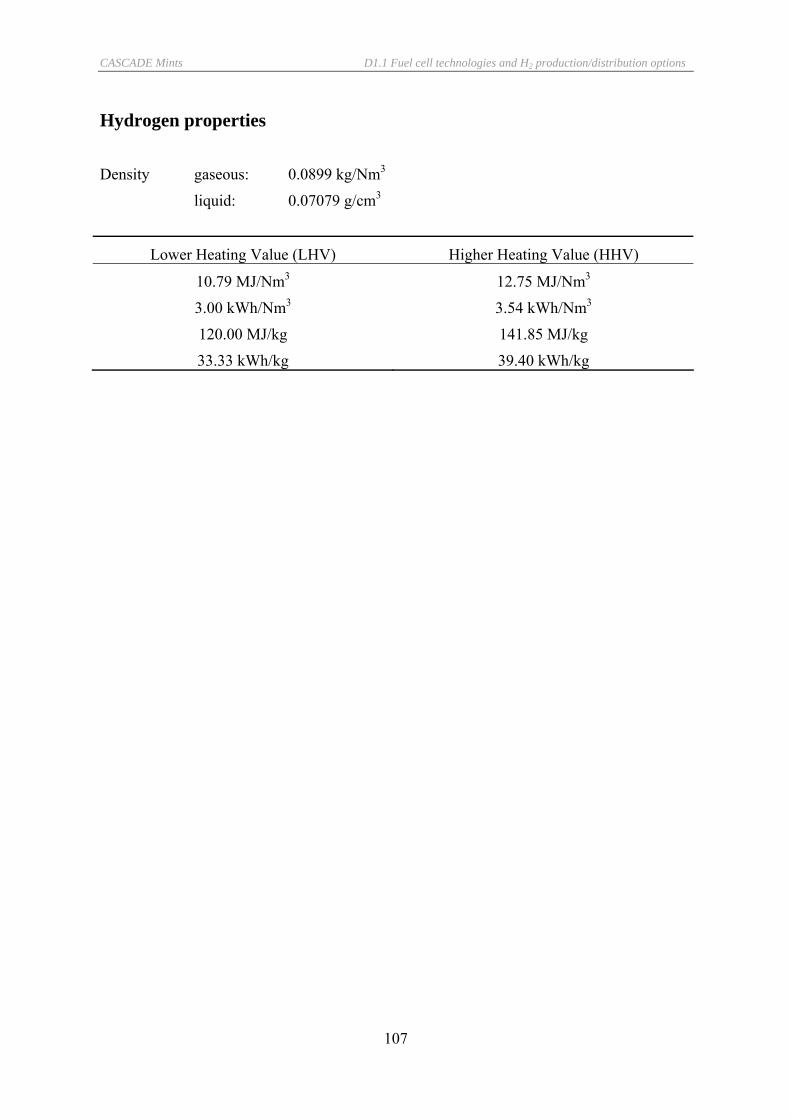
CASCADE Mints D1.1 Fuel cell technologies and H2 production/distribution options
107
Hydrogen properties
Density gaseous: 0.0899 kg/Nm3
liquid: 0.07079 g/cm3
Lower Heating Value (LHV) Higher Heating Value (HHV)
10.79 MJ/Nm3 12.75 MJ/Nm3
3.00 kWh/Nm3 3.54 kWh/Nm3
120.00 MJ/kg 141.85 MJ/kg
33.33 kWh/kg 39.40 kWh/kg