fs1 sodar performance validation …...fs1 sodar performance validation page 5 of 22 3 mast...
TRANSCRIPT

SODAR | RESOURCE MONITORING | NOISE MONITORING | CLOUD TRACKING Level 11, 75 Miller St, NORTH SYDNEY, NSW 2060, AUSTRALIA P +61 2 8456 7400 | F +61 2 9922 6645 | [email protected] | www.fulcrum3D.com
FS1M_1013_25_Performance_Validation_Mar_14.docx | March 14
FS1 SODAR PERFORMANCE VALIDATION – COMPLEX TERRAIN
FS1M_1013_25 Performance Validation
Date: 5 March 2014

FS1 SODAR PERFORMANCE VALIDATION
Document information Details
Client Internal
Title FS1 Sodar Performance Validation Mar 14
Filename P:\FULCRUM3D\F3D Performance Verification\Verification Results - F3D Internal\FS1M_1013\FS1M_1013_25_Performance_Validation_Mar_14.docx
Document No.
Rev. Date Description
A 05/03/2014 Initial Issue
Author, Review and Approvals
Prepared by: Hugh Sangster Signature:
Reviewed by: Colin Bonner Signature:
Approved by: Andrew Durran Signature:
Distribution
Fulcrum3D File P:\FULCRUM3D\F3D Performance Verification\Verification Results - F3D Internal\FS1M_1013\FS1M_1013_25_Performance_Validation_Mar_14.docx
Fulcrum3D Pty Limited ABN 73 151 086 510
Level 11, 75 Miller St
North Sydney NSW 2060
Tel: +61 2 8456 7400
Email: [email protected]
Web: www.fulcrum3d.com
© Fulcrum3D Pty Limited 2013. Copyright in the drawings, information and data recorded in this document (the Information) is the property of Fulcrum3D. This document and the Information are solely for the use of the authorised recipient and may not be used, copied or reproduced in whole or part for any purpose other than by the Client for the purpose which it was supplied by Fulcrum3D. Fulcrum3D makes no representation, undertakes no duty and accepts no responsibility to any third party who may use or rely upon this document or the Information.

FS1 SODAR PERFORMANCE VALIDATION
Contents
1 Introduction .................................................................................................................................. 4
2 Site Description ........................................................................................................................... 4
3 Mast Description .......................................................................................................................... 5 3.1 Installation details .............................................................................................................................. 5 3.2 Mast self-correlations ......................................................................................................................... 5 3.3 Mast data availability ......................................................................................................................... 7
4 Sodar Description........................................................................................................................ 8
4.1 Installation Details .............................................................................................................................. 8 4.2 Sodar data availability & SNR ............................................................................................................ 8 4.3 Sodar self-correlations ....................................................................................................................... 9
5 Analysis ...................................................................................................................................... 10
5.1 Comparison heights ......................................................................................................................... 10 5.2 Data Availability ............................................................................................................................... 10 5.3 Data count ....................................................................................................................................... 11 5.4 Horizontal wind speed validation ..................................................................................................... 11 5.5 Turbulence intensity ......................................................................................................................... 16 5.6 Wind Shear ...................................................................................................................................... 17 5.7 Horizontal wind direction .................................................................................................................. 18 5.8 Vertical wind flow ............................................................................................................................. 19
6 Conclusions ............................................................................................................................... 22
FS1 SODAR PERFORMANCE VALIDATION
Page 4 of 22
1 Introduction
A Fulcrum3D FS1 Sodar, FS1M1013, has been installed adjacent to 4 x well instrumented 80m met masts located in South Australia. Terrain at the location is complex and proximity of 4 masts to the sodar location means it is an appropriate choice as a Sodar validation location in complex terrain.
Data from the masts and sodar have been collected and placed through standard filtering processes. This validation aims to confirm the performance of the FS1 Sodar in complex terrain by confirming the accuracy of its measurements against an IEC compliant met mast.
2 Site Description
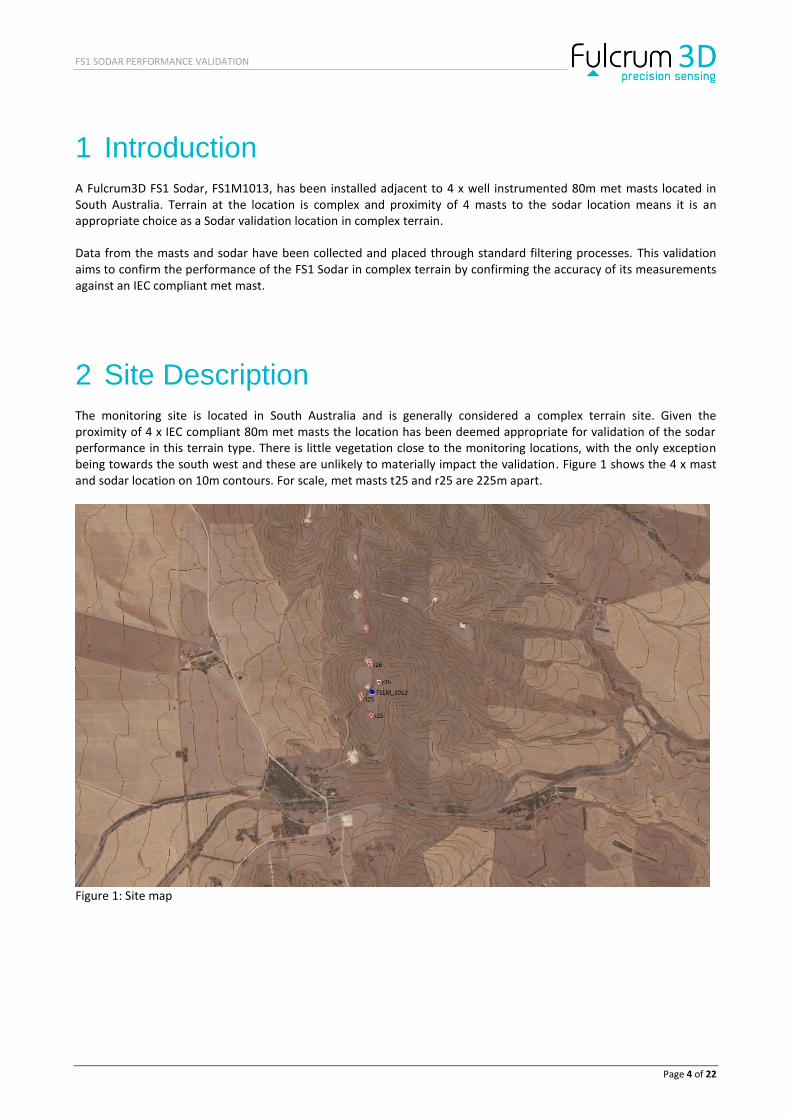
The monitoring site is located in South Australia and is generally considered a complex terrain site. Given the proximity of 4 x IEC compliant 80m met masts the location has been deemed appropriate for validation of the sodar performance in this terrain type. There is little vegetation close to the monitoring locations, with the only exception being towards the south west and these are unlikely to materially impact the validation. Figure 1 shows the 4 x mast and sodar location on 10m contours. For scale, met masts t25 and r25 are 225m apart.
Figure 1: Site map
FS1 SODAR PERFORMANCE VALIDATION
Page 5 of 22
3 Mast Description
3.1 Installation details
All 4 met masts have been installed for the purpose of power performance testing. They are 80m lattice masts and each are instrumented identically with instruments including cup and ultrasonic anemometers installed at a number of heights. Of note is that turbines are yet to be installed and therefore no wake impacts from these turbines need be considered. The configuration is identical on all 4 masts. Thies First Class Advanced instruments are installed at 79.5m, 77.9m, 52.4m and 25.4m. Thies First Class wind vanes are installed at ~76m and 25.4m. A USA 1 ultrasonic anemometer is installed at 77.9m. Thies Temperature, humidity and relative humidity are installed at ~75 m. An RM Young precipitation is also installed at ~6m. All mounting is fully IEC compliant based upon details provided in the mast installation report and all instrumentation has been fully calibrated.
The instruments were commissioned during June 2013 and have to our knowledge been well maintained. Met mast logger time stamps have been synchronized with the sodar and confirmed as end timestamps. The base heights of each mast range from 318m (r26) to 321m (t26) above sea level.
Mast data including calibration certificates has been provided to Fulcrum3D and anemometer calibrations applied to the data by Fulcrum3D. All data has been filtered to remove erroneous data, mainly mast flow distortion. Of note is that mast data availability is well below 100%, mainly due to mast shadow but also as a result of missing mast data.
3.2 Mast self-correlations
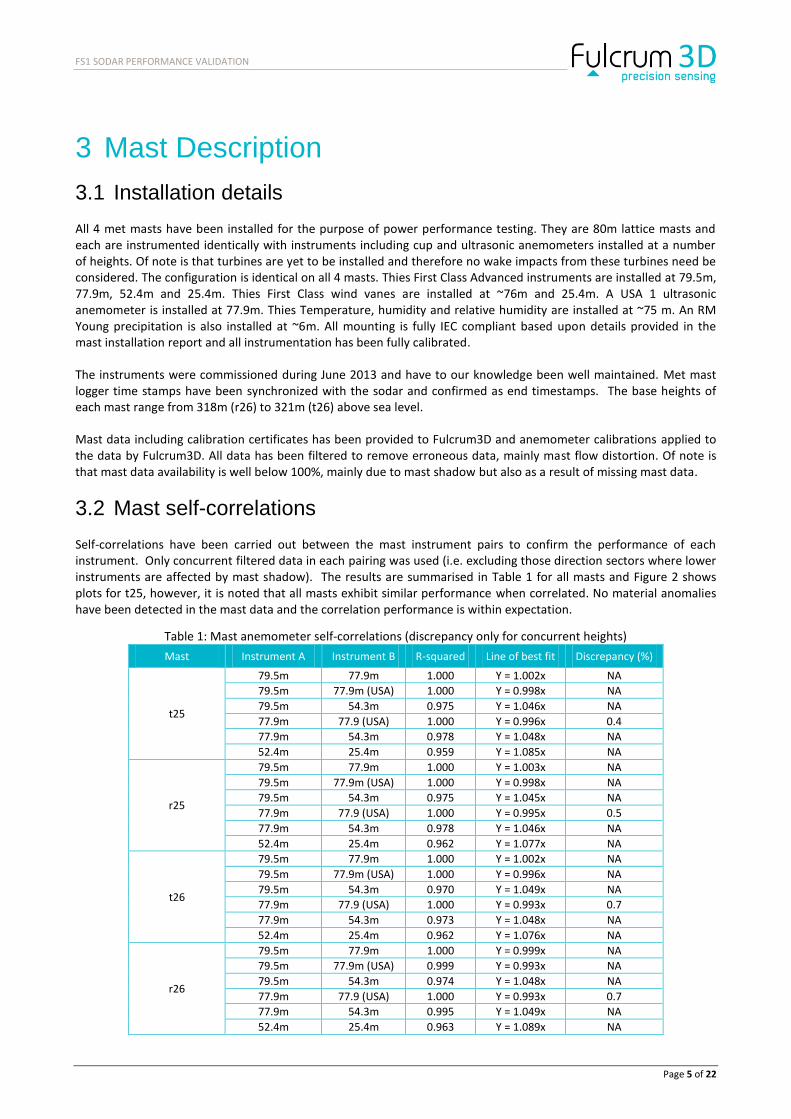
Self-correlations have been carried out between the mast instrument pairs to confirm the performance of each instrument. Only concurrent filtered data in each pairing was used (i.e. excluding those direction sectors where lower instruments are affected by mast shadow). The results are summarised in Table 1 for all masts and Figure 2 shows plots for t25, however, it is noted that all masts exhibit similar performance when correlated. No material anomalies have been detected in the mast data and the correlation performance is within expectation.
Table 1: Mast anemometer self-correlations (discrepancy only for concurrent heights)
Mast Instrument A Instrument B R-squared Line of best fit Discrepancy (%)
t25
79.5m 77.9m 1.000 Y = 1.002x NA
79.5m 77.9m (USA) 1.000 Y = 0.998x NA
79.5m 54.3m 0.975 Y = 1.046x NA
77.9m 77.9 (USA) 1.000 Y = 0.996x 0.4
77.9m 54.3m 0.978 Y = 1.048x NA
52.4m 25.4m 0.959 Y = 1.085x NA
r25
79.5m 77.9m 1.000 Y = 1.003x NA
79.5m 77.9m (USA) 1.000 Y = 0.998x NA
79.5m 54.3m 0.975 Y = 1.045x NA
77.9m 77.9 (USA) 1.000 Y = 0.995x 0.5
77.9m 54.3m 0.978 Y = 1.046x NA
52.4m 25.4m 0.962 Y = 1.077x NA
t26
79.5m 77.9m 1.000 Y = 1.002x NA
79.5m 77.9m (USA) 1.000 Y = 0.996x NA
79.5m 54.3m 0.970 Y = 1.049x NA
77.9m 77.9 (USA) 1.000 Y = 0.993x 0.7
77.9m 54.3m 0.973 Y = 1.048x NA
52.4m 25.4m 0.962 Y = 1.076x NA
r26
79.5m 77.9m 1.000 Y = 0.999x NA
79.5m 77.9m (USA) 0.999 Y = 0.993x NA
79.5m 54.3m 0.974 Y = 1.048x NA
77.9m 77.9 (USA) 1.000 Y = 0.993x 0.7
77.9m 54.3m 0.995 Y = 1.049x NA
52.4m 25.4m 0.963 Y = 1.089x NA

FS1 SODAR PERFORMANCE VALIDATION
Page 6 of 22
Figure 2: Sensor to sensor correlations for mast t25
FS1 SODAR PERFORMANCE VALIDATION
Page 7 of 22
3.3 Mast data availability
Data from the mast has been used from 10th
December 2013 – 5th
January 2014 which gives a reasonable coverage of data from all direction and wind speed bins and is therefore appropriate for validation of the sodar performance.
The mast booms are located at approximately 60 and 240 degrees depending on the instrument. Wind recovery plots indicated that the top cup anemometer (79.5m) is impacted from the mast in the range 345 – 15. All other cup anemometers are impacted in the range 225 to 255. The USA 1 instrument is shielded in the approximate range 40-70 degrees. All data within these ranges was removed from this analysis.
Removing this data (in combination with data already missing) does have the effect of reducing data availability of the 4 x mast to the range 84 - 93% at 79.5m and 68 – 91 % for the other anemometers (including the USA1). While lower heights of the met mast have reduced availability, these are not uniformly distributed with direction and accordingly could potentially introduce a bias (e.g. in extrapolating wind shear at the site). More detail on data availability can be seen in section 5.1.

FS1 SODAR PERFORMANCE VALIDATION
Page 8 of 22
4 Sodar Description
4.1 Installation Details
The Fulcrum3D FS1 sodar FS1M_1013 was deployed in the middle of the space between the 4 x masts as shown in Figure 3. It was set up oriented to magnetic north and leveled as per standard installation procedure. The unit was recording data in single beam mode and in 10m range bins from 40m – 150m above ground level in order to maximize overlap with the adjacent mast.
Figure 3: Mast and Sodar locations with aerial image (mast in red and sodar in blue)
The sodar was commissioned on the 10 Dec 2013 and no changes to sodar configuration have occurred during deployment. The sodar timestamp is automatically set to UTC+Offset based on the internet time protocol. The sodar base elevation is approximately 323m (a few meters higher than all 4 masts).
The data from the FS1 Sodar has been processed using V3.3 software and filtered according the standard Fulcrum3D FS1 filtering recommendations (see Appendix A). A manual check of the data was also carried out and a small number of erroneous/outlying data points were removed.
4.2 Sodar data availability & SNR
Sodar data availability varies from 80-90% for overlapping regions with the mast. In some instances, sodar data has higher availability than the mast (further detail in section 5.1). By adding up the number of records in each hour of the day during the entire deployment the range was found to be 152 to 178. The narrow range indicates excellent data capture throughout the day, minimising potential for diurnal bias to be present. More detail on data availability can be seen in section 5.1.
The average SNR for each FS1 Sodar range bin height is included in Figure 4 below. Of note is the general trend of the SNR to reduce with height, with the exception of the 40m range bin. Generally an SNR above 7 is deemed to be acceptable. In this case data from 40 – 150m is of acceptable SNR to indicate high data quality.

FS1 SODAR PERFORMANCE VALIDATION
Page 9 of 22
Figure 4: Average Sodar SNR by range bin height
4.3 Sodar self-correlations
Sodar self-correlations have been carried out between adjacent height range bins. As can be seen in Figure 5, data above 40m shows strong correlations, notwithstanding some useful data being available below the recommended data range. The coefficient of determinations (R
2) is within the range 0.952 to 0.974 indicating strong agreement
between the range bins on the FS1, again indicating high data quality.
Figure 5: Sodar to Sodar self-correlation scatter plots
FS1 SODAR PERFORMANCE VALIDATION
Page 10 of 22
5 Analysis
5.1 Comparison heights
Due to the proximity of measurements:
- the 79.5m mast height has been directly compared with the 80m Sodar range bin.
- the 77.9 ultrasonic mast height has been directly compared with the 80m Sodar range bin. In this case, it would be expected that the Sodar reads higher than the mast instrument.
- the 52.4m mast height has been directly compared with the 50m Sodar range bin.
For relevant aspects of this analysis (in particular the shear comparison) a concurrent data set has been produced. This includes only time stamps where all devices between 50m and 100m recorded valid data. This process has resulted in a lower availability for some aspect of the validation but is deemed appropriate for the purpose of the shear comparison.
5.2 Data Availability
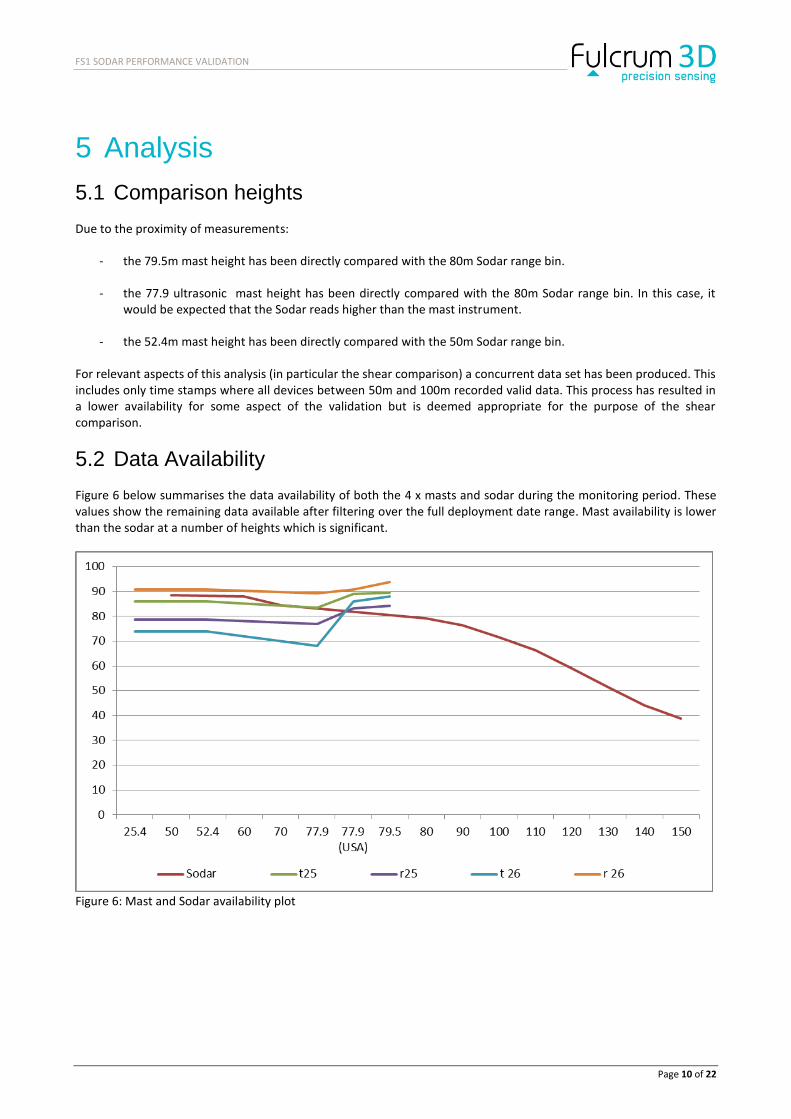
Figure 6 below summarises the data availability of both the 4 x masts and sodar during the monitoring period. These values show the remaining data available after filtering over the full deployment date range. Mast availability is lower than the sodar at a number of heights which is significant.
Figure 6: Mast and Sodar availability plot
FS1 SODAR PERFORMANCE VALIDATION
Page 11 of 22
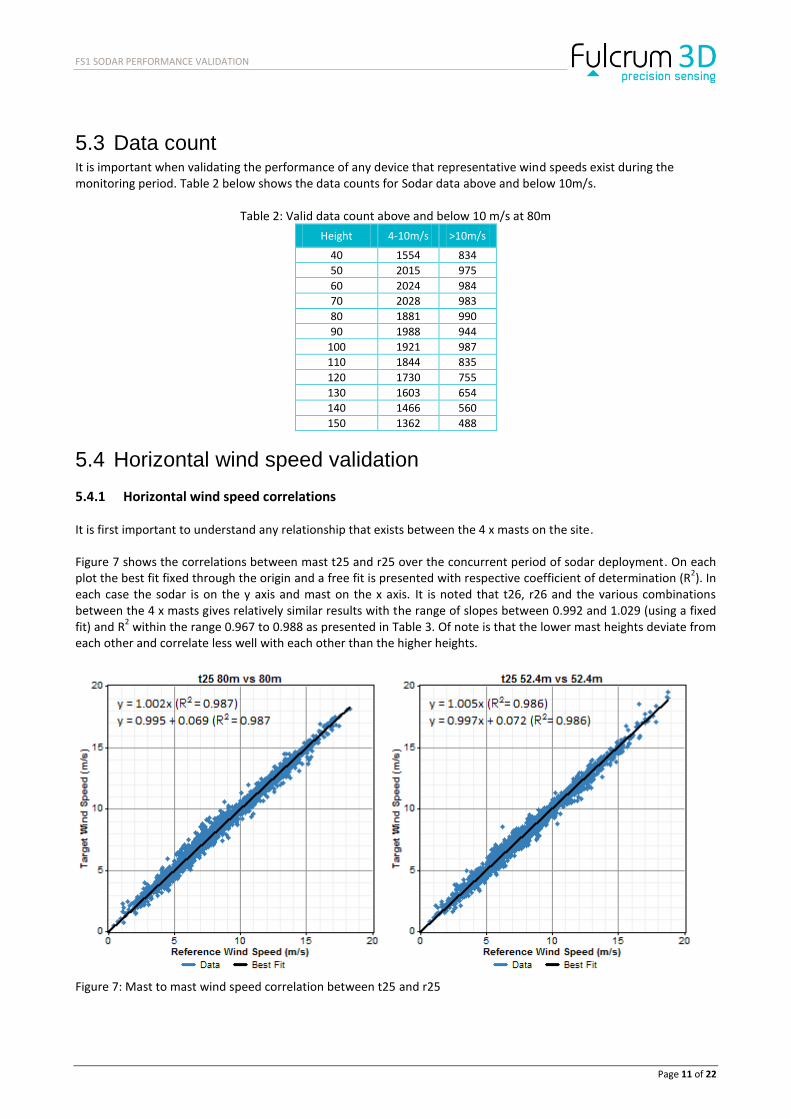
5.3 Data count It is important when validating the performance of any device that representative wind speeds exist during the monitoring period. Table 2 below shows the data counts for Sodar data above and below 10m/s.
Table 2: Valid data count above and below 10 m/s at 80m
Height 4-10m/s >10m/s
40 1554 834
50 2015 975
60 2024 984
70 2028 983
80 1881 990
90 1988 944
100 1921 987
110 1844 835
120 1730 755
130 1603 654
140 1466 560
150 1362 488
5.4 Horizontal wind speed validation
5.4.1 Horizontal wind speed correlations
It is first important to understand any relationship that exists between the 4 x masts on the site.
Figure 7 shows the correlations between mast t25 and r25 over the concurrent period of sodar deployment. On each plot the best fit fixed through the origin and a free fit is presented with respective coefficient of determination (R
2). In
each case the sodar is on the y axis and mast on the x axis. It is noted that t26, r26 and the various combinations between the 4 x masts gives relatively similar results with the range of slopes between 0.992 and 1.029 (using a fixed fit) and R
2 within the range 0.967 to 0.988 as presented in Table 3. Of note is that the lower mast heights deviate from
each other and correlate less well with each other than the higher heights.
Figure 7: Mast to mast wind speed correlation between t25 and r25
FS1 SODAR PERFORMANCE VALIDATION
Page 12 of 22
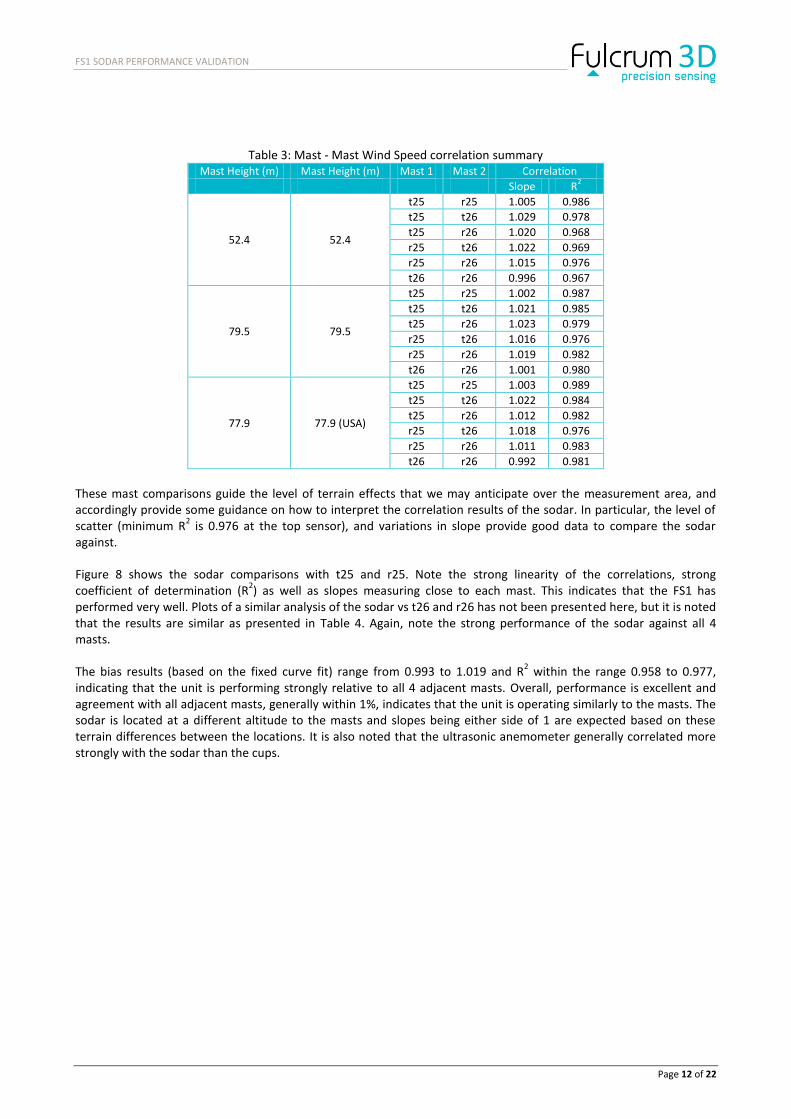
Table 3: Mast - Mast Wind Speed correlation summary
Mast Height (m) Mast Height (m) Mast 1 Mast 2 Correlation
Slope R2
52.4 52.4
t25 r25 1.005 0.986
t25 t26 1.029 0.978
t25 r26 1.020 0.968
r25 t26 1.022 0.969
r25 r26 1.015 0.976
t26 r26 0.996 0.967
79.5 79.5
t25 r25 1.002 0.987
t25 t26 1.021 0.985
t25 r26 1.023 0.979
r25 t26 1.016 0.976
r25 r26 1.019 0.982
t26 r26 1.001 0.980
77.9 77.9 (USA)
t25 r25 1.003 0.989
t25 t26 1.022 0.984
t25 r26 1.012 0.982
r25 t26 1.018 0.976
r25 r26 1.011 0.983
t26 r26 0.992 0.981
These mast comparisons guide the level of terrain effects that we may anticipate over the measurement area, and accordingly provide some guidance on how to interpret the correlation results of the sodar. In particular, the level of scatter (minimum R
2 is 0.976 at the top sensor), and variations in slope provide good data to compare the sodar
against.
Figure 8 shows the sodar comparisons with t25 and r25. Note the strong linearity of the correlations, strong coefficient of determination (R
2) as well as slopes measuring close to each mast. This indicates that the FS1 has
performed very well. Plots of a similar analysis of the sodar vs t26 and r26 has not been presented here, but it is noted that the results are similar as presented in Table 4. Again, note the strong performance of the sodar against all 4 masts.
The bias results (based on the fixed curve fit) range from 0.993 to 1.019 and R2 within the range 0.958 to 0.977,
indicating that the unit is performing strongly relative to all 4 adjacent masts. Overall, performance is excellent and agreement with all adjacent masts, generally within 1%, indicates that the unit is operating similarly to the masts. The sodar is located at a different altitude to the masts and slopes being either side of 1 are expected based on these terrain differences between the locations. It is also noted that the ultrasonic anemometer generally correlated more strongly with the sodar than the cups.

FS1 SODAR PERFORMANCE VALIDATION
Page 13 of 22
Figure 8: Sodar to mast cup anemometer correlations for t25 and r25
Table 4: Sodar - Mast Wind Speed correlation summary Sodar Height (m) Mast Height (m) Mast Correlation
Slope R2
50 52.4
t25 0.993 0.966
r25 0.998 0.967
t26 1.019 0.960
r26 1.012 0.969
80 79.5
t25 0.996 0.970
r25 0.999 0.969
t26 1.017 0.964
r26 1.017 0.976
80 77.9 (USA)
t25 0.997 0.973
r25 1.000 0.972
t26 1.018 0.964
r26 1.009 0.977

FS1 SODAR PERFORMANCE VALIDATION
Page 14 of 22
5.4.2 Horizontal wind speed distributions
When validating the performance of the sodar it is important to consider what similarity exists in the wind speed distributions between the mast and sodar. Figure 9 shows these distributions at 80m for t25, r25 and the sodar. This includes all timestamps (ie not necessarily concurrent time stamps) of both the sodar and mast, indicating strong agreement. Considering that the mast and sodar could have different availabilities, agreement is strong and indicates little evidence of bias as a result of availability differences between the mast and sodar. It is noted that t26 and r26 exhibit similar trends compared to the values presented in Figure 9 but have not been included here.
Figure 9: Wind speed distributions at 80m for t25, r25 and sodar
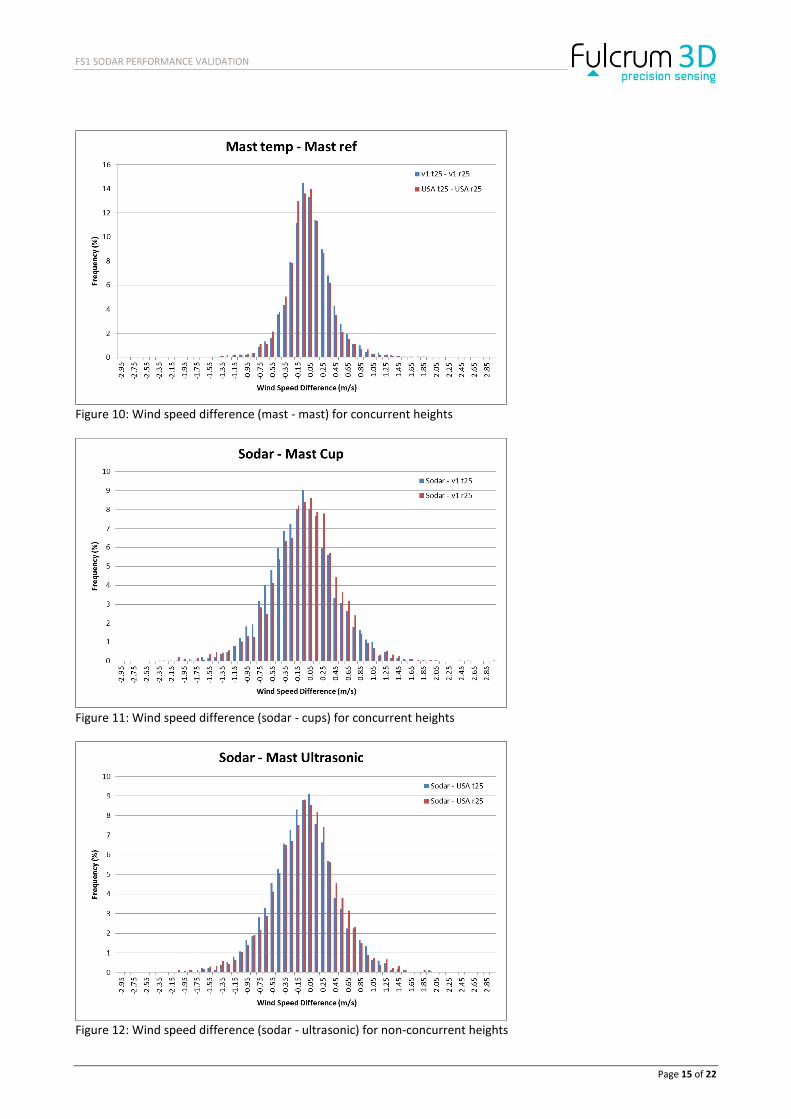
5.4.3 Horizontal wind speed differences
Another measure of spread in the wind speed data is to look at the distribution of the difference between two sources of wind data. Figure 10 shows mast – mast wind speed measurements for t25 and r25. It is clear that there is some difference between the 2 x mast locations. Figure 11 demonstrates the difference between the mast and sodar using cup anemometry from the mast. You can see that bias is low and the spread is also low indicating strong performance of the sodar relative to the mast. Figure 12 also shows sodar – mast but using the USA 1 as the reference. Spread and bias in the data is also low, again indicating good sodar performance. Each of these plots are data at ~80m.
FS1 SODAR PERFORMANCE VALIDATION
Page 15 of 22
Figure 10: Wind speed difference (mast - mast) for concurrent heights
Figure 11: Wind speed difference (sodar - cups) for concurrent heights
Figure 12: Wind speed difference (sodar - ultrasonic) for non-concurrent heights

FS1 SODAR PERFORMANCE VALIDATION
Page 16 of 22
5.5 Turbulence intensity
Wind speed standard deviation and turbulence intensity are related and important on a wind farm site. Figure 13 shows correlation plots of sodar vs mast (both cup and ultrasonic anemometers) wind speed standard deviation. There is a clear correlation evident.
These wind speed standard deviation measurement have been used in Figure 14 to apply the IEC 61400-1 3rd
edition. Again, there is relative agreement between the FS1 and reference mast indicating that the FS1 wind speed standard deviation is a useful quantity.
Figure 13: Correlation plots between 80m sodar and 79.5m mast cup (right) and 77.9m ultrasonic (left) wind speed standard deviation
Figure 14: Representative Turbulence from Sodar and Mast relative to IEC standard 61400-1 3rd edition

FS1 SODAR PERFORMANCE VALIDATION
Page 17 of 22
5.6 Wind Shear
Understanding wind speed with height is important for many aspects of the wind farm process. Concurrent data between 50m and 100m for all devices has been used to calculate shear. Figure 15 shows wind shear at the site as measured by t25 and the sodar and Figure 16 shows the shear as measured by r25 and the sodar. In each case a best fit curve has been included and a close agreement can be seen in all cases. It is noted that similar relationships occur with t26 and r26 masts but have not been included here.
Figure 15: Wind shear plot for t25 vs sodar
Figure 16: Wind shear plot for r25 vs sodar
Additionally, the shear exponent has been calculated and is shown in Table 5. At this site, the mast and sodar give almost identical values within the overlapping region indicating excellent performance by the sodar. It is noted that a similar outcome occurs when comparing with t26 and r26.
Table 5: Shear exponent for mast and sodar
Shear Mast (25.4-79.5) Sodar (50-100m)
t25 0.10 0.09
r25 0.09 0.08

FS1 SODAR PERFORMANCE VALIDATION
Page 18 of 22
5.7 Horizontal wind direction
Figure 17 shows the wind direction correlation between mast and mast and sodar and mast at 80m. In each case, strong agreement is evident, as demonstrated with R
2 of 0.994 and strong linearity. This metric again indicates
excellent FS1 sodar performance against adjacent masts. It is noted that similar performance is evident against masts t26 and r26 but these values have not been presented here.
Figure 17: Wind direction correlation plots (only wind speed above 5m/s)

FS1 SODAR PERFORMANCE VALIDATION
Page 19 of 22
5.8 Vertical wind flow
One of the key benefits of the FS1 sodar is that it can measure inflow angles. Each mast is equipped with a USA 1 ultrasonic anemometer at 77.9m. Given the complexity of the site it could be expected that a high inflow angles might be possible. Additionally, given that the sodar and mast are at different locations, conditions could vary considerably between the locations.
Figure 18 shows inflow angle as a function of horizontal wind speed. It demonstrates that the mast vertical inflow angle measurements and FS1 measurements generally agree.
Figure 19 displays a sinusoidal feature in the vertical wind speed data from t25. This is likely to be as a result of installation tilt but could be a real site feature.
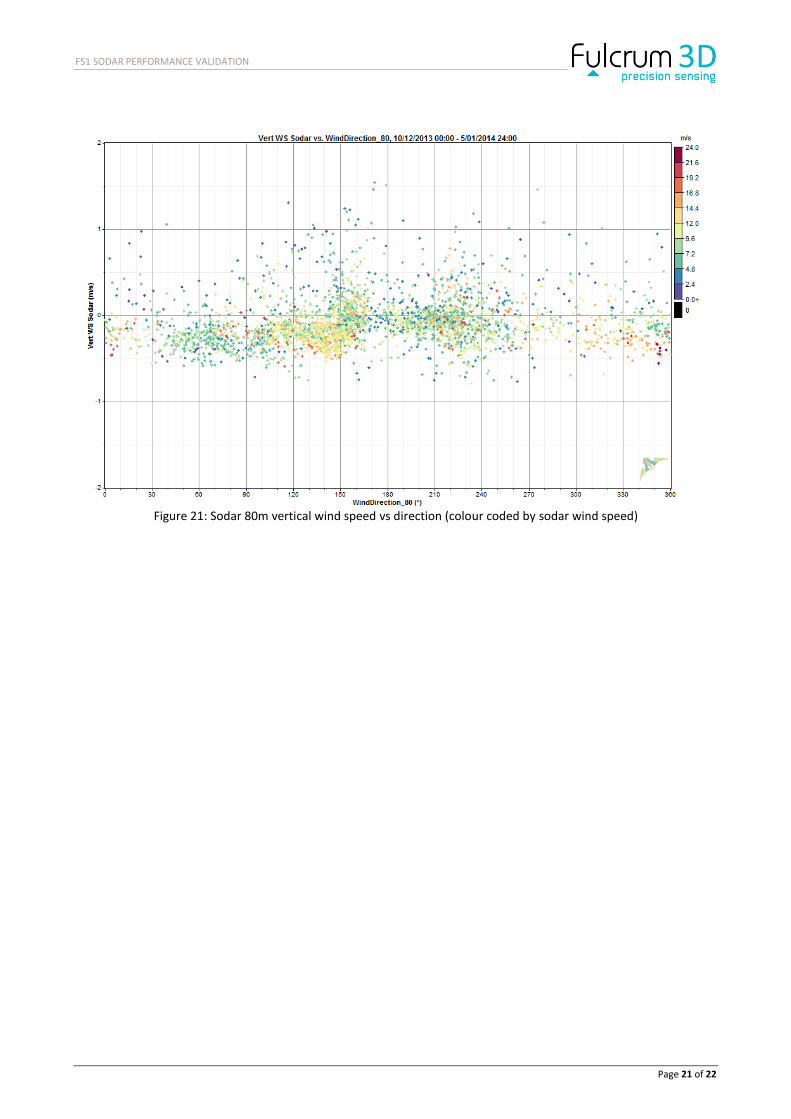
Figure 20 shows the inflow angles vs direction for the r25 mast which agrees more closely with the sodar data as presented in Figure 21.
Whilst this assessment is not conclusive in determining performance of the sodar or the mast for inflow angle measurements, the sodar and r25 agree more closely indicating that they are more likely to be performing correctly and t25 is being influenced by some other effect, possibly installation tilt on the ultrasonic anemometer or a real site effect.
Figure 18: Mean inflow angle as a function of wind speed (blue is sodar, orange is mast t25 and green is mast r25)

FS1 SODAR PERFORMANCE VALIDATION
Page 20 of 22
Figure 19: t25 USA 1 vertical wind speed vs direction (colour coded by USA 1 wind speed)
Figure 20: r25 USA 1 vertical wind speed vs direction (colour coded by USA 1 wind speed)
FS1 SODAR PERFORMANCE VALIDATION
Page 21 of 22
Figure 21: Sodar 80m vertical wind speed vs direction (colour coded by sodar wind speed)

FS1 SODAR PERFORMANCE VALIDATION
Page 22 of 22
6 Conclusions
A Fulcrum3D FS1 sodar has been placed adjacent to 4 x 80m tall masts in South Australia for the purpose of validating sodar performance against an adjacent met mast. The density of masts and that the mast is well instrumented and consistent with IEC recommendations makes it appropriate for validation of the sodar performance in complex terrain.
A number of standard processes have been followed to assess the sodar performance against cup anemometry and ultrasonic anemometry. The key outcomes of the validation are summarized below:
1. Acceptable wind data availability compared to the masts has been demonstrated from the sodar in the range 40m to 150m.
2. Horizontal wind speed correlations at concurrent heights between the masts indicate coefficients of determination (R
2) in the range 0.967 and 0.988. Slopes have been measured of between 0.992 and 1.029.
3. Horizontal wind speed correlations at concurrent heights between the sodar and masts indicate coefficients of determination (R
2) in the range 0.960 to 0.977. Slopes have been measured between 0.996 and 1.019. The
Ultrasonic anemometers generally correlated more strongly with the sodar than the cup anemometers.
4. The sodar generally measures horizontal wind speed within 1% of the 4 x adjacent masts (when taking into account differences between the masts), indicating excellent agreement. Further, the range of correlation slopes is narrower between the sodar and the masts vs. that between each of the masts. This indicates much of the correlation slope difference is due to real wind speed differences at the various measurement locations (give that the sodar is at the midpoint of the 4 mast locations).
5. Horizontal wind speed distributions at concurrent heights agree closely between the mast and sodar.
6. Horizontal wind speed difference histograms between the sodar and mast show a low degree of spread and no discernible bias in the data.
7. A strong relationship exists between the masts and sodar when measuring wind speed standard deviation and turbulence intensity. The mast and sodar produced very similar turbulence intensity classification results when assessed using IEC 61400-1 3
rd edition indicating usefulness of the FS1 wind speed standard deviation
measurement.
8. Wind shear curves agree extremely closely and shear exponents are almost equal for both masts and sodar (0.10 vs 0.09 and 0.09 vs 0.08 respectively) over concurrent heights indicating strong agreement between the two sources.
9. Wind direction at concurrent heights agrees strongly as shown by the coefficient of determinations (R2) of
0.994.
10. The FS1 sodar produces vertical wind speed and inflow angle data that looks to match expectations of the site and broadly matches adjacent masts.
These results are excellent for a site showing this level of terrain complexity, with correlation results very close to the level expected of flat terrain sites.
Based on this validation process the performance of the Fulcrum3D FS1 sodar is excellent over the height range 40 – 150m and is comparable to the adjacent IEC compliant met masts in complex terrain.