from the marine research laboratory …. 2 the contributions from the marine research laboratory...
TRANSCRIPT

Vol. 2
THE CONTRIBUTIONS FROM THE
MARINE RESEARCH LABORATORY
HYDROGRAPHIC OFFICE OF JAPAN
JULY 1960 No. 1
GEOMAGNETIC SURVEYS ON SEA BY AIRCRAFT AND SHIP*
Yoshio Kato**, Shinkichi Utashiro, Masayuki Matuot,
Akio Takagit, Makoto Terajimat and Miyoshi Itot
Received June 10, 1960
Abstract
In accordance with the resolution adopted at· the X~th General Assembly of I~ U. G. G., 1957, the program of magnetic surveys on sea has been progressed fa Japan.
For the aeromagnetic survey on sea, an airborne magnetometer with saturable inductor was developed by the Tohoku University team of the writers, and was put to practical surveys in Boso-district in February, 1958, around 0 Sima Island (Izu) area in July, 1958,. and in the Izu Syoto (Islands) in August, 1959. The results of the fi1:st and second surveys were reported previously. The third survey was carreid out by "Beachcraft No. 502" of the Maritime Safety Board, with flight elevation of 3000 m above the sea level, measuring the vertical component of the earth's magnetic field to clarify that the most remarkable anomaly was associated with volcanoes on the Izu Syoto.
For the magnetic survey at sea surface, a shipborne magnetometer, designed by the Tohoku University team of the writers, was employed on a survey ship Takuyo of the Hydrographic Office around the Sagami Nada near Izu Hanto (Pe-ninsula), in January, 1960. .
The heart of this magnetometer is a saturable · inductor mounted on a girilbal system. In order to avoid the magnetic disturbance by the vessel, the instrument was hung at about 40-meter depth beneath her body. From results of the survey, two remarkable anomalies were observed around Ito and Okinoyama, respectively. It is found that the anomalous anomaly Near Ito is associated with submarine volcanoes, and the· anomaly around Okinoyama belongs to the submarine topogi·aphic configuration.
We also studied the magnetism of a steel vessel. In this paper, the general feature of magnetic fields around an iron ship is investigated, especially, from the
* This paper was read at the Meetings of the Geodetic Society of Japan on September, 1959, and on May, 1960. ** Tohoku Univ;ersity and the Hydrographic Office. t Tohoku University.
I'

•'
2 KATO, UTASHIRO ET AL.
standpoint of detecting it magnetically. Magnetic moment of the steel vessel Takuyo was obtained from the results of magnetic survey around her body by assuming the vessel as a uniformly magnetized prolate spheroid.
Introduction
In order to investigate the terrestdal magnetism and to promote the safety of navigation ·the magnetic survey over all Japan has been carried
out on land by the· Hydro graphic Office since 1912. The magnetic survey on
sea was difficult, because we could not build non-magnetic vessel and in..: strument measuring the earth's magnetic field at sea. Therefore, we could
not prepare the real magnetic chart for sea area.
The aeroinagnetic survey has been developed recently in U. S. A; at first,
total intensity was observed in north-eastern Umnak, Alaska, and afterwards, extensive surveys were made in some parts of the main land of U. S. A.,
Alaska, Canada, Mexico, and the Pacific Ocean. The magnetic survey at sea was carried out from 1912 to 1927 by a
non-magnetic vessel Carnegie designed in U. S. A.
At the XIth General Assembly of the International Union of Geodesy and Geophysics held at Toront, Canada, 1957, the cooperation of the world magnetic survey, especially on sea, was proposed and adopted. At present, magnetic surveys on sea are bei:µg carried out by a non-magnetic survey
vessel Zaya of U. S. S. R., and by the aircraft "R5D" with the NOL Vector
Airborne Magtetometer by U. S. A. In Japan, after the resolution adopted at the Toront Assembly, the
program of magnetic survey on sea has been progressed by the World
Magnetic Survey Committee of the Science Council of Japan, and the Hydrographic Office has planned the schedules of aeromagnetic survey on the
adjacent seas of Japan. Following this plan, the aeromagnetic surveys were
carried out on Boso-district, around 0 Sima Island (Izu) area and the Izu Syoto (Islands) by the cooperation of the Hydrographic Office and Tohoku
University. Thus, the first magnetic chart for sea in Japan. was prepared. The results of these surveys were reported partly in the previous pa:pers
(Kato, Matuo et al. 1958, 1959), and the result of the survey on the Izu Syoto is discussed in detail in the present paper(Part I).
Magnetic survey at sea surface was held on the survey ship Takuyo
(771 tons) of the Hydrographic Office in Sagami Nada. The instrument
employed in this survey is a latest type of shipborne magnetometer equipped
with a saturable inductor, electronic oscillators, amplifiers, recorder and
gimbal. The instrument was produced by the Tohoku University team of the writers. From the results of survey two remarkable anomalies were fou~d near Ito and Okinoyama, and several interesting facts were also discovered
(Part II).

! . \
GEOMAGNETIC SURVEY ON SEA 3
We measured a magnetic field around Takuyo with the shipborne magneto
meter (Part III).
Part I
Magnetic survey on sea by means of an airborne· magnetometer
1. Planning. The first magnetic survey was held on Boso-district in February, 1958,
and the second around 0 Sima Island area in July of the same year. Fror,n
the results of these surveys, it was clarified that there were remarkable
anomalies near Ito, and that they were associated with a volcano.. The third survey was carried out on the Izu Syoto in August, 1959. The Izu Syoto are
composed of a number of volcanic islands including active, dornant, and
extinct quaternary volcanoes.
2. Instrument. · The airborne magnetometer to measure a vertical intens"ity of the earth's
magnetic field consists of a detecting mechanism, electoronic oscillators amplifiers, recorder, gimbal system and a vertical gyroscope. The heart of
the airborne magnetometer is a saturable inductor. This inductor consists
of a core of easily saturable ferromagnetic material of high permeability (a very thin strip of permalloy) with an external winding coil to 'which is
applied an alternating current by means of electronic oscillator .. By a coaxially
wound secondary c_oil around the saturable core, vertical intensity of the ·
earth's magnetic field is measured. Because the saturable core inductor can measure the external field parallel to its axis, it can be used to measure the
vertical component of the earth's magnetic field by setting an axis of saturable
core parallel to the vertical direction. In our instrument, attempts have been made to use a vertical gyroscope to orient the detector so as to measure the
vertical component in a~rcra~t. The gyroscope determines the true vertical
in a mo:ving vehicle. This system in aircraft can keep the vertical within the accuracy of about 10 minutes of arc, when the' aircraft flies at high altitude
of about 3000 meters in smooth air. The airborne magnetometer enabled us to make measurements of vertical
component quite easily, and instrumental error never exceeded 50 r which assured sufficient 'accuracy for the survey on sea. The detail on this airborne
magnetometer is shown in the .following.
If an external magnetic field Z, which we must measure, is applied to
the core, the field is increased during one half of the cycle and decreased during the other half.
Then, the amplitude of the wave form of flux density becomes asymmetry,
because so called B-H curve of the ferro-magnetic core has a character of
/
4 KATO, UT ASHIRO ET AL.
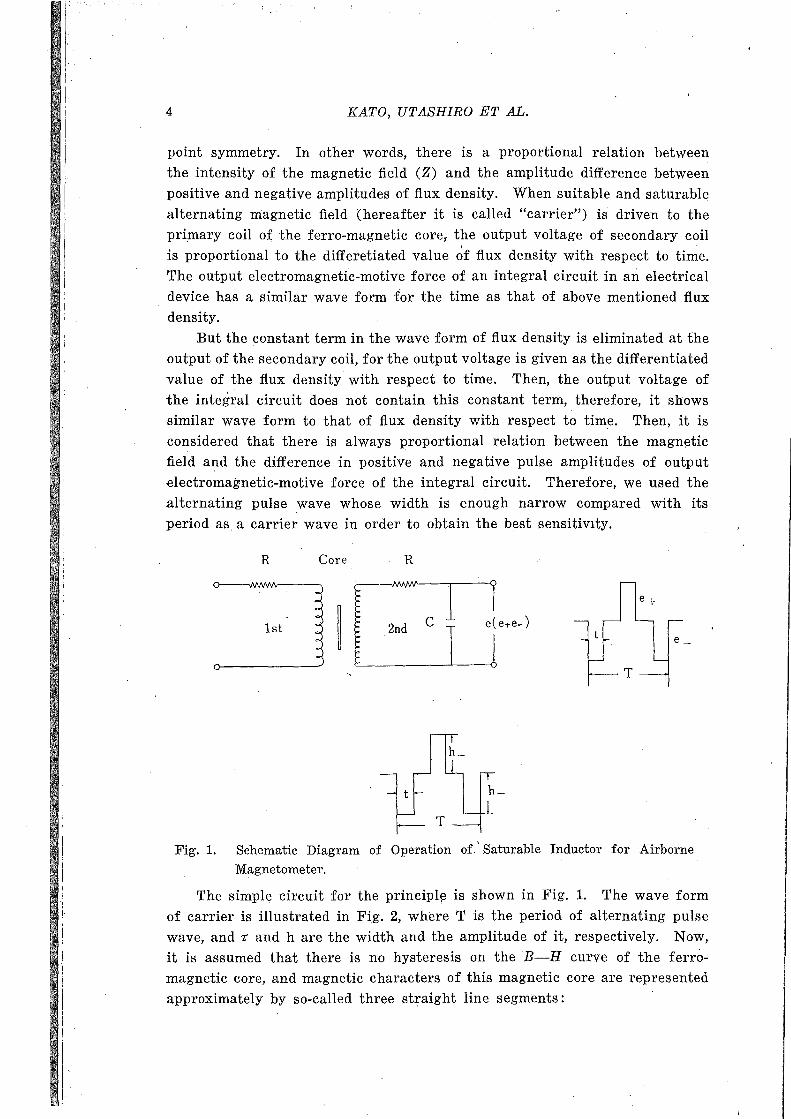
point symmetry. In other words, there is a proportional relation between
the intensity of the magnetic field (Z) and the amplitude difference between
positive and negative amplitudes of flux density. When suitable and saturable alternating magnetic field (hereafter it is called "carrier") is driven to the
primary coil of the ferro-magnetic core, the output voltage of secondary coil
is proportional to the differetiated value ~f flux density with respect to time. The output electromagnetic-motive force of an integral circuit in an electrical
device has a similar wave form for the time as that of above mentioned flux density.
But the constant term in the wave form of flux density is eliminated at the
output of the secondary coil, for the output voltage is given as the differentiated
value of the flux density with respect to time. Then, the output voltage of
the integral circuit does not contain this constant term, therefore, it shows similar wave form to that of flux density with respect to time. Then, it is
considered that there is always proportional relation between the magnetic field and the difference in positive and negative pulse amplitudes of output
electromagnetic-motive force of the integral circuit. Therefore, we used the
alternating pulse _wave whose width is enough narrow compared with its period as. a carrier wave in order to obtain the best sensitivity.
R Core R
t e ~~ o------
~ 2nd C e(e+e-)
T
t
T
Fig. 1. Schematic Diagram of Operation of' Saturable Inductor for Airborne
Magnetometer.
The simple circuit for the principle is shown in Fig. 1. The wave form
of carrier is illustrated in Fig. 2, where T is the period of alternating pulse
wave, and r and h are the width and the amplitude of it, respectively. Now, it is assumed that there is no hysteresis on the B-H curve of the ferromagnetic core, and magnetic characters of this magnetic core are represented
approximately by so-called three straight line segments:

' ' '
i I l
J
where
aoCR) 1 µ
Bm
GEOMAGNETIC SURVEY ON SEA
B=µH for
B=±Bm for
I BI <B,,., I BI :2::Bm,
is the . condition of integral circuit,
is the effective permeability,
is the flux density at saturation,
"-·:, ,--
5
Hm is the minimum field intensity which gives the saturate flux
density CBm) in t.he core,
~(e+ • e-)
s N k
is the output voltage of integral circuit,
is the effective area of the core, is t.he total turns of secondary coil, and
is 10-s SNICR volt.
In Fig. 2 are illustrated the general characteristics of the vlave form of
the flux density and the output voltage of an R-C integrator, when the carrier
of pulse wave, by which the flux density produced in the ferromagnetic core ' ' '
becomes at saturation, is driven to the core and when an external .magnetic
field (L1H) is superposed on it.
As shown in Fig. 2, the change
of flux density with respect to time
is expressed as follows. If we take the line X-Y as the time axis;
Cl)
BCB+B-)=Bo+'LB,.(naot+cpn), 0
it follows that
I B+ l:'-1B-1=2 µI LlH I,
kBo=k ~ J; Bdt
The difference of two amplitudes of positive and negative in the output
voltage of integral circuit becomes
I e+ 1-1 e-1=2kµ(l-2r/T) I LlHI,
then
I e+ 1-1e-1· .2 kµ I LlHI where 2r/T<1. This expression shows that
the alternating pulse wave, whose width is narrow enough in com
parison with its period, should be
given. as a carrier wave.
The value of 2r/T may be taken
B
t
' ' kB e
JJ
B
Fig. 2. B-H Curves of Ferro-Magnetic
Core.
1. '

I'
'. I
6 KATO, U.TASHIRO ET AL.
practically,
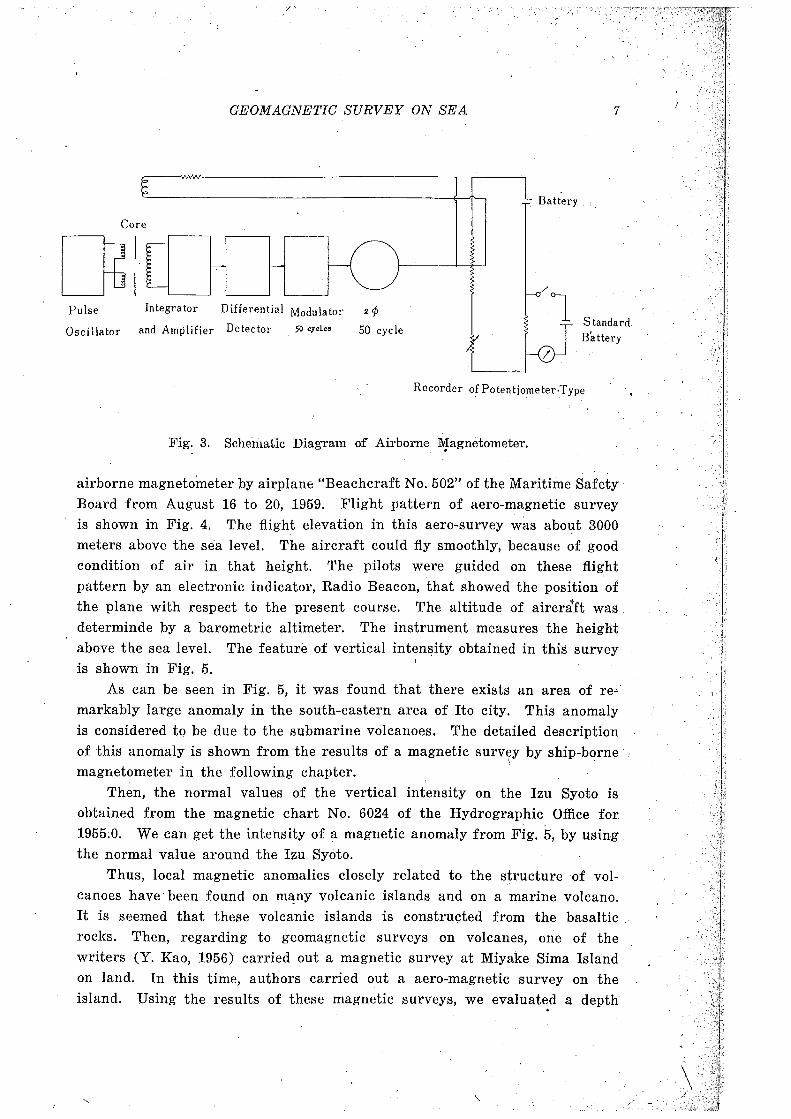
2-r/T' .1/10. The block diagram of the special type variometer is illustrated in Fig. 3.
In this variometer, two· essentially identical ferromagnetic cores are fixed
geometrically in parallel each other and the external winding connected differentially in order to eliminated odd harmonics of fundamental frequen
cy and to improve the moduration in the magnetic detecter. Even when
there was no external magnetic field, the unnecessary Ol\tputs voltage would
be generated by the unbalances in the amplitude and in the phase of these cores.
It is clear that the unnecessary output voltage generated by the amplitude
unballance at outputs of external windings of these two cores must be taken
much larger than by the phase difference. The pri:rp.ary and secondary coils
are wound around the ferro-magnetic core whose diameter is 1 mm and length is 10 cm.
The ferro-magnetic core consists of a strip of Mo-permalloy of 0.005 cm
thick and 0.5 cm wide. The strip is rolled into a. tubular form about 0.1 cm in diameter and 10 cm in length.
The eddy-current losses in the core become significant when the driven frequencies of the pulse become to about i kc. In order t~ feed the driving current to ·the primary coil, the pulse oscillator of the 120 cycles is used.
The output voltage of the magnetic detector is transferred to the integral circuit and then the integrated voltage is amplified by the amplifier in the
next stage.
In the differential detector, the output voltage of the amplifier is converted to direct current which is proportional to the difference in positive and
negative pulse amplitudes. The output of the differential detector is .translated into an. alternating voltage of 50 cycles by an additional modulator which
drives a servomoter only when the difference in positive a,nd negative pulse amplitudes exists. In other words, the servomoter, by which the contact
brush of the potentiometer is moved, can not be driven by the output of modulator when there is no signal in the system.
A part of the voltage in the potentiometer is fed back to the compensating coil, as shown in Fig. 3, then the external magnetic field ( L1 H) and the
ma~netic field generated by the current which follows through the compen
sating coil are always canceled each other autmatically by this servomoter. And, the intensity of the external magnetic field can be recorded visually
on the recording paper by the recording pen which is moved autmatically in
connection with the contact brush of the potentiometer.
3. Magnetic. survey. The third aero-magnetic survey was carr:led out on the Izu Syoto with the
/'
GEOMAGNETIC SURVEY ON SEA
Core
Pulse Integrator Differential Modulator 2¢
Oscillator and Amplifier Detector So cycles 50 cycle
Battery
Standard Battery
Recorder of Potentiometer-Type
Fig. 3. Schematic Diagram of Airborne ~agnetometer.
airborne magnetometer by airplane "Beachcraft No. 502" of the Maritime Safety Board from August 16 to 20, 1959. Flight pattern of aero-magnetic survey
is shown in Fig. 4. The flight elevation in this aero-survey was abo~1t 3000
meters above the sea level. The aircraft could fly smoothly, because of good
condition of air in that height. The pilots were guided on these flight
pattern by an electronic indicator, Radio Beacon, that showed the position of the plane with respect to the present course. The altitude of aircr~ft was
determinde by a barometric altimeter. The instrument measures the height above the sea level. The feature of vertical inten~ity obtained in this survey is shown in Fig. 5.
As can be seen in Fig. 5, it was found that there exists an area of re~
markably large anomaly in the south-eastern area of Ito city. This anomaly
is considered to be due to the submarine volcanoes. The detailed description of this anomaly is shown from the results of a magnetic survey by ship-borne
\ .
magr1etometer in the following chapter. I
Then, the normal values of the vertical intensity on the Izu Syoto is obtained from the magnetic chart No. 6024 of the Hydrographic Office for 1955.0. We can get the intensity of a magnetic anomaly from Fig. 5, by using
the normal value around the Izu Syoto.
Thus, local magnetic anomalies closely related to the structure of vol
canoes have· been found on m~ny volcanic islands and on a marine volcano.
It is seemed that these volcanic islands is constructed from the basaltic rocks. Then, regarding to geomagnetic surveys on volcanes, one of the writers (Y. Kao, 1956) carried out a magnetic survey at Miyake Sima Island
on land. In this time, authors carried out a aero-magnetic survey on the
island. Using the results of these magnetic surveys, we evaluated a depth
''.
l I

i: I I
I:
1: '' ! !
,,
8 KATO, UTASHIJ?,O ,ET AL.
I c I
I Izu Peninsula I
I I
\
\
ih 0 Sima '-1--J \
ITo Sima I Q ·,
. I \
. I a Nii Sima Sikine . Sima '1- \ .
0. I A Kozu Sima \
Boso Peninsula
Sima : (;\Miyake 1--_,__,__,__,__,__,_-1-_,__,_~_,__,_~~--:-_,__,__,_~~--f 34oN
I \
D
() Mikura Sima
\
\
\ \
\
Hatizyo
\ \ \
I
B
Fig. 4. Flight Pattern of Aeromagnetic Survey.

O> 11) O> ,.....
.,I
"' :::i b/J :::i
<t: ..<:: ..... co ,.....
"' .§ U)
<l "' 0 p..,
"' .§ U)
I I
I
I.
Fig. 5.
I I
I
GEOMAGNE'l'IC SURVEY ON SEA
Southern Point
Northern Point
O> 11) O'> ,.....
.,I
"' :::i b/J :::i
<t: -:5 O> ,.....
Southern Point
.Northern Point
Southern Point
I
1 1 I
I
N .~ <l ."':::
"' 0 p..,
0
I I
u
Results of Aeromagnetic Survey in Izu Syoto Area.
·',1
/,
"' .§ . _,· U)
·~
z

10 KATO, UTASHIRO ET AL.
of dipole on Miyake Sima to conclude that the depth is about 5 km.
In future, the aero-magnetic survey over all adjacent seas of Japan will
be held by the Hydrographic Office forming a link in the chain of the program
of the world magnetic survey of I. U. G. G.
Part II
Magnetic surveying at sea by means of ship-borne magnetometer
1. Planning. It has been established that the magnetic survey by means of a ship
borne magnetometer at sea is very useful to investigate marine volcanoes and
magnetic anomaly at sea. It is clear that local magnetic anomalies at sea are closely related to the structure of volcanoes. 'As it was clarified that
the.re were a anomalous local magnetic anomaly near Ito district by the airborne ma.gnetic survey in 1959, the first magnetic survey by the ship-borne
magnetometer was carried out near Ito district in January, 1960.
The magnetometer, all transistorized, · was. especially designed by the ·research group on ship-borne magnetometer of the Tohoku University. The
details of the magnetometer are described in the following section. Also, the magnetic survey at sea was carried out around Okinoyama in Sagami
Nada by Takuyo. The portable ship-borne magnetometer enables us to make measurements
of vertical intensity quite easily. Many good_ measurements can be performed in a short time.
2. Instrument. The recent development of the saturable core magnetometer contributes
the major advances in geomagnetic survey. The heart of the ship-borne magnetometer is the saturable indµctor. The earth's magnetic measurement
by the saturable inductor is independent of the velocity and acceleration of the vehicle. This consists of a core of easily saturable ferromagnetic material of high permeability (permalloy) _with an external winding to which is applied
an alternating current producing a magnetic field that drives the core cy
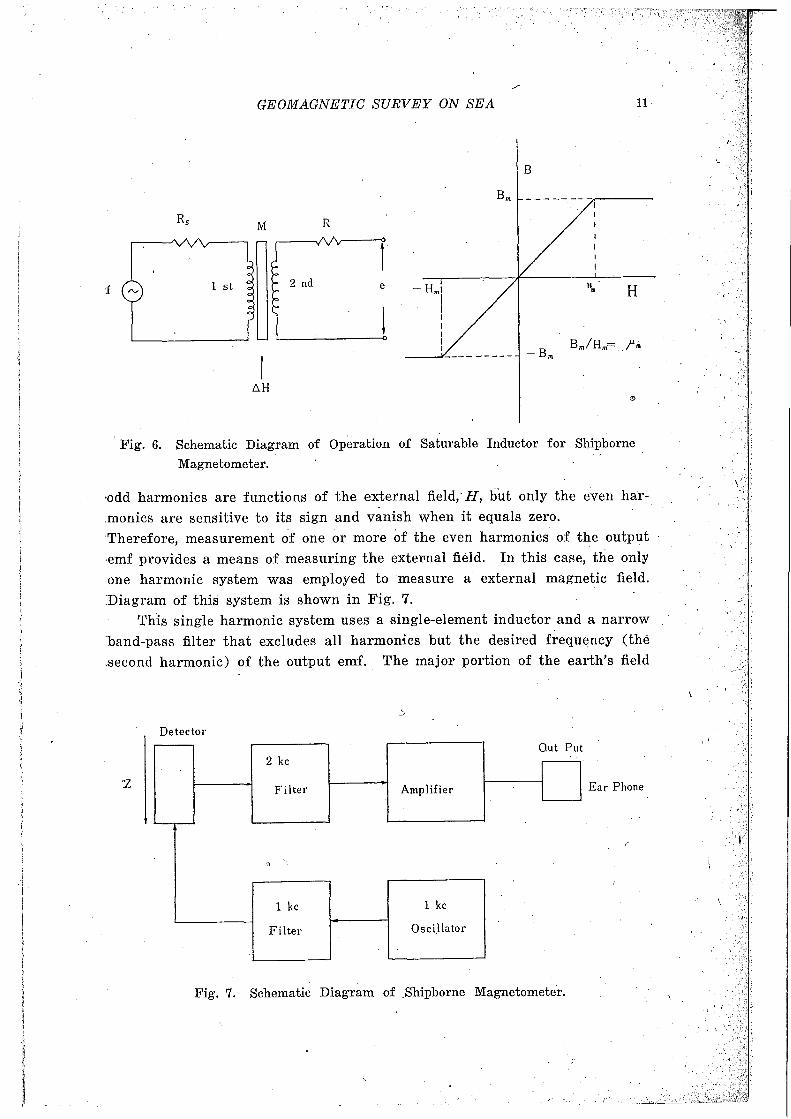
clically through saturation. If an external magnetic field, H is applied also to the core and if the
permeability, µ, of the core is high, the magnetic flux density, µH, produced
in it by the external field is an appreciable part of the flux density at saturation,
Bm· Owing to this effect of the core, the output electromagnetic-motive force of the coil will be distorted and· will have an asymmetrical wave form containing both even. and odd harmonics of the driving frequency. Schematic
diagram of operation of saturable inductor is shown in Fig. 6. Both even and
\
i
I
I ' :
·1 I
l
J
GEOMAGNETIC SURVEY ON SEA 11
B
------- ------
M R
1 st 2 nd e "· H
-B,.
6.H
Fig. 6. Schematic Diagram of Operation of Saturable Inductor for Shipborne
Magnetometer.
,odd harmonics are functions of the external field, H, but only the even har
:monics are sensitive to its sign and vanish when it equals zero. ·Therefore, measurement of one or more of the even harmonics of the output ·emf provides a means of measuring the exter-nal field. In this case, the only
one harmonic system was employed to measure a external. magnetic field.
:Diagram of this system is shown in Fig. 7. This single harmonic system uses a single-element inductor and a narrow
band-pass filter that excludes all harmonics but the desired frequency (the ,second harmonic) of the output emf. The major portion of the earth's field
Detector Out Put
2 kc ____.:.'
Filter Amplifier Ear Phone
'
1 kc 1 kc
Filter Osci,llator
Fig. 7. Schematic Diagram of Shipborne Magnetometer.

; I
12 KATO, UT ASHIRO ET AL.
' . acting on the detector coil is nullified by a magnetic field produced by means
of a steady direct current fl.owing through a coaxial secondary winding around
the saturable core.
Thus, instead of measuring, the earth's vertical field, this equipment
measures the intensity of a steady direct current fl.owing through a nullified
coil controlling a electric resistance. Because the saturable inductor measures
the external field parallel to its axis, it can be used to measure the vertical
component of the earth's ·magnetic field. In .this instrument an attempt was
made to use a gimbal system to orient the detector so that the vertical com-
. ponent could be measured at sea.
The gimbal system mounted in the case of magnetometer determines the
true vertical line at sea. If the angle for rolling of a ship-borne due to wave
is about 20°, the' error of measurement never exceeds over 50 r. The detectc.r I .
and giinbal system is set in a bomb-shaped nacelle. This detector mechanism.
must be located so that it is. not affected appreciably by .the magnetic material
o{ the ship. A photograph of the shipborne magnetometer is shown in Fig. 8.
This magnetometer may be accomplished by moving the detector mecha
nism from the ship and hanging it by means of a winch and cable system.
into the sea. The towing cable consists of the necessary electrical conductors
and nylon rope.
3. Associated Equipments.
The shipborne magnetometer measures the magnetic vertical intensity at
each point at sea. The position of the ship was fixed by electroni.c navigation
aids, such as loran, or by sextant.
The ciepth of the shipborne was determined by scale from sea level. The
depth of sea bottom at each observed point was measured by an echo sounder.
All necessary dafa to compile a magnetic chart were measured frequently so
that the magnetic intensity could be determined at each point.
4. Magnetic Survey .
. The most efficient pattern for surveying is a series of parallel traverses.
taken at right angles to the trend of the major magnetic anomalies. Since
this trend is not known until the survey is well under way, and a magnetic
anomaly is magnet:l.zed to direction of earth magnetic field, so the course
measured must be crossed by two traverses,
meridian ·and the other perpendicular to it.
in Fig. 9. The survey was carried out on
·January 20 to 26, 1960.
the one parallel to a 1magnetic
The. observed points are shown
Sagami Nada by Takuyo from.
Since, in mag_netic surveys the effects of the diurnal val'.iation of earth's.
magnetic field and the instrumental drift are very small, these effects can be
neglected. to measure a magnetic field within the error of about 50 r. The

GEOMAGNETIC SURVEY ON SEA 13
Fig. 8. Shipborne Magnetometer.
140°E 139°E ...,_.__ ____________ _....,...,.__ _____ 35° 30 t N
Hiratuka
Boso Peninsula
Sagami Bay
t-1~~--1~~-=-=::-----__._.---~=--t1-~35°oo•N ... -. • Kadowaki·
I.)·:··· Okinoyama
~f tano: "'-. O Sima '-J
Izu Peninsula -Fig. 9. Distribution of Measuring Points.

~-=---=~====-=-:--~~--~-::_--__ -____ -------- ------- -- --~---=~~==;.:_::=~=;=';:=-==::c::;====c~=:~=-:c=o:c:;_:'=:-"'=~c.=::::-'-==-..:c:,;,~=~=='c~'='-~~=-=7::=c=~=====~=c~~¥;;X~-=~~-"~~~~~~~~~~~
z y
'-- 35200
34800
34400
Magnetic anomaly on vertical intensity
34000 s --------Top
0"'
I Submarine Topography
500
1000 I s I \ ;·
Depth ~J. \} ~
N
N
-5 Km
Fib. 10--'-b. Magnetic· Anomaly and Submarine Topography at Okinoyama.
z YI Magnetic anomaly on vertical intensity
34800
344001 / \ _y:--- ----; 34000
33600 0
s N 33200 -.----
Ina tori Yahatano Kadowaki
om
Submarine Topography
500
Depth I S v ~ 5 km
N
Fig. 10-a. Magnetic Anomaly and Submarine Topography near Ito. - - ·

GEOMAGNETIC SURVEY ON SEA 15
necessary time duration is about 20 minutes to measure a magn,etic field at
a point, and the measurement is carried out at about 40 meters depth where there are not any influence occurred by a magnetic materials of ship. A
morphology of magnetic anomaly is determined by drawing an average smooth
curve through the observed values. A smooth curve is calculate.d by the least squares method ..
The results of magnetic survey could be used to supply information which would permit unique or more accurate determination of the depth of the material producing a magnetic anomaly.
Fig. 10. shows the results of this survey, from which it is found that
there are two pronounced anomalies, one is near Ito, other around dkinoyama
2.Z
Vertical intensity
/ I
x
'
' \ __ ,, I
at Sagami Nada. The anomaly ·
near Ito is very great, but the one at Okinoyama is not so great as the one near Ito.
The analysis of these anomaly iS shown in the following. Assuming a magnetic field of anoma
ly occurs by a dipole unde.r the ground, and taking the dipole as
_ _,,_ __ ---o-"'---,L----r''--1----'~~---=~----_L_ the origin of coordinates and· its \. ,./' /
'~-/ ', / Y depth as d, we get the vertical
x .
I
component of magnetic anomaly due to the dipole as follows:
Z=3 Mz[-~ (x-d-Z...o_)_l!'!_ __ l ·]. r 5
. Ho Zo 3r3
where M" repi:esents vertical mo-· ment of the dipole. The distribution of vertical intensity by the anomaly is shown in Fig. 11,
where, magnetic inclination in the
adjacent sea of Japan is taken approximately 45°, namely Ho=Z0 •
Com~aring Figs. 10 with 11, we
can easily obtain the magnetic moment and the depth of the dipole.
If we assume the dipole to be produced by uniform magnetized sphere of radius R, the effective
Fig. 11. Distribution of Magnetic Anomaly intensity bf magnetization is ex-due to a Under-Ground Dipole. pressed as
.>, '.
'

·15 KATO, UT ASHIRO ET AL.
As shown in Fig. 11, the anomaly shows a large positive anomaly in 'southern area, and ~ small negative anomaly in northern area.
In the case of the anomaly near Ito, the depth of dipole is about 2 km and the magnetic moment is 2.4x10¹⁴ emu. The anomaly near Ito is very
anomalous.
Therefore, we can consider that the anomaly may be caused by a large
mass of basaltic rock under ground. The intensity of magnetization is listed
in Table 1 assuming the dipole to be due to a uniformly magnetized sphere
of radius R=2km. It seems that there are no apparent correspondence to ·the submarine topography near Ito.
This suggests that the magnetic field is more seriously affected by the
magnetic properties of materials near the surface of the earth than by the .submarine topography. Also, we can consider that this magnetic anomaly
.is associated with the submarine Volcano.
TABLE 1. MAGNETIZATION AND MAGNETIC MOMENT ON AN ANOMALY
AT 0KINOYAMA AND AN ANOMALY NEAR ITO
Position J emu/c.c I Magnetic Moment I Rock
Near Ito 0;035 I 2.4xl014 emu I Basalt
Okinoyama 2x10-s I 5.4xl011 emu I Shale
In the case of the anomaly at Okinoyama, we can calculate the magnetic
·moment by- the same method described in case of a anomaly near Ito. The
results is tabled in Table 1. ]'rom the chart and a profile of submarine topography as shown in
"Fig. 10, we can see that Okinoyama has the structure of bank. Therefore, the magnetic anomaly at Okinoyama may be caused due to the remnant
.magnetization of the mass of bank mainly by the earth's magnetic field.
Assuming that the dipole is ·sjtuated at the centre of the bank; and the anomaly occurs due to the remanent magnetization of the mass of bank, its depth,
intensity of magnetization and magnetic moment are able to be calculated .as follows. The results is shown in Table.· 1, too .
depth
M
I
.. . .. . . .. . . . . . . . .. . .. · .. · .. · .. · .. · · · · · · about 0 . 6 km ....... :, .............................. 5.4x10¹¹ emu ....................................... 2.0x10..:5 emu/cc
It can be concluded that the anomaly can be interpreted as magnetic
.anomaly, largely due to the µniform magnetization of the bank under sea
.level with its intensity of 2. 0x10-5 emu/cc in the direction of earth's magnetic
,. .. ;- .. - ·:.._ ....
GEOMAGNETIC SURVEY ON SEA 17
field. Thus, it is found that the bank of Okinoyama is formed of sedimentary
rock.
Part III
Magnetism of a steel vessel
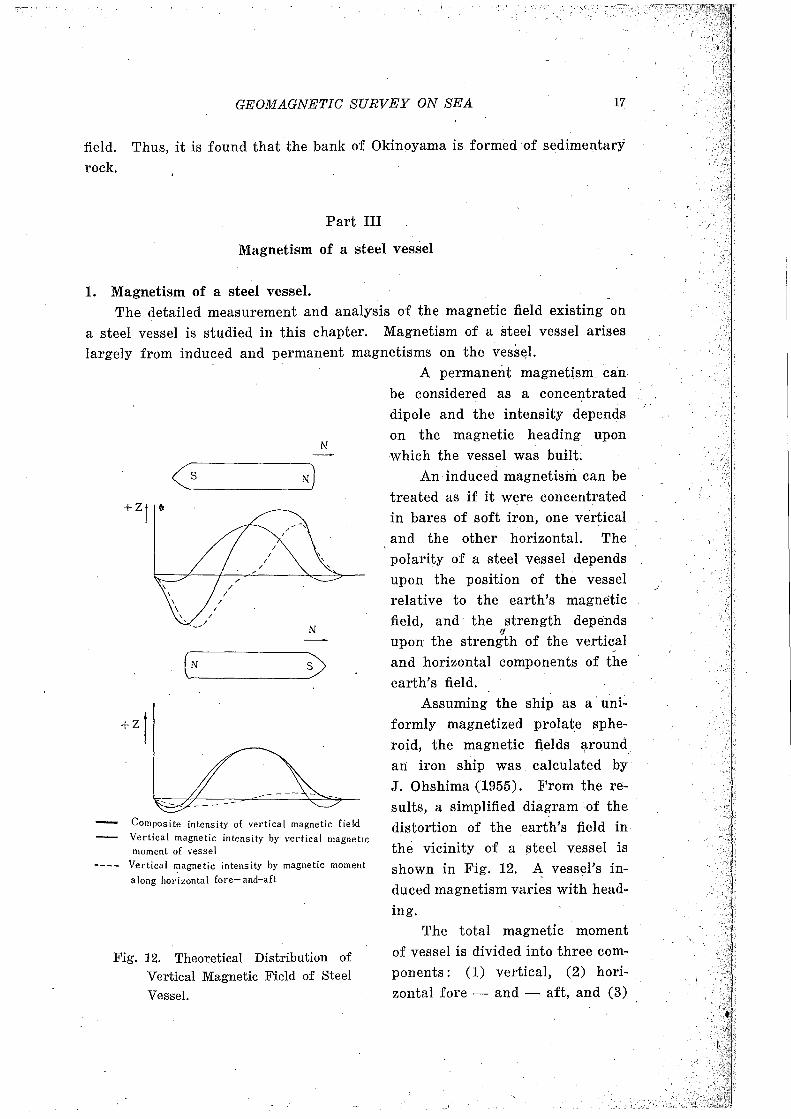
1. Magnetism of a steel vessel. The detailed measurement and analysis of the magnetic field existing on
a steel vessel is studied in this chapter. Magnetism of a steel vessel arises largely from induced and permanent magnetisms on the vess~l.
(~N __ 0
Composite intensity of vertical magnetic fiel<l Vertical magnetic intensity by \'-ertical magnetic moment of vessel
Vertical magnetic intensity by magnetic moment
a long horizon ta I fore- and-aft
Fig. 12. Theoretical Distribution of Vertical Magnetic Field of Steel
Vessel.
A permanent magnetism can be considered as a concentrated dipole and the intensity depends on the magnetic heading upon which the vessel was built;
An induced magnetism can be treated as if it were concentrated in bares of soft iron, one ve~ical and the other horizontal. The polarity of a steel vessel depends upon the position of the vessel relative to the earth's magnetic field, and the strength depends
fj
upon the strength of the vertical and horizontal components of the earth's field.
Assuming the ship as a· uni~
formly magnetized prolate sphe
roid, the magnetic fi,elds ~round.
an iron ship was calculated by J. Ohshima (1955). From the results, a simplified diagram of the distortion of the .earth's field in the vicinity of a steel vessel is shown in Fig. 12. A vessel's induced magnetism varies with heading.
The total magnetic moment of vessel is divided into three components: (1) vertical, (2) horizontal fore - and - aft, and (3)
·._1_. :._/.._:_'· _ _c_'
. (_:

18
D.Z
~ 4000
3000
2000
1000
KATO, UT ASHIRO ET AL.
!::. z '6 4000
3000
2000
1000
OL-~~~-.--~-....-~ ........ ~-10 20 30 40 m
·Depth
Fig. 13-a. Relation between Magnetic Field due to Takuyo and Depth, 1st Point.
10 20 30 40 m Depth
AZ ~
1000
0
-1000
-2000
O 10 20 30 40 m Depth
Fig. 13-b. Relation between Magnetic Field due to Takuyo and Depth, 2nd Point.
Fig. 13-c. Relation between Magnetic Field due to Takuyo and Depth, 3rd Point
.62 )
3000 2000 1000
0 -1000
N-· --
GEOMAGNETIC SURVEY ON SE'A
.6·2 l
3000 2000 1000
Depth ----15 m
N ~....--_______ 6~2 _m_~·j
~- 9.~m J
0 1--~---~---'<---~-- 1 o o o
y 62 3000
2000 1000
N-
[~-->
01--~----------'--""'"-
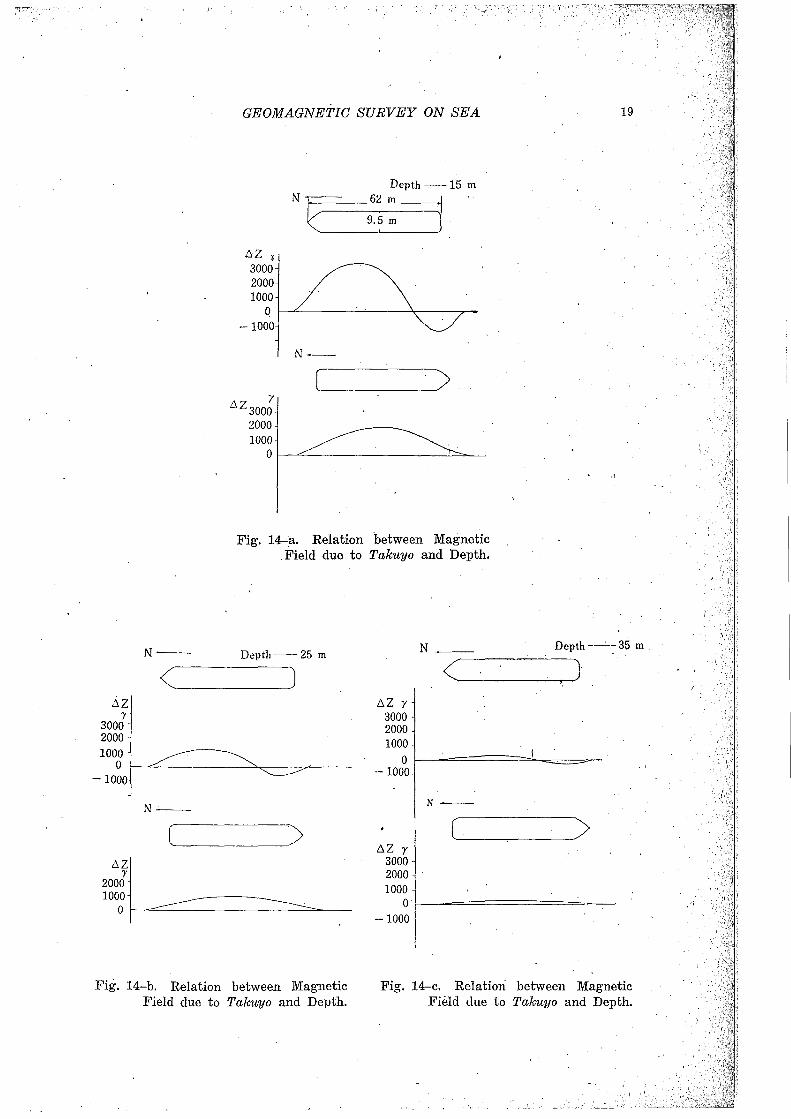
Fig. 14-a. Relation between Magnetic Field due to Takuyo and Depth.
Depth---- 25 m N __ Depth --· - 35 m
( ___ ~) <'------'---.-.-'}
N--
( ___ ~>
AZ y 3000 2000 1000
0 ~--===========:=L....~=- 1000
N--
~~00~ 1 2000 1000
[ ____ )
o·L-~~==============~--
-1000
Fig. 14-b. Relation between Magnetic Field due to Takuyo and Depth.
Fig. 14-c. Relation between Magnetic Field due to Takuyo and Depth.
! I,
~--~----'---__:_'
" 'J
I·.:.

20 KATO, UT ASHIRO ET AL.
· horizontal athwartships. The magnetic moment of a steel vessel can be separated into two parts: induced magnetism and permanent magnetism.
2. Measurement of a magnetic field around Takuyo.
The magnetic measurement was carried out on Takuyo, at Tateyama Bay on January 26, 1960.
At first,· the vessel is directed on a heading of magnetic north, and next,
on a heading of magnetic south. On such directions of the vessel,' vertical
component of a magnetic field around .the vessel was measured with the
shipborne magnetometer along to horizontal fore-and-aft directions of the vessel at each depth under sea level, for example, 15, 20, 25, 30, 35, 40 and 45 meter.
Relation between a vertical intensity of magnetic field due· to Takuyo and depth obtained from observation is shown in Figs. 13 and 14. Comparing
. Figs. 12 with 14, we can calculate each component of the magnetic moment
of Takuyo on a permanent and induced magnetisms, which is listed in Table 2.
TABLE 2. MAGNETIC MOMENT OF Takuyo.
component j horizontal fore-and- vertical component Magnetic moment aft component
Permanent magnetic moment l 4.2x101 emu 5.4xl07 emu
Induce magnetic moment I 4.2x101 emu 3.0x10⁷ emu
Total magnetic moment I 8.4xl07 emu 8.4xl07 emu
Conclusion We carried out geomagnetic survey with the new type magnetometers
by means of a aircraft and a vessel on the volcanic island and at sea, and
got many interesting results. Also, we measured magnetism of a steel vessel, and calculated each component of the magnetic moment of it.
In future, such magnetic surveys will be held on many areas of the
adjacent seas of Japan for the investigation on the terrestrial magnetism and for the promotion of the safety of navigation.
Acknowledgment We express our heaty thanks to Mr. Y. Tsukamoto, Chief Hydrographer
of Maritime Saftety Board in Japan, for his valuable advice and support, and for giving the facilities for this study. We are also gratefull ~or his
kind help to Mr. T. Matsuda, Chief of Survey Section, the Hydrographic
Office, for giving the facilities for this work. Their thanks are also due to Mr. A. M. Sinzi, Mr. N. Owaki and Mr. H. Suzuki for their valuable advices
and supports. The writers thanks the staff of Haneda Air Base of the

GEOMAGNETIC SURVEY ON SEA 2.1
Maritime Safety Board, and member. of Takuyo of the Hydrographic Office. Many thanks are also to due to Mr. S. Sakazume and , Mr~ M. Ishijima for their assistances in this work.
References
Jeans, J. H. Mathematical Theory of Electricity and Magnetism, pp. 273, 274. Kato, Y. 1956, Sci. Rep. Tohoku Univ. Ser. 5, Geophy., No. 6, pp. 15~19. Kato, Y., Matuo, M., Sakurai, A., Takagi, A. Kawamura, B., and Sugiura, K.
1958, Hydrographic B'?f,lletin. No. 57, p·. 15.
Kato, Y., Matuo, M., Sakurai, A., Takagi, A., Kawamura, B., and Sugiura, K.
1959, Loe. Cit., No. 60, p. 7. Landsberg, H. E. 1952, Advance ·in Geophysics. Muffly, G. 1947, Geophysics, p. 321. Hydrographic Office, M. S. B. 1960, Bulletin of the Hydrographic Office, Vol 0
•• 14. Oshima, J. 1955, Simadzu Review, 10, 162-174. Stockard, H. P. 1956, International Hydrographic Review, Vol. XXXIII, No. 2. Yokoyama, I. 1957, Bull. Earthqu. Inst., Univ. Tokyo, 35, · 327-358.
Yukutake, T. 1960, Loe. Cit .. 38, 41-54.
.. J
I·'.
'
,•·\-'
,''j