from the desk of editor - smctradeonline.com
TRANSCRIPT


From The Desk Of Editor
(Saurabh Jain)
SMC Global Securities Ltd. (hereinafter referred to as “SMC”) is a registered Member of National Stock Exchange of India Limited, Bombay Stock Exchange Limited and its associate is member of MCX stock Exchange Limited. It is also registered as a Depository Participant with CDSL and NSDL. Its associates merchant banker and Portfolio Manager are registered with SEBI and NBFC registered with RBI. It also has registration with AMFI as a Mutual Fund Distributor.
SMC is a SEBI registered Research Analyst having registration number INH100001849. SMC or its associates has not been debarred/ suspended by SEBI or any other regulatory authority for accessing /dealing in securities market.
SMC or its associates including its relatives/analyst do not hold any financial interest/beneficial ownership of more than 1% in the company covered by Analyst. SMC or its associates and relatives does not have any material conflict of interest. SMC or its associates/analyst has not received any compensation from the company covered by Analyst during the past twelve months. The subject company has not been a client of SMC during the past twelve months. SMC or its associates has not received any compensation or other benefits from the company covered by analyst or third party in connection with the research report. The Analyst has not served as an officer, director or employee of company covered by Analyst and SMC has not been engaged in market making activity of the company covered by Analyst.
The views expressed are based solely on information available publicly available/internal data/ other reliable sources believed to be true.
SMC does not represent/ provide any warranty express or implied to the accuracy, contents or views expressed herein and investors are advised to independently evaluate the market conditions/risks involved before making any investment decision.
lobal stock markets continued to rise and gained in the week supported by better
Gthan expected earnings. Sentiments too got support from the International
Monetary Fund revision in global growth forecast to 3.9 percent for 2018 and
2019, a 0.2 percentage point increase from its last update in October. Also Inflation
expectations are increasing on the back of weaker dollar, U.S. corporate tax cuts and signs
of improving global growth. With solid global demand, Japanese exports rose 9 percent in
the month of December 2017. Better sales and household spending together with continued
growth in imports points out that Japanese economy would continue to do well in 2018.
Back at home, Indian stock market benchmarks rose for eighth consecutive week, longest
winning streak since 2010. Earnings so far have been positive and macro economic factors
are supporting the markets. Meanwhile, in its World Economic Outlook Update, it also
estimated that the Indian economy would grow by 7.8 per cent in 2019, which make the
country the world’s fastest-growing economy in 2018 and 2019, the top ranking it briefly
lost in 2017 to China. During the week, the Government of India (GoI) unveiled details of
capital infusion plan for public sector banks that includes Rs 80000 crore through recap
bonds and Rs 8139 crore as budgetary support. The recap would be accompanied by a strong
reforms package across six themes incorporating 30 action points. The government is likely
to exceed the disinvestment target of Rs 72,500 crore this year as ONGC is going to acquire
government’s 51.1 percent stake Hindustan Petroleum Corporation Ltd. for Rs 36,915
crore. As a matter of fact, government’s total divestment proceeds till 20th January 2018
stands at Rs 54,338 crore. Both foreign and domestic institutional investors remained on
the buy side of the markets. The next major trigger for the market is Union Budget 2018-19,
which will be presented by the finance minister Arun Jaitley in the parliament on Thursday,
1 February 2018.
On the commodity market front, strong movements were witnessed in commodities and
first time in multi years, CRB is now trading comfortably above the mark of 220. It was not
the core strength of commodities which sent commodities prices higher; however, it was
the weakness in dollar index, which stimulated buying in this complex. PCE Core, Consumer
Confidence Index, ISM Manufacturing, ISM Employment, Change in Non-farm Payrolls,
Unemployment Rate and FOMC Rate Decision of US, GDP, CPI of Euro, CPI of Germany, CPI of
Australia, Manufacturing PMI of China, German Unemployment Change and Unemployment
Claims Rate, GDP of Canada, RBC Canadian Manufacturing PMI etc are events scheduled this
week.
Contents
Equity 4-7
Derivatives 8-9
Commodity 10-13
Currency 14
IPO 15
FD Monitor 16
Mutual Fund 17-18
SMC GLOBAL SECURITIES LTD.
REGISTERED OFFICES:
11 / 6B, Shanti Chamber, Pusa Road, New Delhi 110005.
Tel: 91-11-30111000, Fax: 91-11-25754365
MUMBAI OFFICE:
Lotus Corporate Park, A Wing 401 / 402 , 4th Floor ,
Graham Firth Steel Compound, Off Western Express Highway,
Jay Coach Signal, Goreagon (East) Mumbai - 400063
Tel: 91-22-67341600, Fax: 91-22-67341697
KOLKATA OFFICE:
18, Rabindra Sarani, Poddar Court, Gate No-4,5th Floor, Kolkata-700001
Tel.: 033 6612 7000/033 4058 7000, Fax: 033 6612 7004/033 4058 7004
AHMEDABAD OFFICE :
10/A, 4th Floor, Kalapurnam Building, Near Municipal Market,
C G Road, Ahmedabad-380009, Gujarat
Tel : 91-79-26424801 - 05, 40049801 - 03
CHENNAI OFFICE:
Salzburg Square, Flat No.1, III rd Floor, Door No.107, Harrington Road,
Chetpet, Chennai - 600031.
Tel: 044-39109100, Fax -044- 39109111
SECUNDERABAD OFFICE:
315, 4th Floor Above CMR Exclusive, BhuvanaTower,
S D Road, Secunderabad, Telangana-500003
Tel : 040-30031007/8/9
DUBAI OFFICE:
2404, 1 Lake Plaza Tower, Cluster T, Jumeriah Lake Towers,
PO Box 117210, Dubai, UAE
Tel: 97145139780 Fax : 97145139781
Email ID : [email protected]
NEW YORK OFFICE:
Alliance Bernstein Building
1345 Avenue of the Americas
Second Floor, New York, NY 10105
Phone: (212) 878-3684
Toll-Free: (855) 589-1915
Fax: (866) 852-4236
Printed and Published on behalf of
Mr. Saurabh Jain @ Publication Address
11/6B, Shanti Chamber, Pusa Road, New Delhi-110005
Website: www.smcindiaonline.com
Investor Grievance : [email protected]
Printed at: S&S MARKETING102, Mahavirji Complex LSC-3, Rishabh Vihar, New Delhi - 110092 (India)
Ph.: +91-11- 43035012, 43035014, Email: [email protected]

NEWS
DOMESTIC NEWS
Economy
• The government has announced that it will give Rs 88,000 crore of capital to 20 state-run banks in the current fiscal while prescribing a reforms package to make them more accountable. Of this, Rs 80,000 crore will be through recapitalisation bonds and Rs 8,139 crore as budgetary support while banks will raise Rs 10,312 crore from the market.
Telecom
• Bharti Airtel has received an approval for the acquisition of Tigo Rwanda, a subsidiary of Millicom International Cellular S.A. (Millicom) from the Rwanda Utilities Regulatory Authority (RURA). The merged entity will have the largest customer base in Rwanda with 5.9 million subscribers. The combined networks of the two companies will serve customers with voice/ data services, global roaming and mobile banking services. It will also have Rwanda's largest sales and distribution network.
Logistics
• VRL Logistics proposes to add 1200 customised trucks comprising of 600 trucks of AL 3123 make and 600 trucks of AL 3723 make to its fleet of trucks by December 2019. The investment required for this increase in owned fleet is Rs 400 crore comprising of chassis cost of around Rs 339 crore and balance being cost of body building, registration, insurance and margin for contingencies. The trucks being added have a capacity of 19 MT/ 24 MT. The company proposes to purchase the truck chassis from Ashok Leyland and would construct the truck bodies in-house.
Automobile
• Maruti Suzuki India plans to introduce around four new products in the next 12 to 18 months to build further on five years of successive double-digit sales growth.
Engineering
• Larsen & Toubro (L&T) has launched the second offshore patrol vessel (OPV) for the Navy at its greenfield defence shipyard in Kattupalli near Chennai.
Textile
• Ventura Textiles has restarted its open end 100% cotton yarn production in its factory located at Nasik. The trail runs have been completed and the commercial production has just started.
Finance
• Geojit Financial Services has approved the company's re-entry into commodities derivatives brokerage business. The Board has granted approval to the company to enter into an agreement with Geofin Comtrade to acquire its client base, on an arm's length basis for a consideration of Rs 8.10 crore.
Miscellaneous
• Eveready Industries India has agreed to enter into a Joint Venture with Universal Wellbeing to engage in the business of manufacturing/importing and marketing of fast moving consumer goods (FMCG) in India, through a Joint Venture Company to be newly incorporated for the same.
INTERNATIONAL NEWS
• The International Monetary Fund upgraded its global growth forecasts for this year and the next, reflecting acceleration in global economic activity and the impact of U.S. tax policy changes. Global output is forecast to grow by 3.9 percent for both this year and the next, up from October projections of 3.7 percent, the IMF said in its World Economic Outlook Update.
• Existing home sales in the U.S. pulled back by more than anticipated in the month of December, according to a report released by the National Association of Realtors (NAR). NAR said existing home sales tumbled by 3.6 percent to an annual rate of 5.57 million in December after jumping by 5.1 percent to a revised 5.78 million in November.
• The UK unemployment rate held steady at the lowest level in 42 years in November and employment rose to a record, reflecting a resilient labor market. The jobless rate was 4.3 percent in the three months to November, the same rate as in the quarter to August. This was the joint lowest figure since 1975.
• Japan's leading index climbed less than estimated in November but remained at the highest level in nearly four years. The leading index, which measures the future economic activity, rose to 108.3 in November from 106.5 in October. This was the highest score since January 2014, when the reading was 112.2. The initial score was 108.6.
• Japan posted a merchandise trade surplus of 358.971 billion yen in December, the Ministry of Finance said - down 43.5 percent on year. The headline figure was shy of expectations for a surplus 520.0 billion yen following the 113.4 billion yen surplus in November.
FORTHCOMING EVENTS
NOTES:1) These levels should not be confused with the daily trend sheet, which is sent every morning by e-mail in the name
of "Morning Mantra ".2) Sometimes you will find the stop loss to be too far but if we change the stop loss once, we will find more strength
coming into the stock. At the moment, the stop loss will be far as we are seeing the graphs on weekly basis and taking a long-term view and not a short-term view.
TREND SHEET
4
Closing as on 25-01-2018
Stocks *Closing Trend Date Rate SUPPORT RESISTANCE Closing
Price Trend Trend S/l
Changed Changed
S&P BSE SENSEX 36050 UP 18.11.16 25627 33900 33250
NIFTY50 11070 UP 27.01.17 8641 10400 10200
NIFTY IT 13118 UP 21.07.17 10712 11800 11600
NIFTY BANK 27446 UP 27.01.17 19708 25000 24600
ACC* 1726 UP 05.01.18 1810 - 1690
BHARTIAIRTEL 453 DOWN 25.01.18 453 500 510
BPCL 481 UP 18.10.17 514 480 470
CIPLA 621 DOWN 15.12.17 576 610 620
SBIN 313 UP 27.10.17 311 310 300
HINDALCO 259 UP 22.12.17 268 245 235
ICICI BANK 361 UP 27.10.17 301 330 320
INFOSYS 1175 UP 13.04.17 1010 1080 1050
ITC 281 UP 25.01.18 281 265 260
L&T 1417 UP 13.01.17 959 1300 1260
MARUTI 9278 UP 06.01.17 5616 9000 8700
NTPC** 172 UP 04.08.17 177 - 170
ONGC 208 UP 27.10.17 184 190 185
RELIANCE 966 UP 23.06.17 718 880 850
TATASTEEL 769 UP 19.05.17 490 700 670
Ex-Date Company Purpose
29-Jan-18 HCL Technologies Interim Dividend - Rs 2 Per Share 30-Jan-18 Zensar Technologies Interim Dividend - Rs 5 Per Share30-Jan-18 Bharti Airtel Interim Dividend - Rs 2.84 Per Share31-Jan-18 Wipro Interim Dividend - Re 1 Per Share 31-Jan-18 Tata Steel Rights - 4:25 Fully Paid Up Shares @
Premium Rs 500/- Per Share / 2:25 Partly Paid Up Shares @ Premium Rs 605/- Per Share
31-Jan-18 Piramal Enterprises Rights 1:23 @ Premium Rs 2378/-31-Jan-18 JM Financial Interim Dividend - Re 0.70 Per Share2-Feb-18 Edelweiss Fin Services Interim Dividend - Rs 1.05 Per Share6-Feb-18 Godrej Cons Products Interim Dividend7-Feb-18 NTPC Interim Dividend8-Feb-18 Power Grid Corp. of India Interim Dividend
Meeting Date Company Purpose
29-Jan-18 H D F C Quarterly Results30-Jan-18 Bharat Electron Quarterly Results ,Interim Dividend30-Jan-18 Engineers India Quarterly Results30-Jan-18 I O C L Quarterly Results, Interim Dividend,Bonus Issue31-Jan-18 Arvind Ltd Quarterly Results31-Jan-18 Dabur India Quarterly Results31-Jan-18 Exide Inds. Quarterly Results31-Jan-18 ICICI Bank Quarterly Results31-Jan-18 JSW Steel Quarterly Results31-Jan-18 Larsen & Toubro Quarterly Results31-Jan-18 NTPC Quarterly Results, Interim Dividend31-Jan-18 Reliance Infra. Quarterly Results31-Jan-18 Vedanta Quarterly Results1-Feb-18 Ashok Leyland Quarterly Results1-Feb-18 Power Grid Corpn Quarterly Results, Interim Dividend2-Feb-18 Bajaj Auto Quarterly Results2-Feb-18 Hindalco Inds. Quarterly Results5-Feb-18 Colgate-Palm. Quarterly Results5-Feb-18 Tata Motors Quarterly Results
*ACC has broken the support of 1730 **NTPC has broken the support of 173
EQUITY

BSE SENSEX TOP GAINERS & LOSERS (% Change) NSE NIFTY TOP GAINERS & LOSERS (% Change)
SECTORAL INDICES (% Change)
SMC Trend
FMCGHealthcare
Auto BankRealty
Cap GoodsCons Durable
Oil & GasPower
ITMetal
Down SidewaysUp
GLOBAL INDICES (% Change)
INDIAN INDICES (% Change)
SMC Trend
Nifty Sensex BSE Midcap BSE Smallcap Nifty Junior S&P CNX 500
SMC Trend
FTSE 100CAC 40
NasdaqDow jonesS&P 500
NikkeiStrait times
Hang SengShanghai
FII/FPI & DII TRADING ACTIVITY (In Rs. Crores)
5
1.761.83
1.19
0.10
0.88
1.35
0.00
0.20
0.40
0.60
0.80
1.00
1.20
1.40
1.60
1.80
2.00
Nifty Sensex BSE Midcap BSE Smallcap Nifty Next 50 S&P CNX 500
1.07
0.69
0.97
0.56
1.66
2.18
-0.79
-1.13
-0.57
-1.50
-1.00
-0.50
0.00
0.50
1.00
1.50
2.00
2.50
Nasdaq Comp. Dow Jones S&P 500 Nikkei Strait Times Hang Seng Shanghai Comp.
FTSE 100 CAC 40
-0.15
2.12
1.78
-1.66
1.22
1.85
4.82
1.88
2.62
0.48
2.59
-2.00
-1.00
0.00
1.00
2.00
3.00
4.00
5.00
6.00
Auto Index Bankex Cap Goods Index
Cons Durable Index
FMCG Index Healthcare Index
IT Index Metal Index Oil & Gas Index
Power Index Realty Index
1894.99
988.25
1567.51
1229.35
776.42
-657.46
209.86
-461.87
169.03
-193.87
-1000.00
-500.00
0.00
500.00
1000.00
1500.00
2000.00
2500.00
Friday Monday Tuesday Wednesday Thursday
9.09 8.85
7.286.68
6.28
-7.71
-6.50-5.73
-4.56
-3.46
-10.00
-8.00
-6.00
-4.00
-2.00
0.00
2.00
4.00
6.00
8.00
10.00
Tech Mahindra
O N G C TCS St Bk of India HCL Technologies
Bharti Airtel H P C L Eicher Motors Wipro Tata Motors
8.73
7.446.62
4.743.98
-7.80
-5.33-4.48
-3.66 -3.56
-10.00
-8.00
-6.00
-4.00
-2.00
0.00
2.00
4.00
6.00
8.00
10.00
O N G C TCS St Bk of India Yes Bank Bajaj Auto Bharti Airtel Tata Motors-DVR
Wipro Tata Motors Asian Paints
EQUITY

Beat the street - Fundamental Analysis
Source: Company Website Reuters CapitalineAbove calls are recommended with a time horizon of 8 to 10 months.
Investment Rationale• NMDC is India's largest public sector iron ore
producer. Government of India (GoI) holds 74.94% stake in NMDC as on 31st December 2017.
• The company is operating three highly-mechanised iron ore mine complexes. Two complexes are located in Dantewada (Chhattisgarh) namely Bailadila Iron Ore Mine, Kirandul Complex & Bailadiala Iron Ore Mine, Bacheli Complex with yearly production of around 22 MT. One complex in Donimalai Iron Ore Complex, located in Bellary (Karnataka) produces 12 MT per annum.
• On the development front, it has made a comprehensive plan to enhance iron ore production capacity to 67 MTPA by FY'22 to meet the growing requirements of iron ore of the Indian Steel sector. The strategy focuses on growth largely through brown field expansion of existing mines and improving evacuation along with it. Moreover, development of a green- field mines (Deposit 13) has also been planned through Joint Venture with the Chhattisgarh State Mining development Corporation.
• The company is in the process of setting up a slurry pipeline in phases for evacuation of iron ore at economical cost to such locations from where the pellets /ore are made available to industry. Efforts to increase evacuation capacity through doubling of Kirandul-Kothavalasa (KK) line is also in full swing. It is developing iron ore stockyard in Chhattisgarh for uninterrupted supplies to customers.
• NMDC net sales rose 39% to Rs 2421.33 crore in Q2FY'18 compared to corresponding previous year period led by increase in domestic and export prices along with increase in domestic and export sales quantity while net profit of the company rose 10% to Rs 844.4 crore. It has produced 7.718
million tonne and sold 8.296 million tonne of iron ore in Q2FY18 against production of 6.31 million tonne and sales of 8.013 million tonne registering a growth of 14% in production and 4% in sales in corresponding period last year. Its net profit rose 22% to Rs 1813.66 crore.
ValuationThe company is bullish on the growth prospects of India's steel industry with its competitive advantages and the impetus being given by the government to the steel sector. The recently published National Steel Policy 2017 aims to achieve a steel production capacity of 300 mtpa by 2030-31, on the back of envisaged growth in domestic steel demand in all key sectors, such as, infrastructure, housing, automobile, etc. To fulfill the vision of Government, the company proposes to act as a facilitator and developer of green field steel plants by creating Special Purpose Vehicles (SPVs) in the mineral rich states of Jharkhand, Karnataka and Chhattisgarh thus, it is expected that the stock will see a price target of Rs.170 in 8 to 10 months time frame on a expected P/E of 14x and FY19 (E) earnings of Rs.12.12.
52 W H/L(Rs) 162.55/102.80
Mkt. Cap.(Rs Cr) 45892.23
Latest EPS (cons.) -Unit Curr. 7.19
Latest P/E Ratio -cons 20.16
Latest Bookvalue (cons.) -Unit Curr. 71.37
Latest P/BV - cons 2.03
Dividend Yield -% 2.86
Face Value 1.00
Stock Exchange BSE
` in cr
% OF SHARE HOLDING
VALUE PARAMETERS
ACTUAL ESTIMATE
FY MAR-17 FY MAR-18 FY MAR-19REVENUE 8,827.80 11,378.20 11,705.80EBITDA 3,601.10 6,001.70 5,923.10EBIT 3,404.90 5,384.30 5,600.30NET INCOME 2,589.10 4,136.00 3,790.10EPS 7.22 13.09 12.12BVPS 71.18 79.32 84.92RoE 10.03 15.36 14.80
NMDC Limited CMP: 145.05 Upside:17%Target Price:170.00
6
GATI LIMITED CMP: 135.70 Upside:28%Target Price: 174.00
Investment Rationale• Gati Limited is a pioneer and leader in Express
Distribution and Supply Chain Solutions in India and delivers over 6 million packages a month. The company has now grown into an organization with more than 5,000 business partners and a network reach of 672 out of total 676 districts in India. It has a 5000 plus fleet including refrigerated vehicles and world class warehousing facilities across India.
• Recently, the government has granted infrastructure status to the logistics sector and this is expected to attract more funding at competitive rates.
• On a consolidated basis, the company’s net profit jumped 179.17% to Rs 20.77 crore on 4.62% decline in net sales to Rs 405.97 crore in Q2 September 2017 over Q2 September 2016. The second quarter is generally a strong period due to increased spending during the festivals.
• The introduction of GST in July 2017, as anticipated, led to a short term dip in the general business environment. As the initial teething troubles of GST settle, the management of the company remains confident that the medium and long-term benefits of GST will start reflecting in performance going forward.
• Gati has a strong market presence in the Asia Pacific region and South Asian countries. It has offices in India, Singapore, Hong Kong, China, Nepal and Thailand.
• In November 2016, the company has invested in BrownTape, a technology platform that helps online sellers on multiple e-Commerce
marketplaces to manage their orders from a single window. The alliance will work on the vision of simplifying e-Commerce for all levels (small, medium, and large) of online sellers, who will be able to manage their e-Commerce ecosystem seamlessly.
ValuationWith its comprehensive integrated service portfolio, Gati is distinctively positioned to support the consequent supply chain realignment. Moreover, the company's pan-India reach has been already designed on a hub and spoke model for efficiency and speed. Over the last few years, the company has undertaken significant initiatives to fortify its stronghold to deliver consistently to customers, by developing end-to-end solutions, enhancing technology capabilities and augmenting operations quality processes. Thus, it is expected that the stock will see a price target of Rs.174 in 8 to 10 months time frame on a current P/E of 27.56x and FY19 (E) earnings of Rs.6.31.
Face Value (Rs.) 2.00
52 Week High/Low 154.45/101.60
M.Cap (Rs. in Cr.) 1470.27
EPS (Rs.) 4.92
P/E Ratio (times) 27.56
P/B Ratio (times) 2.08
Dividend Yield (%) 0.48
Stock Exchange BSE
% OF SHARE HOLDING
P/E Chart
` in cr
Actual Estimate FY Mar-17 FY Mar-18 FY Mar-19Revenue 1,691.00 1,766.70 1,966.60Ebitda 124.90 139.10 162.70Ebit 90.13 119.70 142.10Net Income 29.51 68.04 68.15EPS 2.49 9.76 6.31BVPS 65.08 58.93 65.24RoE 5.19 10.91 9.74
VALUE PARAMETERS
31.37
0.287.84
26.2
34.31
3.8
17.39
0.56
74.94
3.31
Foreign
Institutions
Govt holding
Promoters
Public & Others
Foreign
Institutions
Non Promoter Corporate Holding
Promoters
Public & Others
P/B Chart
EQUITY

Charts by Spider Software India Ltd
EQUITY
Above calls are recommended with a time horizon of 1-2 months
Disclaimer : The analyst and its affiliates companies make no representation or warranty in relation to the accuracy, completeness or reliability of the information contained in its research. The analysis contained in the analyst research is based on numerous assumptions. Different assumptions could result in materially different results.The analyst not any of its affiliated companies not any of their, members, directors, employees or agents accepts any liability for any loss or damage arising out of the use of all or any part of the analysis research.
SOURCE: CAPITAL LINE
The stock closed at Rs 1730.20 on 25TH January, 2018. It made a 52-week low at
Rs 1233.05 on 30TH January 2017 and a 52-week high of Rs. 1804 on 11TH
September 2017. The 200 days Exponential Moving Average (EMA) of the stock on
the daily chart is currently at Rs 1581.62
After giving massive upside from 1200 to 1800 levels, stock has been
consolidating in narrow range and had formed a “Continuation Triangle” on
weekly charts, which is bullish in nature. Last week, it has given the breakout of
same by gained around 3% and also managed to close above the same. On the
indicators front, RSI and MACD are also suggest buying for the stock so buying
momentum can continue for coming days. Therefore, one can buy in the range of
1710-1720 levels for the upside target of 1900-1950 levels with SL below 1640.
The stock closed at Rs 208.50 on 25TH January, 2018. It made a 52-week low at
Rs 155.20 on 27TH June 2017 and a 52-week high of Rs. 212.85 on 25TH January
2018. The 200 days Exponential Moving Average (EMA) of the stock on the daily
chart is currently at Rs 180.54
Short term, medium term and long term bias looks positive for the stock. On weekly
charts, it was forming an “Inverted Head and Shoulder” pattern, which is
considered to be bullish. Last week, the stock has given the breakout of same by
registered gains over 7% and also managed to close above the breakout levels.
Moreover, there is a rise in volumes, which indicates that buying is more aggressive
for the stock. Apart from this, it is comfortably trading above 200WEMA, which also
shows strength for the stock. Therefore, one can buy in the range of 202-205 levels
for the upside target of 230-236 levels with SL below 195.
Oil & Natural Gas Corporation Limited (ONGC)
7
IndusInd Bank Limited (INDUSINDBK)

DERIVATIVES
CHANGE IN NIFTY OPTION OI (IN QTY)
WEEKLY VIEW OF THE MARKET
NIFTY OPTION OI CONCENTRATION (IN QTY)
CHANGE IN BANKNIFTY OPTION OI (IN QTY) (MONTHLY)BANKNIFTY OPTION OI CONCENTRATION (IN QY) (MONTHLY)
Overall derivative data indicates long rollover and most of the Nifty Feb futures positions have been rolled over in the range of 10980- 11020 futures. Derivative
data indicates bullish scenario to continue. Nifty has multiple strong supports at lower levels. Various supports are 11000, 10900 spot levels. We will see short
covering on every dip. In the Feb option contracts we are seeing options open interest building up in 11500 calls and 10500 puts, so the probable range for next
expiry could be 10500-11500 with positive bias. From option data we have been seeing shifting of range to the upper band. Market Undertone is likely to remain
bullish with support of consistent FII buying and short covering. The Implied Volatility (IV) of calls was up and closed at 16.33% while that for put options closed at
16.55%. The Nifty VIX for the week closed at 18.04% and is expected to remain up trending. Overall market’s cost-of-carry is up on the back of fresh long
additions. Among Nifty call options. The PCR OI for the week closed at 1.35 which indicates OTM put writing. On the technical front 10950-11000 spot levels is
strong support zone and current trend is likely to continue towards 11200-11250.
In lakhs
In 10000 In 10000
ASHOKLEY (FEB FUTURE)
Buy: Above `124
Target: `129
Stop loss: `121
HINDPETRO
BUY FEB 380. PUT 13.35SELL FEB 370. PUT 9.95
LOT SIZE: 1575BEP: 376.60
MAX. PROFIT: 10395.00 (6.60*1575)MAX. LOSS: 5355.00 (3.40*1575)
OPTIONSTRATEGY
FUTURE
FEDERALBNK
BUY FEB 100. PUT 3.65SELL FEB 95. PUT 1.65
LOT SIZE: 5500BEP: 98.00
MAX. PROFIT: 16500.00 (3.00*5500)MAX. LOSS: 11000.00 (2.00*5500)
DERIVATIVE STRATEGIES
AXISBANK (FEB FUTURE)
Buy: Above `621
Target: `640
Stop loss: `611
BULLISH STRATEGY
ADANIENT
BUY FEB 215. CALL 11.85SELL FEB 225. CALL 8.30
LOT SIZE: 4000BEP: 218.55
MAX. PROFIT: 25800.00 (6.45*4000)MAX. LOSS: 14200.00 (3.55*4000)
BATAINDIA (FEB FUTURE)
Sell: Below `707
Target: `685
Stop loss: `720
BEARISH STRATEGY
8
Call Put
Call Put Call Put
Call Put
19.17
8.86
5.19
12.04
6.34
11.92
22.61
11.21
21.72
22.31
24.04
8.62
27.30
18.17
48.28
24.14
24.86
25.85
17.00
23.02
8.02
17.20
0.00
10.00
20.00
30.00
40.00
50.00
60.00
9000 10000 10400 10500 10600 10700 10800 10900 11000 11500 12000
16.23
7.21
1.71
4.35
2.15
2.45
-4.39
-0.55
5.39
16.70
20.95
5.98
2.20
-0.59
12.09
10.67
15.62
15.65
13.84
19.17
5.84
14.00
-10.00
-5.00
0.00
5.00
10.00
15.00
20.00
25.00
9000 10000 10400 10500 10600 10700 10800 10900 11000 11500 12000
4.83
4.29
2.45
14.39
25.38
67.86
11.49
21.08
16.79
33.74
8.75
5.20
4.13
7.02
16.69
26.86
54.10
56.03
58.08
8.52
2.05
1.61
0.00
10.00
20.00
30.00
40.00
50.00
60.00
70.00
80.00
23300 23500 24000 25000 25500 26000 26500 27000 27500 28000 28500
4.76
4.29
2.20
12.90
7.16
2.44
-2.39
-8.70
7.92
32.03
8.75
3.50
4.08
2.88
8.56
9.48
29.74 33.94
19.88
8.41
2.04
1.61
-15.00
-10.00
-5.00
0.00
5.00
10.00
15.00
20.00
25.00
30.00
35.00
40.00
23300 23500 24000 25000 25500 26000 26500 27000 27500 28000 28500
In lakhs

DERIVATIVES
FII’s ACTIVITY IN DERIVATIVE SEGMENT
SENTIMENT INDICATOR (NIFTY)
24-Jan 23-Jan 22-Jan 19-Jan 18-Jan
Discount/Premium -2.80 1.75 1.80 6.35 -6.20
COST OF CARRY% 0.98 0.97 0.95 0.91 0.88
PCR(OI) 2.17 2.17 1.81 1.66 1.48
PCR(VOL) 1.20 1.12 1.19 1.28 1.25
A/D RATIO(Nifty 50) 1.04 2.64 0.82 5.13 0.46
A/D RATIO(All FO Stock)* 0.57 1.94 1.25 3.48 0.18
Implied Volatility 16.33 14.42 13.70 12.60 12.54
VIX 18.04 16.23 15.39 13.98 13.98
HISTORY. VOL 10.79 11.13 10.26 10.10 9.83
*All Future Stock
SENTIMENT INDICATOR (BANKNIFTY)
FII’S ACTIVITY IN NIFTY FUTURE
**The highest call open interest acts as resistance and highest put open interest acts as support.# Price rise with rise in open interest suggests long buildup | Price fall with rise in open interest suggests short buildup # Price fall with fall in open interest suggests long unwinding | Price rise with fall in open interest suggests short covering
#All Future Stock
24-Jan 23-Jan 22-Jan 19-Jan 18-Jan
Discount/Premium 90.60 28.30 23.00 22.10 3.85
COST OF CARRY% 0.60 0.60 0.60 0.57 0.53
PCR(OI) 2.48 1.93 1.54 1.55 1.15
PCR(VOL) 1.92 1.22 0.92 0.82 1.17
A/D RATIO(Banknifty) 1.40 5.00 1.00 All Up 0.50
A/D RATIO(All FO Stock)* 1.75 6.33 0.50 All Up 0.22
Implied Volatility 17.38 16.30 15.78 13.67 13.40
VIX 18.04 16.23 15.39 13.98 13.98
HISTORY. VOL 14.33 14.78 13.92 14.17 12.97
9
In Cr. In Cr.
NAME LTP Rollover % Open interest
FORTIS 158.35 95.9% 53753000
JPASSOCIAT 22.2 94.1% 250444000
DHFL 598.6 93.3% 25668000
SUNPHARMA 583.25 92.7% 52723000
TV18BRDCST 60.2 92.5% 74766000
EXIDEIND 228.45 92.1% 15352000
JISLJALEQS 146.55 92.0% 48366000
EQUITAS 147 91.5% 25222400
BHARATFIN 1027.95 91.1% 7650000
INDIACEM 176.2 91.0% 26834500
Top 10 short build upTop 10 long build up
-242
54
-554
-37
-667
679
-26
-1804
574
1258
-2500
-2000
-1500
-1000
-500
0
500
1000
1500
11-Jan 12-Jan 15-Jan 16-Jan 17-Jan 18-Jan 19-Jan 22-Jan 23-Jan 24-Jan
290
2119
1144
1539 1710
2222
1860
-400
9
541
-432
-5000
-4000
-3000
-2000
-1000
0
1000
2000
3000
11-Jan 12-Jan 15-Jan 16-Jan 17-Jan 18-Jan 19-Jan 22-Jan 23-Jan 24-Jan
NAME LTP Rollover % Open interest
ICICIPRULI 432.65 56.0% 4271800
COALINDIA 291.55 58.1% 15274600
DIVISLAB 1124.6 61.6% 1764000
GAIL 489.5 62.3% 11548000
NHPC 28.85 64.7% 52461000
PAGEIND 22008.8 65.2% 37750
BPCL 472.8 65.8% 7389000
SRF 1848.65 66.6% 632500
UBL 1133.25 67.6% 996800
NTPC 169.45 68.5% 24528000
10
SPICES
The bull-run of soybean futures (Feb) is not yet over & at this stage buying on dips is recommended as it has potential to test 3750-3800 levels. The main factor that is acting as a catalyst is the assumption that the crop of the current year 2017-18 (Oct-Sept) could be around 72-75 lakh tons, much lower against the earlier estimates of 92 lakh tons. Refined soy oil futures (Feb) may trade with an upside bias towards 755-758 levels. The cooking oil is taking positive cues the U.S soy oil, which is seen taking support near 32.50 cents per pound & bouncing back from lower levels. CPO futures (Feb) has taken support near 560 levels & in days to come it may show an upside momentum towards 585-590 levels. The factor that is supporting is the assumption that Malaysian palm oil output is expected to see seasonal declines in the first quarter of the year before picking up and heading towards peak production in the third quarter. Moreover, India’s palm oil stock levels are low and China's buying window is coming up soon ahead of the Lunar New Year. The gains witnessed by mustard futures (Apr) may not sustain in days to come & will possibly trade in the range of 4070-4250 levels, with a downside bias. The reason being, arrivals of mustard seed from the new crop have commenced in the key market of Kota in Rajasthan & are likely to rise to around 15,000 bags per day next this week onwards. It is reported that the new arrivals, which contain 18-20% moisture, are priced at Rs.3,100-3,200 per quintal, down by Rs.100 from last year.
OIL AND OILSEEDS
OTHER COMMODITIES
Cotton oil seed cake futures (Feb) is likely to descend towards 1650-1630 levels. At the spot markets, the demand has taken a back seat as the buyers have switched to other cheaper feed substitutes such as tur churi, bajara churi, chana churi & maize which are trading in the range of Rs 1100-1425/100kg. Kapas futures (April) is expected to trade sideways in the range of 960-990 levels. The downside may remain capped as the domestic cotton market is not trending on fundamentals but only influenced by the trend on the US cotton futures. International cotton prices have continued to move upward from the season low of 77 cents per pound at the start of season & now trading near 82 cents per pound. Back at home, major traders have adopted a wait and watch approach amid volatility in spot prices in the past few weeks. The New Year has brought rejoice to the farmers cultivating guar as both the seed & gum, are at two year high, thanks to the bull run of crude oil prices in the international market. The sharp rally in crude oil prices in the last one month has raised optimism among Guar industry that Guargum export this season will be much better. Guargum is mainly used in extraction of oil and natural gas and rising crude oil prices will surely enhance its consumption. At present, both crushers and stockists are active in the spot market and buying Guarseed due to expectations of better return ahead amid positive fundamentals. Saying this, guar seed futures (Feb) is likely to witness 4800-4900 levels, while guar gum futures (Feb) may test 10300-10500 levels.
Bullion counter may continue its upside momentum amid weaker greenback but profit booking at higher levels cannot be ruled out as prices have run up very swiftly in quick span of time. This week FOMC interest rate decision on 31st January and U.S nonfarm payroll data is expected to give further direction to the prices. On the domestic bourses strong local currency is capping the upside. Local currency rupee can move in the range of 63-64.30 levels. Gold can face resistance near $1390 in COMEX and 31000 in MCX while it has support near $1325 in COMEX and 29800 in MCX. Silver has key support near 39000 in MCX and $16.80 in COMEX. And it has resistance near 41500 in MCX and $18.00 in COMEX. Last week Gold prices edged to their highest since August, 2016, buoyed as the U.S. dollar hit three-year lows after comments by U.S. Treasury secretary Steven Mnuchin that he welcomed a weaker currency. The dollar slumped after Mnuchin told the World Economic Forum in Davos on that "obviously a weaker dollar is good for us as it relates to trade and opportunities. The Senate reached a deal to end the federal government shutdown that lasted less than three days. Gold demand in China firmed recently as retailers stocked up ahead of the Chinese New Year while price discounts widened in India, partly on expectations of a reduction in import duty in next month’s budget. According to the World Gold Council, “Gold demand is set to jump this year thanks to government policies targeted at transparency and economic growth”.
BULLIONS
Crude oil prices may trade with upside path as decline in inventories, healthy global economic growth and OPEC countries strong compliance towards production cut can continue to give support to the prices. Overall it can move in the range of 4000-4400 levels in MCX. According to the Energy Information Administration “U.S. crude stocks fell for a record 10th straight week as levels at the Cushing, Oklahoma hub continued to draw down to three-year lows, while gasoline and distillate inventories rose”. Crude stocks at the Cushing, Oklahoma, and delivery hub for U.S. crude futures fell by 3.2 million barrels to 39.2 million, their lowest since January 2015. Crude inventories rose by 4.8 million barrels in the week to Jan. 19 to 416.2 million after nine weeks of drawdowns, compared with expectations for a decrease of 1.6 million barrels. Natural gas may remain on volatile path as US weather conditions to give further direction to the prices. Overall Natural gas (Feb) can move in the range of 185-215 in MCX. Recently forecasts for colder weather in the first week of February is expected to boost heating demand and could re-freeze thawing production wells. The winter has been much colder than forecasters predicted and a lot more cold appears to be on the way in February. Structural demand has absorbed most of the production increases in natural gas over the last year. AccuWeather is forecasting colder than normal weather could invade the U.S. in February. This is due to Arctic air being displaced by a sudden stratospheric warming event going on right now in the Arctic.
ENERGY COMPLEX
Base metals counter can trade on an upside path as China manufacturing PMI and US consumer confidence data this week to give further direction to the prices. U.S. President Donald Trump last week stated that his long-awaited plan to help rebuild the nation's infrastructure would result in about $1.7 trillion in overall investment over the next 10 years. China's economy grew faster than expected in the fourth quarter of 2017, as an export recovery helped country post its first annual acceleration in growth in seven years. Copper may trade in the range of 445-470. Recently rapidly rising inventories at LME suggested that there is plentiful supply of the metal used in power and construction. On-warrant copper stocks available to the market in LME-registered warehouses jumped by 24,325 tonnes after a rise of 44,825 tonnes, taking the increase in on-warrant inventories since Jan. 17 to 51 percent. Aluminium may move in the range of 138-147 in MCX. China's central Henan province churned out more aluminium than neighboring Shandong for the first time in years, becoming the nation's top producing region. Nickel can trade in the range of 810-900 levels in near term. Zinc can move in the range of 217-226 levels. According to ILZSG global market for refined zinc metal was in deficit by 485kilo tonne over the first eleven months of 2017 with total reported inventories decreasing by 320kilo tonne over the same period. Lead can move in the range of 163-173 levels in MCX. Lead continued its surge amid tight lead stocks and output curbs in China on environmental grounds.
Turmeric futures (Apr) is expected to trade with a downside bias in the range of 7200-7550 levels. The sentiments of the market participants at the spot markets are showing a mixed trend as arrivals from the new turmeric crop have started in the markets of Nizamabad in Telangana and Erode in Tamil Nadu. Due to cold weather, moisture content is high at 5-19% & 12-14% in new arrivals of Erode & Nizamabad respectively. On the demand side, all the traders are awaiting North Indian orders when the full-fledged turmeric buying season will commence from February. In days to come, jeera futures (Mar) may witness some short covering owing to lower level buying, taking support near 16300 levels. If we take a close look, the open interest is not getting built up as it was seen in the previous weeks, and this is giving an indication that the downside may remain capped. Fundamentally, the demand side is expected to remain steady due to growing demand for Indian Jeera in global market & lower carryover stock, despite of higher production. Coriander futures (Apr) is likely to face resistance near 6050-6100 levels & the upside may remain capped owing to rising pressure of fresh supplies. The arrivals of the new coriander crop have started in the spot markets of Rajkot & are expected to rise to 15,000-20,000 bags per day by the end of February. The demand for the new crop is low as the moisture content is around 20-25% as compared to the ideal level of 7-8%. Regarding price, at the spot markets the new crop is being quoted at Rs.4, 000-5,000 per quintal, against Rs.5,000-6,000 per quintal last year.
BASE METALS

11
TECHNICAL RECOMMENDATIONS
CASTOR NCDEX (FEBRUARY) contract closed at Rs. 4099 on 24th Jan’18. The contract made its high of
Rs. 4705 on 27th Nov’17 and a low of Rs. 3976 on 16th Jan’18. The 18-day Exponential Moving Average of
the commodity is currently at Rs. 4162.
On the daily chart, the commodity has Relative Strength Index (14-day) value of 48.58. One can buy in
the range of Rs. 4110-4140 for a target of Rs. 4250 with the stop loss of Rs. 4080.
REFINED SOY OIL NCDEX (FEBRUARY) contract closed at Rs. 744.50 on 24th Jan’18. The contract made
its high of Rs. 765.65 on 23rd Nov’17 and a low of Rs. 689.90 on 23rd Oct’17. The 18-day Exponential
Moving Average of the commodity is currently at Rs. 739.48.
On the daily chart, the commodity has Relative Strength Index (14-day) value of 66.67. One can buy in
the range of Rs. 745-746 for a target of Rs. 755 with the stop loss of Rs. 740.
SILVER MCX (MARCH) contract closed at Rs. 39707 on 24th Jan’18. The contract made its high of Rs.
42451 on 8th Sept’17 and a low of Rs. 36672 on 12th Dec’17. The 18-day Exponential Moving Average of
the commodity is currently at Rs. 39109.
On the daily chart, the commodity has Relative Strength Index (14-day) value of 71.12. One can buy in
the range of Rs. 39500-39650 for a target of Rs. 40800 with the stop loss of Rs. 39000.
CASTOR NCDEX (FEBRUARY)
REFINED SOY OIL NCDEX (FEBRUARY)
SILVER MCX (MARCH)
TREND SHEET
*Closing as on 24.01.18
EXCHANGE COMMODITY CONTRACT CLOSING DATE TREND TREND RATE TREND SUPPORT RESISTANCE CLOSING
PRICE CHANGED CHANGED STOP/LOSS
NCDEX SOYABEAN FEB 3547.00 07.12.17 UP 3139.00 3480.00 - 3450.00
NCDEX JEERA MAR 16475.00 04.01.18 Down 17390.00 - 17000.00 17500.00
NCDEX REF.SOY OIL FEB 744.50 18.01.18 Sideways
NCDEX RM SEEDS APR 4071.00 18.01.18 Down 4008.00 - 4150.00 4180.00
NMCE PEPPER MINI FEB 40810.00 18.01.18 Down 41715.00 - 42000.00 43000.00
NMCE RUBBER MAR 12732.00 13.07.17 Sideways
MCX MENTHA OIL FEB 1516.00 14.12.17 Down 1674.20 - 1580.00 1600.00
MCX CARDAMOM FEB 1137.50 07.12.17 UP 1045.60 1100.00 - 1080.00
MCX SILVER MAR 39707.00 24.01.18 UP 39707.00 39000.00 - 38500.00
MCX GOLD FEB 30249.00 11.01.18 UP 29390.00 29800.00 29500.00
MCX COPPER FEB 454.10 21.12.17 UP 456.75 447.00 - 445.00
MCX LEAD FEB 168.00 20.07.17 UP 141.25 162.00 - 160.00
MCX ZINC FEB 219.85 29.12.17 UP 211.95 212.00 - 210.00
MCX NICKEL FEB 860.50 21.12.17 UP 775.80 830.00 - 800.00
MCX ALUMINIUM FEB 142.85 29.12.17 UP 145.60 139.00 - 137.00
MCX CRUDE OIL FEB 4136.00 27.09.17 UP 3416.00 4050.00 - 4000.00
MCX NATURAL GAS FEB 195.50 11.01.18 UP 195.40 190.00 185.00

NEWS DIGEST
Strong movements were witnessed in commodity markets and first time in multi years CRB is now trading comfortably above the mark of 200. It was not the core strength of commodities which sent commodities prices higher rather it was the weakness in dollar index, which stimulated buying in this complex. The dollar came under heavy selling pressure after Treasury Secretary Steven Mnuchin signalled his endorsement of a low dollar. Gold futures settled at the highest since August 2016, as investors got behind a rally brought on by a falling dollar. Volume soared in the futures market, with trading more than double the daily average. Holdings in exchange-traded funds backed by the metal climbed to the highest since May 2013 and the dollar dropped to the lowest against trading partners since 2014. January is traditionally gold’s strongest month, as consumers in top buyer China snap up metal ahead of the Lunar New Year. Silver danced on the tune of gold and traded near 40000 level in MCX. Energy complex was again on fire. Both crude and natural gas prices moved up. Brent oil prices hit $71 per barrel on Thursday for the first time since 2014 as the dollar continued to weaken and crude inventories in the United States fell for a 10th straight week amid ongoing supply cutbacks by OPEC and top producer Russia. U.S. West Texas Intermediate (WTI) crude futures climbed to $66.35 per barrel, also the highest level since early December 2014. U.S. crude inventories fell 1.1 million barrels in the week to Jan. 19, to 411.58 million barrels, the Energy Information Administration (EIA) said on Wednesday. Natural gas prices saw massive upside as forecasts for frigid temperatures across the U.S. east coast during early February boosted demand expectations. Natural gas prices typically rise during the winter months as colder weather sparks indoor-heating demand.
Aggressive buying was witnessed in agri counter. Guar was on run on reignited crude prices. Soyabean traded in upper circuit on strong cues from spot market. Mustard seed and edible oils followed the trend of soyabean and international firm market. In CME, soybeans rose for a ninth consecutive session on Thursday, the longest unbroken gaining run in nearly six years, as dry weather in Argentina hit crop yields and a weaker U.S. dollar made greenback-priced commodities cheaper. Castor prices revived after an eight week continuous fall. Mentha traded weak on bearish cues from spot market.
WEEKLY COMMENTARY
COMMODITY UNIT 18.01.18 24.01.18 DIFFERENCE
QTY. QTY.BARLEY MT 150 150 0CASTOR SEED MT 18830 17498 -1332CHANA MT 3452 208 -3244CORIANDER NEW MT 14360 13753 -607COTTON SEED OIL CAKE MT 21560 21286 -274GUARGUM MT 24306 24025 -281GUARSEED MT 28205 28329 124JEERA NEW MT 8544 7307 -1237MAIZE KHARIF MT 60 60 0PEPPER MT 5 5 0RM SEED MT 7261 7766 505SOYBEAN MT 168825 169351 526WHEAT MT 5074 4076 -998
COMMODITY UNIT 18.01.18 24.01.18 DIFFERENCE
QTY. QTY.
BLACK PEPPER MT 3.01 3.01 0.00
CARDAMOM MT 5.70 7.20 1.50
COTTON BALES 56100.00 63400.00 7300.00
GOLD KGS 50.00 20.00 -30.00
GOLD MINI KGS 5.90 5.90 0.00
GOLD GUINEA KGS 4.88 4.88 0.00
MENTHA OIL KGS 932027.90 841266.05 -90761.85
SILVER (30 KG Bar) KGS 17790.45 17998.80 208.35
China's imports of scrap copper fell 19.8% in
December from a year earlier, as the country
continues a clampdown on taking foreign waste.
The EIA forecast that total US oil output will hit
10.27 million bpd in 2018.
China will ease restrictions for foreign companies
in its manufacturing and services sectors.
The IMF expects the U.S. economy to expand by
2.7% in 2018, much higher than the 2.3% the fund
forecast in October.
The central government has approved
procurement of 53,600 tn tur and 50,000 tn chana
in Telangana under the price support scheme. Tur
procurement in the state will be carried out till
Feb 28 and chana purchases will start on Feb 1 and
will continue for 90 days.
The government has extended the deadline for
exporters to apply for allocation of a raw sugar
quota for the US to Jan 29 from Dec 31. Shipments
of sugar will be subject to 20% export duty.
WEEKLY STOCK POSITIONS IN WAREHOUSE (MCX)WEEKLY STOCK POSITIONS IN WAREHOUSE (NCDEX)
NCDEX TOP GAINERS & LOSERS (% Change) MCX TOP GAINERS & LOSERS (% Change)
12
5.85%
5.41% 5.38%
2.97% 2.95%
-3.01% -2.89% -2.89%
-2.17% -2.01%
-4%
-3%
-2%
-1%
0%
1%
2%
3%
4%
5%
6%
7%
GUARGUM SOYABEAN GUAR SEEDOIL CAKE
CORIANDER COPPER KAPAS COTTON SEED OIL CAKE
PEPPER BARLEY
9.24%
6.15%
2.80%2.33%
1.92%
-3.05%-2.66%
-4%
-2%
0%
2%
4%
6%
8%
10%
NATURAL GAS NICKEL CPO CRUDE OIL GOLD GUINEA COTTON MENTHA OIL

COMMODITY
PRICES OF METALS IN LME/ COMEX/ NYMEX (in US $)
WEEKLY STOCK POSITIONS IN LME (IN TONNES)
INTERNATIONAL COMMODITY PRICES
SPOT PRICES (% change) US Dollar Index (USDX)
The US Dollar Index (USDX) is an index, which measures the value of the US dollar
relative to a basket of foreign currencies. It is an exchange traded index and has
become a standard used worldwide. This index started in 1973 with a base of 100
and the movement of the index is relative to this base. This means that a value of
120 would suggest that the U.S. dollar experienced a 20% increase in value over the
time period. Currently, it is traded on the New York Board Of Trade. USDX can be
traded as a futures contract on the Inter Continental Exchange (ICE). It is also
available in exchange Traded Funds (ETFs), options and mutual funds.
Composition
At present, this index is
calculated by factoring in the
exchange rates of six major
world currencies:
Since its inception i.e in 1973, it
has traded as high as 164.7200 in
February 1985, and as low as
70.698 on March 16, 2008.
THE IMPACT OF DOLLAR INDEX
The US Dollar as an international
reserve currency is considered as a safe haven like Gold, Japanese Yen, and Swiss
Francs etc. by global investors. In the wake of any looming global crisis, the risk
aversion for investor increases causing a flow of funds from high risk market to safe
haven like US Dollar. This results in increase of US Dollar Index. A rising dollar is non
inflationary. Ideally, commodity prices moves inversely to the US Dollar Index. CRB
index, a diverse group of commodity prices, tends to move lower when the dollar
moves higher. It means a rising dollar against other major currencies eventually
produces lower commodity prices that are priced in USD such as gold, silver, crude,
copper etc. Lower commodity prices, in turn, lead to lower interest rates and
higher bond prices. When the value of the dollar weakens against other major
currencies, the prices of commodities generally move higher. The primary reason is
that the dollar is the benchmark
pricing mechanism for most
commodit ies. Sometimes
individual commodities can also
resist the trend if other
overwhelming forces (demand-
supply) are causing the price to
move along with the dollar. If
the fundamentals are stable,
the impact of Dollar Index on
commodity prices is very high.
The above chart shows how this inverse relationship works. The green line
represents the dollar index and the red line is the CRB Index. CRB has negative
correlation with Dollar index. Currently, many international developments are
determining the movement of dollar index. Investors rush to the safety of the
dollar when risk in the market increases. So, in order to determine the trend of
commodities prices, investor should investigate the broader relation between
USDX and commodities.
13
COMMODITY EXCHANGE CONTRACT UNIT 19.01.18 24.01.18 CHANGE(%)
Soybean CBOT MAR Dollars Per Bushel 977.25 992.25 1.53
Soy oil CBOT MAR Cents per Pound 32.48 32.87 1.20
CPO BMD APR MYR per MT 2445.00 2521.00 3.11
Cotton ICE MAR Cents per Pound 83.42 82.27 -1.38
COMMODITY EXCHANGE CONTRACT 19.01.18 24.01.18 CHANGE%
ALUMINIUM LME CASH 2256.00 2216.00 -1.77
COPPER LME CASH 7079.00 6943.00 -1.92
LEAD LME CASH 2608.00 2612.00 0.15
NICKEL LME CASH 12595.00 13000.00 3.22
ZINC LME CASH 3463.00 3428.00 -1.01
GOLD COMEX FEB 1333.10 1356.30 1.74
SILVER COMEX MAR 17.04 17.49 2.64
LIGHT CRUDE OIL NYMEX FEB 63.37 65.61 3.53
NATURAL GAS NYMEX FEB 3.19 3.51 10.03
COMMODITY STOCK POSITION STOCK POSITION DIFFERENCE
18.01.18 24.01.18
ALUMINIUM 1088725 1086200 -2525
COPPER 204675 248075 43400
NICKEL 364968 362868 -2100
LEAD 140125 138600 -1525
ZINC 180100 179550 -550
-3.67
-3.47
-2.88
-2.43
-2.01
-1.60
-1.18
-1.13
-1.07
-0.75
0.63
0.84
0.90
4.52
4.63
6.11
-6.00 -4.00 -2.00 0.00 2.00 4.00 6.00 8.00
PEPPER MALABAR GAR (KOCHI)
JEERA (UNJHA)
SUGAR (KOLKATA)
RAW JUTE (KOLKATA)
COTTON SEED OIL CAKE (AKOLA)
GUR (MUZAFFARNGR.)
TURMERIC (NIZAMABAD)
WHEAT (DELHI)
COTTON (KADI)
BARLEY (JAIPUR)
MUSTARD (JAIPUR)
CORIANDER (KOTA)
CRUDE PALM OIL (KANDLA)
GUAR GUM (JODHPUR)
GUAR SEED (JODHPUR)
SOYABEAN (INDORE)
Source : FXstreet.com
Source: Reuter and SMC research

CURRENCY
Currency Table
Currency Pair Open High Low Close
USD/INR 63.78 64.05 63.62 63.67
EUR/INR 78.22 78.63 78.09 78.52
GBP/INR 88.71 89.82 88.60 89.75
JPY/INR 57.74 58.17 57.41 58.12
News Flows of last week
EUR/INR (FEB) contract closed at 78.86 on 24th January’18. The contract made its high of 78.97 on 24th Januaryr’18 and a low of 78.43 on 23rd January’18 (Weekly Basis). The 14-day Exponential Moving Average of the EUR/INR is currently at 78.12.
On the daily chart, EUR/INR has Relative Strength Index (14-day) value of 68.41.One can buy around 79.10 for a target of 80.10 with the stop loss of 78.60
(* NSE Currency future, Source: Reliable, Open: Monday 9.00 AM IST, Close: Wednesday (5.00 PM IST)
23rd Jan BoJ kept stimulus unchanged, retains inflation forecast
23rd Jan UK Logged smallest budget deficit for December since 2000
24th Jan Euro zone Private sector logged fastest growth in nearly 12 Years
24th Jan UK Jobless Rate at 42-Year low; Employment at record high
24th Jan U.S. existing home sales pulled back more than expected in
December
25th Jan Yuan rose to highest since Nov 2015 after Mnuchin's remarks
Market Stance
Indian rupee tested one week high as against the dollar on the back of weak
dollar overseas, which slide to three year low as against a basket of major
peers pressured by simmering concerns that the US currency's yield advantage
will start to erode as major central banks head toward unwinding their
massive stimulus. The dollar index, which measures the greenback's value
against a basket of six major currencies, fell below the 90.00 threshold for the
first time since December 2014. Against the yen, the dollar fell below the 110
threshold for the first time in four months. The yen has gained a lift in recent
weeks, after the Bank of Japan trimmed its buying of long-dated government
bonds in market operations earlier this month, sparking speculation of an
eventual exit from its large stimulus. In other currencies China's yuan rally
against the US dollar to its strongest since November 2015, underpinned by a
slump in the greenback after the US Treasury secretary said he welcomed a
weaker dollar.
EUR/INR
USD/INR (FEB) contract closed at 63.87 on 24thJanuary’18. The contract made its high of 64.24 on 22nd January’18 and a low of 63.82 on 24thJanuary’18 (Weekly Basis). The 14-day Exponential Moving Average of the USD/INR is currently at 64.05.
On the daily chart, the USD/INR has Relative Strength Index (14-day) value of 38.85. One can sell below 63.75 for the target of 63.15 with the stop loss of 64.05.
GBP/INR (FEB) contract closed at 90.10 on 24th January’18. The contract made its high of 90.19 on 24th January’18 and a low of 88.94 on 22nd January’18 (Weekly Basis). The 14-day Exponential Moving Average of the GBP/INR is currently at 88.39.
On the daily chart, GBP/INR has Relative Strength Index (14-day) value of 79.66. One can buy around 90.45 for a target of 91.65 with the stop loss of 89.85
JPY/INR (FEB) contract closed at 58.35 on 24th January’18. The contract made its high of 58.40 on 23rd January’18 and a low of 57.65 on 23rd January’18 (Weekly Basis). The 14-day Exponential Moving Average of the JPY/INR is currently at 57.76.
On the daily chart, JPY/INR has Relative Strength Index (14-day) value of 61.24. One can buy around 58.35 for a target of 59.35 with the stop loss of 57.75
USD/INRTechnical Recommendation
Economic gauge for the next week
Date Currency Event Previous
29th Jan USD Core Personal Consump Exp - Price Index (MoM) 0.1
29th Jan USD Core Personal Consump Exp - Price Index (YoY) 1.5
30th Jan EUR Gross Domestic Product s.a. (YoY) 2.6
30th Jan EUR Gross Domestic Product s.a. (QoQ) 0.6
31st Jan EUR Consumer Price Index (YoY) 1.4
31st Jan EUR Consumer Price Index - Core (YoY) 1.1
31st Jan USD Fed's Monetary Policy Statement
31st Jan USD Fed Interest Rate Decision 1.5
01st Feb USD ISM Manufacturing PMI 59.7
01st Feb USD ISM Prices Paid 69
02nd Feb USD Nonfarm Payrolls 148
02nd Feb USD Unemployment Rate 4.1
GBP/INR JPY/INR
14
IPO
About the Company
Incorporated in 1986, Galaxy Surfactants Limited is a manufacturer of surfactants and other specialty
ingredients for the personal care and home care industries. The company manufactures are commonly used
in consumer-centric personal care and home care products like skin care, oral care, hair care, cosmetics,
toiletries and detergent products. Galaxy surfactants product portfolio includes over 200 product grades,
which are marketed to over 1,700 customers in 70 countries. Galaxy surfactants products are classified in 2
categories, namely Performance Surfactants and Speciality Care Products.
Strength
Established Global Supplier to Major FMCG Brands with Demonstrated Track Record: The company
believes that its robust product portfolio and expanded geographical footprint enable the company to
provide integrated solutions to a wide array of customers, whether they be established multinationals or
emerging players in local markets. In Fiscal 2017, 52%, 8% and 40% of its total revenues from operations
were derived from multinational customers, regional customers and local customers, respectively.
Proven R&D Capabilities with Dedicated Focus on Innovation: It’s dedicated and experienced in-house
R&D team, which comprised 63 employees as of September 30, 2017, focuses on the development of high-
performance products and formulations for the consumer-centric personal care and home care segments.
Global Footprint Supporting Local Reach: Over the years, the company has successfully diversified both its
product profile and geographical footprint by way of organic growth and inorganic expansions. The
company believes that its diversified footprint, in both mature and emerging geographies, enables it to
observe, analyse and adapt to evolving consumer preferences.
Strong Presence in High Growth Markets of India and AMET Region: The market for personal care
products in India was USD 11.36 Billion in Fiscal 2015, and is expected to grow at a CAGR of 7.9%, to touch
USD 22.52 Billion by 2024. Further, the market for home care products in India was USD 2.31 Billion in Fiscal
2015, and is expected to grow at a CAGR of 7.2%, to touch USD 4.32 Billion by 2024. Between Fiscals 2014
and 2017, the total revenues of Galaxy Chemicals (Egypt) S.A.E. have grown at a CAGR of 22.31%, which
reflects the growth in its market presence in the AMET region.
Track Record of Robust Financial Performance: The company believes that its robust financial performance
reflects the efficacy of the manufacturing and supply-chain management protocols that the company has
implemented. Its steady operating cash flows enable the company to meet the present and future needs of its
customers while its strong balance sheet and financial performance instil confidence in them.
Strategy
Increasing the Share of Speciality Care Products in its Sales Mix: The company intends to leverage the
long-standing relationships that the company has with its existing multinational, regional and local
customers for Performance Surfactants in emerging markets and address their imminent requirements by
crossselling its diverse portfolio of Speciality Care Products.
Continue to Focus on R&D and Product Innovation as part of its ‘Consumer to Chemistry’ Approach: The
company believes that its focus on product innovation through continuous R&D has been critical to the
growth of its business. In the years to come, the company intends to continue invest in, and undertake,
product innovation with its characteristic ‘Consumer to Chemistry’ approach, and specifically focus on
certain Speciality Care Products such as mild surfactants, rheology modifiers, pearlizing agents, UV filters,
syndets and transparent bathing bars, surfactant blends and proteins.
Mutually Complimentary Two-pronged Strategy to Drive Growth in both Emerging and Mature Markets:
The company believes that its strong manufacturing capabilities, established customer relationships and
robust product portfolio leave the company uniquely positioned to exploit the opportunities offered by the
expected growth in the personal care and home care segments in India and the AMET region. The company
intends to focus on leveraging such opportunities to increase sales and cross-sales of its Performance
Surfactants and Speciality Care Products in the years to come.
Continue Improving Financial Performance through Focus on Operational Efficiencies and Functional
Excellence: The company believes that the various strategic initiatives that the company has
implemented, including the continued investment in its manufacturing facilities, developing and
enhancing its in-house capabilities, and its supply-chain management protocols will continue to play a
critical role in its future success.
Risk
The business of the company is dependent on its manufacturing facilities
The company does not have long-term agreements with suppliers for its raw materials
Derives a significant portion of its revenue from a few major customers
Outlook
The company is established global supplier to major FMCG brands. Over the years, GSL has significantly
expanded and diversified its product profiles, client base and geographical footprints. The company tried to
launch its maiden IPO in May 2011 for around Rs. 120 crore but had to withdraw it due to bad market
condition. It has no listed peers to compare with, thus it is a first mover in this segment.
GALAXY SURFACTANTS LIMITED
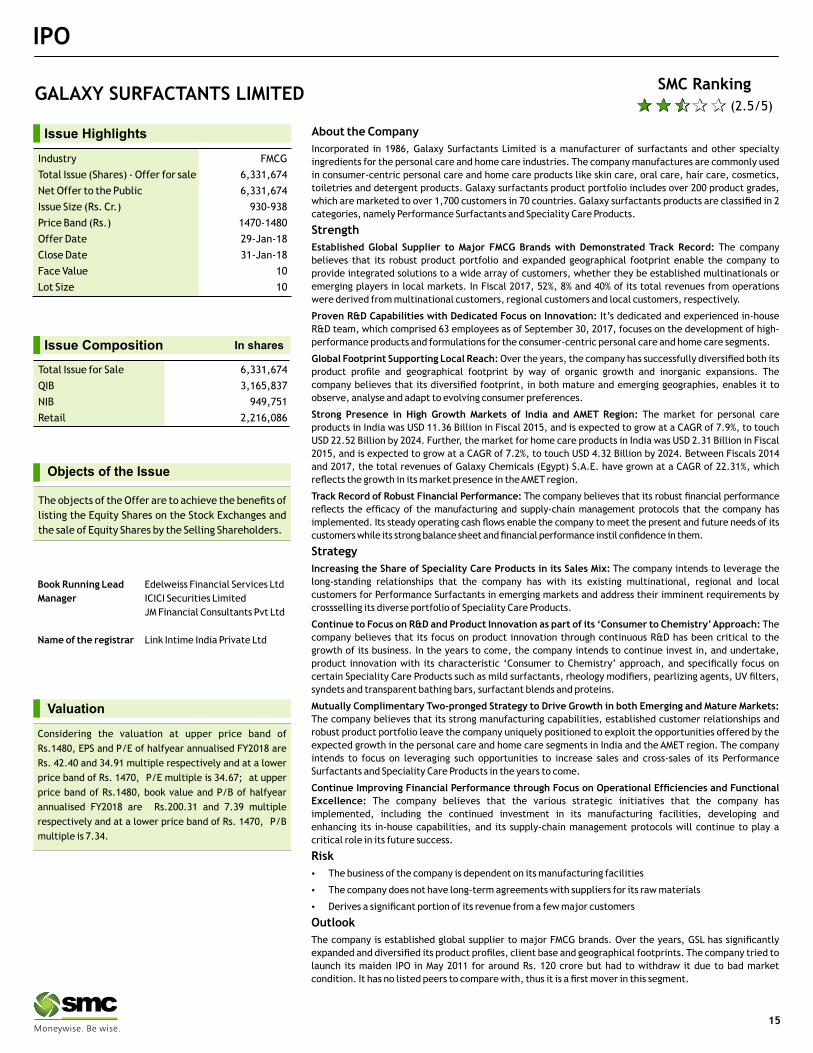
Issue Highlights
Industry FMCG
Total Issue (Shares) - Offer for sale 6,331,674
Net Offer to the Public 6,331,674
Issue Size (Rs. Cr.) 930-938
Price Band (Rs.) 1470-1480
Offer Date 29-Jan-18
Close Date 31-Jan-18
Face Value 10
Lot Size 10
Issue Composition
Total Issue for Sale 6,331,674
QIB 3,165,837
NIB 949,751
Retail 2,216,086
In shares
Valuation
Considering the valuation at upper price band of
Rs.1480, EPS and P/E of halfyear annualised FY2018 are
Rs. 42.40 and 34.91 multiple respectively and at a lower
price band of Rs. 1470, P/E multiple is 34.67; at upper
price band of Rs.1480, book value and P/B of halfyear
annualised FY2018 are Rs.200.31 and 7.39 multiple
respectively and at a lower price band of Rs. 1470, P/B
multiple is 7.34.
SMC Ranking
Book Running Lead Edelweiss Financial Services Ltd
Manager ICICI Securities Limited
JM Financial Consultants Pvt Ltd
Name of the registrar Link Intime India Private Ltd
Objects of the Issue
The objects of the Offer are to achieve the benefits of
listing the Equity Shares on the Stock Exchanges and
the sale of Equity Shares by the Selling Shareholders.
(2.5/5)
15

FIXED DEPOSIT MONITOR
* Interest Rate may be revised by company from time to time. Please confirm Interest rates before submitting the application.
* For Application of Rs.50 Lac & above, Contact to Head Office.
* Email us at [email protected]
FIXED DEPOSIT COMPANIES
PERIOD MIN.ADDITIONAL RATE OF INTEREST (%)
S.NO (NBFC COMPANY -NAME) 12M 18M 24M 36M 45M 48M 60M 84M INVESTMENT
1 BAJAJ FINANCE LTD.(UPTO RS. 5 CR.) 7.60 7.60 7.80 7.85 - 7.85 7.85 - 0.25% FOR SR. CITIZEN, 0.10% FOR 25000/-
EXISTING LOAN CUSTOMER AND ON RENEWAL
UPTO RS. 5CRORE
2 DEWAN HOUSING FINANCE CORPORATION LTD 13M=7.75% 14M=7.75% 18M=7.80% 13M=50000; 40M=7.90%
14M=10000; 0.25% EXTRA FOR SR CITIZEN, WIDOW, ARMED,
40M=2000 PERSONNEL, EXISTING DHFL HOME BORROWERS
3 DEWAN HOUSING FINANCE CORPORATION LTD (AASHRAY) 7.70 - 7.80 7.85 - 8.00 - 8.00 10,000/-
4 GRUH FINANCE LTD. 7.25 13M=7.25 7.25 7.25 - 7.25 7.00 7.00 96-120M=7.00%; 0.25% FOR FEMALE, 1000/-
SENIOR CITIZEN & TRUST
5 HDFC PREMIUM DEPOSIT FOR INDIVIUAL (UPTO RS. 2 CR.) 15M=7.50 22M= 7.50 30M=7.45 44M= 7.50 0.25% FOR SENIOR CITIZEN UPTO RS. 2 CR
- -6 HDFC SPECIAL DEPOSIT FOR INDIVIDUAL & TRUST 33M=7. 55 66M= 7.55 - - 0.25% FOR SENIOR CITIZEN UPTO RS. 2 CR (UPTO RS. 5 CR.)
- -7 HDFC PREMIUM DEPOSIT FOR TRUST & INSTITUTION 15M=7. 50 30M= 7.45 - - - (UPTO RS. 5 CR.)
8 HDFC LTD FOR INDIVIDUAL & TRUST (UPTO RS.3 CR.) 7.40 - 7.35 7.35 - 7.35 7.35 - 0.25% FOR SENIOR CITIZEN UPTO RS. 1 CR.
9 HUDCO LTD.(IND & HUF) 7.00 - 7.00 7.00 - 6.75 6.75 6.75 0.25% FOR SR. CITIZEN 10000/-
10 HUDCO LTD.(TRUST/CO/INSTITUTION) 6.75 - 6.75 6.75 - 6.50 6.50 6.50 - 10000/-
11 J K LAKSHMI CEMENT LTD. 8.00 - 8.25 8.35 - - - - 0.50% ADD. INTEREST TO SR. CITIZEN, 25000/-
EMPLOYEES, SHAREHOLDERS AND PERSON
INVESTING RS. 5 LACS AND ABOVE - MAX. 0.50%
12 J K TYRE INDUSTIRES LTD. 8.00 - 8.25 8.35 - - - - 0.50% ADD. INTEREST TO SR. CITIZEN, 25000/-
EMPLOYEES, SHAREHOLDERS AND PERSON
INVESTING RS. 5 LACS AND ABOVE - MAX. 0.50%
13 KTDFC (Kerela Transport) 8.25 - 8.25 8.25 - 8.00 8.00 - 0.25% EXTRA FOR SR. CITIZEN, 10000/-
14 LIC HOUSING FINANCE LTD. (UPTO RS. 5 CR.) 7.30 7.35 7.40 7.45 - - 7.45 - 0.25% FOR SENIOR CITIZEN IF APP ABOVE 10000/-
Rs. 50,000/- & 0.10% IF APP UPTO Rs. 50,000/-
15 M&M FINANCIAL SERVICES LTD (FOR BELOW RS. 1 CRORE) 7.50 7.50 7.50 7.55 - 7.55 7.55 - 0.25% FOR SENIOR CITIZEN 10000/-
16 OMAXE LTD. 10.50 - 11.00 11.50 - - - - 50000/-
17 PNB HOUSING FINANCE LTD.(UPTO RS. 5 CR.) 7.45 - 7.45 7.45 - 7.45 7.45 7.45 0.25% EXTRA FOR SR. CITIZEN UPTO RS.1 CRORE 20000/-
18 PNB HOUSING FINANCE LTD.(UPTO RS. 5 CR.) 15M=7.5 5 22M=7 .55 4 4M= 7.55 0.25% FOR SENIOR CITIZEN 30M=7.55
19 SHRIRAM TRANSPORT FINANCE-UNNATI SCHEME 7.50 - 7.50 7.85 - 7.90 8.00 - 0.25% FOR SENIOR CITIZEN 5000/-
20 SHRIRAM CITY UNION SCHEME 7.50 - 7.50 7.85 - 7.90 8.00 - 0.25% FOR SENIOR CITIZEN 5000/-
(FOR TRUST ONLY) (FOR WOMEN ONLY)
20000/- BUT
40000/-
IN MONTHLY
16

MUTUAL FUND
INDUSTRY & FUND UPDATE
HDFC MF to alter monthly dividend record date of HDFC Arbitrage Fund
HDFC Mutual Fund will revise the dividend record date under the monthly option of HDFC Arbitrage Fund - Wholesale Plan with effect from February 1,
the fund house said in a newspaper notice. Subsequently, the monthly dividend record date for the open-ended equity scheme will be second last
Thursday of every month, as against the current record date of Monday that precedes the last Thursday of every month. All other features of the
scheme remain unchanged.
Indiabulls Mutual Fund to revise features of ultra short term fund
Indiabulls Mutual Fund will revise the features of Indiabulls Ultra Short Term Fund as per the new guidelines issued by Securities Exchange Board of
India. Come February 25, the open-ended scheme will be classified as an open-ended ultra short term debt scheme, investing in portfolios with a
Macaulay duration between three and six months.
HSBC Mutual Fund to modify features on systematic plan facility from Feb 2
HSBC Mutual Fund will revise some features of the systematic plan facilities under its schemes, with effect from February 2, the fund house said in a
newspaper notice. Unit holders of all open-ended schemes of the fund house will be able to transfer their investments to another open-ended scheme
of the fund house under the systematic transfer facility. Currently, the facility is available to unit holders of only liquid and debt schemes of HSBC
Mutual Fund. The fund house further notified that the capital appreciation option under the systematic transfer facility, where the investment will
automatically be transferred to a chosen scheme upon reaching a specified value, is subject to a minimum of Rs 1,000.
Shriram Mutual Fund revises features of equity scheme as per SEBI norms
Shriram Mutual Fund has revised classification of Shriram Equity and Debt Opportunities Fund according to new guidelines issued by the Securities and
Exchange Board of India, the fund house said in a newspaper notice. Come Feb 23, the scheme will be categorised as an aggressive hybrid fund, as
against its current category of an open-ended equity-oriented fund. To bring uniformity, standardise scheme categories and enable ease of investment
to investors, the regulator, on Oct 6 had mandated fund houses to categorise all their existing and future schemes into five broad categories and 36 sub-
categories. Subsequently, the scheme will invest 65-80 percent corpus in equity, equity related instruments and derivatives and 20-35 percent in debt
instruments, including fixed or floating rate debt instruments and money market instruments. At present, the scheme allocates 65-85 percent in
equity, equity related instruments and derivatives and 15-35 percent in debt instruments, including fixed or floating rate debt instruments and money
market instruments. Unit holders, who do not agree with the changes, can avail the exit option between January 24 and February 22. All other features
of the scheme remain unchanged.
NEW FUND OFFER
Scheme Name SBI Long Term Advantage Fund - Series V- Regular Plan (G)
Fund Type Close-Ended
Fund Class Growth
Opens on 21-Dec-2017
Closes on 20-Mar-2018
Investment Objective The scheme seeks to generate capital appreciation over a period of ten years by investing predominantly in equity and equity-
related instruments of companies along with income tax benefit.
Min. Investment Rs.500/-
Fund Manager R. Srinivasan
Scheme Name UTI Long Term Advantage Fund - Series VII - Regular Plan (G
Fund Type Close-Ended
Fund Class Growth
Opens on 21-Dec-2017
Closes on 21-Mar-2018
Investment Objective The investment objective of the scheme is to provide medium to long term capital appreciation along with income tax benefit.
Min. Investment Rs.500/-
Fund Manager Sachin Trivedi
17

Note: Indicative corpus are including Growth & Dividend option . The above mentioned data is on the basis of 24/01/2018Beta, Sharpe and Standard Deviation are calculated on the basis of period: 1 year, frequency: Weekly Friday, RF: 7%
MUTUAL FUND Performance Charts
Returns (%) Risk Market Cap (%)
Scheme Name NAV Launch QAAUM 3M 6M 1Y 3Y Since Std.Dev Beta Jenson LARGE MID SMALL DEBT &
(`) Date (` Cr.) Launch CAP CAP CAP OTHER
BOI AXA Tax Advantage Fund - Eco - G 61.72 25-Feb-2009 118.16 12.65 23.96 52.36 15.94 22.64 1.94 0.85 0.21 18.98 62.78 15.20 3.04
BOI AXA Tax Advantage Fund - Reg - G 59.04 25-Feb-2009 118.16 12.44 23.46 51.15 15.09 22.03 1.94 0.85 0.19 18.98 62.78 15.20 3.04
IDFC Tax Advantage (ELSS) Fund - R - G 61.44 26-Dec-2008 773.80 12.56 18.56 48.62 17.06 22.12 1.78 0.83 0.18 40.18 37.33 16.15 6.33
Principal Tax Savings Fund 230.42 31-Mar-1996 376.73 10.98 17.20 45.00 16.79 17.65 2.09 1.05 0.17 52.55 40.76 5.74 0.95
Mirae Asset Tax Saver Fund - Reg - G 17.61 28-Dec-2015 686.10 11.08 16.10 44.80 N.A 31.32 1.84 0.95 0.22 63.09 31.34 3.63 1.93
Reliance Tax Saver (ELSS) Fund - G 70.18 21-Sep-2005 10000.30 12.44 16.48 39.84 12.98 17.09 2.12 1.06 0.11 55.92 30.13 12.70 1.26
L&T Tax Advantage Fund - Reg - G 59.56 27-Feb-2006 2740.53 10.19 14.50 39.78 15.81 16.16 1.74 0.87 0.17 51.10 39.50 5.90 3.51
TAX Fund Due to their inherent long term nature, the following 3 categories have been sorted on the basis of 1 year returns
Returns (%) Risk Market Cap (%)
Scheme Name NAV Launch QAAUM 3M 6M 1Y 3Y Since Std.Dev Beta Jenson LARGE MID SMALL DEBT &
(`) Date (` Cr.) Launch CAP CAP CAP OTHER
HDFC Small Cap Fund - Growth 47.33 03-Apr-2008 1666.03 17.20 24.14 57.30 21.74 17.16 2.05 0.88 0.28 0.96 50.97 32.51 15.56
L&T Emerging Businesses F - R- G 29.13 12-May-2014 2650.70 11.35 17.90 56.41 26.09 33.43 2.02 0.80 0.35 N.A 53.75 29.30 16.96
Reliance Small Cap Fund - Growth 48.56 16-Sep-2010 5395.58 16.21 24.05 55.38 24.08 23.94 2.24 0.86 0.31 2.40 42.33 47.78 7.49
IDFC Sterling Equity F - R - G 59.69 07-Mar-2008 1981.15 12.06 18.74 54.06 17.39 19.80 2.10 0.88 0.22 18.85 57.00 17.06 7.09
Edelweiss Mid and Small Cap F- G 31.40 26-Dec-2007 535.81 16.25 23.56 49.23 18.64 12.01 1.91 0.84 0.21 11.06 65.22 17.60 6.12
Aditya Birla Sun Life Pure Value F - G 69.07 27-Mar-2008 2180.73 8.41 26.14 48.48 20.87 21.71 2.28 1.01 0.23 24.78 60.78 11.50 2.95
HSBC Midcap Equity Fund - Growth 65.04 19-May-2005 565.68 11.56 20.32 46.48 18.99 15.90 2.47 1.02 0.20 6.15 47.16 41.88 4.81
EQUITY (Diversified) Due to their inherent long term nature, the following 3 categories have been sorted on the basis of 1 year returns
Annualised
Returns (%) RiskAverage Yield till
Scheme Name NAV Launch QAAUM Since Std. Sharpe
1W 2W 1M 6M 1Y 3YMaturity (Years) Maturity
(`) Date (`Cr.) Launch Dev.
BOI AXA Corp Credit Spectrum F-R-G 13.13 27-Feb-2015 1372.00 5.49 7.61 6.97 6.29 8.82 N.A 9.81 7.63 0.37 3.07 11.56
Franklin India Income Oppt F- G 20.31 11-Dec-2009 3278.85 6.68 5.72 6.04 6.24 8.13 8.48 9.11 12.94 0.09 2.35 10.16
Baroda Pioneer Credit Oppt F-R-G 13.29 23-Jan-2015 923.61 5.30 4.64 4.82 5.30 7.61 N.A 9.91 8.59 0.27 2.70 8.85
Aditya Birla Sun Life Corp Bond F-R-G 12.73 17-Apr-2015 4444.82 6.65 6.82 6.28 4.44 7.57 N.A 9.08 11.50 0.16 2.40 9.80
Franklin India IBA - Growth 60.29 23-Jun-1997 953.45 6.19 6.29 6.26 5.01 7.12 8.03 9.11 11.95 0.08 2.60 9.40
DHFL Pramerica Credit Oppt F-R-G 13.58 29-Sep-2014 940.97 4.88 4.98 4.71 5.08 6.90 9.03 9.64 7.79 0.16 2.83 8.86
Axis Regular Savings Fund - Growth 16.70 28-Mar-2012 1060.73 5.34 6.15 5.24 5.25 6.87 8.06 9.20 16.54 0.13 2.60 8.54
INCOME FUND
Returns (%) Risk Average Yield tillScheme Name NAV Launch QAAUM Since Std. Sharpe
1W 2W 1M 6M 1Y 3YMaturity (Years) Maturity
(`) Date (`Cr.) Launch Dev.
Franklin India STIP - Growth 3609.21 31-Jan-2002 9065.18 6.02 6.28 6.00 5.91 8.11 8.42 8.36 12.94 0.08 2.39 10.26
L&T Short Term Income Fund - R - G 18.45 04-Dec-2010 1085.65 5.49 5.12 5.56 5.84 7.48 8.77 8.95 6.57 0.26 1.44 8.55
Baroda Pioneer Short Term Bond F - G 18.19 30-Jun-2010 619.41 3.84 3.63 4.89 5.46 7.02 8.39 8.22 5.10 0.23 1.84 8.72
HDFC Short Term Opportunities F - G 18.91 25-Jun-2010 10465.20 4.55 4.52 5.15 4.90 6.18 7.98 8.76 6.04 0.10 1.62 7.72
Kotak Income Opportunities F - R - G 18.85 11-May-2010 4982.15 8.51 7.60 5.59 4.73 6.00 8.53 8.57 9.66 0.12 2.56 8.91
Aditya Birla Sun Life Short Term F- DAP 20.16 06-Mar-2009 20892.00 4.35 4.74 4.52 4.30 5.99 8.37 8.20 9.46 0.11 2.00 7.72
HDFC Regular Savings Fund - Growth 34.01 28-Feb-2002 5476.23 5.39 5.01 4.93 4.30 5.99 8.46 7.99 6.87 0.14 1.88 8.45
SHORT TERM FUND Due to their inherent short term nature, Short term funds have been sorted on the basis of 6month returns
Annualised
Returns (%) Risk Market Cap (%)
Scheme Name NAV Launch QAAUM 3M 6M 1Y 3Y Since Std.Dev Jenson LARGE MID SMALL DEBT &
(`) Date (` Cr.) Launch CAP CAP CAP OTHER
Principal Balanced Fund - Growth 78.52 14-Jan-2000 642.80 6.32 13.37 34.45 15.20 12.10 1.49 0.16 38.57 22.24 5.66 33.52
Reliance RSF - Balanced - Growth 57.00 08-Jun-2005 10233.40 6.47 9.16 28.39 12.11 14.76 1.43 0.05 56.09 10.94 1.56 31.40
HDFC Prudence Fund - Growth 543.79 01-Feb-1994 35476.90 11.35 10.29 27.00 11.64 19.42 1.79 0.06 52.37 9.76 0.68 37.19
Mirae Asset Prudence Fund - Reg - G 14.26 29-Jul-2015 914.48 7.00 10.29 26.92 N.A 15.29 1.41 0.06 64.63 9.32 0.84 25.21
HDFC Balanced Fund - Growth 155.59 11-Sep-2000 17558.10 7.58 9.06 26.68 12.46 17.11 1.35 0.09 42.23 26.27 2.51 28.99
SBI Magnum Balanced Fund - Growth 130.88 09-Oct-1995 17372.60 7.45 11.01 26.28 11.29 16.47 1.24 0.05 38.91 28.11 1.40 31.58
L&T India Prudence Fund - Reg - G 27.20 07-Feb-2011 8052.02 6.67 8.03 25.56 12.47 15.45 1.33 0.05 47.88 21.80 2.21 28.10
BALANCED
18

