from cellulose to kerogen: molecular simulation of a
TRANSCRIPT

HAL Id: hal-01724050https://hal.archives-ouvertes.fr/hal-01724050
Submitted on 11 May 2018
HAL is a multi-disciplinary open accessarchive for the deposit and dissemination of sci-entific research documents, whether they are pub-lished or not. The documents may come fromteaching and research institutions in France orabroad, or from public or private research centers.
L’archive ouverte pluridisciplinaire HAL, estdestinée au dépôt et à la diffusion de documentsscientifiques de niveau recherche, publiés ou non,émanant des établissements d’enseignement et derecherche français ou étrangers, des laboratoirespublics ou privés.
From cellulose to kerogen: molecular simulation of ageological process
Lea Atmani, Christophe Bichara, Roland J.-M. Pellenq, Henri van Damme,Adri van Duin, Zamaan Raza, Lionel Truflandier, Amaël Obliger, Paul
Kralert, Franz Ulm, et al.
To cite this version:Lea Atmani, Christophe Bichara, Roland J.-M. Pellenq, Henri van Damme, Adri van Duin, et al..From cellulose to kerogen: molecular simulation of a geological process. Chemical Science , The RoyalSociety of Chemistry, 2017, 8 (12), pp.8325 - 8335. �10.1039/C7SC03466K�. �hal-01724050�

ChemicalScience
EDGE ARTICLE
Ope
n A
cces
s A
rtic
le. P
ublis
hed
on 1
0 O
ctob
er 2
017.
Dow
nloa
ded
on 1
1/05
/201
8 14
:44:
42.
Thi
s ar
ticle
is li
cens
ed u
nder
a C
reat
ive
Com
mon
s A
ttrib
utio
n-N
onC
omm
erci
al 3
.0 U
npor
ted
Lic
ence
.
View Article OnlineView Journal | View Issue
From cellulose to
aCNRS/MIT Joint Lab “MultiScale Materials
Energy Initiative, Massachusetts Institute ofbCNRS, Centre Interdisciplinaire des Nanos
Case 913, 13288 Marseille Cedex 9, FrancecDepartment of Civil and Environmental
Technology, Cambridge, MA 02139, USAdDepartment of Mechanical and Nuclear
University, University Park, Pennsylvania 16eInstitut des Sciences Moleculaires, Univ. Bor
Liberation, 33405 Talence, FrancefSpecialist Geoscience, Upstream Developm
Solutions International BV, Kessler Park 1,gCNRS, Laboratoire des Composites Therm
CEA-Universite de Bordeaux, 3 allee de la
† Electronic supplementary information (and S2. See DOI: 10.1039/c7sc03466k
Cite this: Chem. Sci., 2017, 8, 8325
Received 8th August 2017Accepted 10th October 2017
DOI: 10.1039/c7sc03466k
rsc.li/chemical-science
This journal is © The Royal Society of C
kerogen: molecular simulation ofa geological process†
Lea Atmani,ab Christophe Bichara,b Roland J.-M. Pellenq,abc Henri Van Damme,a
Adri C. T. van Duin,d Zamaan Raza,a Lionel A. Truflandier,e Amael Obliger,a
Paul G. Kralert,f Franz J. Ulmac and Jean-Marc Leyssale *ag
The process by which organic matter decomposes deep underground to form petroleum and its underlying
kerogen matrix has so far remained a no man’s land to theoreticians, largely because of the geological
(Myears) timescale associated with the process. Using reactive molecular dynamics and an accelerated
simulation framework, the replica exchange molecular dynamics method, we simulate the full
transformation of cellulose into kerogen and its associated fluid phase under prevailing geological
conditions. We observe in sequence the fragmentation of the cellulose crystal and production of water,
the development of an unsaturated aliphatic macromolecular phase and its aromatization. The
composition of the solid residue along the maturation pathway strictly follows what is observed for
natural type III kerogen and for artificially matured samples under confined conditions. After expulsion of
the fluid phase, the obtained microporous kerogen possesses the structure, texture, density, porosity and
stiffness observed for mature type III kerogen and a microporous carbon obtained by saccharose
pyrolysis at low temperature. As expected for this variety of precursor, the main resulting hydrocarbon is
methane. The present work thus demonstrates that molecular simulations can now be used to assess,
almost quantitatively, such complex chemical processes as petrogenesis in fossil reservoirs and, more
generally, the possible conversion of any natural product into bio-sourced materials and/or fuel.
1 Introduction
Thermal annealing, or cracking, of organic matter results in theproduction of carbon-rich solids as well as hydrogen- andoxygen-rich uids. This very fundamental process can be usedto turn biomass products into various types of carbon-basedmaterial – microporous adsorbents or catalysts1,2 and carbonbers3 – or biofuels.4 In nature, organic matter degradationbegins on the earth surface but only signicantly proceeds when
Science for Energy and Environment”, MIT
Technology, Cambridge, MA 02139, USA
ciences de Marseille, Campus de Luminy,
Engineering, Massachusetts Institute of
Engineering, The Pennsylvania State
802, USA
deaux, CNRS UMR 5255, 351 Cours de la
ent, Projects & Technology, Shell Global
2288 GS Rijswijk, The Netherlands
ostructuraux, UMR 5801 CNRS-Safran-
Boetie, 33600 Pessac, France. E-mail:
ESI) available: Fig. S1–S6 and Tables S1
hemistry 2017
organic residues are buried in sedimentary basins, a few kmdeep, where increased temperature and pressure can activatethe process. From this geological decomposition originatespetroleum and a carbonaceous residue called kerogen, the mostabundant form of organic matter on the planet (�a thousandtime larger in mass than coal and petroleum in conventionalreservoirs).5
Kerogen formation operates at moderate depths, i.e. undermild conditions (below �350 K), where the remains of the mostresistant tissues of living organisms combine with smallermoieties coming from the microbial or chemical degradation ofless resistant biopolymers.6–12 At the end of a process calleddiagenesis7 this proto-kerogen turns into immature kerogen,a truly macromolecular hydrogen-rich solid, by further losingoxygen in the form of water, CO or CO2.
Kerogen “maturation” – actually, thermal decomposition – isconsidered to start when immature kerogen encounters morestressful geothermal conditions and becomes metastable,7 i.e.above �350 K. Weak C–S and C–O bonds break rst, producingbitumen that is highly enriched in polar compounds. C–Cbonds start breaking immediately aer, within the evolvedpolar compounds and in the residual kerogen, yieldinga hydrocarbon-rich uid.9 By convention, the term catagenesisrefers to the stages of kerogen decomposition during which oiland “wet gas” (C1–C6) are produced. Catagenesis ends around
Chem. Sci., 2017, 8, 8325–8335 | 8325

Chemical Science Edge Article
Ope
n A
cces
s A
rtic
le. P
ublis
hed
on 1
0 O
ctob
er 2
017.
Dow
nloa
ded
on 1
1/05
/201
8 14
:44:
42.
Thi
s ar
ticle
is li
cens
ed u
nder
a C
reat
ive
Com
mon
s A
ttrib
utio
n-N
onC
omm
erci
al 3
.0 U
npor
ted
Lic
ence
.View Article Online
450 K. It may be followed by metagenesis and late methane (or“dry gas”) production if more severe geothermal conditions areencountered.
Kerogens are usually classied into three main families,noted type I, II and III, depending on the origin of their parentorganic matter: marine for type I, lacustrine for type II andterrestrial for type III. On a more chemical ground, hydrogencontent decreases and oxygen content increases when goingfrom type I to type III. Hydrogen-rich type I and type II organicmatters generally retain a high aliphatic content in their cor-responding kerogen and are prone to produce oil during cata-genesis. Conversely, type III organic matter generally has low oilpotential and essentially produces methane during catagenesis.It is also worth noting that in the late stages of maturity, the endof catagenesis and metagenesis, all kerogen residues becomechemically very similar, whatever the type of living cell they arederived from. The principal difference between these aromaticchars is that those arising from type I or type II organic matterwill show extended graphene domains up to hundreds ofnanometers, whilst graphene domains in type III chars will onlygrow, at best, to around 10 nm.12,13
Both time and temperature are critical for kerogen matura-tion, each one of the two parameters being able to compensatefor the other,7 as shown by laboratory pyrolysis experiments14–16
and by numerous eld observations relating hydrocarbongeneration to subsidence depth and/or geothermal gradient.7–10
Quantitatively, the rate of petroleum formation and the kerogenmaturity indicators are exponentially related to temperatureand linearly related to time. Whereas pressure only has a secondorder inuence, it was demonstrated16 that connement effectsare crucial in order to accurately reproduce the maturationpathway in a van Krevelen diagram (H/C versus O/C). Transitionstate theory of rate processes is the perfect framework toaccount for these features and it is extensively used in petro-liferous basin modeling.17 The most popular formalism isa matrix of parallel rst-order kinetic reactions, the parametersof which – primarily the distributions of activation energies andthe frequency factors to a lesser extent – are determined byarticially heating immature source rock samples in far fromequilibrium conditions, at heating rates (�1 to 50 K min�1, upto 825 K (ref. 11)) or at isothermal temperatures (550–625 K)much higher than those found in sedimentary basins (�1 to 10K per My, up to �525 K (ref. 7 and 11)), and tting the data tothe kinetic model. Remarkably, as it was early recognized, whengeological heating rates are imposed, the kinetic model yieldskerogen maturity results comparable to what is observed in theeld.14,18
Aside from these efforts to investigate maturation kineticsand the nature and quantities of produced hydrocarbons, verylittle attention has been paid to the structure and properties ofthe corresponding kerogen. The rst structural models ofkerogen were hand-drawings based on chemical analysis and/ormicroscopy observations.19–21 Of particular interest was theseries of models proposed by Behar and Vandenbroucke for thethree types of kerogen at different maturities.20 The recentexploration and extraction of shale hydrocarbons has broughtinterest back into kerogen modeling, with characterization of
8326 | Chem. Sci., 2017, 8, 8325–8335
their porosity, mechanical and hydrocarbon transport proper-ties as the main aim. 3D atomistic kerogen models22–26 were rstgenerated by digitalization and migration into 3D of the early2D models of Behar and Vandenbroucke20 and Siskin et al.21
More recently, models of type II kerogen of various maturitieswere produced by Bousige et al.27 using a purely reconstructiveapproach, hybrid reverse Monte Carlo, which has the advantageof not having to presuppose any structural or chemical elementsother than the composition and density of the material. Allthese models have shown undeniable success in reproducingstructural properties, such as pair distribution functions(g(r))26,27 and spectroscopic (NMR) signatures26 as well as volu-metric and rheological observables.23,25 Most recent investiga-tions have also allowed the prediction of transport properties ofvarious hydrocarbons in the microporosity of kerogen28,29
and the ductile to brittle fracture transition induced bymaturation.27
In spite of these important achievements, two importantunresolved questions could still largely benet from modelingstudies. First, the relatively limited amount of experimentaldata (especially g(r)), and probably also of computationalresources, does not allow for a proper model of kerogen growthand maturation pathways, even though the latter wouldconstitute a crucial step in connecting kerogen maturity andproperties. Second, experimentally fed kerogen models do notallow for the prediction of their hydrocarbon potential, i.e. thenature and amounts of hydrocarbon than can be producedupon further maturation, an obvious aim in the context ofunconventional hydrocarbon extraction. Despite the apparentconict between geological time scales of oil and gas generation(10 s to 100 Myears) and those accessible to molecular simula-tions (milliseconds at best30), 20 orders of magnitude lower,a few recent studies based on reactive molecular dynamicssimulations report on the early stages of pyrolysis of variouskinds of organic matter.31–36 In these works, reactive processesare considerably accelerated by performing simulations attemperatures well above 1000 K,32–36 thus signicantly affectingthe thermodynamic conditions, or using accelerated samplingapproaches.31 However, because of timescale limitations, theapparition of kerogen remains entirely unexplored so far. Inwhat follows, we use reactive molecular dynamics37 within anaccelerated simulation framework, replica exchange moleculardynamics (REMD),38,39 and large scale computational resources(�one million hours CPU time40) to report on the decomposi-tion of cellulose, one of the principal constituents of terrestrialplants (type III organic matter), under typical geologicalconditions: 150 �C and 10–100 MPa. As we will demonstrate inthe following sections, we have been able to simulate theprocess up to a relatively advanced maturation stage, typical ofthe later stages of catagenesis, and to observe the formation ofmethane, the most expected hydrocarbon for such a non-aliphatic precursor.7
2 Methods
The present work is based on well-known molecular dynamicsmethods,41 either in the canonical (NVT) or isothermal–isobaric
This journal is © The Royal Society of Chemistry 2017

Edge Article Chemical Science
Ope
n A
cces
s A
rtic
le. P
ublis
hed
on 1
0 O
ctob
er 2
017.
Dow
nloa
ded
on 1
1/05
/201
8 14
:44:
42.
Thi
s ar
ticle
is li
cens
ed u
nder
a C
reat
ive
Com
mon
s A
ttrib
utio
n-N
onC
omm
erci
al 3
.0 U
npor
ted
Lic
ence
.View Article Online
(NPT) ensembles, where N, V, P and T refer to the number ofatoms, the volume, the pressure and the temperature, respec-tively. The velocity-verlet scheme42 is used with a 0.1 fs timestepto integrate the equations of motion and the Nose–Hoover andNose–Hoover–Andersen thermostat and barostat43 are used tox temperature and pressure, respectively. Time constants of0.05 and 0.5 ps are used for temperature and pressure relaxa-tions, respectively. Interatomic interactions are computed usingReaxFF37 by combining the Reax2013 C–C interaction parame-ters,44 which have demonstrated signicant improvement in thedescription of carbonaceous solids, with the C–O, C–H, O–O,O–H and H–H interaction parameters used in ref. 45 and 46.Periodic boundary conditions are always applied in the threecartesian directions and all the simulations are performedusing LAMMPS.47
More precisely, the REMD technique is used to study thecomplete transformation of cellulose into kerogen and itsassociated uid phase. REMD is an accelerated MD schemethat was initially developed to investigate the transformationof a protein from a non-folded out of equilibrium state to itsequilibrium folded state – a microsecond to millisecondprocess – from picosecond to nanosecond long MD simula-tions.38,48 It is based on the parallel simulation of manyreplicas of the same system, each operating at a differenttemperature using canonical (NVT) MD. Monte Carloattempts are then performed at regular time intervals toexchange congurations between replicas operating at closetemperatures. Accepting these attempts with probability
Aij ¼ minf1; exp��
1kBTi
� 1kBTj
��U i �U jÞ
�g – where i and j
are the IDs of two adjacent replicas, Ti and Tj their tempera-tures, and U i and U j their potential energies – ensures thateach replica will be driven towards its canonical equilibriumdistribution. This is where REMD signicantly differs fromconventional MD or MC methods. Although all of thesemethods tend to progressively decrease the prevailing ther-modynamic potential (Helmholtz free energy in the case ofsimulations in the canonical ensemble) until equilibrium isreached, MD and MC operate by crossing successively all thefree energy barriers separating the initial and equilibriumstates, generating a kinetic path to equilibrium. In REMD,most of these barriers are crossed at higher temperatures.This has the advantage of being considerably faster but thetrajectory to equilibrium may deviate from the kinetictrajectory as individual barriers are crossed on a different(high-temperature) free energy landscape. For this reason thepath followed by any replica in REMD can only be consideredas a thermodynamic path (i.e. a path of progressivelydecreasing free energy) as opposed to a kinetic path.
A rst REMD simulation is run for 750 ps in which all of thereplicas are initiated with a 4200-atom I-b cellulose crystal,constructed using the “Cellulose-builder” package49 at an initialdensity of 1.29 g cm�3. It uses 96 parallel replicas run in the(NVT) ensemble with an exponential spacing of temperaturesbetween adjacent replicas, from 423 to 3502 K. The maximumtemperature has been chosen using the experimental activation
This journal is © The Royal Society of Chemistry 2017
energy (47 kcal mol�1) and prefactor (6 � 1014 s�1) for cellulosepyrolysis50 to provide a decomposition time in the 1–100 psrange, easily accessible to MD. Note that this corresponds totimescales of around 1013 years and a few thousand years atroom and geological (150 �C) temperatures, respectively.Temperature swaps between two adjacent replicas, selected atrandom among all the replicas, are attempted every 10 fs. Theaverage acceptance rates for these attempts are found around20%, with low variability among the different replicas, indica-tive of a successful spacing of replicas in temperature space.This is also conrmed by visualization of the potential energyhistograms, showing reasonable overlap between replicas. Ascellulose conversion into kerogen produces an importantamount of uid, and because of the constant volume condition,the system pressure signicantly increases during the process.In order to maintain reasonable pressure conditions the REMDprocess is interrupted every time the pressure rises above200 MPa and the conguration of the 423 K replica is relaxed atthis temperature and at an imposed pressure of 25 MPa for 100ps using NPTMD. The resulting conguration is then attributedto all of the replicas and the REMD run resumed.
Aer this rst REMD run, all of the created uid moleculesare removed from the system and the resulting macromolecularphase (kerogen) is relaxed for 1 ns at 423 K and 25 MPa, duringwhich the kerogen densies. A subsequent REMD run islaunched for 1.8 ns on this solid phase, using the exact samesimulation parameters. During this run, congurations of the423 K replica are stored every 200 ps for analysis. The latter arerelaxed for 100 ps, again at 423 K and 25MPa, prior to structuraland volumetric characterizations.
Chemical analysis is based on the identication of inde-pendent molecular clusters, achieved using the followingcutoffs for covalent bonding: 1.9 A for C–C, C–O and O–O bonds,1.4 A for O–H bonds, and 1.1 A for H–H bonds. These valuesproduce reliable results as they fall in very low population areasof the corresponding partial pair distribution functions formost couples. The only difficulty is the O–H case because of thecomplexity arising from hydrogen bonds, with some hydrogenatoms being, in some particular congurations, difficult toassociate to one or another O atom, especially in water–hydro-nium couples. This difficulty does not affect any conclusions ofthe present work. Aside from standard coordination statistics,clustering algorithms are used to infer some textural elementsfrom the macromolecular phase present in the atomisticcongurations.
All primitive rings are identied using the shortest pathanalysis method51 and atom-sharing rings are regrouped intoring clusters. Similarly, all atoms that do not belong to any ringare designated as “chain” atoms and regrouped into chainclusters. Note that, even though related to the aromatic/aliphatic content, nothing guarantees here, for instance, thatthe rings are aromatic.
Some volumetric and structural properties, such as density,bulk modulus (B), and g(r), require time-averaging for suchsmall systems. These data are computed using 1 ns long NPTsimulations. Density and g(r) calculations are trivial. Bulkmoduli are computed from the volume uctuation method,41
Chem. Sci., 2017, 8, 8325–8335 | 8327

Chemical Science Edge Article
Ope
n A
cces
s A
rtic
le. P
ublis
hed
on 1
0 O
ctob
er 2
017.
Dow
nloa
ded
on 1
1/05
/201
8 14
:44:
42.
Thi
s ar
ticle
is li
cens
ed u
nder
a C
reat
ive
Com
mon
s A
ttrib
utio
n-N
onC
omm
erci
al 3
.0 U
npor
ted
Lic
ence
.View Article Online
1B¼ hV2i � hVi2
kBThVi ; where kB is the Boltzmann’s constant and h.istands for a time average.
Pore space properties, here including porosity fraction andpore size distributions (PSDs), should also, in theory, be time-averaged, however, as these calculations are associated withhigh computational cost, they are obtained here from single,equilibrated congurations. Porosity is computed as the frac-tion of the volume available to a CO2 molecule based on the vander Waals diameters of CO2 (3.74 A) and of the kerogen atoms(3.36, 3.17 and 2.42 A for C, O and H, respectively). It is obtainedby sampling 2 � 105 random locations within the volume. As inearlier works,27,29 PSDs are calculated using the Gelb and Gub-bins technique52 on this porous space, using about 104 pore sizeinvestigations at each location.
High-resolution transmission electron microscopy (HRTEM)images are simulated from atomistic models using a multisliceHRTEM simulation soware53 and standard microscopeparameters: Philips CM30ST microscope operated at 300 kV;�58 nm Scherzer defocus; 1.2 mm spherical aberration; 1.5 mmchromatic aberration; 7 nm spread of focus and aperture radiusof 4 nm�1.
3 Results and discussion3.1 Cellulose decomposition and kerogen formation
We start by describing the evolution of the low temperaturereplica (423 K), typical of geological conditions, during the rstREMD simulation. Fig. 1 shows that the crystal decomposesquickly and separates into a carbon-rich macromolecular (orsolid) phase, with high aromatic content, immersed ina hydrogen- and oxygen-rich uid phase comprised of smallmolecular species (see the inset in Fig. 1(a)). The huge potentialenergy release and the massive production of uid, increasingthe system entropy, conrm the scenario of an irreversible
Fig. 1 Replica exchange molecular dynamics (REMD) simulation of cellutime of (a) the potential energy and pressure; (b) the amount of some cocarbon atoms in molecular clusters containing more than twelve carbo(NPT) and the inset shows a snapshot of the system after 750 ps of REMD,(hydrogen); the carbon-richmacromolecular phase is displayed with thick(b) roughly indicate the three regimes observed during the simulation. A
8328 | Chem. Sci., 2017, 8, 8325–8335
process. Also noticeable is the signicant increase in pressuredue to uid production (Fig. 1(a)). This excess pressure wasreleased using short NPT MD simulations aer 25 ps, 100 psand 450 ps to maintain reasonable reservoir conditions. In thenal part of the simulation, energy and pressure reach a plateauthat is indicative of convergence to an equilibrium state, i.e.a state at which nomacroscopic observable evolves in time. Thiscould either be the true thermodynamic equilibrium state or(most probably) a metastable equilibrium state.
Fig. 1(b) shows the evolution with time of the numbers ofcommon volatile molecules (water, carbon monoxide anddioxide, and hydrogen) as well as the size of the macromolec-ular (solid) phase, arbitrarily dened as molecules with morethan 12 carbon atoms. Even though care must be taken as thepath followed by the system may be different from the truekinetic path (see discussion in the Methods section), this allowsbreaking down the process into three main steps. In agreementwith the commonly accepted mechanism of cellulose pyrol-ysis,54,55 we rst observe, in the initial 100 ps (REMD time), thefragmentation of the cellulose crystal into small molecular unitsassociated with the production of a large amount (around 300molecules) of water. Then, from 100 ps to approximately 600 ps,a carbon-rich macromolecular phase appears and progressivelygrows until it includes around 60% of the carbon atoms. In thissecond phase, a high amount of carbon monoxide and water,�250 molecules each, are produced as well as around 50hydrogen molecules. Carbon dioxide, on the other hand, is onlyobtained at a low concentration (around 5 molecules), althougha peak in its production is visible at 100 ps, when the carbon-rich phase starts growing. Noticeably, the amount ofproduced H2O, CO and CO2 and their order of appearance are invery fair agreement with results from pyrolysis experiments attemperatures below 1000 K.55 Above 600 ps, the system seems tohave reached an equilibrium state.
lose decomposition under geological conditions. Evolution with REMDmmon molecules produced during the simulation and the fraction ofn atoms. Red arrows in (a) indicate three pressure release simulationsatoms are colored according to: cyan (carbon), red (oxygen) and whiteer sticks to aid visualization. Dashed vertical lines and numbers in red inll data are from the 423 K replica of the first REMD simulation.
This journal is © The Royal Society of Chemistry 2017
Edge Article Chemical Science
Ope
n A
cces
s A
rtic
le. P
ublis
hed
on 1
0 O
ctob
er 2
017.
Dow
nloa
ded
on 1
1/05
/201
8 14
:44:
42.
Thi
s ar
ticle
is li
cens
ed u
nder
a C
reat
ive
Com
mon
s A
ttrib
utio
n-N
onC
omm
erci
al 3
.0 U
npor
ted
Lic
ence
.View Article Online
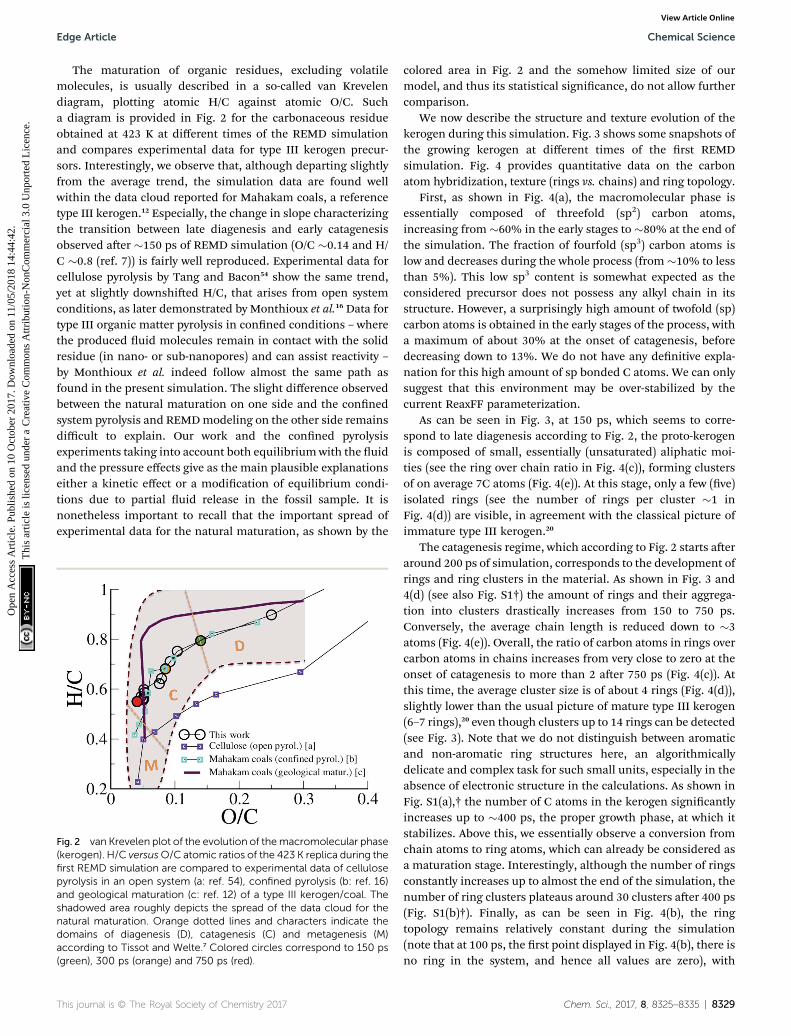
The maturation of organic residues, excluding volatilemolecules, is usually described in a so-called van Krevelendiagram, plotting atomic H/C against atomic O/C. Sucha diagram is provided in Fig. 2 for the carbonaceous residueobtained at 423 K at different times of the REMD simulationand compares experimental data for type III kerogen precur-sors. Interestingly, we observe that, although departing slightlyfrom the average trend, the simulation data are found wellwithin the data cloud reported for Mahakam coals, a referencetype III kerogen.12 Especially, the change in slope characterizingthe transition between late diagenesis and early catagenesisobserved aer �150 ps of REMD simulation (O/C �0.14 and H/C �0.8 (ref. 7)) is fairly well reproduced. Experimental data forcellulose pyrolysis by Tang and Bacon54 show the same trend,yet at slightly downshied H/C, that arises from open systemconditions, as later demonstrated by Monthioux et al.16 Data fortype III organic matter pyrolysis in conned conditions – wherethe produced uid molecules remain in contact with the solidresidue (in nano- or sub-nanopores) and can assist reactivity –
by Monthioux et al. indeed follow almost the same path asfound in the present simulation. The slight difference observedbetween the natural maturation on one side and the connedsystem pyrolysis and REMDmodeling on the other side remainsdifficult to explain. Our work and the conned pyrolysisexperiments taking into account both equilibriumwith the uidand the pressure effects give as the main plausible explanationseither a kinetic effect or a modication of equilibrium condi-tions due to partial uid release in the fossil sample. It isnonetheless important to recall that the important spread ofexperimental data for the natural maturation, as shown by the
Fig. 2 van Krevelen plot of the evolution of themacromolecular phase(kerogen). H/C versusO/C atomic ratios of the 423 K replica during thefirst REMD simulation are compared to experimental data of cellulosepyrolysis in an open system (a: ref. 54), confined pyrolysis (b: ref. 16)and geological maturation (c: ref. 12) of a type III kerogen/coal. Theshadowed area roughly depicts the spread of the data cloud for thenatural maturation. Orange dotted lines and characters indicate thedomains of diagenesis (D), catagenesis (C) and metagenesis (M)according to Tissot and Welte.7 Colored circles correspond to 150 ps(green), 300 ps (orange) and 750 ps (red).
This journal is © The Royal Society of Chemistry 2017
colored area in Fig. 2 and the somehow limited size of ourmodel, and thus its statistical signicance, do not allow furthercomparison.
We now describe the structure and texture evolution of thekerogen during this simulation. Fig. 3 shows some snapshots ofthe growing kerogen at different times of the rst REMDsimulation. Fig. 4 provides quantitative data on the carbonatom hybridization, texture (rings vs. chains) and ring topology.
First, as shown in Fig. 4(a), the macromolecular phase isessentially composed of threefold (sp2) carbon atoms,increasing from �60% in the early stages to �80% at the end ofthe simulation. The fraction of fourfold (sp3) carbon atoms islow and decreases during the whole process (from �10% to lessthan 5%). This low sp3 content is somewhat expected as theconsidered precursor does not possess any alkyl chain in itsstructure. However, a surprisingly high amount of twofold (sp)carbon atoms is obtained in the early stages of the process, witha maximum of about 30% at the onset of catagenesis, beforedecreasing down to 13%. We do not have any denitive expla-nation for this high amount of sp bonded C atoms. We can onlysuggest that this environment may be over-stabilized by thecurrent ReaxFF parameterization.
As can be seen in Fig. 3, at 150 ps, which seems to corre-spond to late diagenesis according to Fig. 2, the proto-kerogenis composed of small, essentially (unsaturated) aliphatic moi-ties (see the ring over chain ratio in Fig. 4(c)), forming clustersof on average 7C atoms (Fig. 4(e)). At this stage, only a few (ve)isolated rings (see the number of rings per cluster �1 inFig. 4(d)) are visible, in agreement with the classical picture ofimmature type III kerogen.20
The catagenesis regime, which according to Fig. 2 starts aeraround 200 ps of simulation, corresponds to the development ofrings and ring clusters in the material. As shown in Fig. 3 and4(d) (see also Fig. S1†) the amount of rings and their aggrega-tion into clusters drastically increases from 150 to 750 ps.Conversely, the average chain length is reduced down to �3atoms (Fig. 4(e)). Overall, the ratio of carbon atoms in rings overcarbon atoms in chains increases from very close to zero at theonset of catagenesis to more than 2 aer 750 ps (Fig. 4(c)). Atthis time, the average cluster size is of about 4 rings (Fig. 4(d)),slightly lower than the usual picture of mature type III kerogen(6–7 rings),20 even though clusters up to 14 rings can be detected(see Fig. 3). Note that we do not distinguish between aromaticand non-aromatic ring structures here, an algorithmicallydelicate and complex task for such small units, especially in theabsence of electronic structure in the calculations. As shown inFig. S1(a),† the number of C atoms in the kerogen signicantlyincreases up to �400 ps, the proper growth phase, at which itstabilizes. Above this, we essentially observe a conversion fromchain atoms to ring atoms, which can already be considered asa maturation stage. Interestingly, although the number of ringsconstantly increases up to almost the end of the simulation, thenumber of ring clusters plateaus around 30 clusters aer 400 ps(Fig. S1(b)†). Finally, as can be seen in Fig. 4(b), the ringtopology remains relatively constant during the simulation(note that at 100 ps, the rst point displayed in Fig. 4(b), there isno ring in the system, and hence all values are zero), with
Chem. Sci., 2017, 8, 8325–8335 | 8329

Fig. 3 Snapshots of the macromolecular (kerogen) phase at 150, 300, 500 and 750 ps. The color code is the same as in Fig. 1. In addition everyindependent ring cluster is highlighted with thicker sticks with a unique color. All data are from the 423 K replica of the first REMD simulation. Thefirst, second and last snapshots correspond to the green, orange and red circles in Fig. 2, respectively.
Fig. 4 Structural evolution of the macromolecular (kerogen) partduring growth. Evolution with REMD time of (a) the carbon atomcoordination, (b) the ring topology, (c) the ratio of carbon atoms inrings over carbon atoms in chains, (d) the size of ring clusters (innumber of rings) and (e) the size of chains (in number of carbonatoms). The colored symbols are equivalent to Fig. 2. All data are fromthe 423 K replica.
Chemical Science Edge Article
Ope
n A
cces
s A
rtic
le. P
ublis
hed
on 1
0 O
ctob
er 2
017.
Dow
nloa
ded
on 1
1/05
/201
8 14
:44:
42.
Thi
s ar
ticle
is li
cens
ed u
nder
a C
reat
ive
Com
mon
s A
ttrib
utio
n-N
onC
omm
erci
al 3
.0 U
npor
ted
Lic
ence
.View Article Online
around 40–45% of both hexagons and pentagons, 10% ofheptagons and a few% of octagons, typical of fullerenic, or non-graphitizing, amorphous carbons.56
Table 1 Most encountered molecules after 750 ps of REMD forreplicas simulated at various temperatures. For clarity the data set islimited to molecules found at least five times at 423 K
Molecule formula Usual name
Temperature (K)
423 604 901 1407
H2O Water 554 563 552 577CO Carbon monoxide 248 245 245 302H2 Dihydrogen 55 57 59 155C2H2O2 Acetylenediol 30 28 29 20H3O
+ Hydronium 14 11 13 17C2H3O
+ Ketenium 12 10 12 3C2H2O Ethynol 9 12 10 15CH4O2 Methanediol 8 6 7 2CH4O Methanol 6 9 9 3CO2 Carbon dioxide 5 7 7 0CH4 Methane 5 5 5 6
8330 | Chem. Sci., 2017, 8, 8325–8335
Tables 1 and 2 give some more details on the compositionsof the uid and solid phases, respectively, including tempera-ture effects by comparison with replicas simulated at highertemperatures. First, we observe that, in addition to the mole-cules discussed in Fig. 1, many other molecular species areobtained (see Table 1). This includes two acetylene-based alco-hols, acetylenediol and ethynol, as well as hydronium andketenium cations, methanediol, methanol and methane. Eventhough the thermal cracking of type III organic matter, espe-cially cellulose, is expected to produce very short molecularspecies,12,55 as obtained here, their precise nature and distri-butions may be surprising at rst sight. Table S1† compares theformation energies at 0 K (with respect to isolated atoms)computed with ReaxFF and plane waves density functionaltheory (PW-DFT) for the eleven molecules listed in Table 1. Ascan be seen, the error with respect to PW-DFT is within 6% forall of the neutral molecules but CO2, which we believe is accu-rate enough to grant a reasonable description of the potentialenergy surface for this set of 8 molecules. Note that it does notexclude the fact that other molecules (possibly containing otherfunctional groups like acids, ketones, ethers, etc.) could bedestabilized by ReaxFF and hence are not observed. Neverthe-less, this work suggests that the obtained high amounts ofhydroxylated methane and acetylene (methanol, methanediol,ethynol and acetylenediol) with respect to methane and acety-lene result from the high oxygen concentration in the uidphase (O/C ¼ 1.9 and O/H ¼ 0.6). Such conditions do not applyin the reported pyrolysis experiments, either because of theopen-system conditions54 or because of the use of a pre-maturedprecursor, much poorer in oxygen.16
The formation energy of CO2, 13% larger with ReaxFF thanwith PW-DFT, also possibly explains the extremely low amountsof produced CO2, especially with respect to CO. Furthermore,the presence of many cations (hydronium and ketenium) in theuid phase is clearly an artifact of the ReaxFF potential whichinduces a strong overestimation of the charge transfer in thesystem. A detailed analysis of charges reveals that the averagenet charges on hydronium and ketenium are only of 0.34e and0.13e, respectively, and are essentially neutralized by a smallarticial net negative charge of �0.14e on the CO molecules.Note also that, unlike usual classical non-reactive force eldsfor instance, electrostatics is here a limited contribution to thetotal ReaxFF potential energy in which the highest contribution
This journal is © The Royal Society of Chemistry 2017

Table 2 Composition of the macromolecular phase, including its different molecular constituents, after 750 ps of REMD and for varioustemperatures
T (K) Composition O/C H/C Molecules
423 C682H375O28 0.041 0.550 C434H229O16, C235H136O11, C13H10O1
604 C693H388O31 0.045 0.560 C522H283O25, C113H61O3, C40H29O3, C18H15O901 C688H383O33 0.048 0.557 C289H148O13, C238H141O13, C113H62O3, C35H22O3, C13H10O1407 C748H273O19 0.025 0.364 C748H273O19
Edge Article Chemical Science
Ope
n A
cces
s A
rtic
le. P
ublis
hed
on 1
0 O
ctob
er 2
017.
Dow
nloa
ded
on 1
1/05
/201
8 14
:44:
42.
Thi
s ar
ticle
is li
cens
ed u
nder
a C
reat
ive
Com
mon
s A
ttrib
utio
n-N
onC
omm
erci
al 3
.0 U
npor
ted
Lic
ence
.View Article Online
is from chemical bonds. A further discussion on the chemistryobtained with the used ReaxFF parameters, including a DFTevaluation of REMD/ReaxFF congurations, is presented inTable S2 and Fig. S5 and S6.†
As shown in Table 1, the composition of the uid at 750 psdoes not show much dependence on temperature until 1407 K,the temperature at which we observe a signicant evolutiontowards a more mature state, corresponding to an importantadditional production of, by decreasing importance, H2, CO andwater, as well as a decrease in the amounts of carbon dioxideand all of the hydroxylated compounds but ethynol. As for theuid, the solid phase is relatively constant in composition up to1407 K (see Table 2). Below this temperature the system iscomposed of 3–5 molecular fragments of various sizes, while at1407 K a transition occurs towards a unique fragment withlower overall O/C and H/C ratios typical of a higher maturationlevel. We note that the transition temperature between thesetwo degrees of advancement along the decomposition path isnot totally established at the end of the 750 ps simulation asreplicas obtained at temperatures larger than 1407 K showalternate occurrence of these more mature and less maturecongurations. This clearly results from an insufficientconvergence of the REMD simulation and of course theconguration exchange moves.
A last item provided by this REMD simulation is the hydro-carbon potential of cellulose that can be computed as the massratio of the produced hydrocarbon uid phase at 423 K(excluding other molecules as H2, H2O, H3O
+, CO and CO2) overthe initial mass of cellulose. We obtain a value of 180 mg g�1,typically in the range of values obtained experimentally withrock analysis methods, �100 mg g�1 C12. Interestingly the onlyalkane produced is methane (5 molecules at 423 K), which alongwith acetylene (2 molecules) is the only true hydrocarbon ob-tained in this work. The absence of long alkanes is actuallyexpected for type III kerogen,7 especially when derived from thestructural elements of plants such as cellulose, lignin orhemicellulose as they do not contain saturated aliphatic chains.Methane is also known as the main hydrocarbon product ofcellulose pyrolysis.55
3.2 Kerogen maturation
Even though it has a chemical nature typical of a type IIIkerogen at an intermediate maturation state, the macromolec-ular phase obtained at the end of the REMD simulation doesnot really form a proper solid, strictly speaking, as it is highlydispersed in the uid phase. We indeed expect a phase sepa-ration to occur at some point, especially considering the
This journal is © The Royal Society of Chemistry 2017
prominence of water in the uid and the hydrophobicity of thesolid. However, this diffusive process could be extremely long tooccur in a simulation, and would certainly be thermodynami-cally hindered due to the free energy cost for the creation ofa solid/uid interface in a system with a necessarily hugesurface over volume ratio. We have thus decided to overcomethis limitation by removing all of the uid from the system inorder to observe how further the macromolecular phase canmature within its bulk (i.e. far from any such interface).
A second system, consisting of the macromolecular phase at423 K at the end of the 750 ps REMD run, with no uid mole-cules, was rst relaxed at 423 K and 50 MPa for 1 ns, giving riseto a dense kerogen model, labeled A in Fig. 5. This model wasthen subjected to an additional 1800 ps of REMD to produceanother more mature kerogen model labeled B in Fig. 5. As canbe seen in Fig. 5, both O/C and H/C are slightly further reduced,down to 0.018 and 0.5, respectively, due to the progressiveproduction of 10H2O, 6CO and 5H2 molecules, yet remaintypical of the late catagenesis stage. From a structural point ofview, the three large unconnected molecules constituting theinitial system quickly coalesce (in around 100 ps) to forma unique macromolecular entity. The snapshots in Fig. 5 alsoclearly show an increase of the ring (aromatic) content in thesystem.
Interestingly, the application of REMD to model A, whichappeared as an equilibrium structure in the presence of theuid, leads to a signicant structural and chemical evolution inabsence of the uid phase, resulting in model B and a few extramolecules. It thus seems that removing the uid considerablyaccelerates the maturation of the system. However, we do notknow whether this is due to an important modication of thethermodynamic equilibrium (recalling that both the systemcomposition and density are changed) or to the removal ofa kinetic hindrance (one can argue that the presence of the uidhinders the agglomeration of the solid phase and thus thepossibility of different solid residues to react with each other).
Fig. 6 allows one to quantify the texture and structureevolution a little more. First, we see in Fig. 6(a) that the densityremains around 1.3 g cm�3, even though it passes througha maximum, close to 1.4 g cm�3 during the process, whichcorresponds to a state of no porosity (Fig. 6(b)). Apart from thisextreme case, the porosity remains at around 10%, with porediameters in the 0.35–0.75 nm range, characteristic of ultra-micropores, as shown in the pore size distributions (PSD) pre-sented in Fig. S3.† Fig. 6(c) shows that the chain to ringconversion is pushed a little further during this second REMDwith the number of ring C atoms reaching 3.5 times the number
Chem. Sci., 2017, 8, 8325–8335 | 8331

Fig. 5 Evolution with REMD time of the kerogen composition plotted in a van Krevelen diagram and snapshots of the system (A) after the 1 nsNPT relaxation and (B) at the end of the second (1800 ps) REMD simulation. All data refer to the 423 K replica of the second REMD simulation andthe color code is as in Fig. 3.
Fig. 6 Evolution with REMD time of the kerogen (a) density, (b)porosity, (c) ring/chain ratio, (d) number of rings per ring cluster and (e)bulk modulus. All data refer to the 423 K replica.
Chemical Science Edge Article
Ope
n A
cces
s A
rtic
le. P
ublis
hed
on 1
0 O
ctob
er 2
017.
Dow
nloa
ded
on 1
1/05
/201
8 14
:44:
42.
Thi
s ar
ticle
is li
cens
ed u
nder
a C
reat
ive
Com
mon
s A
ttrib
utio
n-N
onC
omm
erci
al 3
.0 U
npor
ted
Lic
ence
.View Article Online
of chain C atoms and the average size of ring clusters increasingup to around 6 rings per ring cluster. In themean time the chainclusters are reduced to on average 2.6 C atoms (see Fig. S2†).The structure of model B is thus very close to the one acceptedfor mature (end of catagenesis) type III kerogen: coronene (7rings) as the prototypal aromatic cluster and 2–3 C atoms perchain according to Behar and Vandenbroucke.20 We note thatthe largest ring clusters count 14 and 24 rings for models A andB, corresponding to 48 and 73 C atoms, respectively. Chemicalrepresentations of the three largest ring clusters in model B,
8332 | Chem. Sci., 2017, 8, 8325–8335
given in Fig. S4,† show that more than half of the rings arearomatic and form extended aromatic cores in these clusters.Also, the proportion of hexagonal rings signicantly increases,from 45 (A) to 60 (B)%, while that of pentagonal rings decreasesfrom 40 (A)% to 30 (B)%, indicating an increase in stability (seeFig. S2†) and, probably, in planarity of the clusters. The nalstate of the system (model B), however, is not advanced enoughon the maturation path to conclude on the nature – graphitizingor non-graphitizing – of the kerogen.13 Finally, as shown inFig. 6(e), the bulk modulus of the kerogen progressivelyincreases from 2 to 8 GPa between models A and B. We note, bycomparing the evolutions of the different quantities reported inFig. 6, that the increase in stiffness seems to be more related tothe structure of the carbon backbone, with the conversion fromchain to rings increasing the stiffness, than to the volumetricproperties (including porosity) as postulated earlier.27
Some of the properties reported in Fig. 6 can also becompared to a few experimental or modeling values reported fortype II and type III kerogens23–25 and for the well-characterizedCS400 material, a porous carbon derived from the pyrolysis ofsaccharose at low temperature (400 �C),57 which constitutes anexcellent lab-based proxy for the present work. First, the densityvalues obtained in this work (1.25–1.4 g cm�3) are close to thereported experimental values for Green River kerogen23
(1.11 g cm�3), type II and type III kerogens25 (1.15–1.30 g cm�3),or CS400 (1.28 g cm�3). Data regarding porosity and stiffness arescarcer. Collell et al.24 have predicted a porosity of 0.15% fora kerogen model of density 1.42 g cm�3, in other words, veryclose to the value of 0% found in the present work at themaximum density of 1.4 g cm�3. On the other hand, Pikunicet al.57 have reported a porosity of 12% for CS400, whichcorresponds to the maximum value reported in the presentwork. It is also worth noting that the extent of the PSDs(Fig. S3†) corresponds well to those reported for type IIkerogen27 and CS400.57 Finally, the values of the bulk modulusreported in this work (2–8 GPa) are of the same order as those of3.7 and 5 GPa obtained for mature type II kerogen models.24,27
Few other properties can be gathered from the kerogenmodels and compared to available data, either resulting fromexperiments or former atomistic models. Fig. 7 compares C–Ccontributions to g(r) obtained for models A and B to experi-mental (full g(r)) data from an immature type II kerogen sampleand a post-metagenesis (overmature) pyrobitumen obtained by
This journal is © The Royal Society of Chemistry 2017

Fig. 7 Pair distribution functions (C–C only) of models A and Bcompared to the experimental data (including contributions fromheteroelements) for an immature type II kerogen and a post-meta-genesis pyrobitumen from (a) Bousige et al.27 (the well-knownexperimental broadening at short r (ref. 58) is not accounted for in thesimulation data).
Fig. 8 Simulated HRTEM images of models A and B compared to anexperimental HRTEMmicrograph of CS400 (reprinted with permissionfrom the original ACS publication57). Dark fringes in the micrographs (afew of them are highlighted with dashed yellow lines) indicate thepresence of aromatic domains aligned with an electron beam.
Edge Article Chemical Science
Ope
n A
cces
s A
rtic
le. P
ublis
hed
on 1
0 O
ctob
er 2
017.
Dow
nloa
ded
on 1
1/05
/201
8 14
:44:
42.
Thi
s ar
ticle
is li
cens
ed u
nder
a C
reat
ive
Com
mon
s A
ttrib
utio
n-N
onC
omm
erci
al 3
.0 U
npor
ted
Lic
ence
.View Article Online
Bousige et al.27 We can see that the produced kerogen modelsboth share the short-range order of aromatic carbons, asopposed to aliphatic immature kerogens, yet do not possess thelong-range order of pyrobitumen, a high-stiffness (�40 GPa)almost heteroelement free aromatic carbon. Recalling that theintegrated rst peak intensity is proportional to the number ofC–C bonds per C atom (2.35, 2.51 andz3 for model A, model Band pyrobitumen, respectively) divided by the carbon atomnumber density, one easily deduces that the density of thepyrobitumen sample is signicantly (20–30%) larger than thoseof models A and B. In addition to having its area affected bydensity, the rst peak can also signicantly be broadened,especially at such low r values, because of the nite Q range ofthe diffraction apparatus used in the experiments. Broadeningcorrections should be applied to simulated g(r) for a quantita-tive comparison to the experiments58 but we unfortunately donot have the necessary experimental inputs. Finally, the g(r)values for models A and B are actually also very close to that forCS400 (see Fig. 2(a) in the original publication57), even thoughthe rst peak in the present work appears signicantly thinner.
In Fig. 8 we compare HRTEM images simulated frommodelsA and B to an experimental image of CS400 taken from Pikunicet al.57 A few dark fringes, indicative of aromatic domains well-aligned with the beam direction, are clearly visible for the threesamples. For all of them, these fringes are short (below 1 nm),randomly oriented in the plane, and do not show any layerstacking as would appear under the form of parallel fringesdistant by �0.34 nm. These images further conrm that bothkerogen models possess the texture of low temperaturesaccharose-based char.
In spite of a signicant structural evolution during thesecond REMD simulation, it is important to recall that theproduced kerogen model (B) remains at a pre-metagenesisstate, even though it is sitting at the border between cata-genesis and metagenesis according to the van Krevelen
This journal is © The Royal Society of Chemistry 2017
diagram. During metagenesis, the extent of parallel aromaticdomains should considerably increase, up to tens of nm for typeIII kerogens, which is denitely not observed in the presentwork. Note that other types of kerogen (types I and II) would seethese domains grow considerably larger during metagenesis:hundreds to thousands of nm upon further pyrolysis as shownby Oberlin and coworkers.59,60 The presence of many pentagonalrings, especially if isolated, could be an explanation for the non-graphitizability of type III kerogen.
Nevertheless, the absence of metagenesis in the simulationindicates that the activation energy for metagenesis is certainlysignicantly higher than that for diagenesis and catagenesis,and certainly too high to be activated in the current simulationsetup in a reasonable amount of time, even in the hightemperature (3500 K) replica. This hypothesis is supported bythe fact that metagenesis usually takes place at a much deeperdepth, and hence higher temperatures, than diagenesis andcatagenesis.12 A much larger maximum temperature would thuscertainly be required to observe metagenesis in a REMDsimulation.
4 Conclusion
By combining reactive molecular dynamics and the replicaexchange method, we have been able, for the rst time, tosimulate the complete geological conversion of some organicmatter into a uid and a kerogen at an advanced maturationstate.
The simulated kerogen formation and maturation plotted inthe van Krevelen diagram follow with great accuracy thoseobserved for natural specimens or for samples obtained in thelaboratory under conned volume conditions. The nature of theproduced uid phase, especially the high water content, alsoagrees well with experiments. As expected, methane is the mainalkane produced (actually the only one, certainly because of thesmall system size).
The resulting kerogen model (model B in Fig. 5) shares mostof the known, or hypothesized, properties of mature type III
Chem. Sci., 2017, 8, 8325–8335 | 8333

Chemical Science Edge Article
Ope
n A
cces
s A
rtic
le. P
ublis
hed
on 1
0 O
ctob
er 2
017.
Dow
nloa
ded
on 1
1/05
/201
8 14
:44:
42.
Thi
s ar
ticle
is li
cens
ed u
nder
a C
reat
ive
Com
mon
s A
ttrib
utio
n-N
onC
omm
erci
al 3
.0 U
npor
ted
Lic
ence
.View Article Online
kerogen. It is a dense, relatively stiff, ultramicroporous aromaticcarbon with short aromatic domains and a low degree oftexture, as highlighted by the absence of well-stacked aromaticdomains. Besides the fact that the nal outcome of this workenriches the so far extremely limited database of atomistickerogen representations,25,27 we should emphasize that the keyresult of this work is that the mimetic nature of the employedmethodology allows the simulation of the entire generationprocess, from the precursor to the kerogen and its associateduid production.
Whereas the quantitative character of our results remainsquestionable, especially regarding: (i) the degree of convergenceof the simulations, (ii) the ability of the ReaxFF potential toaccurately capture the chemistry, and (iii) the limited size of themodel, we believe that this work demonstrates the possibility ofsimulating, at least qualitatively, a complex chemical processlike the conversion of an organic precursor into a char anda uid.
Generalizing this study to other forms of organic matter,especially oil-prone type II precursors, will certainly provideinvaluable data on the relationship between the nature of theprecursor, the structure and properties of the obtained kerogenand the nature and quantity of the produced uid phase, withpotential impact on the development of non-conventionalhydrocarbon resources. Finally, the methods used here canalso be applied to other current technological issues like theprediction of structure/property relationships for bio-sourcedmaterials or the conversion of organic waste into bio-fuels.
Conflicts of interest
There are no conicts to declare.
Acknowledgements
This work was supported by the Game-Changer Shell projectenabled through MIT’s Energy Initiative. Additional supportwas provided by ICoME2 Labex (ANR-11-LABX-0053) and theAix-Marseille University AMIDEX foundation. ACTvD acknowl-edges funding from AFOSR FA9550-14-1-0355. Most REMD andMD simulations presented here were performed using thefacilities of the Extreme Science and Engineering DiscoveryEnvironment (XSEDE) platform,40 which is supported by theNational Science Foundation grant number ACI-1053575. DFTcalculations discussed in the ESI† were achieved using thefacilities of the Mesocentre de Calcul Intensif en Aquitaine(MCIA).
References
1 H. Marsh and F. Rodrıguez-Reinoso, Activated carbon,Elsevier, 2006.
2 F. Rodriguez-Reinoso and M. Molina-Sabio, Carbon, 1992,30, 1111–1118.
3 A. A. Ogale, M. Zhang and J. Jin, J. Appl. Polym. Sci., 2016, 133,43794.
8334 | Chem. Sci., 2017, 8, 8325–8335
4 A. J. Ragauskas, C. K. Williams, B. H. Davison, G. Britovsek,J. Cairney, C. A. Eckert, W. J. Frederick, J. P. Hallett,D. J. Leak, C. L. Liotta, J. R. Mielenz, R. Murphy,R. Templer and T. Tschaplinski, Science, 2006, 311, 484–489.
5 J. M. Hunt, Am. Assoc. Pet. Geol. Bull., 1972, 56, 2273–2277.6 D. W. Waples, in Geochemistry in Petroleum Exploration, D.Reidel Pub. Co. and IHRDC, Boston, 1985, p. 35.
7 B. P. Tissot and D. H. Welte, Petroleum Formation andOccurrence. A New Approach to Oil and Gas Exploration,Springer-Verlag, 1978.
8 J. M. Hunt, Petroleum Geochemistry and Geology, W. H.Freeman, New York, 1996.
9 C. C. Walters, in Practical Advances in Petroleum Processing,ed. C. S. Hsu and P. R. Robinson, Springer, 2006, ch. 2, pp.79–101.
10 A.-Y. Huc, Geochemistry of Fossil Fuels, Editions Technip,Paris, 2013.
11 A. Hood, C. Gutjahr and R. Heacock, Am. Assoc. Pet. Geol.Bull., 1975, 59, 986–996.
12 M. Vandenbroucke and C. Largeau, Org. Geochem., 2007, 38,719–833.
13 A. Oberlin, J. Boulmier and M. Villey, in Kerogen, InsolubleOrganic Matter from Sedimentary Rocks, ed. B. Durand,Editions Technip, Paris, 1980, ch. 7, pp. 191–241.
14 B. Tissot, Rev. Inst. Fr. Pet., 1969, 24–4, 470–501.15 J. Connan, AAPG Bull., 1974, 58, 2516–2521.16 M. Monthioux, P. Landais and J.-C. Monin, Org. Geochem.,
1985, 8, 275–292.17 T. Hantschel and A. I. Kauerauf, Fundamentals of Basin and
Petroleum Systems Modeling, Springer, 2009.18 B. Tissot, R. Pelet and P. Ungerer, AAPG Bull., 1987, 71, 1445–
1466.19 A. Burlingame, P. Haug, H. Schnoes and B. Simoneit, in
Advances in Organic Geochemistry, ed. P. Schenck and I.Havenaar, Pergamon Press, Paris, 1969, pp. 85–129.
20 F. Behar and M. Vandenbroucke, Org. Geochem., 1987, 11,15–24.
21 M. Siskin, C. Scouten, K. Rose, T. Aczel, S. Colgrove andR. Pabst Jr, in Composition, Geochemistry and Conversion ofOil Shales, ed. C. Snape, Kluwer Academic Publishers,Dordrecht, 1995, pp. 143–158.
22 M. Vandenbroucke and C. Largeau, Oil & Gas Science andTechnology, Rev.IFP (Institut Français du Petrole), 2007,vol. 38, pp. 719–833.
23 L. Zhang and E. J. LeBoeuf, Org. Geochem., 2009, 40, 1132–1142.
24 J. Collell, P. Ungerer, G. Galliero, M. Yiannourakou,F. Montel and M. Pujol, Energy Fuels, 2014, 28, 7457–7466.
25 P. Ungerer, J. Collell and M. Yiannourakou, Energy Fuels,2015, 29, 91–105.
26 A. M. Orendt, I. S. Pimienta, S. R. Badu, M. S. Solum,R. J. Pugmire, J. C. Facelli, D. R. Locke, K. W. Chapman,P. J. Chupas and R. E. Winans, Energy Fuels, 2013, 27, 702–710.
27 C. Bousige, C. M. Ghimbeu, C. Vix-Guterl, A. E. Pomerantz,A. Suleimenova, G. Vaughan, G. Garbarino, M. Feygenson,
This journal is © The Royal Society of Chemistry 2017

Edge Article Chemical Science
Ope
n A
cces
s A
rtic
le. P
ublis
hed
on 1
0 O
ctob
er 2
017.
Dow
nloa
ded
on 1
1/05
/201
8 14
:44:
42.
Thi
s ar
ticle
is li
cens
ed u
nder
a C
reat
ive
Com
mon
s A
ttrib
utio
n-N
onC
omm
erci
al 3
.0 U
npor
ted
Lic
ence
.View Article Online
C. Wildgruber, F.-J. Ulm, R. J. M. Pellenq and B. Coasne, Nat.Mater., 2016, 15, 576–582.
28 J. Collell, G. Galliero, R. Vermorel, P. Ungerer,M. Yiannourakou, F. Montel and M. Pujol, J. Phys. Chem.C, 2015, 119, 22587–22595.
29 A. Obliger, R. Pellenq, F.-J. Ulm and B. Coasne, J. Phys. Chem.Lett., 2016, 7, 3712–3717.
30 K. Lindorff-Larsen, S. Piana, R. O. Dror and D. E. Shaw,Science, 2011, 334, 517–520.
31 V. Agarwal, P. J. Dauenhauer, G. W. Huber andS. M. Auerbach, J. Am. Chem. Soc., 2012, 134, 14958–14972.
32 X. Liu, J.-H. Zhan, D. Lai, X. Liu, Z. Zhang and G. Xu, EnergyFuels, 2015, 29, 2987–2997.
33 C. Zou, S. Raman and A. C. T. van Duin, J. Phys. Chem. B,2014, 118, 6302–6315.
34 M. Zheng, Z. Wang, X. Li, X. Qiao, W. Song and L. Guo, Fuel,2016, 177, 130–141.
35 E. Salmon, A. C. van Duin, F. Lorant, P.-M. Marquaire andW. A. Goddard III, Org. Geochem., 2009, 40, 1195–1209.
36 Y. Zhang, X. Wang, Q. Li, R. Yang and C. Li, Energy Fuels,2015, 29, 5056–5068.
37 A. van Duin, S. Dasgupta, F. Lorant and W. Goddard, J. Phys.Chem. A, 2001, 105, 9396–9409.
38 Y. Sugita and Y. Okamoto, Chem. Phys. Lett., 1999, 314, 141–151.
39 D. J. Earl and M. W. Deem, Phys. Chem. Chem. Phys., 2005, 7,3910–3916.
40 J. Towns, T. Cockerill, M. Dahan, I. Foster, K. Gaither,A. Grimshaw, V. Hazlewood, S. Lathrop, D. Lia,G. D. Peterson, R. Roskies, J. R. Scott and N. Wilkins-Diehr, Comput. Sci. Eng., 2014, 16, 62–74.
41 M. P. Allen and D. J. Tildesley, Computer Simulation ofLiquids, Oxford University Press, 1987.
This journal is © The Royal Society of Chemistry 2017
42 W. C. Swope, H. C. Andersen, P. H. Berens and K. R. Wilson,J. Chem. Phys., 1982, 76, 637–649.
43 W. Shinoda, M. Shiga and M. Mikami, Phys. Rev. B, 2004, 69,134103.
44 S. G. Srinivasan, P. Ganesh and A. C. T. van Duin, J. Phys.Chem. A, 2015, 119, 571–580.
45 Y. K. Shin, L. Gai, S. Raman and A. C. T. van Duin, J. Phys.Chem. A, 2016, 120, 8044–8055.
46 F. Tavazza, T. P. Senle, C. Zou, C. A. Becker and A. C. T. vanDuin, J. Phys. Chem. C, 2015, 119, 13580–13589.
47 S. Plimpton, J. Comput. Phys., 1995, 117, 1–19.48 J. W. Pitera and W. Swope, Proc. Natl. Acad. Sci., 2003, 100,
7587–7592.49 T. C. F. Gomes and M. S. Skaf, J. Comput. Chem., 2012, 33,
1338–1346.50 Y.-C. Lin, J. Cho, A. Tompsett, P. R. Westmoreland and
G. W. Huber, J. Phys. Chem. C, 2009, 113, 20097–20107.51 D. S. Franzblau, Phys. Rev. B, 1991, 44, 4925–4930.52 L. D. Gelb and K. E. Gubbins, Langmuir, 1999, 15, 305–308.53 R. Kilaas, Proceedings of the 22nd Annual Conference of the
Microbeam Aanalysis Society, 1987, pp. 293–300.54 M. M. Tang and R. Bacon, Carbon, 1964, 2, 211–220.55 M. R. Hajaligol, J. B. Howard, J. P. Longwell andW. A. Peters,
Ind. Eng. Chem. Process Des. Dev., 1982, 21, 457–465.56 P. J. F. Harris and C. Tsang, Philos. Mag. A, 1987, 76, 667–677.57 J. Pikunic, C. Clinard, N. Cohaut, K. E. Gubbins, J.-M. Guet,
R. J.-M. Pellenq, I. Rannou and J.-N. Rouzaud, Langmuir,2003, 19, 8565–8582.
58 B. Farbos, P. Weisbecker, H. E. Fischer, J.-P. Da Costa,M. Lalanne, G. Chollon, C. Germain, G. L. Vignoles andJ.-M. Leyssale, Carbon, 2014, 80, 472–489.
59 M. Villey, A. Oberlin and A. Combaz, Carbon, 1979, 17, 77–86.60 A. Oberlin, M. Villey and A. Combaz, Carbon, 1980, 18, 347–
353.
Chem. Sci., 2017, 8, 8325–8335 | 8335