from blueprint to reality: san diego’s education reforms · from blueprint to reality: san...
TRANSCRIPT

From Blueprint to Reality:San Diego’sEducation Reforms• • •
Julian R. BettsAndrew C. ZauKevin King
2005

Library of Congress Cataloging-in-Publication Data
Betts, Julian R.
From blueprint to reality : San Diego’s education reforms / Julian R.
Betts, Andrew Zau, Kevin King.
p. cm.
Includes bibliographical references.
ISBN-13: 978-1-58213-105-4
ISBN: 1-58213-105-8
1. Educational equalization—California—San Diego. 2. Blueprint for Student
Success (Program)—Evaluation. 3. Academic achievement—California—San
Diego. 4. San Diego City Schools— Evaluation. 5. School improvement
programs—California—San Diego. 6. Educational indicators—California—San
Diego. I. Zau, Andrew. II. King, Kevin, 1975- III. Title.
LC213.23.S26B47 2005
371.2009794’985—dc22
2005025039
Research publications reflect the views of the authors and do notnecessarily reflect the views of the staff, officers, or Board ofDirectors of the Public Policy Institute of California.
Copyright © 2005 by Public Policy Institute of CaliforniaAll rights reservedSan Francisco, CA
Short sections of text, not to exceed three paragraphs, may be quotedwithout written permission provided that full attribution is given to
the source and the above copyright notice is included.
PPIC does not take or support positions on any ballot measure or onany local, state, or federal legislation, nor does it endorse, support, oroppose any political parties or candidates for public office.

iii
Foreword
In 2000, the Public Policy of Institute of California entered into anagreement with the San Diego Unified School District to provide theresearch and financial support to collect, format, and analyze student,teacher, and classroom data needed to create an accurate portrait of whataffects student achievement in San Diego. This report, authored byJulian R. Betts, Andrew C. Zau, and Kevin King is the second in a seriesstemming from that agreement. Most important, it is a report thatthrows new light on the school district’s program of reform known as theBlueprint for Student Success. The report was made possible by grantsfrom The William and Flora Hewlett Foundation and The AtlanticPhilanthropies.
The Blueprint was both visionary and controversial. It was visionarybecause it focused on improving reading skills while encompassingvirtually all of the district’s students and teachers, and controversialbecause its implementation drew both severe criticism from professionalstaff, parents, and community organizations but also support from otherparent groups and the business community. Education specialists andnonprofit organizations throughout the country have watched the SanDiego Blueprint with great interest—some even providing substantialfinancial support to implement comprehensive teacher trainingprograms. As a result, serious assessments of student performance duringthe years of the reform effort will be reviewed with great interest. Giventhe quality of their data, this report by Betts, Zau, and King is worthy ofspecial attention.
The authors conclude that the effort to improve reading skills wassuccessful and that the evidence for the program’s overall success is sodefinitive that San Diego’s efforts are well worth a look by other schooldistricts in California and the nation. A significant percentage ofelementary and middle school students who took part in reform-drivenactivities—such as double- and triple-length English classes, extended

iv
school days, and summer school reading programs—showed markedimprovement on standardized reading tests. High school students didnot experience the same test improvements and various reasons for thisresult are discussed. Nevertheless, to show such consistent gains inreading performance across the elementary and middle school grades isworth note and offers some lessons for other school systems in thecountry.
Many of the programs that were part of the Blueprint havesubsequently been reduced in scale or shut down entirely. Yet the effectsof the Blueprint may be measurable for years to come—only futureresearch will reveal whether its effects are long-lasting. But the authorsconclude that the individual programs are less important than theBlueprint’s broader principles: Use reading assessments to identifystudents who lag behind, strongly encourage families of these students toenroll them in additional literacy classes during the school year or in thesummer, and do everything possible to ensure that teachers are fullytrained in techniques to improve literacy. The unusually detailedstudent-level analysis underlying this report provides strong evidence thatreforms such as these can produce meaningful reductions in theachievement gap. This evidence deserves serious national attention.
David W. LyonPresident and CEOPublic Policy Institute of California

v
Summary
If the trend toward student testing in the United States has taught usone thing, it is that achievement gaps by race, parental education, andparental income are large and persistent.
Prodded by these stubborn achievement gaps, virtually all stategovernments have recently implemented school accountability systems.For instance, in 1999, California implemented the Public SchoolAccountability Act, which mandates state content standards (that is, aspecific body of knowledge and skills that students are expected to masterat each grade), student testing, and a school-level accountability system.This trend has gained further momentum with the passage in 2001 ofthe federal No Child Left Behind (NCLB) Act. A key aspect of bothfederal and state systems is an emphasis on reducing the large gaps inachievement that exist when students’ scores are grouped by race orparental income.
The creation of school accountability systems represents a helpfulstep forward, but it has left school districts scrambling to find ways toboost overall achievement and to narrow the achievement gaps in theirschools. There is growing evidence that simply “spending more” acrossall schools has done little to boost test scores or to narrow achievementgaps. Policymakers are increasingly coming to the conclusion thatdistricts need to implement far more aggressive reforms to improve thestatus quo.
A number of large urban districts have started to implement reformsthat focus on students who lag behind. One of the most importantamong these efforts is taking place in the San Diego Unified SchoolDistrict (SDUSD), which formally launched its Blueprint for StudentSuccess in summer 2000. The plan calls for massive redeployment ofeducational resources to help students who are identified by test scores asunderachieving, with an initial focus on reading.

vi
The reform is remarkable both for its scope and the controversy ithas generated. Marshall Smith, former U.S. Under Secretary ofEducation and currently Program Director for Education of the HewlettFoundation, told the San Diego Union Tribune: “This really is the mostimportant urban school reform effort in the country. . . . If the reformswork here they will have a national effect because ideas travel.” Anotherreason for the plan receiving national attention is the sheer size of thedistrict, which is the second largest in California and the eighth largest inthe nation. The district has received tens of millions of dollars from anumber of foundations to help implement the reforms, and former U.S.Secretary of Education Rod Paige has publicly supported the district’sefforts.
Locally, the reforms have generated intense controversy. Surveys bythe American Institutes for Research found that the majority of teachersopposed many aspects of the reforms, and local parent groups are dividedon whether the reforms merely relegate the students most in need totracked classes, or instead provide useful and much needed help to thesesame students.
This report seeks to provide the first student-level analysis of theeffect of the Blueprint reforms. It studies the school years 1999–2000through 2001–2002. We chose these years because the district formallyintroduced the Blueprint in summer 2000, with very partialimplementation of some components of the reform in the fall 1999 tospring 2000 (1999–2000) school year.
The overall objectives of this research project are fourfold. First, weexamine how many students have participated in each intervention in thefirst two years. Second, we study the effect of the Blueprint reforms onaverage reading achievement and on the gap in reading achievementbetween racial/ethnic groups and between groups defined bysocioeconomic and language status. Third, we explore the mechanismsthrough which the Blueprint has worked most and least effectively. Ourfourth goal is to provide policy advice. With a new superintendent, Dr.Carl A. Cohn, arriving in the district in October 2005, the Blueprint isvery much at a crossroads. Clearly, a careful retrospective analysis ofwhat did and did not work is essential. Given the national attention thatthe Blueprint has received, we believe that our findings can also assist

vii
other districts statewide and nationwide as they design education reformplans of their own.
Summary of Blueprint ReformsIn 1998, Superintendent Alan Bersin enlisted the help of Chancellor
of Instruction Tony Alvarado to develop and implement the Blueprint.Chancellor Alvarado adapted some of the reading reforms that he hadpreviously introduced as superintendent of Community School District#2 in New York. The Blueprint that emerged in San Diego emphasizesthe concept of “Balanced Literacy,” which calls for teachers to promotereading “by, with and to children,” with teachers becoming more activelyinvolved as they introduce more difficult text to their students.
The Blueprint boils down to three main strategies that place thepriority on a student’s literacy abilities. The first strategy is prevention .This strategy applies to all students and teachers and focuses onenhanced teaching of students, extensive training of teachers, andinnovative classroom materials. The second strategy is intervention.Teachers identify students performing below grade level who then receiveextra instruction through programs including extra-length Englishclasses, an extended day, or summer school and more focused teachertraining in literacy, depending on the student’s needs. The final strategyis retention, that is, the practice of having a student repeat a grade withaccelerated support. A common thread across these strategies is extratime on task for students, with a focus on the basics of reading andwriting rather than a pure focus on literature. All of this is backed byprofessional development for teachers that was designed to help teacherschoose appropriate teaching strategies for students at various levels ofliteracy. However, the Blueprint is in general not prescriptive in thesense of requiring that teachers teach from specific texts at specific times.
Initially, the interventions have focused primarily on reading. Morerecently, similar elements related to mathematics have been developed aswell but on a far smaller scale. Thus, this report focuses on the effect ofthe Blueprint on reading achievement. We now describe all of theBlueprint elements. As we note below, some of these elements haverecently been discontinued.

viii
Prevention StrategiesThe prevention strategies for all students that were in place in the
first year, 2000–2001, included:
• Use of a new literacy framework in all grades,• “Enhanced classes” in the sense of additional teaching materials
for all kindergarten and grade 1 teachers,• One or two peer coaches for all schools, to help teachers learn
proven teaching methods, and• “Genre studies” consisting of a two-period English class for all
students in the entering grade of middle or junior high schoolwho are near to, at, or above grade level, with relatedprofessional development for their teachers.
Students below the category of near grade level in certain gradesreceived more intensive versions of genre studies, as we will describebelow.
In addition, focus schools (the elementary schools with the weakestscores in the state test, ranking in the bottom tenth statewide) receivedan extended school year, a second peer coach, and other funds and staff.The elementary schools that ranked in the second-lowest decile of thestate ranks, known as “API 2” schools, received a second peer coach andadditional funds but not an extended school year.1
Intervention and Grade Retention StrategiesThe second category of Blueprint reforms is a detailed set of
interventions. Unlike the preventive measures, the interventions aretargeted at specific groups of students. Decisions about who receivesthese interventions are based upon student test results. Students “belowgrade level” or “significantly below grade level” were eligible for slightlydifferent interventions. The key intervention strategies were_____________
1API is the acronym for the Academic Performance Index, a statistic measuringoverall student achievement in a school. The California Department of Educationcalculates the API for each school annually. It also ranks schools into ten API deciles.Hence API 2 schools rank in the second-lowest decile of achievement statewide.

ix
• Literacy block. Literacy block is a double-length Englishlanguage class offered in grades 6 through 10. This variant ofgenre studies is given to students who lag below or significantlybelow grade level.
• Literacy core. For students significantly below grade level ingrade 9, the literacy-block class is extended to three periods. In2001–2002, grade 6 and 7 students also began to participate inliteracy core.
• Extended Day Reading Program (EDRP). In all schools withgrades 1–9, students below and significantly below grade levelreceive three 90-minute periods each week of supervised readingbefore or after school.
• Summer school. In addition to the standard summer school forstudents who have failed courses, Blueprint summer school isaimed at students in most grades from K through 9 who lagbelow and significantly below grade level. Students are asked toattend for six weeks, for four hours per day.2 Some schools inthe district, mostly elementary schools, are year-round schools atwhich the schedules did not permit the implementation ofBlueprint summer school. At these schools, students in affectedgrades who lagged behind in reading participated in specialintersession studies.
• Grade retention. In extreme cases, students were asked to repeata grade and were given additional tutoring in the year that theyrepeated the grade. Grade retention was limited to entry-levelgrades of elementary and middle school/junior high school:grades 1, 6 in middle school, and 7 in junior high school.
Data and MethodsThis research builds on a database constructed for the first PPIC
report on student achievement in San Diego, titled Determinants ofStudent Achievement: New Evidence from San Diego, by Betts, Zau, andRice (2003). This earlier report compiled longitudinal data on student_____________
2In addition, all secondary school students with D/F grades attend a moretraditional type of summer school consisting of six weeks of courses in core subjects.

x
records and in addition linked these records with information on thequalifications of the teachers in each classroom. This database wasaugmented by adding variables indicating whether students hadparticipated in each of the specific Blueprint interventions and also bymeasuring the school-level preventive measures described above. Thedata were updated to the 2001–2002 school year to provide a full pictureof the effect of the Blueprint in its first two years.
Because we have multiple years of data for most students, we canallow for the fact that the learning trajectories of any two children arelikely to differ. In effect, each student becomes his own “comparisongroup” because we test whether the student learns more in the years thathe participates in a given intervention, relative to years in which he doesnot. By including a year of data before the main Blueprint elementswere introduced in summer 2000, we can compare growth inachievement before and after the interventions were initiated.
Similarly, we control for unobserved but fixed characteristics of thestudent’s home zip code and his school. The latter is particularlyimportant for assessing the effect of a school being designated a focus orAPI 2 school. We want to know whether something positive happens tostudent achievement in those years that a focus or API 2 school receivesadditional support from the district, above and beyond the pre-existingtrend in student achievement at these schools.
Patterns of Student Participation in BlueprintInterventions
The district has targeted the various interventions in a quite focusedway. In both 2000–2001 and 2001–2002, roughly one-third of studentsparticipated in at least one intervention. We found that EDRP andliteracy block both garnered the highest participation rate at around 25percent of students in relevant grades. Blueprint grade retention, whichdebuted in 2001–2002, was the least common intervention, at 1.3percent of students in the relevant grades.
Participants in the four student-based interventions that we studiedare much more likely to be nonwhite or English Learners (ELs) or tohave parents with relatively low education. For instance, one out of two

xi
English Learners participated in literacy block on average, compared tofewer than one out of five fluent English-speaking students. As shown inFigure S.1, participation rates in EDRP and Blueprint summer schoolwere far higher among students whose parents had relatively littleeducation. Among races and ethnicities, we found that whites uniformlywere least likely to participate in interventions and that Hispanics werethe most likely. For instance, in the relevant grades, 8.9 percent ofwhites participated in literacy block compared to 38.7 percent ofHispanics.
0
5
10
15
20
25
30
35
40
45
Par
ticip
atio
n ra
te (
%)
Less than highschool diploma
High school diploma or some college
Bachelor’s degree orpostgraduate degree
EDRP Blueprint summerschool
NOTE: Rates are calculated based on all students in relevant grades in either 2000–2001 or 2001–2002 and thus are an enrollment-weighted average of participation in the two years.
Figure S.1—Student Participation Rates in Extended Day Reading Programand Blueprint Summer School by the Level of Education
of the Student’s More Highly Educated Parent

xii
Were the “Right” Students Assigned to BlueprintInterventions?
The district has used reading test scores to assign students tointerventions very much as announced. However, test scores aloneseldom determine placement of students. Test scores were mostimportant in determining assignments to literacy block and core, wherestudents whose scores suggested they were eligible were typically 12 to 77times as likely to participate as students whose reading scores officiallyexempted them. Test scores were typically the least influential indetermining assignment to Blueprint grade retention, in that manystudents whose scores made them eligible for retention were nonethelesspromoted to the next grade.
Our finding that there is some flexibility in the assignment processmatches official district policy in the sense that teachers and parents haveinput into assignment decisions, and this is particularly so for graderetention. It is also clear that EDRP and Blueprint summer school havelower participation rates among eligible students than do literacy blockand core. Also, with the exception of grade retention, occasionallystudents who are slightly above the official test score cutoff participate inan intervention. Teacher recommendations as well as the need to fill outclasses explain the phenomenon.
Overall, we found clear evidence that the district uses achievementscores as announced, but there is considerable flexibility in practice.
The Overall Effect of the Blueprint on StudentAchievement
The main result of our statistical analysis is that, overall, theBlueprint had a statistically significant effect on student achievementin reading, but these effects varied dramatically by grade level. TheBlueprint had a large positive effect on students’ reading gains inelementary schools, a smaller but still positive effect in middle schools,and, overall, a moderate negative effect on reading gains among highschool students.
We arrived at these conclusions by combining two pieces ofevidence: first, our statistical regressions that modeled an individual
xiii
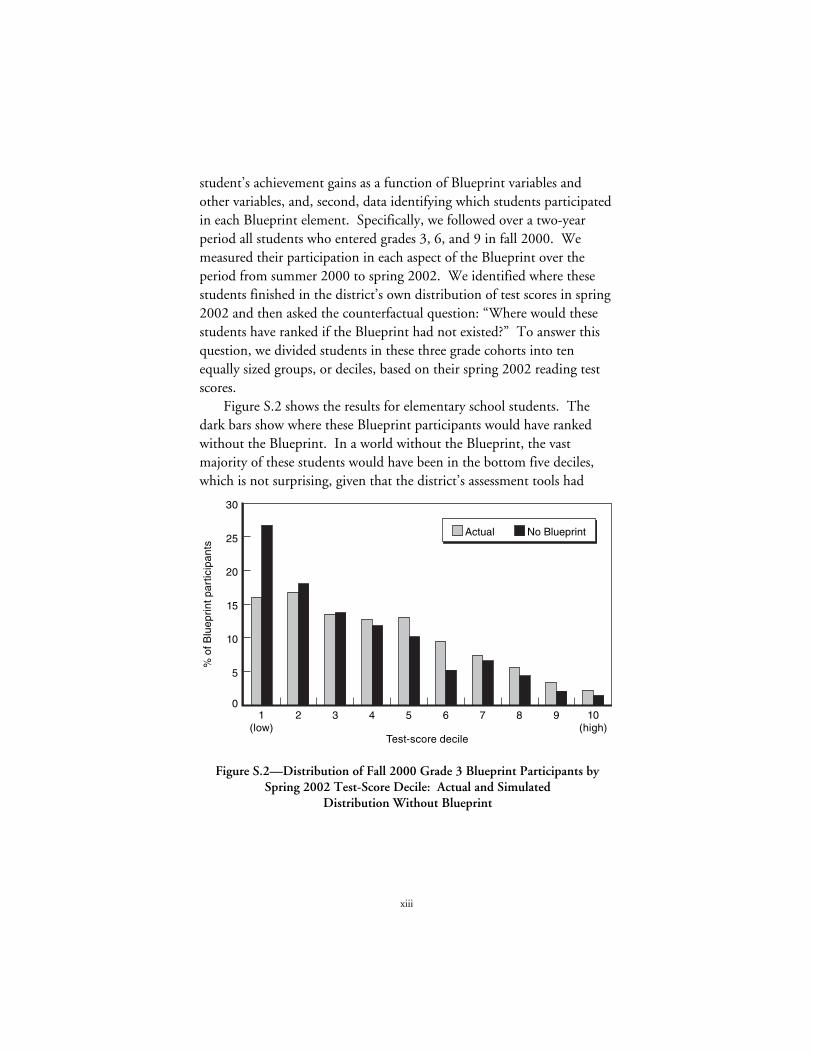
student’s achievement gains as a function of Blueprint variables andother variables, and, second, data identifying which students participatedin each Blueprint element. Specifically, we followed over a two-yearperiod all students who entered grades 3, 6, and 9 in fall 2000. Wemeasured their participation in each aspect of the Blueprint over theperiod from summer 2000 to spring 2002. We identified where thesestudents finished in the district’s own distribution of test scores in spring2002 and then asked the counterfactual question: “Where would thesestudents have ranked if the Blueprint had not existed?” To answer thisquestion, we divided students in these three grade cohorts into tenequally sized groups, or deciles, based on their spring 2002 reading testscores.
Figure S.2 shows the results for elementary school students. Thedark bars show where these Blueprint participants would have rankedwithout the Blueprint. In a world without the Blueprint, the vastmajority of these students would have been in the bottom five deciles,which is not surprising, given that the district’s assessment tools had
Actual No Blueprint
0
5
10
15
20
25
30
1(low)
2 3 4 5 6 7 8 9 10(high)
Test-score decile
% o
f Blu
epri
nt p
artic
ipan
ts
Figure S.2—Distribution of Fall 2000 Grade 3 Blueprint Participants bySpring 2002 Test-Score Decile: Actual and Simulated
Distribution Without Blueprint

xiv
previously identified these students as lagging behind. The lightercolored bars show where these students actually ended up in the testscore distribution after having participated in the Blueprint. Thedifferences are quite striking: Our results suggest that the Blueprintshifted well over 10 percent of these students out of the bottom twodeciles of reading achievement and into higher deciles.
Results for middle schools are similar but more modest, with justover 4 percent of participants being shifted out of the bottom two decilesof test-score performance. High school results display a perverse result:The Blueprint is predicted to have shifted just under 5 percent ofparticipants into the two lowest deciles of test-score performance.
With the major exception of high school, then, we conclude that theBlueprint reforms meaningfully increased gains in reading.
The Effect of the Blueprint on Achievement GapsWe followed the same three cohorts over two years and estimated
how the Blueprint affected the initial test score gaps related to language,race/ethnicity, and parental education.
We find evidence that in elementary and to a lesser extent middleschools, the Blueprint narrowed achievement gaps defined alongracial/ethnic, language, and socioeconomic lines. However, theopposite is true in high schools.
In elementary schools, all three ways in which we grouped studentssuggest that the Blueprint led to quite substantial reductions in theachievement gap. Most impressive in this regard were the EL/non-ELgap, the Hispanic/white gap, and the gap between students whose morehighly educated parent was a high school dropout and students who hadat least one parent whose education continued beyond the bachelor’sdegree level. Each of these gaps is estimated to have shrunk by about 15percent over two years because of the Blueprint.
Middle school results similarly suggest that the Blueprint reducedthe various achievement gaps, but by less than 5 percent. High schoolresults are uniformly negative in that they suggest the Blueprint widenedachievement gaps. The most dramatic instance was the high schoolEL/non-EL gap, which is predicted to have widened by roughly 10percent. Figure S.3 shows the changes in the initial gap in reading

xv
–15
–10
–5
0
5
10
15
20
Elementary school Middle school High school
Per
cent
age
NOTE: The figure shows the predicted two-year reduction in test-score gap between spring 2000 and spring 2002 for students in grades 3, 6, and 9 in fall 2000. A positive/negative bar indicates that the initial gap is predicted to have narrowed/widened as a result of the Blueprint.
Figure S.3—Two-Year Reduction in EL/Non-EL Test-Score GapsAttributable to the Blueprint
achievement between EL and non-EL students, again showing that highschools bucked the pattern of reduced achievement gaps observed inlower grades.
Which Blueprint Elements Have Influenced StudentGains in Reading?
It is important to bear in mind that with only two years of data formost Blueprint elements (genre studies and literacy block were phased inon a very limited basis in 1999–2000, and peer coaches were quitewidely introduced in this year as well), it is certainly possible that we lackenough data to detect effects of the reforms. An analysis suggests thatthe one Blueprint variable for which we are very unlikely to be able todetect meaningful effects is Blueprint grade retention, which began on avery small scale in the last year of our sample.

xvi
With this warning in mind, it is quite remarkable how many of theBlueprint variables proved to be highly statistically significant. (By“statistically significant” we mean that it is very unlikely that the trueeffect of these Blueprint elements was zero.)
The effect of peer coaches is typically not statistically significant, andin a few cases may have been weakly negative. Peer coach experience didnot seem to change the effect of the peer-coach-to-enrollment ratio.
In contrast, the funneling of targeted resources toward focus and API2 elementary schools beginning in fall 2000 appears to have had apositive and highly significant effect. Similarly, EDRP and Blueprintsummer school both are positive and statistically significant in each ofthe gradespans in which they are offered.
The special double- and triple-length English classes, whencompared to regular single-period English classes, seem to have had quitedifferent effects at the middle and high school levels. We could detectno effect of genre studies on students at the middle school level. (Genrestudies, sometimes referred to as Enhanced Literacy, are the preventivedouble-length English classes that are targeted at students who were near,at, or above grade level.) In contrast, both the literacy block and coreinterventions that are aimed at students below and significantly belowgrade level were very strongly associated with gains in readingachievement. At the high school level, in contrast, literacy block fornon-EL students, and block/core as a whole for EL students, werestrongly associated with smaller reading gains, and literacy core was notstatistically different from single-period English classes in its effect onnon-EL students.
For the most part, we found that the estimated effect of theseBlueprint variables did not depend on the teacher’s experience.
How Big Is the Effect of Specific Blueprint Elementson Gains in Reading?
We gauged the size of the effect of the Blueprint on students’reading achievement in several ways. First we predicted the effect ofparticipating in a given Blueprint element by dividing the predicted gain

xvii
in test scores by the average annual gain in test scores we observe for allstudents in the same gradespan.
Figures S.4 through S.6 show results for elementary, middle, andhigh schools, respectively. Each figure shows for each Blueprint elementthat was statistically significant the predicted effects on average gains inreading achievement. The height of each bar corresponds to thepercentage change in annual gains in achievement related to eachBlueprint element. These figures suggest that, overall, the effects of thevarious Blueprint elements have been quite large. The reforms appear tohave boosted gains in test scores substantially in elementary schools. Forinstance, Figure S.4 shows that participation in the reforms specific toeither a focus or API 2 elementary school, or participation in Blueprintsummer school, is predicted to boost a student’s annual reading gains byover 10 percent each, and the effect of EDRP is just below 10 percent.The Blueprint reforms also appear to have boosted scores moderately inmiddle schools but depressed reading achievement in high schools.
0
5
10
15
20
25
30
35
40
API 2 school Focus school EDRP Blueprintsummer school
Intersession
Cha
nge
(%)
NOTES: A bar with a height of zero indicates no statistically significant effect. See Table 4.3 for a full list of insignificant Blueprint elements.
Figure S.4—Predicted Effect of Blueprint Elements on Annual Gains inReading Achievement Among Elementary School Students

xviii
Cha
nge
(%)
NOTES: A bar with a height of zero indicates no statistically significant effect. See Table 4.3 for a full list of insignificant Blueprint elements. For peer apprentice coaches as a percentage of enrollment, we simulated the effect of changing from zero to the mean number of peer apprentice coaches (as a percentage of enrollment). The lack of significance of Blueprint retention reported for middle schools could reflect lack of variation in our data.
–10
0
10
20
30
40
50
60
70
Literacyblock
Literacycore
EDRP Blueprintsummerschool
Inter-session
Blueprintretention
Peerapprentice
Figure S.5—Predicted Effect of Blueprint Elements on Annual Gains inReading Achievement Among Middle School Students
Some of the predicted declines at the high school level are quite large inpercentage terms, but because throughout California average readingscore gains are typically quite low in high school, a small absolute effectis typically quite big as a percentage of growth.
There are also some common findings across gradespans. TheExtended Day Reading Program appears to have boosted studentachievement in both middle and elementary schools. Blueprint summerschool, the lone intervention that is offered in all three gradespans, hasappeared to contribute to growth in reading achievement in all of thesegradespans.3
_____________3In the period under study in SDUSD, average annual gains in reading achievement
for individual students were 25.7 points in elementary schools, 14.7 points in middleschools, and 3.3 points in high schools. So, for example, if participating in a specificBlueprint option in elementary school is predicted to boost reading scores by 5 points, we

xix
Cha
nge
(%)
NOTES: See Table 4.3 for a full list of insignificant Blueprint elements. For peer coaches as a percentage of enrollment, we simulated the effect of changing from zero to the mean percentage of peer coaches. Because the variable “Block/core for EL students” was measured for EL students only, the predicted effect on gains in reading achievement was calculated relative to EL high school students’ average annual gains—6.54 points, compared to 3.3 points for the overall population.
Literacyblock
Block/corefor EL students
Blueprintsummer school
Peer coach as% of enrollment
–80
–60
–40
–20
0
20
40
60
80
Figure S.6—Predicted Effect of Blueprint Elements on Annual Gains inReading Achievement Among High School Students
Testing for Variations by Year in the Effectivenessof the Blueprint
We have found some evidence that the overall effect of theBlueprint’s elements has improved over time, most strongly inelementary schools and to a lesser extent in high schools. Results inmiddle schools were more mixed. The evidence implies that as thedistrict has gained experience with the various reforms, the reforms haveon the whole become more effective. Most notably, as mentioned above,______________________________________________________________would estimate the predicted percentage gain by dividing 5 by the average gain of 25.7,yielding a predicted gain in achievement of 19.5 percent. We note that the gains inreading scores tail off considerably in the higher grades, a pattern seen throughoutCalifornia. A practical implication for our simulations is that at the high-school level, thesame absolute effect of 5 points can produce an eye-popping change in percentage terms.

xx
overall peer coaching in elementary schools had an effect that was notstatistically different from zero. We find some evidence that this overallzero effect consists of a negative effect in 1999–2000 and a small positiveeffect in later years. Similarly, the negative effect of literacy core andblock in high schools appears to have improved to a zero effect by2001–2002. It will take several more years of data to know for surewhether these apparent trends are genuine or simply random short-termvariations.
Testing for Possible Side Effects of the Blueprint onOutcomes Apart from Reading
We tested for two possible side effects of the Blueprint. The first isthat the Blueprint’s initial emphasis on reading could potentially havelowered student learning in the other key subject of math. We label thisthe “academic diversion” hypothesis. The second potential side effect isthat the additional time students were asked to devote to reading couldhave induced “burn-out” of students in terms of increased studentabsences.
We found some evidence contradicting the notion that theBlueprint’s reading programs have hurt math achievement. At theelementary and middle school levels, participation in various Blueprintelements designed to improve reading was often associated with 5 to 15percent gains in the average rate of math achievement growth. Thesefindings support the opposing hypothesis that reading ability is a“gateway” skill that can foster student learning in other subjects. Incontrast, high school results were mixed. Literacy core was associatedwith a drop of about one half in gains in math. In a sense, this mimicsthe results for reading gains, suggesting the Blueprint reforms have hadfar more beneficial effects in lower grades than in upper grades.
Our test of the burn-out hypothesis—the idea that the Blueprint hasencouraged student absences—suggested that quite the opposite wasoccurring at the elementary school level. Here, student exposure toBlueprint reading reforms was uniformly predicted to reduce studentabsences. At the middle and high school levels, results varied, suggestingthe lack of a consistent effect.

xxi
Conclusion and Tentative Implications for PolicyOverall, did the reforms work? How large were the effects? And
why do we see variations in effectiveness? We found evidence that in itsfirst two years, the Blueprint led to significant gains in achievement inelementary and, to a lesser extent, middle schools. Both schoolwidepreventive strategies such as the focus and API 2 elementary schoolprograms, and interventions narrowly targeted to individual studentsacross all schools, such as the Extended Day Reading Program andBlueprint summer school, appear to have worked well. Clearly, thebiggest disappointment in these initial results is that the large andpositive results in elementary and middle schools have not transferred tothe high school setting. Only Blueprint summer school appears to haveworked as intended at the high school level.
On the question of why we see variations in effectiveness, the verysuccessful focus and API 2 programs at elementary schools largely explainwhy the Blueprint worked better at elementary schools than middleschools.
As for the overall negative results at the high school level, we havefour hypotheses about why the high school experience with literacy blockand core was so much more negative than it was in elementary andmiddle schools. In brief, less personal contact between individualteachers and students at the high school level may make it more difficultfor teachers to diagnose and solve reading problems. Second, highschool English teachers may have been better prepared than theircounterparts in earlier grades to teach literature than to teach remedialliteracy skills. Third, Chancellor Alvarado’s reforms, which were adaptedfrom his earlier experience in a K–8 district in New York, had not beendeployed in a high school setting before, implying that the reforms hadyet to be fine-tuned at the high school level. We could thereforereasonably expect a relatively less effective implementation in theuncharted territory of San Diego’s high schools and, possibly, someimprovement over time as high school teachers and administrators gainexperience. In fact, we did observe evidence at the high school level thattwo of the Blueprint interventions initially had a negative influence onhigh school student reading, which improved to a zero influence by

xxii
2001–2002. Fourth, teenagers at the high school level may have feltnegatively stigmatized by the pull-out English classes at a time whenpeers were instead enrolling in college preparatory classes.
One way to infer tentative policy conclusions is to summarize howthe district has altered the Blueprint since its inception in fall 2000.Partly because of slower test score gains in the higher grades, as of2004–2005 the district no longer offered literacy core in middle or highschools. In 2005, the district’s board also acted to dismantle the peercoach program. The district in fact began in 2003–2004 to supplementpeer coaches with “content-level administrators” in literacy, math, andscience, who focused more on content and less on pedagogy than peercoaches. Pressure to reduce budgets in tight financial times has also hadan influence, leading the district to severely curtail EDRP in fall 2003.Less dramatically, Blueprint summer school, which still exists, has facedsome limits on availability.
Cutting back literacy core in high school garners more support fromour results than does cutting it back in middle school. Indeed, we foundpositive and significant effects of literacy core in middle school, unlikehigh school. Although we emphasize that our results are based on onlythe first two years of these programs, they suggest that eliminatingliteracy core, especially in middle schools, may have been premature.
Similarly, our results found that EDRP benefited studentsmeaningfully in both elementary and middle schools. This suggests thatthe recent curtailment of this program is unfortunate. Further, a veryrough benefit-cost calculation suggests that EDRP was relatively muchmore cost-effective than some of the other reforms. This findingsuggests that restoring EDRP, or some variant, to its original scopeshould perhaps be a priority when the budget outlook improves.
One element of the Blueprint reforms that had yet to show a cleareffect on student learning is the peer coach program. We argue that thiscomponent of the reforms may take some time to bear fruit. It is only aspeer coaches spend more time interacting with classroom teachers thatwe could expect this important aspect of professional development toaffect the classroom tangibly. Although we found some evidence thatpeer coaching was beginning to yield dividends in elementary schools by

xxiii
2001–2002, overall it appears that peer coaching was not initially one ofthe most cost-effective elements of the reform.
For readers in the rest of California and the nation, what do ourresults suggest? In particular given that SDUSD Superintendent AlanBersin left San Diego on July 1, 2005, to become California’s newSecretary of Education, what lessons can he, and should he, take fromSan Diego to inform his new role in Sacramento? Should the Blueprintbe copied elsewhere in California?
First, our findings suggest that systemic reform at all levels from thedistrict offices down to the individual classroom and student can anddoes work. Second, the findings tentatively suggest that elements of theBlueprint might serve as the basis for reforms elsewhere in California andthe country, at least at the elementary and middle school levels.However, our initial results suggest that the state needs to look elsewherefor more successful models of literacy reform at the high school level.
Both in San Diego and elsewhere, policymakers will need to digmuch deeper than these overall conclusions in deciding which elementsdeserve to survive in some form in San Diego and to be emulatedelsewhere. The Blueprint’s interwoven marriage of professionaldevelopment programs for teachers and detailed interventions forstudents at risk is complex. We have found the most successful elementsof the reforms to be the Extended Day Reading Program, summerschool, elementary focus schools with their longer school year, and (atleast in middle schools) extended length classes. At their heart, all ofthese programs share three simple principles:
1. Use reading assessments to identify students (or entire schools)lagging seriously behind in reading,
2. Strongly encourage families of these students to enroll them inadditional literacy classes, whether during the school day, afterschool, or in summer, and
3. Do all that is possible to make sure that the teachers at the frontof these students’ classrooms are fully trained in literacytechniques.
In San Diego, teachers are clearly divided on whether the districtsucceeded in this last task. But put together, these three rules—regular

xxiv
assessment of students, targeting of additional literacy activities tostudents found to be lagging behind, and professional development oftheir teachers—speak to a clarity of mission and a singleness of purpose.For other districts around the state and country, which are nowstruggling to eradicate their own achievement gaps to satisfy both stateand federal school accountability mandates, the overall direction of theBlueprint deserves serious attention.

xxv
Contents
Foreword......................................... iiiSummary......................................... vFigures .......................................... xxixTables ...........................................xxxiiiAcknowledgments................................... xxxvAcronyms ........................................xxxvii
1. INTRODUCTION .............................. 1Basic Objectives ................................. 6Relation to Other Research ......................... 7Design of the Report.............................. 10
2. OVERVIEW OF BLUEPRINT REFORMS, KEY POLICYQUESTIONS, AND RESEARCH DESIGN ............ 11Summary of Blueprint Reforms ...................... 11Key Policy Questions ............................. 16Overview of Data Used and Research Design............. 19
3. PATTERNS OF STUDENT PARTICIPATION INBLUEPRINT INTERVENTIONS ................... 23Introduction ................................... 23Overall Patterns of Student Participation................ 24Interventions as a “Package”......................... 27Characteristics of Students Participating in Each
Intervention ................................ 31Were the “Right” Students Assigned to Blueprint
Interventions? ............................... 34Participation Rates by Grade Equivalents Behind .......... 35Conclusion .................................... 41
4. EFFECT OF INDIVIDUAL BLUEPRINT ELEMENTSON STUDENT GAINS IN READING ............... 43Introduction ................................... 43Results........................................ 50

xxvi
Comparing the Effect of Peer Coaches on Students WhoseTeachers Vary in Experience..................... 53
Blueprint Effects on Gains in Reading Achievement ........ 55A Tentative Cost-Benefit Comparison of EDRP, Blueprint
Summer School/Intersession, and Peer Coaching ...... 59Conclusion .................................... 61
5. CUMULATIVE EFFECT OF THE BLUEPRINT ONGAINS IN READING ............................ 65Introduction ................................... 65The Cumulative Effect of Size of Participation in the
Blueprint .................................. 66Estimating the Effect of the Blueprint on Participating
Students’ Overall Ranking in the AchievementDistribution ................................ 69
The Effect of the Blueprint on Achievement Gaps ......... 72Conclusion .................................... 79
6. TESTING FOR VARIATIONS BY YEAR IN THEEFFECTIVENESS OF THE BLUEPRINT ............. 81Introduction ................................... 81Variations over Time in Blueprint Effects on Reading
Achievement................................ 81Variations in the Effectiveness of Blueprint Interventions
Depending on Whether a Student Enrolled for One orMore Years ................................. 85
Conclusion .................................... 87
7. TESTING FOR POSSIBLE SIDE EFFECTS OF THEBLUEPRINT ON OUTCOMES APART FROMREADING .................................... 89Introduction ................................... 89Effect of the Blueprint Reading Elements on Gains in Math
Achievement................................ 90Effect of the Blueprint Reading Elements on Student
Absences................................... 93Conclusion .................................... 95
8. CONCLUSION AND TENTATIVE IMPLICATIOS FORPOLICY ...................................... 99Introduction ................................... 99

xxvii
Patterns of Participation and Patterns of Effects on ReadingAchievement................................ 99
Side Effects?.................................... 102Implications for Policy in San Diego................... 102Policy Issues That Merit Further Study ................. 107Take-Away Message for Local and National Leaders ........ 108
AppendixA. Data and Information on Blueprint Interventions ......... 111B. Regression Methods and Results...................... 117
References ........................................ 131
About the Authors .................................. 135
Related PPIC Publications............................. 137


xxix
Figures
S.1. Student Participation Rates in Extended Day ReadingProgram and Blueprint Summer School by the Level ofEducation of the Student’s More Highly EducatedParent ..................................... xi
S.2. Distribution of Fall 2000 Grade 3 Blueprint Participantsby Spring 2002 Test-Score Decile: Actual andSimulated Distribution Without Blueprint ........... xiii
S.3. Two-Year Reduction in EL/Non-EL Test Score GapsAttributable to the Blueprint ..................... xv
S.4. Predicted Effect of Blueprint Elements on Annual Gainsin Reading Achievement Among Elementary SchoolStudents ................................... xvii
S.5. Predicted Effect of Blueprint Elements on Annual Gainsin Reading Achievement Among Middle SchoolStudents ................................... xviii
S.6. Predicted Effect of Blueprint Elements on Annual Gainsin Reading Achievement Among High School Students .. xix
3.1. Student Participation Rates in the Extended DayReading Program and Blueprint Summer School by theLevel of Education of the Student’s More HighlyEducated Parent .............................. 31
3.2. Number of Times by Which Probability of ParticipationRises If Student Is Officially Eligible, by Interventionand Year ................................... 40
4.1. Predicted Effect of Blueprint Elements on Annual Gainin Reading Achievement Among Elementary SchoolStudents ................................... 56
4.2. Predicted Effect of Blueprint Elements on Annual Gainin Reading Achievement Among Middle SchoolStudents ................................... 57
4.3. Predicted Effect of Blueprint Elements on Annual Gainin Reading Achievement Among High School Students .. 58

xxx
5.1. Distribution of Fall 2000 Grade 3 Blueprint Participantsby Spring 2002 Test-Score Decile: Actual andSimulated Distribution Without Blueprint ........... 70
5.2. Distribution of Fall 2000 Grade 6 Blueprint Participantsby Spring 2002 Test-Score Decile: Actual andSimulated Distribution Without Blueprint ........... 71
5.3. Distribution of Fall 2000 Grade 9 Blueprint Participantsby Spring 2002 Test-Score Decile: Actual andSimulated Distribution Without Blueprint ........... 72
5.4. Two-Year Reduction in EL/Non-EL Test-Score GapsAttributable to the Blueprint ..................... 76
5.5. Two-Year Reduction in Test-Score Gaps (Relative toWhites) Attributable to the Blueprint ............... 77
5.6. Two-Year Reduction in Test-Score Gaps Related toParental Education Attributable to the Blueprint ....... 78
6.1. Predicted Effect of Blueprint Elements on Annual Gainsin Reading Achievement Among Elementary SchoolStudents by Year.............................. 82
6.2. Predicted Effect of Blueprint Elements on Annual Gainsin Reading Achievement Among Middle SchoolStudents by Year.............................. 83
6.3. Predicted Effect of Blueprint Elements on Annual Gainsin Reading Achievement Among High School Studentsby Year .................................... 84
7.1. Predicted Effect of Blueprint Elements on Annual Gainsin Math Achievement Among Elementary SchoolStudents by Year.............................. 91
7.2. Predicted Effect of Blueprint Elements on Annual Gainsin Math Achievement Among Middle School Studentsby Year .................................... 92
7.3. Predicted Effect of Blueprint Elements on Annual Gainsin Math Achievement Among High School Students byYear ...................................... 93
7.4. Predicted Effect of Blueprint Elements on Time Absentin Elementary Schools.......................... 94

xxxi
7.5. Predicted Effect of Blueprint Elements on Time Absentin Middle Schools............................. 95
7.6. Predicted Effect of Blueprint Elements on Time Absentin High Schools .............................. 96


xxxiii
Tables
2.1. Summary of Blueprint Implementation by Grade andYear ...................................... 17
3.1. Percentage of Students Participating in EDRP ......... 243.2. Percentage of Students Participating in Blueprint-Related
Summer School .............................. 253.3. Percentage of Students Participating in Grade
Retention................................... 253.4. Percentage of Students Participating in Literacy
Placement .................................. 263.5. Percentage of Students Overall Participating in
Blueprint-Related Intervention Programs ............ 283.6. Percentage of Students Overall Participating in
Individual Blueprint Interventions Between 2000–2001and 2001–2002 .............................. 28
3.7. Percentage Change in the Number of Interventions perStudent from 2000–2001 to 2001–2002............. 29
3.8. Percentage Distribution of Overall InterventionDynamics by Number of Interventions per Year........ 30
3.9. Percentage of Students Participating in BlueprintInterventions by the Level of Education of the Student’sMore Highly Educated Parent .................... 32
3.10. Percentage of Students Participating in BlueprintInterventions by Student Ethnicity ................. 33
3.11. Percentage of Students Participating in BlueprintInterventions by English Learner Status.............. 33
3.12. Percentage of Students Participating in BlueprintInterventions by the Number of Grade EquivalentsBehind on the Stanford Diagnostic Reading Test ....... 36
3.13. Percentage Participation Rates by Eligibility Status,Intervention, and Year.......................... 41
4.1. Student, Family, and Neighborhood Controls Used inthe Statistical Models for Elementary School Students ... 46

xxxiv
4.2. School, Classroom, and Student Body Controls Used inthe Statistical Models for Elementary School Students ... 47
4.3. The Statistical Significance of Blueprint Elements inModels of Gains in Students’ Reading Scores.......... 52
5.1. Predicted Effect of Blueprint on Participants and AllStudents as a Percentage of the Standard Deviation inReading Scores in Spring 2002.................... 67
5.2. Decomposition of Predicted Two-Year Effect ofBlueprint Elements on Participants as a Percentage of theStandard Deviation in Reading Scores in Spring 2002 ... 68
5.3. Spring 2000 Gaps in Reading Achievement BetweenVarious Student Subgroups, in Stanford 9 Scaled Scoresand in Grade Equivalents........................ 74
B.1. Regression Results for Elementary Schools............ 122B.2. Regression Results for Middle Schools .............. 125B.3. Regression Results for High Schools ................ 128

xxxv
Acknowledgments
This research project is a product of a multiyear collaboration withmany departments within the San Diego Unified School District. It hasbeen a pleasure to work with everyone at the district. We would like tothank former Superintendent Alan Bersin, now Secretary of Educationfor California, for the opportunity to study this very interesting andchallenging topic. We are particularly grateful for the assistanceprovided by Karen Bachofer, who unstintingly provided her time toreview our research plans and share her insights on results. We wouldlike to thank Peter Bell, Sally Bennett, Jeff Jones, Dina Policar, LeahBaylon, and Gary Knowles from the Research and ReportingDepartment. We also benefited from the help of Debbie Broderick andPia Reyes from the Extended Learning Opportunities Department.
We would like to acknowledge the generous financial support of TheWilliam and Flora Hewlett Foundation and The Atlantic Philanthropies,which have funded this Blueprint project. We would particularly like tothank Marshall Smith, Program Director for the Education Program atThe William and Flora Hewlett Foundation for his enthusiasm for thisproject and for his valuable insights. We also warmly acknowledge thePublic Policy Institute of California, which provided the financialsupport that led to the first PPIC report on San Diego schools in 2003,and without which the infrastructure for the current project would nothave existed. In addition, at the University of California, San Diego,Dean of Social Sciences Paul Drake has kindly provided space for theoverall SDUSD project since its inception in 2000. Without all of thissupport, this report would not have been possible.
Finally, we are indebted to our reviewers, Tracy Gordon, HenryLevin, Paul G. Lewis, Margaret Raymond, and Jon Sonstelie, as well asto our editors, Gary Bjork, Joyce Peterson, and Patricia Bedrosian formany helpful suggestions.

xxxvi
Any opinions or interpretations expressed in this report are those ofthe authors alone and do not necessarily reflect the views of the PublicPolicy Institute of California.

xxxvii
Acronyms
API Academic Performance IndexARI Analytical Reading Inventory
BCLAD Bilingual Crosscultural Language and AcademicDevelopment
CBEDS California Basic Educational Data SystemCCTC California Commission on Teacher CredentialingCLAD Crosscultural Language and Academic Development
CSR Class Size ReductionCSU California State UniversityDRA Developmental Reading Assessment
EDRP Extended Day Reading ProgramEL English Learner
FEP Fluent English ProficientLAE Limited Assignment Emergency
LAUSD Los Angeles Unified School DistrictNCLB No Child Left BehindSDRT Stanford Diagnostic Reading Test
SDUSD San Diego Unified School DistrictUC University of California

1
1. Introduction
In 1983, a national commission released A Nation at Risk, a clarioncry for the need to improve public schooling in America.1 Partly inresponse to this scathing report, states have moved to introduce studenttesting systems. These testing systems, although controversial, haveperformed a public service by exposing large and persistent achievementgaps related to race, parental education, and parental income. Forexample, Jencks and Phillips (1998) provide a well-known survey of theblack-white achievement gap.
In a California context, Betts, Rueben, and Danenberg (2000) andSonstelie, Brunner, and Ardon (2000) document test score gaps andhistorical trends that have exacerbated these patterns. Betts, Zau, andRice (2003) find that in San Diego racial and socioeconomic gaps inmath and reading performance are very large. For instance, in spring1998, the reading achievement of Hispanic and black students in grade 8on average equaled or lagged slightly behind that of white students ingrade 5. Although the researchers found that these gaps narrowedbetween 1998 and 2000, large gaps remain.
Prodded by these stubborn achievement gaps, virtually all stategovernments have recently implemented school accountability systems.For instance, in 1999, California implemented the Public SchoolAccountability Act. It mandates state content standards, student testing,and a school-level accountability system that has “teeth”—that is,consequences for failing schools. This trend has gained furthermomentum with the passage in 2001 of the federal No Child LeftBehind (NCLB) Act. NCLB requires that states test students in specificgrades, to set criteria for “proficiency” and minimum percentages ofstudents expected to meet those proficiency standards, and sets out anescalating series of interventions for schools identified as failing._____________
1The National Commission on Excellence in Education (1983).

2
A key component of both federal and state systems is an emphasisnot only on increasing average achievement levels but on reducing thelarge gaps in achievement among student racial groups andsocioeconomic groups.
The creation of school accountability systems represents a helpfulstep forward, but it has left school districts to their own devices as theyfind ways to boost overall achievement and to narrow the achievementgaps in their own schools. What is to be done? One might think that asimple solution is to spend more—for instance, by cutting class size or byincreasing teacher salaries in hope of attracting a greater number ofhighly qualified individuals to the teaching profession. However,rigorous studies have found only limited evidence that such spendingtranslates into systematically better outcomes for students.2 Further,broad untargeted reforms such as these will do little to narrowachievement gaps. Rather, what appears to be needed is a large andfocused intervention targeted at the students who lag furthest behind.
A number of large school districts in the United States have recentlyembarked on such reforms. Indeed, the pressure created by states’accountability systems and similar provisions under NCLB have inducedmost districts to struggle to find new and better ways to teach students.But at the same time, the sheer scope of the reforms in some districts setsthem apart from the efforts under way in other districts. Two examplesof standouts are the districts in Chicago and San Diego. The ChicagoPublic Schools system has received national attention for itsaccountability-based reforms that direct additional resources (andsanctions) toward students who fall seriously behind grade level andtoward schools that serve large numbers of such students. President_____________
2For early national evidence see the classic work by Coleman (1966), and for a fairlyrecent review, see Hanushek (1996). For the California context, see Betts, Rueben, andDanenberg (2000) and Betts and Danenberg (2001). Using data from San Diego, Betts,Zau, and Rice (2003) provide some evidence that class size is negatively associated withstudent gains in test scores, but in elementary school grades only, and that teacherqualifications are associated with gains in test scores, but mainly in higher grades. Forsomewhat mixed evidence on the effect of California’s Class Size Reduction (CSR)program, see CSR Research Consortium (1999, 2000), Bohrnstedt and Stecher (1999,2002) and Jepsen and Rivkin (2002).

3
Clinton (1998) went so far as to mention the reforms favorably in a Stateof the Union address.
Following on the heels of Chicago Public Schools, San DiegoUnified School District (SDUSD) has recently implemented its ownquite distinct flavor of reforms and, like Chicago, has garnered nationalattention, in part because of the sweeping nature of the reforms.
The district’s ambitious “Blueprint for Student Success” represents amajor redeployment of resources to assist students who lag seriouslybehind. Although the Blueprint reforms are now beginning to assiststudents whose math achievement falls behind national norms, the initialfocus was squarely on reading achievement. Students who performpoorly on district reading assessments can be placed into double- ortriple-length English classes, some of which have reduced class sizes.These courses, which concentrate on improving students’ reading andwriting skills, are referred to as literacy block and literacy core. Inaddition, students can receive further assistance outside regular schoolhours and in summer school and in some cases can be held back a grade.At the same time, the district has embarked on systemic reforms toteacher training, with peer coaches being assigned to improve teachingmethods, and has introduced numerous professional developmentofferings to help teachers sharpen their skills. Another component of thereforms includes curriculum and textbook spending to improve theclassroom environment.
The reforms have received high degrees of interest locally, statewide,and nationally. The William and Flora Hewlett Foundation donated$7.5 million dollars over the first two years of the reforms to helpimplement the Blueprint and another $6 million in 2003. The Bill andMelinda Gates Foundation donated $15 million over five years.Marshall Smith, former U.S. Under Secretary of Education and currentlyProgram Director for Education of the Hewlett Foundation, told the SanDiego Union Tribune: “This really is the most important urban schoolreform effort in the country. . . . If the reforms work here they will havea national effect because ideas travel.”3 Similarly, the AtlanticPhilanthropies, based outside California, made a $5 million grant to the_____________
3McGee (2001).

4
district to support the Blueprint implementation. Alan Ruby, a seniorofficial for Atlantic Philanthropies is quoted in a district press release assaying: “We believe that the reforms underway at San Diego CitySchools are extraordinarily important and demonstrate that district-widereform in an urban school district setting is possible.”4 Articles in theSan Diego Union Tribune in October 2002 quote former U.S. Secretaryof Education Rod Paige and former California Secretary of EducationKerry Mazzoni as strongly supporting the Blueprint. In addition,reforms that resemble the Blueprint are now being introduced elsewhere.For instance, in New York City, Mayor Bloomberg has implementedreforms including “literacy and math coaches” at the school level and amore uniform elementary school curriculum.5
Locally, the Blueprint has generated intense interest and controversy,with the business community supporting district board members andcandidates for the board who support the Blueprint. However, the localteacher’s union has expressed disappointment that teachers have not beeninvolved more in the design of the reforms. In fact, a survey of districtteachers conducted for the school board by the American Institutes forResearch found that many teachers oppose the reforms.6
Perhaps most important, the Blueprint has generated diversereactions among various ethnic/racial communities. Supporters—forexample from the Urban League—express gratitude for the additionalresources being targeted at low achievers and the narrowing achievementgap.7 Detractors express a number of concerns. Alberto Ochoa, Co-Chair of the San Diego County Latino Coalition on Education, in anOctober 29, 2001, op-ed in the San Diego Union Tribune expressedconcerns that it would be Latinos who would be predominantly assignedto the extra-length English classes. In a separate October 9, 2001, letteron behalf of the coalition to the district school board, Ochoa equated the_____________
4See http://www.sandi.net/news-releases/news-releases/2002/020212.grant.html.For information on the additional Hewlett Foundation grant see http://www.hewlett.org/Programs/Education/Achievement/News/sandiegogrant.htm.
5Gootman (2005).6American Institutes for Research (2002).7See Price and Steppe (2002).

5
double- and triple-length English classes that the final version of theBlueprint implemented with academic tracking. He expressed concernthat this tracking would reduce Latinos’ ability to complete courserequirements needed for admission to the University of California andCalifornia State University (UC and CSU) systems.8 Clearly, thedoubling and tripling of the length of English classes for some studentsraises critical issues.9
The charge that the district’s system is merely tracking wouldbecome moot if it could be shown that the additional time devoted toliteracy leads to better student outcomes. A proof in this regard wouldhave to demonstrate that in the short run, literacy block/core and theother English classes with increased length increased the rates ofimprovement in English reading tests.
With the eyes of education policymakers from around the countryfocused on San Diego, important questions arise about the extent towhich the reforms succeed in improving reading achievement. Inaddition to examining overall trends, it is equally if not more importantto understand which components of the reforms are having the most andleast beneficial effect. The only way to study these issues is to drill downto the level of the classroom and the individual student and teacher sothat the package of interventions received by each student can bemeasured accurately.
Unfortunately, it is impossible to use existing state databases to shedmuch light on the mechanics of these important reforms. Althoughresearchers have already done much useful work with these databases, theinability of the databases to measure achievement at the student level, totrack students over time, to track teachers over time, and to link studentsto their teachers means that some of the most important education policyquestions facing California and the nation cannot be addressedeffectively.10
_____________8See Ochoa (2001a, 2001b).9See also Cuban and Usdan (2003a) for a review of the political controversy
surrounding the reforms.10For example, the reports by the CSR Consortium (e.g., Bohrnstedt and Stecher,
2002) that have analyzed the statewide CSR initiative have repeatedly pointed out that

6
Basic ObjectivesFor this study, we have put together an ideal dataset for addressing
the Blueprint reforms: a student-level dataset that is longitudinal (i.e., itfollows students over time), that links students to teachers, and thatcontains rich characterizations of everything from student background tocurriculum, student participation in specific Blueprint programs, andteacher qualifications. This report analyzes the data statistically,providing the first student-level analysis of the effect of the Blueprintreforms. It studies the school years 1999–2000 through 2001–2002.We chose these years because the district formally introduced theBlueprint in summer 2000, with partial implementation of somecomponents of the reform in 1999–2000.
The overall objectives of this research project are fourfold. First, wewant to explore how many students participated in each intervention inthe first two years. In this regard we also want to study how the districtuses test scores to assign students to interventions. Second, we want todetermine the effect of the Blueprint reforms on average readingachievement and on the gap in reading achievement betweenracial/ethnic groups and between groups defined by their socioeconomicand language status. Third, we seek to understand the mechanismsthrough which the Blueprint has worked most and least effectively. Ourfourth goal is to provide policy advice. Each year district administratorshave fine-tuned components of the reforms, and it is important foradministrators to have objective evaluations of the reforms when makingthese policy decisions. With Superintendent Alan Bersin’s departurefrom the district in July 2005, the Blueprint is at a crossroads. Dr. CarlA. Cohn, the new superintendent whom the district board appointed totake over in October 2005, will have many difficult choices to makeabout the future direction of the reforms. We believe that our findingscan assist other districts statewide and nationwide as they designeducation reform plans of their own. Indeed, former SuperintendentBersin’s appointment by the governor to become the state Secretary of______________________________________________________________we cannot know the effect of CSR for sure without following individual students overtime and taking account of variations in the qualifications of their teachers.

7
Education in July 2005 should only heighten curiosity outside SanDiego about the effect of the Blueprint on student achievement.
Relation to Other ResearchThe American Institutes for Research was hired by the SDUSD
school board to evaluate the Blueprint and has thus far publishedevaluations of the first two years of the Blueprint (2000–2001 and2001–2002).11 Roughly speaking, that research has employed twotechniques. The first is to measure progress in student achievement, inSDUSD and in a number of comparison districts using several of thestatewide tests. The second technique has involved surveys of districtteachers.
Both of these approaches have already yielded valuable insights. Thetest-score comparison suggests that test scores overall have risen inSDUSD but have risen just as fast in comparison districts, if not faster.The one key advantage held by SDUSD in the first two years of thereforms is that reading scores at the elementary school level grew morequickly than in comparison districts. At the high school level theopposite was true. Math scores in SDUSD improved but at slightlyslower rates than in comparison districts. Because the researchers did notobserve the Blueprint interventions in which a specific student engaged,the American Institutes for Research reports are very careful to state thatthe Blueprint did not necessarily “cause” any of these differences intrends.12
It is important to understand that this “horse race” between districtscannot inform the debate on whether the Blueprint has improvedachievement. After all, other districts around the state have felt the same_____________
11See American Institutes for Research (2002) and Quick et al (2003). See alsoStein, Hubbard, and Mehan (2004) for a perceptive comparison of the “cultures ofreform” in SDUSD and New York City’s District #2. Former SDUSD Chancellor ofInstruction Tony Alvarado made major contributions to academic reforms in bothdistricts. Hightower (2002) also provides an overview of the reforms.
12Similarly, the American Institutes for Research reports do use student-level testscore data (for San Diego only), but because these data-points are not supplemented byinformation on whether the individual student participated in a given Blueprintintervention, the student-level data cannot provide much more detail than the overalldistrictwide trend analysis.

8
pressure to introduce reforms to boost achievement and to narrow thesurprisingly large achievement gaps between racial, socioeconomic, andlanguage groups that exist all across California. They too haveimplemented reforms. For instance, it is well known that thesuperintendents of SDUSD and Los Angeles Unified School District(LAUSD) have consulted with one another frequently. Some of thereforms in LAUSD bear a distinct resemblance to those in its sisterdistrict to the south. LAUSD has increased its use of Open Court forteaching reading in the elementary school grades, like San Diego has.Thus, the comparison of test-score trends across districts, although ofvital importance, can tell us about the relative success of reforms indifferent districts, but it cannot tell us about the extent to which reformpackages have succeeded in an absolute sense.
There is a second and more fundamental issue about this horse-raceapproach. San Diego was among the top-ranked large districts inCalifornia in 1998, the first year of the new testing regime, and it hasmaintained that position through recent years. However, it is unclearwhether we should expect two districts that started at different test scorelevels to improve at the same rate. The pattern statewide has been forlow-scoring schools and districts to catch up somewhat with counterpartsthat initially scored at a higher level. It is not clear whether thisrepresents a genuine narrowing of the achievement gap across districts ora statistical artifact of the tests employed by the state.
The teacher surveys conducted by the American Institutes forResearch are not linked to individual schools but do give an overallpicture of teacher reactions in San Diego. In short, teachers on thewhole express reservations about the way the reforms were implemented,including, more specifically, a lack of consultation with teachers aboutthe design of the reforms and a concern that teachers lost some of theflexibility they previously had to design curriculum and lessons specificto their classes. For example, in its first-year survey, American Institutesfor Research (2002) reports that 58 percent of teachers agreed or stronglyagreed with the statement that “The Literacy Framework is helpful fordesigning my lessons.” (The Framework is an integral part of theBlueprint, enumerating and describing various approaches that teachersshould use to boost the literacy of their students.) However, 88.2

9
percent of teachers reported that they were “not at all” involved in thedecisions about the implementation of the Blueprint. When given thestatement “If I had concerns about the Blueprint, I know that the districtwould listen to them,” 9.0 percent agreed or strongly agreed, 87.9percent disagreed or strongly disagreed, and 3.2 percent failed to answer.When asked whether they enjoyed teaching more or less during2000–2001 than during the previous year, 17.6 percent reported thatthey enjoyed it a little or a lot more, compared to 55.2 percent ofteachers who reported that they enjoyed teaching less. A large majorityof teachers stated that the Blueprint significantly influenced their feelingsabout teaching that year. One of the most useful parts of the teachersurvey asked teachers about the extent to which various components ofthe reforms held promise. The component that teachers believed heldleast promise was the peer coach program that places teacher trainersinside schools to work with classroom teachers. Quick et al. (2003)report on a follow-up survey of teachers in the 2001–2002 school yearthat continued to find that teachers had concerns about various aspectsof the Blueprint.
These survey results from the American Institutes for Research revealthat teachers have considerable misgivings about the overall Blueprintand some of its components. But, of course, these findings in no wayprove that the Blueprint has failed to boost student achievement.13
The present report is intended to complement the existing AmericanInstitutes for Research studies. We did not conduct teacher surveys, nordid we replicate those studies’ careful comparison of overall district test-score trends with trends in other districts. Rather, our goal was toexamine gains in individual students’ reading achievement to test_____________
13Another noteworthy publication, edited by Hess (2005), provides an overview ofthe evolution of over a dozen aspects of the San Diego district and is a useful reference onthe inner workings of San Diego as a major school district. It includes an update on testscore trends by Margaret Raymond that matches the American Institutes for Researchconclusions fairly closely and summaries of the union-administration relationship, specialeducation, professionsal development, and a host of other issues. Zau and Bettscontributed an overview of school choice in the district, and Betts provided a qualitativeoverview of how the Blueprint works. However, the book does not deal at all with theissue of whether and how the specific Blueprint interventions boosted studentachievement.

10
whether participation in specific Blueprint interventions has in factboosted reading proficiency. This student-level analysis is valuablebecause it gets inside the “black box” to help us better understand whichBlueprint reforms have proven most successful to date. It also allows aconvincing analysis of socioeconomic and racial gaps in studentachievement and the extent to which the Blueprint has affected thosegaps.
Design of the ReportThe next chapter provides more detail on the Blueprint reforms and
then outlines the set of questions we seek to answer and the analyticalapproach we use. Chapter 3 studies the implementation of Blueprintinterventions in the first two years, documenting student participationrates in each intervention. In addition to presenting overall participationrates and rates by student subgroups, the chapter discusses whether the“right” students were assigned to interventions as determined by theirreading test scores. Chapter 4 provides a statistical analysis of the extentto which Blueprint interventions have worked. Chapter 5 analyzes thecumulative two-year effect of the Blueprint on student achievement andvarious measures of the achievement gap. Chapter 6 explores thedynamics of the effect of the Blueprint interventions, and Chapter 7 testsfor potentially adverse side effects. Chapter 8 provides an overview and atentative discussion of policy. We say “tentative” for a simple reason:Studies of systemic education reforms have often shown that themodifications take some time to work. Implementation is rarely perfectin the first year or two, and personnel may require considerable trainingbefore the reforms truly take root. Because this report examines the firsttwo years of the Blueprint reforms, the reader should bear this caveat inmind.

11
2. Overview of Blueprint Reforms,Key Policy Questions, andResearch Design
We begin by describing the demographic setting of SDUSD—thehost for the Blueprint reforms. As the second-largest school district inCalifornia and the eighth-largest nationally, SDUSD enrolled 141,000students in 1999–2000, the first year of our study. The district serves adiverse population of students. For instance, in 1999–2000, non-Hispanic whites made up only 27.5 percent of students, compared to37.2 percent for Hispanics, 16.6 percent for African Americans, 9.1percent for Asians, 8 percent for Filipinos, and 1.6 percent for otherracial/ethnic groups. In that same year, 63.2 percent of students wereeligible for free or reduced-price meals, and 28.1 percent were EnglishLearners (ELs). The district serves a considerably more disadvantagedgroup of students than the typical district in California, although inmany respects its students resemble those in other large urban districtsstatewide. As a border city next to Tijuana, Mexico, San Diego also hashigh rates of in- and out-migration, at least among lower-income groups.To the extent that race, income, and mobility predict test scores, we seein San Diego an archetype of the sort of large urban district that willhave to boost test scores markedly if it is to meet the federal mandate of“no child left behind”—that is, having all students meet state proficiencystandards of achievement by the target date of 2012.1
Summary of Blueprint ReformsIn 1998, Superintendent Alan Bersin enlisted the help of Chancellor
of Instruction Tony Alvarado to develop and implement the Blueprint._____________
1See Chapter 2 of Betts, Zau, and Rice (2003) for a more detailed comparison ofSDUSD with California as a whole and with other large urban districts in the state.

12
Chancellor Alvarado helped to adapt some of the reading reforms that hehad previously introduced as Superintendent of Community SchoolDistrict #2 in New York. The Blueprint that emerged in San Diegoemphasizes the concept of “Balanced Literacy,” which calls for teachers topromote reading “by, with, and to children.” The central idea in thisapproach is that teachers assign to students readings at varying levels ofdifficulty. The teachers become more actively involved (reading with orto students) as they introduce progressively more difficult text to theirstudents. Stein, Hubbard, and Mehan (2004) provide a fuller description.
The Blueprint consists of three main strategies that prioritize astudent’s literacy and mathematics abilities. The first strategy isprevention. This strategy applies to all students and teachers and focuseson extensive training of teachers, effective classroom materials, andenhanced teaching of students. The second strategy is intervention.Teachers identify below-grade-level students who then receive extrainstruction through programs including extra-length English classes,extended day or summer school programs, and more focused teachertraining in literacy or mathematics, depending on the students’ needs.The final strategy is retention—that is, having a student repeat a gradewith accelerated support. Contrary to many districts that focus theirretention efforts at the exit grades (i.e., fifth or sixth grade for elementaryschool or eighth grade for middle school), the Blueprint targets the entrygrades of first grade for elementary school and sixth grade for middleschool (seventh grade for junior high school). Students who are stillsignificantly below grade level despite the intervention efforts at the endof the year in these grades will be retained and placed into acceleratedclasses the following year.
Initially, the interventions focused on reading, although in 2000–2001, special courses in mathematics were introduced in secondaryschools. Because of this focus on reading, and because of the largenumber of English Learners in the district who face the immediatechallenge of mastering English, this report focuses on the effect of theBlueprint on reading achievement.
Although the Blueprint has a large number of strategies, the themethat unites these strategies is extra time on task for students, with a focuson the basics of reading and writing, rather than a pure focus on

13
literature. All of this is backed by professional development for teachersthat was designed to help teachers choose appropriate teaching strategiesfor students at various levels of literacy. However, the Blueprint is not ingeneral prescriptive in the sense of requiring that teachers teach fromspecific texts at specific times.
The prevention strategies for students that were in place in the firstyear, 2000–2001, included
• Use of a new literacy framework in all grades, which outlinesmethods that teachers can use to boost literacy,
• “Enhanced classes” for all kindergarten and grade 1 teachers(which consisted of professional development, provision ofhighly structured Open Court teaching materials, and funds forother classroom materials),
• “Genre studies,” also known as Enhanced Literacy, whichconsists of a two-period English class, with a focus on improvingstudents’ reading and writing skills; this class is intended for allstudents in the entering grade of middle or junior high school(grades 6 and 7, respectively) who are near to, at, or above gradelevel in their reading achievement; in addition, genre studiesteachers receive related professional development, and
• One or two peer coaches for all schools to help teachers learnproven teaching methods.
With the exception of the genre studies course given to students at orabove grade level in grades 6 or 7, all of the above preventive strategies areaimed at all students in a given gradespan. In addition, two otherpreventive strategies were directed at focus schools (the elementaryschools with the weakest scores in the state test, ranking in the bottomtenth statewide). These schools received an extended school year, asecond peer coach, and other funds and staff. In addition, the elementaryschools that ranked in the second-lowest decile of the state ranks, knownas API 2 schools, received a second peer coach and additional funds but

14
not an extended school year. In the first year of these programs,2000–2001, there were eight focus schools and 11 API 2 schools.2
The second category of Blueprint reforms is a detailed set ofinterventions. Unlike the preventive measures, the interventions aretargeted at specific groups of students. Decisions about who receivesthese interventions are based upon student test results. The testing inreading is done as follows. K–3 students and grade 4 EL students areassessed individually by their teachers, and a Developmental ReadingAssessment (DRA) level is determined. Students in grades 4–10 aregiven a test called the Stanford Diagnostic Reading Test (SDRT) in agroup setting. Students who score significantly below grade level may begiven another exam that is conducted by the teacher on an individualbasis, to confirm the results of the group-administered test. Thiseffectively gives students a second chance. If the student performs poorlyon the second test, he or she is assigned to one of the interventions. TheBlueprint lays out very specific exam score bands that determine astudent’s designation.3
Below, we outline the key intervention strategies and the gradesofficially covered according to the Blueprint formally adopted in 2000.In some cases, our data show that the district changed the gradescovered, and the following descriptions note those exceptions:
• Genre studies/literacy block. (We will refer to this more simplyas “literacy block.”) Probably the best-known intervention isthis variant of genre studies given to students who lag below orsignificantly below grade level. In grades 6 and 7 of middle andjunior high school, students who are below grade level in reading
_____________2API is the acronym for the Academic Performance Index, a statistic measuring
overall student achievement in a school. The California Department of Educationcalculates the API for each school annually. It also ranks schools into API deciles.Hence, API 2 schools rank in the second-lowest decile of achievement statewide.
3For instance, students who take the SDRT are identified as belowgrade level if theyare 1.1 to 3.0 grade equivalents behind norms in reading, and they are identified assignificantly below grade level if they are more than 3.0 grade equivalents behind. Ingrade 9, students who are below or significantly below norms in reading are assigned toliteracy block and literacy core classes, respectively, unless they show improvedperformance when they take the second test, the Analytical Reading Inventory (ARI).

15
attend the same sort of double-length genre studies classes as dostudents who are at or above grade level, but in this case classsize is reduced to 20. Students in higher grades through grade10 also receive these courses if they lag below or significantlybelow grade level in reading. (San Diego High School alsooffers literacy block in grade 11.) In addition, class size isreduced to 20 in grade 9. There is an additional option forsome grades.
• Genre studies/literacy core. For students significantly belowgrade level in grade 9, the literacy class is extended to threeperiods. Again, these class sizes are 20:1. We will refer to theseclasses more simply as “literacy core.” In 2001–2002, grade 6and 7 students also began to participate in literacy core.
• Extended Day Reading Program (EDRP). In all schools withgrades 1–9, students below and significantly below grade level ingrades 3, 6, 7, 8, and 9 (beginning winter 2001 in the last case)receive three 90-minute periods each week of supervised readingbefore or after school. In practice, we found that EDRP wasimplemented in grades 1–8 in both 2000–2001 and 2001–2002.
• Summer school. The Blueprint calls for two types of summerschool. The first and more novel type of summer school isaimed at students in most K–9 grades who lag below andsignificantly below grade level. Students are asked to attend forsix weeks, for four hours per day. EL students are automaticallyeligible to attend this “Blueprint summer school.” In addition,all secondary school students with D or F grades attend a moretraditional type of summer school consisting of six weeks ofcourses in core subjects.4 We will focus on the former, less-conventional type of summer school and refer to it as Blueprintsummer school, reserving the term “summer school” for themore traditional sorts of makeup classes for students who havefailed a specific course. Some schools in the district, mostlyelementary schools, are year-round schools, which means that
_____________4Summer school for kindergarten was phased in at four elementary schools in
2000–2001 and extended to all elementary schools in 2001–2002.

16
their schedules do not permit the implementation of Blueprintsummer school. At these schools, students in affected gradeswho lagged behind in reading participated in special intersessionstudies in lieu of Blueprint summer school.
• Grade retention. In extreme cases, students may be asked torepeat a grade and are given additional support in the year thatthey repeat the grade. The district intends to identify studentswho lag seriously behind soon after they arrive at a school.Accordingly, grade retention is limited to entry-level grades ofelementary and middle school/junior high school: grades 1, 6 inmiddle school, and 7 in junior high school.5
Table 2.1 provides an overview of the preventive measures andinterventions in place each year. For this table, we have used our analysesof actual participation by year and grade. We have indicated that a givengrade participated in a given Blueprint element if more than 0.5 percentof students participated. (In almost all cases, implementation was farabove this level.) There were several cases such as EDRP in which wefound that the program was implemented in more grades than originallyenvisioned by the Blueprint. In addition, especially at the high schoollevel, we found that a very small percentage of students who officiallywere in grades beyond a given intervention actually did participate.
Key Policy QuestionsThis research had four overarching goals. First, we explore how manystudents have participated in each intervention in the first two years andwhether the “right” students have participated, as determined by theirreading test scores. Second, we determine the effect of the Blueprintreforms on average reading achievement and on the gap in readingachievement among various groups of students. Third, we test whetherthe various Blueprint elements have varied in their effectiveness. Ourfourth goal is to provide policy advice, which flows primarily from ourfindings about the relative effectiveness of the individual Blueprintelements._____________
5The first time Blueprint retention decisions were made was in spring/summer2001.
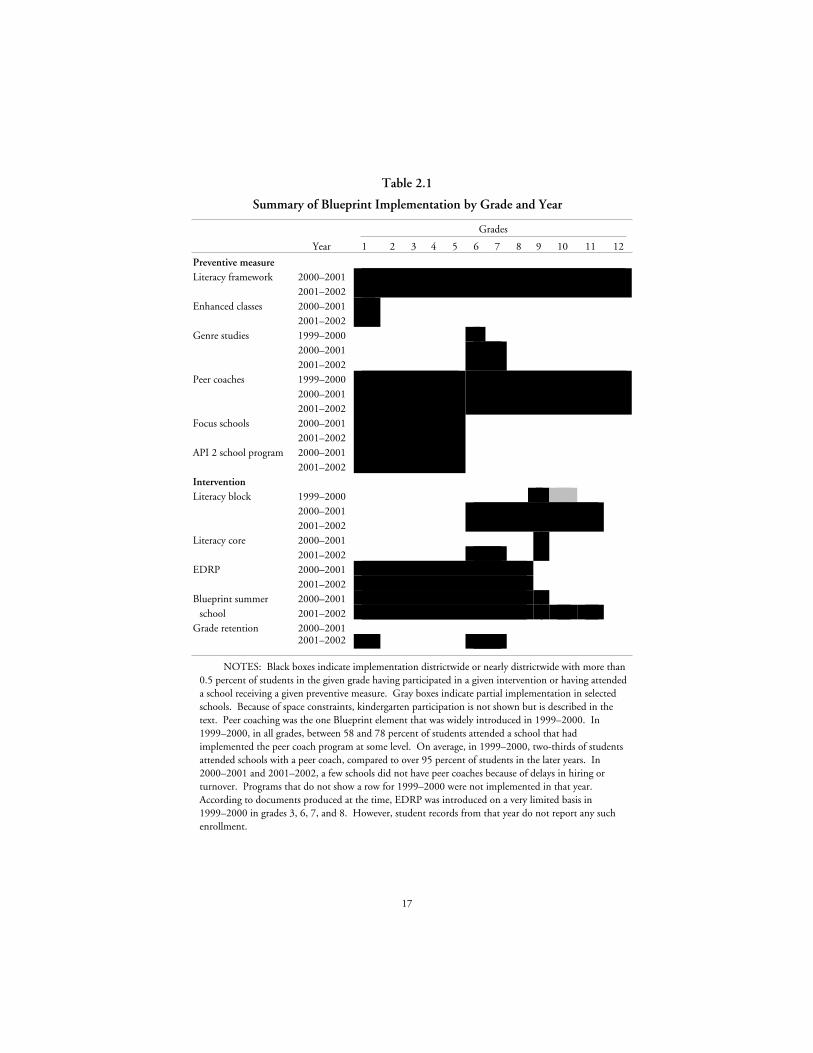
17
Table 2.1
Summary of Blueprint Implementation by Grade and Year
Grades
Year 1 2 3 4 5 6 7 8 9 10 11 12
Preventive measureLiteracy framework 2000–2001
2001–2002Enhanced classes 2000–2001
2001–2002Genre studies 1999–2000
2000–20012001–2002
Peer coaches 1999–20002000–20012001–2002
Focus schools 2000–20012001–2002
API 2 school program 2000–20012001–2002
InterventionLiteracy block 1999–2000
2000–20012001–2002
Literacy core 2000–20012001–2002
EDRP 2000–20012001–2002
Blueprint summerschool
2000–20012001–2002
Grade retention 2000–20012001–2002
NOTES: Black boxes indicate implementation districtwide or nearly districtwide with more than0.5 percent of students in the given grade having participated in a given intervention or having attendeda school receiving a given preventive measure. Gray boxes indicate partial implementation in selectedschools. Because of space constraints, kindergarten participation is not shown but is described in thetext. Peer coaching was the one Blueprint element that was widely introduced in 1999–2000. In1999–2000, in all grades, between 58 and 78 percent of students attended a school that hadimplemented the peer coach program at some level. On average, in 1999–2000, two-thirds of studentsattended schools with a peer coach, compared to over 95 percent of students in the later years. In2000–2001 and 2001–2002, a few schools did not have peer coaches because of delays in hiring orturnover. Programs that do not show a row for 1999–2000 were not implemented in that year.According to documents produced at the time, EDRP was introduced on a very limited basis in1999–2000 in grades 3, 6, 7, and 8. However, student records from that year do not report any suchenrollment.

18
We focus in particular on the following questions:
• How widely and quickly have the various programs beenimplemented? How does participation vary by race, EnglishLearner status, and parental education?
• Do the “right” students, as determined by reading test scores,receive the stipulated interventions?
• Do students who participate in the double-length literacy blockclasses improve their reading achievement more quickly thanstudents who do not participate?
• Do triple-length literacy core English classes improve readingachievement more quickly than double-length classes?
• Has Extended Day Reading had a meaningful effect on readingachievement?
• Does Blueprint summer school lead to gains in achievement? Ifso, at what grades does it work best? For students at year-roundschools that could not implement Blueprint summer school forscheduling reasons, did the substitute intersession Blueprintclasses work equally well?
• Are the various Blueprint reforms reducing the achievement gapamong races and between students who come from highlyeducated and less highly educated families?
• Have the “whole-school” reforms such as those at the focusschools, the API 2 schools, and the hiring of peer coaches led tosignificant gains in achievement at the affected schools?
• Can we find any evidence that the effectiveness of the variousreforms varies with teacher experience? For example, did theprograms at the elementary Focus schools help students with themost experienced teachers more? Similarly, in middle and highschools, did the various types of extended English classes provemore effective when taught by teachers with the mostexperience?6
_____________6In neither case is the answer clear. More highly experienced teachers may be better
placed to implement the reforms. Conversely, less-experienced teachers potentially standto gain more from the fairly prescriptive guideliness in the Blueprint and might also be

19
Overview of Data Used and Research DesignThis research builds on the database constructed for the first PPIC
report on student achievement, Determinants of Student Achievement:New Evidence from San Diego, by Betts, Zau, and Rice (2003). In thatreport, the authors compiled longitudinal data on student records andlinked those records with information on the qualifications of theteachers in each classroom. A particularly noteworthy aspect of theteacher database is that it goes considerably beyond the measures ofteacher qualifications available at a school level in the state database,providing attributes such as college major and minor and detailed subjectauthorizations at the middle and high school levels.
We augmented this database in a number of ways—first by addingvariables indicating whether students had participated in each of thespecific Blueprint interventions, as well as regular summer school.Second, we augmented our student database by using district-administered measures of reading achievement to determine who waseligible to participate in specific Blueprint interventions. Third, at theschool level, we added measures indicating whether elementary schoolswere focus schools or API 2 schools. (Recall that under the Blueprint,both types of elementary schools received additional funding or staffing.)Fourth, we added the ratio of peer coaches to enrollment at the school,to give a sense of the intensity with which the peer coach program wasimplemented in each school in a given year. We also added a measure ofthe average teaching experience of peer coaches at each school. Fifth, weupdated the data to the 2001–2002 school year to provide a full pictureof the effect of the Blueprint in its first two years.
We accessed numerous district databases to piece together thisinformation for each student. For example, we worked for severalmonths to develop accurate measures of whether a student hadparticipated in (regular) summer school or Blueprint summer school,______________________________________________________________more open to changing the way they teach, not having developed years of lesson plans inthe way that more experienced teachers might have done.

20
using course codes that varied somewhat between the two years that westudied.7
There are three important and distinct innovations in this researchrelative to the more typical California school-level research that uses stateDepartment of Education data. The first is that as a result of two yearsof data-cleaning, we have compiled a rich database on individualstudents and teachers, with extremely detailed information on bothstudents’ academic backgrounds and teachers’ qualifications. Thisenabled us to distinguish in fine detail the effect of various preventionand intervention strategies student by student.
The second innovation is that we have multiple years of data for allstudents except those who have recently moved to San Diego or whohave just started school. As in Betts, Zau, and Rice (2003), this allows usto take into account any unobserved but fixed characteristics of students,their neighborhoods, and their schools. The importance of this approachcan hardly be overstated. Researchers have long known that studentslearn at different rates, often for reasons that go beyond the school itself.By comparing a student’s gains in performance over as many as threeyears, we can “net out” variations across students in their innate rate oflearning, while detecting even small effects on learning fromparticipation in a specific Blueprint intervention in one or two years.(Because one of our three years of data is before the Blueprint wasimplemented, a student can participate in a given intervention for atmost two years.) This is far preferable to simpler approaches thatcompare achievement at a point in time between two students, withoutfirst taking into account either their scores the year before or differencesin their average rates of learning. In effect, each student becomes hisown “comparison group” because we will test whether the student learnsmore in the years that he participates in a given intervention than inyears in which he does not. Similarly, we control for unobservedcharacteristics of the student’s home zip code and his school. The latteris particularly important for assessing the effect of a school’s being_____________
7For more detail on variable construction and the assignment rules for eachBlueprint intervention, see Appendix A.

21
designated a focus or an API 2 school. We want to know whethersomething positive happens to student achievement in those years that afocus or API 2 school receives additional support from the district, aboveand beyond the pre-existing trend in student achievement at theseschools.
To control for pre-existing trends in individual student’s readingachievement growth, we include a year of gains (from spring 1999 tospring 2000) that precedes almost all of the Blueprint interventions andpreventive measures.


23
3. Patterns of StudentParticipation in BlueprintInterventions
IntroductionThis chapter examines the population and characteristics of students
who participated in the Blueprint’s student-specific interventions in2000–2001 and 2001–2002. The four interventions underconsideration in this chapter are the EDRP, Blueprint summer school,literacy block/core, and Blueprint-related grade retention. Excluded arethe two school-level preventive programs offered at focus schools and atAPI 2 elementary schools. In some sense, we can think of these asschoolwide interventions. We do not include them in this chapterbecause the Blueprint applies these interventions school by school, andthe decision to implement them is unrelated to the test scores ofindividual students.
Students were eligible to participate in the various interventionsthrough two routes. First, the district used reading tests (other than thestate test that we examine later in the report) to identify students whowere below grade level or significantly below grade level. Students ineither of these categories were recommended for one or moreinterventions in the following year. Second, all English Learners, who bydefinition have not mastered English, were eligible to participate. In thefirst part of the chapter, we examine the placement of EL students intointerventions. In the second part, we examine the extent to which thedistrict assigned non-EL students to interventions based on their testscores in reading.

24
Overall Patterns of Student ParticipationTables 3.1 through 3.4 show participation rates in the four
interventions by grade and year. EDRP participation is shown in Table3.1. The table shows that in both school years, one-quarter of studentsin grades 1 through 8 participated in the program. The highest rates ofparticipation are in grades 1 to 3, above which participation tails off.Overall roughly 21,000 to 22,000 students participated in this readingprogram in either year. Participation in fact spans a slightly greater rangeof grades than in the original conception of the Blueprint.
Table 3.2 shows participation rates in Blueprint-related summerschool. What is immediately obvious is that participation doubled from2000–2001 to 2001–2002, from 11 to 22 percent. In some ways this isnot surprising, because the Blueprint was introduced immediately beforesummer 2000, when the first Blueprint summer school sessions tookplace. Again participation rates decline in the higher grades, but this islargely by design, because Blueprint summer school was conceived as anintervention for students up to and including grade 9.
Table 3.3 reports the rate of Blueprint retention for students ineligible grades. The first time this intervention was used was in spring/
Table 3.1
Percentage of Students Participating in EDRP
Year
Grade Level 2000–2001 2001–20021 31.1 35.32 33.0 33.23 41.2 34.74 27.8 30.45 22.4 27.16 15.6 18.67 9.5 11.98 9.7 10.2Overall 25.2 26.3
NOTE: The “overall” percentages inthis chapter are calculated at the student leveland, therefore, are weighted averages of thepercentages in each grade, based on enrollment.
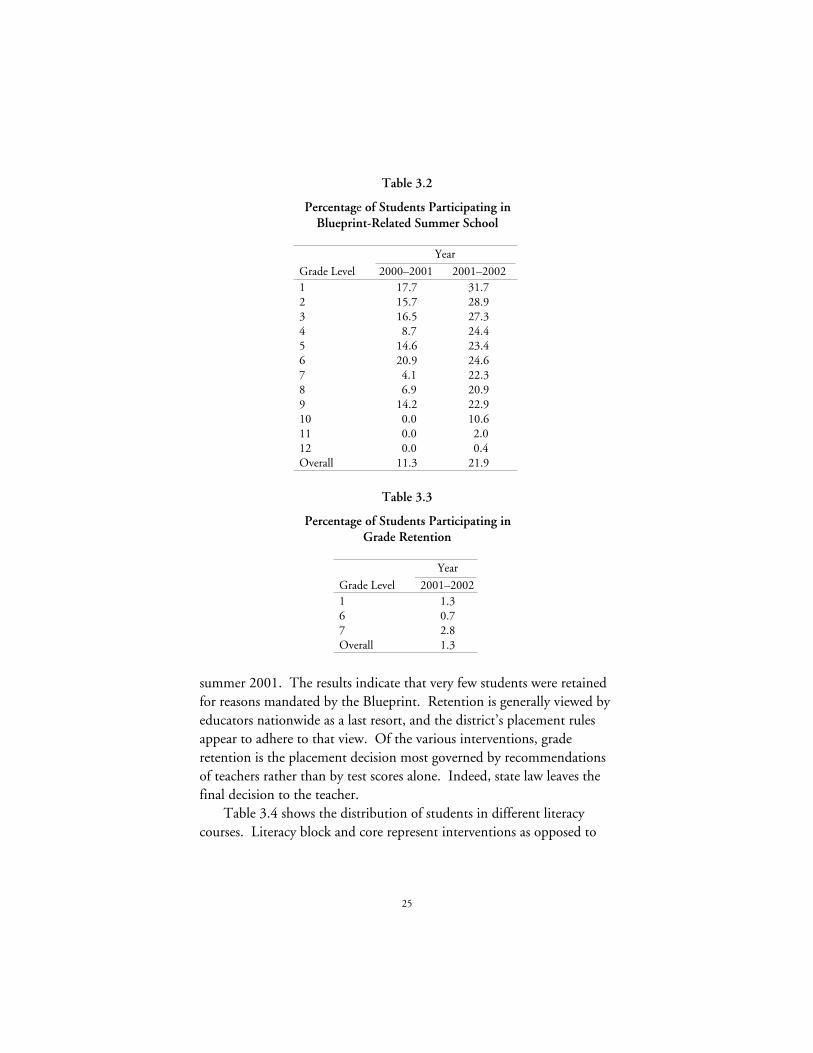
25
Table 3.2
Percentage of Students Participating inBlueprint-Related Summer School
Year
Grade Level 2000–2001 2001–20021 17.7 31.72 15.7 28.93 16.5 27.34 8.7 24.45 14.6 23.46 20.9 24.67 4.1 22.38 6.9 20.99 14.2 22.910 0.0 10.611 0.0 2.012 0.0 0.4Overall 11.3 21.9
Table 3.3
Percentage of Students Participating inGrade Retention
Year
Grade Level 2001–20021 1.36 0.77 2.8Overall 1.3
summer 2001. The results indicate that very few students were retainedfor reasons mandated by the Blueprint. Retention is generally viewed byeducators nationwide as a last resort, and the district’s placement rulesappear to adhere to that view. Of the various interventions, graderetention is the placement decision most governed by recommendationsof teachers rather than by test scores alone. Indeed, state law leaves thefinal decision to the teacher.
Table 3.4 shows the distribution of students in different literacycourses. Literacy block and core represent interventions as opposed to

26
Table 3.4
Percentage of Students Participating in Literacy Placement
Grade Single-Period Block Core Genre Studies2000–2001
6 4.8 36.7 0.0 58.47 60.2 39.8 0.0 0.08 68.4 31.6 0.0 0.09 62.3 18.0 19.6 0.010 65.8 33.9 0.3 0.011 93.5 6.5 0.0 0.012 99.5 0.5 0.0 0.0Overall 64.6 25.3 3.2 6.9
2001–20026 4.8 26.2 2.6 66.47 63.9 34.7 1.3 0.08 71.6 28.2 0.1 0.09 65.7 18.4 15.9 0.010 66.1 33.4 0.5 0.011 97.2 2.8 0.0 0.012 99.9 0.1 0.0 0.0Overall 66.6 22.3 3.2 7.9
preventive measures, because they are meant for students with low scoreson a combination of standardized tests. Block consists of a daily two-period English course whereas core consists of three periods. Genrestudies is another two-period English course, but it is viewed at thedistrict level as a preventive measure aimed at students who are at orabove grade level. Students in genre studies do not typically have lowtest scores. For completeness, we also show the percentage of studentsenrolled in single-period English classes of the sort that prevailed beforethe introduction of the Blueprint.
The results in Table 3.4 indicate that in the grades in which theblock/core intervention is a possibility, just over one-quarter of studentsare either in literacy core or block. The flip side of this coin is that apartfrom grade 6, in which students at or above grade level participate ingenre studies, the vast majority of students remained in regular single-period English classes. The table also indicates that, for the most part,students take literacy block and core only in the grades in which the

27
Blueprint states that these programs are available. There are minorexceptions. For instance, literacy block is officially offered in grades 6through 10 (and through grade 11 at San Diego High School) but ahandful of grade 12 students did enroll in block in either year, probablythrough joint decisions of teachers and parents. Similarly, a very smallpercentage of students were enrolled in a course described as literacy coreoutside grade 9, the principal grade for which core was designed. (Thedistrict’s guidelines allow for sixth and seventh grade students to be incore as well in 2001–2002, and we observe participation consistent withthis.)
Interventions as a “Package”The next broad question we asked is whether it is more appropriate
to think of these specific interventions as separate from each other or aspart of a package of multiple interventions for students who are laggingbehind. Table 3.5 reports on the distribution of students by the totalnumber of interventions in which they took part.1 In both years it wasextremely rare for students to participate in three or more interventions.About two-thirds of district students did not participate in any student-level intervention. This finding demonstrates that the district targetedinterventions in a quite focused way. Of those who participated in atleast one intervention, two-thirds to three-quarters participated in onlyone intervention in a given year.
To gain further insights about the experiences of individual students,we examined the dynamics of their participation across the two years forthe programs. Two policy relevant questions arise here. After a studententers a specific intervention, does he or she become “stuck” in thatintervention for a second year in 2001–2002? Second, did the expansionof the Blueprint in 2001–2002 bring in new students or did it primarilyexpand the number of interventions experienced by the students whohad already participated in at least one intervention in the prior year?_____________
1For the purposes of tabulating these totals, we considered a student participating ineither literacy block or core as having been in a single intervention. We did this becausethe overall strategy of these interventions is similar (double- and triple-length Englishclasses) and because a few students switched from one to the other midyear. In this waywe do not overcount student participation.

28
Table 3.5
Percentage of Students Overall Participating inBlueprint-Related Intervention Programs
Number of Year
Programs 2000–2001 2001–20020 66.0 62.01 26.1 24.32 7.4 12.73 0.5 1.04 0.0 0.0
To analyze participation dynamics, we considered only thosestudents who were in the district both years. Table 3.6 reports for eachintervention the participation rates for students based on whether theyparticipated in the first year. For example, the first panel of the tableshows that of those who participated in EDRP in 2000–2001, 51.2percent participated again in the following year.
Looking at participation dynamics across EDRP, Blueprint summerschool, and block/core intervention, we find that between 38 percentand 55 percent of those students who participated in an intervention inthe first year did not participate in the next. Blueprint summer school
Table 3.6
Percentage of Students Overall Participating in Individual BlueprintInterventions Between 2000–2001 and 2001–2002
EDRP 2001–2002Did not participate Participated
2000–2001 Did not participate 83.9 16.1Participated 48.8 51.2
Blueprint summer school 2001–2002Did not Participate Participated
2000–2001 Did not Participate 81.1 18.9Participated 55.2 44.8
Literacy placement (block/core) 2001–2002Did not Participate Participated
2000–2001 Did not participate 82.2 17.8Participated 38.2 61.8

29
exhibited the highest exit rates at 55 percent, whereas being in eitherliteracy block or core had the lowest exit rate at 38 percent. Conversely,we only occasionally see students who did not participate the first yearparticipating in the next. The highest entry rate into an intervention iswith Blueprint summer school. In this case, 19 percent enter intoBlueprint summer school (for the first time) the following year. Thisincrease no doubt reflects the scaling up of summer school in summer2001 to additional grades and schools.2
Although on an intervention-by-intervention basis our analysissuggests a slight trend toward students exiting from an intervention afterthe first year, this is not the case overall. In fact, Table 3.7 shows thatmore students increased their number of interventions rather thandecreased them in the second year of the Blueprint. There are twoexplanations for this. First, participation in Blueprint summer schooldoubled from 2000–2001 to 2001–2002. Second, the number ofpossible interventions rose from three to four as the first Blueprint graderetentions were announced in spring/summer 2001.
Table 3.8 breaks down these figures further to show transitions fromspecific numbers of interventions from one year to the next. This tableconveys the fact that students who participated in two or moreinterventions in the first year, who typically lagged far behind in reading,had well above a 50 percent chance of participating in fewer
Table 3.7
Percentage Change in the Number of Interventionsper Student from 2000–2001 to 2001–2002
Fewer in 2001–2002
Same in 2001–2002
More in 2001–2002
14.9 64.0 21.1
_____________2Another reason why it is important to look at the number of students who
participate in an intervention one year but not the other is that in Chapter 4 we willmodel the effect of these interventions on student learning. Our main statistical modelwill compare the rates of gains in reading achievement for individual students in yearsthey participated and did not participate in a given intervention. However, we build ayear of “nonparticipation” into this analysis because we include a year of data from beforethe interventions were widely introduced.

30
Table 3.8
Percentage Distribution of Overall Dynamics byNumber of Interventions per Year
2001–2002
0 1 2 3 42000–2001 0 78.6 15.7 5.3 0.4 0.0
1 36.1 38.3 23.5 2.0 0.12 24.3 37.4 34.8 3.5 0.13 14.4 45.0 29.7 9.9 0.9
NOTES: The numbers 0–4 represent the number ofBlueprint-related interventions a student received in a givenyear. Because Blueprint grade retention did not begin untilthe 2001–2002 school year, students could at most receivethree interventions in 2000–2001. Row entries do notalways total to 100 percent because of rounding error.
interventions the next year. Similarly, among students who participatedin only one intervention in 2000–2001, 36.1 percent did not participateat all in the following year, compared to only 25.6 percent whoparticipated in two or more interventions.
How does this square with the results of Table 3.7 that suggested onaverage students were more likely to increase their participation in thesecond year? The answer is clearly that just over one in five students inthe large group of students who participated in no interventions in2000–2001 did participate in one or more interventions in 2001–2002.
Overall, the picture that emerges is that students who enrolled ininterventions in the first year were more likely than not to exit from atleast one intervention in the second year. At the same time, about a fifthof the large group of students who did not participate at all in the firstyear became involved in at least one intervention in the second year, asBlueprint programs such as summer school were expanded. In otherwords, in the second year, on the whole, student participation increased inscope rather than in intensity. Also, most students who participated inBlueprint interventions took part in only one of the four or fiveinterventions available each year. It is perhaps best not to think of theinterventions as a “package” from the point of view of the typicalstudent.

31
Characteristics of Students Participating in EachIntervention
This section examines student characteristics to investigate howparticipation in the programs varies according to the students’backgrounds. Throughout this section, we present pooled data acrossthe school years 2000–2001 and 2001–2002 to give an overall picture ofparticipation by student characteristics during the first two years of theBlueprint.
Figure 3.1 shows the relationship between parental education andparticipation in EDRP and Blueprint summer school. An interestingpattern emerges. For EDRP, we see that each successively lower level ofparental education is associated with a doubling of the rate ofparticipation. Those students with parents whose highest degree is high
0
5
10
15
20
25
30
35
40
45
Par
ticip
atio
n ra
te (
%)
Less than highschool diploma
High school diploma or some college
Bachelor’s degree orpostgraduate degree
EDRP Blueprint summerschool
NOTE: Rates are calculated based on all students in relevant grades in either 2000–2001 or 2001–2002 and thus are an enrollment-weighted average of participation in the two years.
Figure 3.1—Student Participation Rates in the Extended Day ReadingProgram and Blueprint Summer School by the Level of Education of
the Student’s More Highly Educated Parent

32
school or some portion of college participate twice as much (22.6%) asthose whose parents have completed college or graduate school (10.5%).Those students whose parents did not earn a high school diplomaparticipate at double even that (41.8%). Summer school participationfollows a similar pattern of participation rates, roughly doubling asparental education falls. Table 3.9 shows the underlying numbers for allfive interventions and for completeness also shows genre studies,intended as a preventive measure for students who are at grade level inreading, and traditional single-period English classes. The table revealsthat participation in each of Blueprint summer school, Blueprintretention, literacy block, and literacy core is strongly inversely related toparental education.3
Finally Tables 3.10 and 3.11 show how the rate of studentparticipation depends on students’ ethnic backgrounds and English
Table 3.9
Percentage of Students Participating in Blueprint Interventions by theLevel of Education of the Student’s More Highly Educated Parent
Program Intervention
Less ThanHigh School
Diploma
High SchoolDiploma or
Some College
Bachelor’sDegree or
PostgraduateDegree
EDRP 41.8 22.6 10.5Blueprint summer school 25.4 14.6 7.1Blueprint retention 3.4 1.4 0.6Genre studies 2.7 7.6 10.6Literacy block 42.9 24.0 11.9Literacy core 6.7 3.0 1.3Single-period English 47.7 65.4 76.3
NOTES: We include two types of English classes that are not Blueprintinterventions, for sake of comparison. Genre studies is the preventive double-length classgiven to incoming middle/junior high school students who are near, at, or above gradelevel, and single-period English refers to a traditional (non-Blueprint) English class.
_____________3A related variable is the percentage of students at a given school who are eligible for
meal assistance, which is a proxy for parental income commonly used in the educationliterature. We found much higher Blueprint participation rates in schools serving theleast-affluent families. Details are available from the authors upon request.

33
Table 3.10
Percentage of Students Participating in Blueprint Interventionsby Student Ethnicity
Program Intervention White Black Asian-PI Hispanic OtherEDRP 12.6 26.4 18.3 37.0 15.7Blueprint summer school 7.0 18.6 14.3 23.2 9.7Blueprint retention 0.2 2.4 0.5 2.0 0.7Genre studies 12.5 5.1 7.1 4.1 10.2Literacy block 8.9 31.0 17.1 38.7 12.0Literacy core 0.6 4.8 2.3 5.4 0.8Single-period English 78.0 59.0 73.5 51.8 76.9
NOTES: Asian-PI shows combined figures for Asians/Pacific Islanders. Seealso the notes to Table 3.9.
Table 3.11
Percentage of Students Participating in Blueprint Interventionsby English Learner Status
Program Intervention Non-EL ELEDRP 17.8 45.0Blueprint summer school 11.9 29.2Blueprint retention 0.9 2.2Genre studies 8.9 0.8Literacy block 18.2 49.5Literacy core 2.0 8.7Single-period English 70.9 41.0
NOTE: See the notes to Table 3.9.
language proficiency, respectively. All nonwhite groups participate in theBlueprint’s interventions at a higher rate than do whites. Blacksparticipate roughly twice as often as whites do in EDRP and Blueprintsummer school, and Hispanics participate at about three times the whiterate. The ratios of participation relative to whites are even higher whenwe consider the other interventions.
Non-English Learner students are either students who are nativeEnglish speakers or students whose mastery of the language suggests thatthey are functionally fluent. The latter are referred to as Fluent EnglishProficient (FEP). EL students are those who are in the process of

34
learning English. Students not fluent in English participate two to fourtimes as often as fluent students do in the Blueprint interventions. Wehad expected such a result because the district has drawn up an entirelyseparate set of program placement guidelines for EL students.Specifically, the district guidelines do not use SDRT scores to allocate ELstudents to interventions. By virtue of their language status, EL studentsare automatically eligible to participate in Blueprint summer school,EDRP, and literacy block.
The extremely high participation rates of EL students in allinterventions apart from grade retention are an important finding. Itwould be wrong to claim that the Blueprint interventions affect only ELstudents, but they certainly are an important component of the targetpopulation.
Were the “Right” Students Assigned to BlueprintInterventions?
The analysis above gives a fairly detailed portrait of who hasparticipated in the Blueprint reading interventions. But it tells usnothing about whether the “right” students participated in each of theinterventions. Roughly speaking, for students who were not EnglishLearners, the district used reading test scores to determine whether thestudents were below grade level or significantly below grade level, andassigned them to interventions accordingly. This oversimplifies the rulesin several dimensions. Students who appeared to fall into either of thesecategories were often given a second reading test, and only if the resultsof this second test corroborated the initial test score were studentsassigned to Blueprint interventions. In addition, teachers had some sayin making recommendations as to which interventions a student shouldenroll in. This is particularly true for Blueprint grade retention.Further, parents had the right not to enroll their children in anyrecommended intervention.
The main test used by the district to determine assignment tointerventions is the SDRT, a norm-referenced multiple choice test.4
_____________4The SDRT is given to students in grades 4 through 10 in the springtime. In K–3,
the district instead uses the DRA, which involves a one-on-one interaction between

35
SDRT scores are translated into a measure called “Grade EquivalentsBehind” that captures the number of grade levels a student lags behindhis or her grade level. Three categories matter most to the district. Thefirst includes students who are below grade level—a category reserved forstudents who are between three and one grade levels below wherenational norms indicate they should be. In this category students areeligible for literacy block, EDRP, and Blueprint summer school. Thenext category includes students who are more than three grade levelsbelow where they should be. It is termed significantly below grade level.Being significantly below grade level makes students eligible in somegrades for Blueprint retention or literacy core. All other students areeither at or above grade level and are no longer specifically targeted forany one intervention.5
Participation Rates by Grade Equivalents BehindAs a first analysis of whether the right students participated in
interventions, we can examine participation rates in each program bygrade equivalents behind on the SDRT for students in relevant grades.Before examining these data, what should we expect to see? If thedistrict is indeed using SDRT scores to assign students, students who arebelow the test-score cutoffs for a given intervention should have muchhigher participation rates than students just above the cutoff. However,participation rates for students below the SDRT cutoff for a givenintervention should never be 100 percent, because the district policy isalways to retest such students using a different test, to verify the need forintervention.
Table 3.12 shows participation rates among students in various gradeequivalent ranges. The categories are described using mathematicalnotation. For instance the category “[–2,–1)” refers to students who______________________________________________________________teacher and student in which the teacher assigns a reading level based on a student’sreading accuracy, fluency, and comprehension of a specified set of readings. The DRA isadministered three times per year, once per grading period. For placement purposes,results of these tests from one academic year are used to recommend student assignmentsto Blueprint interventions in the summer and academic year immediately following.
5Technically, these are students for whom the value of (grade equivalent – currentgrade) is greater than or equal to –1.0. Thus, it includes students who are only slightlybehind grade level, or at or above grade level.

36
Table 3.12
Percentage of Students Participating in Blueprint Interventions by theNumber of Grade Equivalents Behind on the Stanford
Diagnostic Reading Test
Grade Equivalents Behind or Ahead of National Normsin Reading
Significantly BelowGrade Level
BelowGrade Level
At or AboveGrade Level
Program Intervention < –5 [–5,–4) [–4,–3) [–3,–2) [–2,–1) [–1,0) ≥ 0EDRP 18.4 22.2 27.0 31.7 26.5 6.9 2.0Blueprint summer school 27.3 34.1 34.5 38.4 31.6 10.1 2.8Blueprint retention 27.3 12.1 5.2 0.0 0.0 0.0 0.0Genre studies 0.0 0.0 0.4 0.9 2.7 12.4 16.4Literacy block 48.4 54.6 66.5 67.5 55.7 9.6 1.3Literacy core 23.2 21.9 11.7 1.4 0.4 0.1 0.0Single-period English 28.4 23.6 21.4 30.2 41.2 77.8 82.3
NOTES: The column headings in this table use mathematical notation to indicatethe range of grade equivalents included. For instance [–5,–4) refers to students who werestrictly more than four grade equivalents behind but who were at most exactly five gradeequivalents behind.
were strictly more than one grade equivalent behind and up to andincluding two grade equivalents behind. These are students whoseSDRT scores made them just eligible to participate in EDRP, literacyblock, and Blueprint summer school.
The table shows that program participation indeed varies stronglywith grade equivalents behind. As should be expected based on thedistrict’s guidelines regarding test scores, there are drops in participationaround the relevant cutoff points. For example, EDRP, Blueprintsummer school, and literacy block participation rates all exhibit sharpdrops at from [–2,–1) to [–1,0) which are the two bands surrounding thethreshold score for determining if a student is below grade level or at orabove grade level. Indeed, for EDRP and Blueprint summer school,participation rates rise by about 20 percentage points for students justbelow the test-score cutoff. Even more dramatically, participation inliteracy block, the double-length English classes, rises from 9.6 percent to55.7 percent just below the cutoff score.

37
There are also increases at the other cutoff that represents going frombelow grade level to significantly below grade level for the relevantinterventions—Blueprint retention and literacy core. Participation inthe grade retention program jumps from 0 percent to 5.2 percent justbelow the cutoff for significantly below grade level. Thus, Blueprintretention happens only to those students who are significantly belowgrade level, which is precisely what the rules specify. Even so, only a lowpercentage are Blueprint retained. At most slightly more than a quarterof students five grade levels behind are actually retained. We know oftwo reasons for this low participation rate among those so far belowgrade level. First, by district policy a student cannot be retained morethan one grade for any reason, so some of these students were exemptedfor this reason. Second, some special education students were exemptedbecause of exclusions incorporated into their Individual Education Plans.
Similarly, participation in the literacy core participation jumps from1.4 percent to 11.7 percent just below the cutoff for significantly belowgrade level. Interestingly, with both EDRP and Blueprint summerschool, participation rises along with better test scores for thesignificantly below grade level students and some below grade levelstudents, but it then falls dramatically for those students at or abovegrade level.
Overall, we conclude that the district clearly uses the SDRT scorecutoffs as announced, but for most interventions, students who are farbelow the test score cutoff are actually slightly less likely to participatethan those who are just slightly below the cutoff(s). We cannot tellwhether this reflects higher motivation among the students near thecutoff, greater pressure from teachers or parents to participate in theinterventions when students are only slightly below grade level, or acombination of the two.
As we expected, participation in each intervention never reachesanything close to 100 percent for students who are designated below orsignificantly below grade level as determined by the SDRT. The mainreason, as noted above, is that the district always retests such students togive them a second chance. A secondary reason is that occasionally aschool is unable to provide a given intervention to a student. Districtofficials told us that this most often happened when there were too few

38
affected students to constitute a class (such as literacy core or EDRP). Insuch cases, district policy was to give additional financial resources to theschool and to have the school create an alternative assistance program forthe student, which was to be included in the student’s LearningContract.6
Perhaps more surprising is that we found a few cases in whichstudents who were above an SDRT cutoff participated in anintervention, even though technically their performance made themexempt. District officials said that the most common reason for suchdecisions was that a class such as literacy core did not have quite enoughstudents in it to be financially workable. In such a situation, a teachercould recommend that a student whom she thought was borderlineshould participate in the intervention.
In short, SDRT scores clearly play an important role in decidingwho enrolls in specific interventions. It appears that teachers have themost leeway to keep students out of the EDRP, Blueprint summerschool, and especially Blueprint grade retention, which conforms to ourreading of the official district guidelines on program placement that thedistrict provides to teachers. Literacy core also had participation ratesamong students with low SDRT scores that were far below 100 percent.In part this may reflect the difficulty of setting up these special classes inschools that had only a few students who were significantly below gradelevel. Of all the interventions, literacy block had by far the highestparticipation rate among students who appeared to be eligible asdetermined by their SDRT scores.
As a next step, we used the detailed program assignment manualshanded to school site administrators to determine the full rules forassignment of students to interventions. We used all test score results,including the secondary tests given to students who appeared to be belowgrade level or significantly below grade level as determined by the firsttest, to identify students who were eligible for each specific intervention.By eligible we mean that the student failed to score above the cutoff on_____________
6The Learning Contract is an agreement signed by the teacher and parent(s) of at-risk students that stipulates the interventions the student will receive and potentialinterventions should the student’s academic performance not improve sufficiently.

39
any of the reading tests that would exempt him or her from theintervention. In this section of the chapter we focus on non-ELstudents, because the assignment rules for EL students were so differentand not strongly related to test scores.
As a first examination of this more complete measure of whetherstudents are assigned properly, we calculated the ratio of the proportionof eligible students who participated in a given intervention to theproportion of ineligible students who participated. For example, a ratioof 4.3 would tell us that a student whose test scores made him eligible forEDRP was 4.3 times as likely as an ineligible student to participate inEDRP. If the ratio were 1, it would tell us that test scores werecompletely irrelevant in assigning students to EDRP, whereas a ratioapproaching infinity would indicate that virtually no ineligible studentswere in fact assigned to EDRP.
Figure 3.2 shows these ratios for each intervention and year. Theyrepresent averages of all students in all grades in which a givenintervention was offered. For both EDRP and Blueprint summer school,the probability of a student’s enrolling approximately triples if he iseligible (as determined by test scores) compared to the case if he is noteligible. This ratio suggests that the district used test scores as reportedbut that many other factors also contributed to the decision to enroll.Test scores seem to have played a more decisive role in determiningplacement in literacy block and literacy core in both years, with theprobability of participating many times higher if the student was eligible.Further, the participation ratios increased significantly in the second yearof the program for both of these extended-period courses. Blueprintgrade retention provides the most dramatic illustration of the use of testscores to assign students: Precisely zero of the students not eligible to beretained were retained, compared to 18.4 percent of those who wereeligible.7
_____________7We had to omit Blueprint retention from Figure 3.2 because the ratio of
participation between eligible and ineligible students is infinity.

40
2000–2001
2001–2002
Rat
io o
f par
ticip
atio
n ra
tes
90
80
70
60
50
40
30
20
10
0EDRP Blueprint
summer schoolLiteracy block Literacy core
Figure 3.2—Number of Times by Which Probability of Participation Rises IfStudent Is Officially Eligible, by Intervention and Year
Of course, these participation ratios tell only one side of the story.We also want to know the actual percentages of eligible and ineligiblestudents who enrolled each year. In addition, there is a third category ofstudent—those who were initially eligible to participate in anintervention because of low test scores but who improved sufficiently onthe second test given to be exempted from participation. If district staffused these test scores to assign students to interventions, we should findthat participation rates were highest among those who were deemedeligible as determined by both reading tests, followed by those whoinitially appeared to be eligible but whose scores improved enough on asecond test to exempt them, with ineligible students participating theleast.
Table 3.13 shows participation rates by year for all students in thegrades relevant for each intervention. For the most part, we find exactlythe predicted pattern, with eligible students participating to the greatestextent and ineligible students to the least extent. For instance, in2000–2001, EDRP participation rates were 30.7 percent, 20.0 percent,and 8.9 percent for the eligible, “initially eligible but became ineligible,”and ineligible groups respectively. Clearly, test scores mattered forassignments but schools made numerous exceptions, presumably for

41
Table 3.13
Percentage Participation Rates by Eligibility Status, Intervention, and Year
Intervention Year
ParticipationAmong the
Eligible
ParticipationAmong ThoseWhose Scores
ImprovedSufficiently
ParticipationAmong theIneligible
EDRP 2000–2001 30.7 20.0 8.92001–2002 27.4 23.5 8.3
Blueprint summer school 2000–2001 14.5 84.3 4.42001–2002 30.3 59.1 10.1
Blueprint retention 2001–2002 18.4 0.0 0.0Literacy block 2000–2001 69.0 32.2 5.9
2001–2002 69.8 27.9 4.7Literacy core 2000–2001 33.7 31.4 0.7
2001–2002 61.7 14.7 0.8
NOTES: This table excludes EL students because eligibility rules are so differentfor them. Each cell reports the percentage participating in a given intervention out of allnon-EL students in the grades that offered the intervention who fit the given eligibilitystatus to participate.
borderline cases.8 Teachers and parents clearly do have a say in theplacement of students into Blueprint interventions.
ConclusionThis chapter demonstrates that a large minority of SDUSD students
participated in reading interventions in the first two years of theprogram. The biggest growth in scale was Blueprint summer school,which doubled in size between summer 2000 and 2001. On the whole,students who participated in any Blueprint interventions in 2000–2001were likely to participate to a lesser degree in 2001–2002, suggesting that_____________
8One exception is Blueprint summer school in which the intermediate group, thoseinitially eligible but whose scores rose enough to exempt them, actually participated at thehighest rate. We cannot determine the reason for this anomaly, although it is worthnoting that the total number of students in this intermediate category is not largecompared to the eligible and ineligible pools. For instance, in 2000–2001 the 84.3percent participation rate for those whose scores improved sufficiently to render themineligible translated into just 291 participants out of a total of 4,168 participants inBlueprint summer school.

42
as their reading scores improved, they sometimes “graduated” from atleast one intervention. Counterbalancing this, about a fifth of studentswho did not participate in any interventions in the first year of theBlueprint did participate in at least one intervention in year two, likelyreflecting the expansion of services, particularly Blueprint summerschool, in the second year.
Who took part in the interventions? All EL students were eligible toparticipate, as were non-EL students whose reading test scores suggestedthey were more than a grade behind in reading. Participants in the fourstudent-based interventions that we study are much more likely to be EL.For instance, one out of two English Learners participated in literacyblock on average, compared to less than one out of five fluent English-speaking students. Similarly, participants were much more likely thannonparticipants to be nonwhite or to have parents with relatively loweducation.
For non-EL students the criterion for eligibility was low test scores inreading. Our results suggest that the district has used test scores to assignstudents to interventions very much as announced. However, it wouldbe a mistake to argue that test scores alone determine the placement ofstudents. Test scores were most important in determining assignmentsto literacy block and core and least important in determining assignmentto Blueprint grade retention. This matches official district policy in thesense that teachers and parents have input into assignment decisions, andthis is particularly so for grade retention. It is also clear that EDRP andsummer school have lower participation rates among eligible studentsthan do literacy block and core. The most probable reason for this isthat EDRP and summer school, like other interventions, are voluntary,but parents and teachers are less likely to agree that a given studentshould participate in these interventions that take place outside theregular school day. An additional insight from this chapter is thatoccasionally students who are above the official test score cutoff stillparticipate in an intervention. According to district officials, teacherrecommendations that students whose literacy skills are only marginallyacceptable participate, as well as the need to fill out classes, explain thisphenomenon.

43
4. Effect of Individual BlueprintElements on Student Gains inReading
IntroductionTo determine which of the Blueprint’s preventive measures and
interventions have affected reading gains, we use regression analysis tomodel gains in individual students’ reading scores on the Stanford 9 test.
Appendix B provides full details on the regression method used.Here, we highlight the most salient features. The first important point isthat all of our models include what are known as “fixed effects” for eachstudent, school, and zip code for the student’s home residence. We dothis to take fully into account the possibility that some unobservedfactors related to students, schools, or neighborhoods that are fixed overtime influence gains in reading achievement. The most obviousexample, perhaps, is that some students, for whatever reason, learn morequickly than other students. If these “fast learners” never score lowenough to participate in Blueprint interventions, whereas “slow learners”often score low enough to participate, then there will automatically be anegative relation between Blueprint participation and average gains intest scores. But this relation would not mean that Blueprintparticipation caused participants to learn more slowly. In fact, it wouldbe exactly the opposite: Being a slow learner might cause a student toparticipate in a Blueprint intervention. The addition of student fixedeffects solves this problem. It removes differences among students fromthe data. In practice, it means that we will measure the effect ofparticipating in a Blueprint intervention by comparing reading gains forindividual students in years that they participated in a given Blueprint

44
intervention with their own gains in years when they did notparticipate.1
The use of student fixed effects raises an important question: Whatare the sources of variation in the data that statistically identify the effectof the Blueprint on reading achievement gains? For instance, suppose astudent participated in Blueprint summer school in all years. Becausethe fixed effect produces the same results as if we subtracted the meanvalue of a student’s Blueprint summer school participation from his orher participation in any given year, does this student provide us with anyinformation about the effect of Blueprint summer school onachievement? The answer is yes. The reason is that we include in ourdata the reading gain between spring 1999 and spring 2000 and modelthis gain as a function of the student’s personal and classroomcharacteristics during the 1999–2000 school year. This is the year beforethe Blueprint was implemented. Thus, even those students whoparticipated in Blueprint summer school in both summer 2000 andsummer 2001 provide us with information on the effect of Blueprintsummer school, because we can compare their reading gains in thoseyears with their gains in 1999–2000, the year before the Blueprint wasimplemented.2
_____________1For a nontechnical explanation of the intuition behind fixed-effect models, see
Appendix A of Betts, Zau, and Rice (2003).2Three Blueprint elements were introduced in 1999–2000. The first of these, peer
coaches, was introduced on a quite wide scale in 1999–2000, with about two-thirds ofstudents in schools with a peer coach, compared to over 95 percent in the later two years.Because we model the effect of the ratio of peer coaches to total school enrollment, evenfor students who attended a school with peer coaching in all three years, the fixed-effectmodels will yield some information on the influence of peer coaching thanks to variationsin this ratio. The second Blueprint element that was introduced in 1999–2000, this timeon a very limited basis, was genre studies. Because genre studies classes were done only atthe entry grade of middle and junior high schools, it is not possible for a student to haveparticipated for three years in a row. So, all students with at least one genre studiescourse will contribute to our estimated effect of genre studies on gains in readingachievement. Similarly, a few students in grade 9 in 1999–2000 participated in a trialrun of literacy block. It is theoretically possible in this case that these students re-enrolledin this program over the next two years, but in practice this did not happen. Appendix Bprovides more information on sources of variation after we add the student fixed effect.There, we focus on peer coaching because it was the Blueprint element that was widely inplace throughout all three years of our study and therefore has a questionable amount ofvariation. But even here, the ratio of the standard deviation (after imposing the student

45
Although it is useful to control for unobserved characteristics ofstudents that are fixed over time in this way, our approach isobservational, rather than experimental. This is important because theprevious chapter showed that not all students who were eligible for agiven intervention participated in it. Thus, we can only hope to evaluatethe effect of the interventions on those who chose to enroll. If weimagined a school district that copied the Blueprint reforms but madethem all completely mandatory, the effect on students could be eitherhigher or lower than what we see in San Diego. On the one hand,administrators may have been particularly encouraging students with themost to gain to attend Blueprint interventions, and at the same timethese students may have benefited more from the interventions thanother students, so that we would overstate what would happen if theBlueprint had been applied universally. Conversely, if administratorshad particularly encouraged those with the least capacity to improve tothe interventions, the bias would have been in the other direction.3
A second important aspect of our approach is that we use gains intest scores, rather than levels, because the level of a student’s test score atthe end of, say, grade 5, reflects the cumulative learning across all gradesup to that point. Because a Blueprint intervention should affect learningduring the given year, we instead study the gain in each student’s readingscore during that year.4
Although we include student fixed effects to account for anyunchanging and unobserved aspects of students, schools, and zip codes,many confounding factors related to students, their families, and their______________________________________________________________fixed effect by subtracting student means from the variable) relative to the rawmean—the so-called coefficient of variation—was reasonably large, at 0.4 for elementaryschools and 0.3 for middle and high schools.
3This idea of “selectivity bias” is a prevalent issue in social science and is not specificto this study. Even in relatively rare experimental studies where treatment is assignedrandomly, there will be biases because some of those who are offered the treatment refuseto participate.
4Together, the use of fixed effects and gains in test scores means that a student musthave three consecutive test scores to contribute to the estimation of the effect of theBlueprint. Our results tend to derive, therefore, from some groups slightly more thanothers because of attrition from the district; they may not fully reflect the averagecomposition of the district in any given year. See Appendix B for more details and for anargument that our results may slightly understate the cumulative effect of the Blueprint.

46
schools and classrooms could change over time. We need to incorporatethese as explanatory variables. We do not highlight the effect of theseexplanatory variables on reading achievement in this report, but it isnonetheless important to control for them.5 We now outline what theseadditional controls include. Table 4.1 lists additional explanatoryvariables that we add to the model of gains in reading scores forelementary school students. These variables include aspects of students,families, and neighborhoods that could change over time. Table 4.2 listsexplanatory variables at the school, student body, grade, and classroomlevel that we use in our main models for elementary schools. They aremostly self-explanatory, with the possible exception of some of theteacher characteristics. A teacher’s credential refers to the teacher’s overalllevel of qualification to teach. We include controls for teachers with afull credential and two types of teachers with less than a full credential—those with an emergency credential and interns. We also interact thesevariables with indicator variables for the teacher’s total years of teachingexperience (0–2, 3–5, and 6–9). We also control for a number oflanguage certifications that certify that a teacher has received training inhow to teach EL students. The first, Crosscultural Language andAcademic Development (CLAD), prepares teachers to teach students
Table 4.1
Student, Family, and Neighborhood Controls Used in the Statistical Modelsfor Elementary School Students
Student CharacteristicsFixed effects for each student to control for all characteristics of a student that are fixedover time, such as race. Controls for the student’s (Stanford 9) scaled reading score inthe given subject last year; controls for students who changed schools that year, orswitched schools unexpectedly; age; grade level
Family CharacteristicsControls for the level of education of the student’s more highly educated parent
Neighborhood CharacteristicsFixed effects for student’s home zip code
_____________5See Betts, Zau, and Rice (2003) for a detailed accounting of the influence of these
other variables on gains in reading achievement. The results reported there are quitesimilar to what we found in the present models.

47
Table 4.2
School, Classroom, and Student Body Controls Used in the Statistical Modelsfor Elementary School Students
School CharacteristicsFixed effects for each school to control for all fixed characteristics of the school.Controls for whether the school was a year-round school
Student Body Characteristics at the School LevelPercentage eligible for free or reduced-price meal; separate controls for percentage ofstudents who are Hispanic, black, Asian, Pacific Islander, native American; percentageof students who are EL, FEP; controls for student mobility: percentage who changedschools that year, who switched schools unexpectedly, and who were new to the district
Student Body Characteristics at the Grade LevelMean test scores in previous spring’s test of all students in the student’s current grade,standardized to district average
Classroom and Teacher CharacteristicsClass size; controls for teacher characteristics: interactions of credentials (intern,emergency credential, full credential) with indicators of years of teaching experience(e.g., 0–2, 3–5, 6–9); master’s degree, Ph.D.; bachelor’s in math, English, socialscience, science, language, other major (except education) (separate variables for eachmajor); corresponding controls for minors by field except that the omitted group isteachers with a minor in education or other; the CLAD credential, (Spanish) BilingualCLAD (BCLAD), CLAD alternative credential, BCLAD alternative credential;controls for teachers who are black, Asian, Hispanic, other nonwhite, and female
who are English Learners. BCLAD is similar but prepares bilingualteachers to teach in a bilingual classroom.
At the middle and high school levels we include all of theexplanatory variables listed in Tables 4.1 and 4.2 with threemodifications. First, whereas we focus on each elementary student’shomeroom teacher, at the middle and high school levels we instead focuson the characteristics of each student’s English classroom and Englishteacher. This makes sense because we are modeling gains in readingachievement.
A second modification is that at the middle school and high schoollevels we need to control for additional characteristics of teachers. Inthese gradespans, teachers can hold one or more subject authorizations.Subject authorizations indicate the degree of mastery of the subjectmatter at hand. A teaching credential, on the other hand, denotesmastery of more general approaches to teaching. Subject authorization

48
levels include—in declining order of subject matter knowledge—fullauthorization, supplementary, board resolution, and limited assignmentemergency (LAE).6 Accordingly, we add controls for a supplementary,board resolution, or LAE subject authorization.
Third, at the middle and especially the high school level, the numberof English classes that a student takes each year may vary. We thereforeadd indicator variables indicating that students took zero or one Englishcourse on the one hand or greater than (the normal load of) two classesin a given year.
To these models we added numerous characterizations of Blueprintelements. Peer coaches are placed in schools to interact with classroomteachers by observing their lectures and providing feedback, providinglectures while the regular teacher watches, and providing training invarious other ways. We wanted to test whether the intensity of peercoaches in a school influenced reading gains. Therefore, we calculatedthe ratio of peer coaches to overall enrollment in the school. Ourreasoning is that because class size varies little across schools in thedistrict (Betts, Zau, and Rice, 2003), a peer coach who had to work witha greater number of classrooms could be less effective.7 We alsoincluded the ratio of peer coach apprentices to enrollment at the school.Because a peer coach’s own experience might influence his or hereffectiveness, we also included a measure of the average years of teachingexperience of peer coaches at the school.
At the elementary school level, two important Blueprint elements arethe focus and API 2 schools, which receive substantial additional_____________
6Full and supplementary subject authorizations are official authorizations mandatedby the California Commission on Teacher Credentialing (CCTC). Board resolutionsrefer to decisions by the San Diego School Board to authorize a teacher to teach a specificsubject, when the teacher has taken relevant college courses. These teachers may lack oneor two courses required for a supplementary authorization or have enough in the generalsubject area but not the exact set of courses required by the CCTC. LAE authorizationsare short-term authorizations for teachers with less subject knowledge. These should notbe confused with an emergency credential, because LAE credentials are given to fullycredentialed teachers teaching outside their normal assignment. Some high schoolteachers may not hold any of the above subject authorizations, because they are not yetfully credentialed teachers.
7We also tried simpler models that simply counted the number of peer coaches atthe school. The results were qualitatively similar.
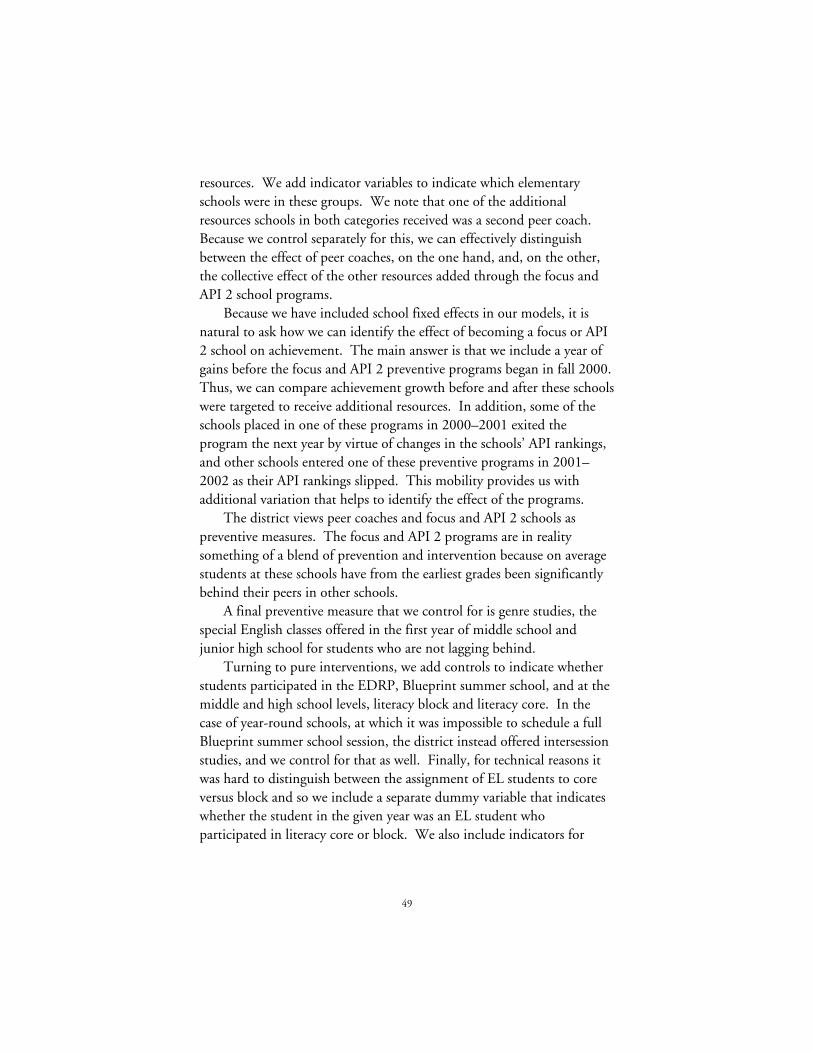
49
resources. We add indicator variables to indicate which elementaryschools were in these groups. We note that one of the additionalresources schools in both categories received was a second peer coach.Because we control separately for this, we can effectively distinguishbetween the effect of peer coaches, on the one hand, and, on the other,the collective effect of the other resources added through the focus andAPI 2 school programs.
Because we have included school fixed effects in our models, it isnatural to ask how we can identify the effect of becoming a focus or API2 school on achievement. The main answer is that we include a year ofgains before the focus and API 2 preventive programs began in fall 2000.Thus, we can compare achievement growth before and after these schoolswere targeted to receive additional resources. In addition, some of theschools placed in one of these programs in 2000–2001 exited theprogram the next year by virtue of changes in the schools’ API rankings,and other schools entered one of these preventive programs in 2001–2002 as their API rankings slipped. This mobility provides us withadditional variation that helps to identify the effect of the programs.
The district views peer coaches and focus and API 2 schools aspreventive measures. The focus and API 2 programs are in realitysomething of a blend of prevention and intervention because on averagestudents at these schools have from the earliest grades been significantlybehind their peers in other schools.
A final preventive measure that we control for is genre studies, thespecial English classes offered in the first year of middle school andjunior high school for students who are not lagging behind.
Turning to pure interventions, we add controls to indicate whetherstudents participated in the EDRP, Blueprint summer school, and at themiddle and high school levels, literacy block and literacy core. In thecase of year-round schools, at which it was impossible to schedule a fullBlueprint summer school session, the district instead offered intersessionstudies, and we control for that as well. Finally, for technical reasons itwas hard to distinguish between the assignment of EL students to coreversus block and so we include a separate dummy variable that indicateswhether the student in the given year was an EL student whoparticipated in literacy core or block. We also include indicators for

50
whether the student was Blueprint-retained. However, because of smallnumbers, we could not estimate this effect at the elementary school level.We do show results of Blueprint retention among middle school studentsbut strongly caution that a lack of observations makes it unlikely that wecould detect an effect of grade retention, negative or positive, if it trulyexisted.
ResultsIn this section we focus on models that include the set of explanatory
variables listed in Tables 4.1 and 4.2 as well as the Blueprint variables.However, we tried variants that did not control for class size, that did notcontrol for teacher characteristics, and that did not control for eitherclass size or teacher characteristics. The results were quite similar acrossspecifications, and so in this chapter and the next, we report on modelsthat control for both class size and teacher characteristics. The mainreason for doing this is to ensure that what on the surface may appear tobe an effect of Blueprint interventions does not in fact result fromschools’ intentionally steering certain types of teachers toward certaintypes of students. The regression results showing coefficients for allBlueprint variables for all specifications can be found in the tables ofAppendix B.8
Estimation of the models of test score gains yields coefficients thattell us the sign and size of the relationship between a given explanatoryvariable and gains in reading scores. But it is not enough simply to lookat the sign of a coefficient to conclude whether, say, summer schoolboosts reading achievement. Because of random error, even if the effectwere truly zero it is almost a certainty that the coefficient on summerschool would not be precisely zero. Therefore, it is equally important tocalculate whether the given coefficient is “significantly” different fromzero. Using this approach, if we find that a Blueprint variable isstatistically significant at the 1 percent level, it means that there is only_____________
8Model iv from these tables is the base model for each gradespan that we will focuson in this and the next chapter. To conserve space, we do not show the host of othercoefficients pertaining to student background, peers, class size, and teacher qualifications.However, for the most part our results here are very similar to those reported in Betts,Zau, and Rice (2003), who used 1998 through 2000 test score data from SDUSD.

51
one chance in a hundred that the true effect of that variable on gains inreading scores is zero. The standard practice in the statistical literature isto conclude that any variable significant at or below the 5 percent level is“statistically significant.” Therefore we begin by showing the degree ofstatistical significance of each Blueprint element in a format thatfacilitates comparisons among elementary, middle, and high schools andthen turn to the question of the size of these effects.
Table 4.3 lists the statistical significance of each Blueprintcoefficient. We estimated separate models for elementary, middle, andhigh schools, which are shown in the three columns. The symbols “++”and “+” indicate that the given variable is significant at the 1 percent or 5percent levels, respectively, and that the estimated effect on reading gainsfrom an increase in the corresponding variable is positive. Similarly, thesymbols “- -” and “-” indicate that the variable is estimated to benegatively related to gains in test scores, with significance levels of 1percent and 5 percent, respectively. Blanks indicate that the givenvariable was not significantly different from zero for the given gradespan.Because not all Blueprint elements are provided in a given gradespan, weblacked out the corresponding boxes in Table 4.3.
The top section of the table shows the statistical significance of eachpreventive measure. It reveals very mixed evidence on the effect of peercoaches. The ratio of peer coaches and of peer coach apprentices toenrollment are not significant (at the 5% level) in elementary schools. Atthe middle school level, the peer coach apprentice variable is weakly andnegatively significant, and at the high school level there is weak evidenceof a negative relation between the ratio of peer coaches to enrollment andgains in reading scores. We also note that the average years of teachingexperience of peer coaches does not appear to influence gains in readingtest scores.
Turning to the Blueprint elements that we categorize as “preventions/interventions,” we find that the indicator variables for both focus and API2 schools are highly significant and positive, suggesting that the flow of

52
Table 4.3
The Statistical Significance of Blueprint Elements in Models of Gains inStudents’ Reading Scores
Gradespan
Elementary Middle HighPreventive MeasurePeer coach as % of enrollment -Peer coach apprentice as % of enrollment -Teaching experience of peer coachesGenre studiesPrevention/InterventionAPI 2 school ++Focus school ++InterventionEDRP ++ +Blueprint summer school ++ ++ ++IntersessionLiteracy block ++ --Literacy core ++Literacy block/core for EL --Blueprint retention
NOTES: ++ and + indicate a positive effect significant at 1 percent and 5percent, respectively, and -- and - indicate negative effects significant at 1 percentand 5 percent, respectively. The black cells indicate preventive measures orinterventions that were not provided in the given gradespan. The exception isBlueprint retention in elementary school where we lacked the number ofobservations to be able to estimate an effect. In addition, we caution that the lackof significance of Blueprint retention reported for middle schools could reflect lackof variation in our data. These results are based on model iv from the regressionsfound in Appendix B. These models condition on teacher characteristics and classsize.
resources to these elementary schools has made a significant effect onreading gains. Because we have already controlled for the ratio of peercoaches to enrollment at each school, these results speak to the collectiveeffectiveness of the other steps taken at these schools, such as theprovision of additional classroom materials and, in the case of focusschools, the lengthening of the school year.
The bottom section of the table shows the estimated effects of thevarious Blueprint interventions. EDRP appears to have a positive and

53
significant effect in both elementary and middle schools, although thestatistical significance is higher for elementary schools. Notably,Blueprint summer school is strongly and positively significant across allthree gradespans. Recall that some middle and especially elementaryschools operate on a year-round schedule that is not conducive tooffering summer school. In these cases, the district substitutedintersession studies during the short breaks in between semesters. Wecould not find evidence that these intersessions affected student gains inreading achievement either negatively or positively. Blueprint graderetention occurred in small numbers in elementary and middle schools.We lacked the observations needed to estimate this effect at theelementary school level; at the middle school level, the effect was notstatistically significant.
The effects of the controversial literacy block and literacy core classesoffered in middle and high schools to students who are below grade levelor significantly below grade level appear to have differed greatly betweenmiddle and high schools. Both courses are associated with positive gainsin reading achievement (at the 1% level) in middle schools. In highschools, on the other hand, literacy block has a significantly negativeestimated effect, as does our combined measure of block/coreparticipation for EL students. Literacy core was not significantly relatedto gains in reading achievement.
Comparing the Effect of Peer Coaches on StudentsWhose Teachers Vary in Experience
It seems natural to conjecture that peer coaches might matter moreor less depending on whether an elementary school student has arelatively inexperienced or experienced homeroom teacher. Although wehave no data on how peer coaches allocate their time, they might devotemore effort to helping fledgling teachers. Similarly, novice teachersmight be more in need of assistance and more open to assistance thantheir more experienced counterparts. On the other hand, a moreexperienced classroom teacher might be better equipped to implementteaching techniques passed on by peer coaches. At the middle and high

54
school levels, we can make the same arguments, this time about theteaching experience of the English teacher teaching a specific student.
Similarly, it seems quite possible that the value added to a student’sreading achievement by Blueprint interventions such as literacy core andblock, EDRP, and so on might vary depending on the experience level ofthe teacher. Accordingly, we interacted our various measures of peercoaching with the years of experience of the student’s teacher. We didthis in two phases. We first interacted teacher experience with theBlueprint elements that directly affected that teacher’s classroom (peercoach intensity divided by enrollment, literacy block, and core in middleand high schools, and focus and API 2 in elementary schools). In asecond model, we also included interactions between teacher experienceand Blueprint interventions that occurred outside that teacher’sclassroom. These included Blueprint summer school or intersession andEDRP.9
The results were surprisingly uniform: Typically, we could find novariation in the effect of Blueprint elements with respect to the teachingexperience of a student’s teacher. There were some minor exceptions. Atthe elementary school level, EDRP was less effective (at the 1% level) if astudent’s homeroom teacher had 0–2 years of experience. Conversely,the API 2 interventions were estimated to be slightly more effective forteachers with 6–9 years of experience (relative to more experiencedteachers). At the middle school level, the only significant result was thatBlueprint summer school was associated with slightly lower gains if theEnglish teacher the preceding year had 0–2 years of experience. At thehigh school level, the only significant result was also that Blueprintsummer school was associated with lower gains if the English teacher thepreceding year had 0–2 years of experience.
Overall, given that the vast majority of teacher experienceinteractions were not statistically significant, the wisest conclusionappears to be that teacher experience did not influence the effect of theBlueprint elements in systematic ways._____________
9In these models, we interacted Blueprint variables indicating teachers withexperience of 0–2, 3–5, and 6–9 years, with the omitted group being teachers with 10 ormore years of experience. The models appear in columns v and vi of the tables inAppendix B.

55
Blueprint Effects on Gains in Reading AchievementIt is important to go beyond the question of “which Blueprint
elements had a statistically significant” effect to study the size of theseeffects. Our first assessment simulates the predicted effect ofparticipating in a given Blueprint element by dividing the predicted gainin test scores by the average annual gain in test scores we observe for allstudents in the same gradespan. In the period under study, averageannual gains in reading achievement for individual students were 25.7points in elementary schools, 14.7 points in middle schools, and 3.3points in high schools. These refer to gains in the reading “scaledscores.” So, for example, if participating in a specific Blueprint option inelementary school is predicted to boost reading scores by 5 points, wewould estimate the predicted percentage gain by dividing 5 by theaverage gain of 25.7, yielding a predicted gain in achievement of 19.5percent.
We note that the gains in reading scores tail off considerably in thehigher grades, a pattern seen throughout California. Because the testscores are scaled psychometrically in an attempt to ensure that a gain of 5points means the same absolute gain in achievement anywhere on thescale, the implication is that most gains in reading achievement occur inthe earlier grades. A practical implication for our simulations is that atthe high school level, it takes very little to produce an eye-poppingchange in achievement gains. For instance, a predicted gain of 3.3 pointsrepresents a 100 percent increase in the average annual gain in readingachievement at the high school level. But at the elementary school level,a predicted gain of the same amount represents a boost in the averagereading gains of only (3.3/25.7)100% = 12.8%.
Figure 4.1 shows for each Blueprint element that was statisticallysignificant the predicted effects on average gains in reading achievement.The figure refers to our results for elementary schools. Students at boththe API 2 and especially the focus schools appear to have increased theirannual reading gains significantly once their schools were assigned thesedesignations in fall 2000 or fall 2001. The predicted increases—14.6and 34.4 percent, respectively—are very large. Because we have already

56
0
5
10
15
20
25
30
35
40
API 2 school Focus school EDRP Blueprintsummer school
Intersession
Cha
nge
(%)
NOTES: A bar with a height of zero indicates no statistically significant effect. See Table 4.3 for a full list of insignificant Blueprint elements.
Figure 4.1—Predicted Effect of Blueprint Elements on Annual Gain inReading Achievement Among Elementary School Students
controlled for the presence of one or more peer coaches in each school,the predicted gains at these elementary schools must stem from reformfactors beyond the presence of peer coaches alone, such as the longerschool year in focus schools and the additional classroom resources madeavailable at both types of schools.10
_____________10One possibility here is simply that schools in the bottom two deciles of the state
rankings always show more improvement, because there is more room to grow. We arequite certain that this does not account for these impressive gains, for a number ofreasons. First, our inclusion of fixed effects for each student and for each school removesdifferences in the average level of achievement of students at these schools compared tothe level for students at other schools. Rather, it is the change in the status of a student’sschool that drives our results. Second, we estimated a similar model but whichadditionally adds dummy variables that indicate whether the given school was in APIdeciles 3 through 9 in each of the three years. We found that the coefficients on focusand API 2 schools were far larger than the coefficients for the third and fourth decileschools. Moreover, gains in test scores in focus and API 2 schools were significantlyhigher than for top-performing decile 10 schools, while decile 3 and 4 schools showedgains that were not significantly different from gains in decile 10 schools. In sum, thelack of a smooth trend suggests that focus and API 2 schools experienced gains far above
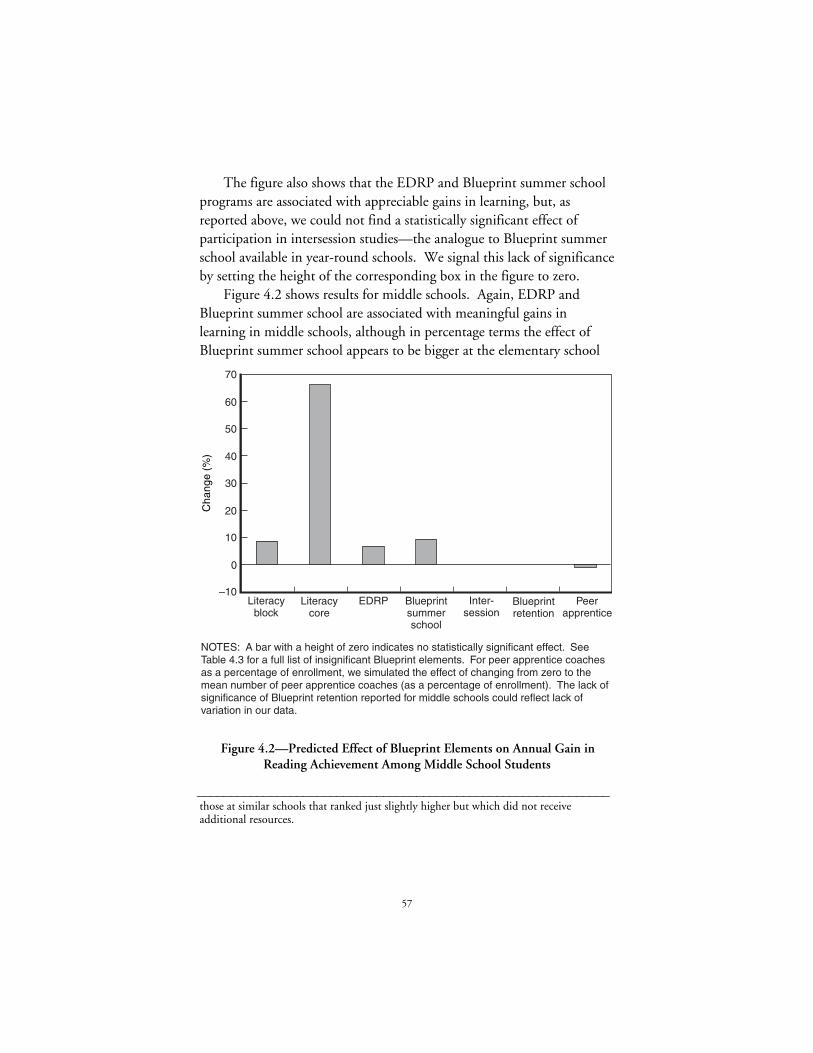
57
The figure also shows that the EDRP and Blueprint summer schoolprograms are associated with appreciable gains in learning, but, asreported above, we could not find a statistically significant effect ofparticipation in intersession studies—the analogue to Blueprint summerschool available in year-round schools. We signal this lack of significanceby setting the height of the corresponding box in the figure to zero.
Figure 4.2 shows results for middle schools. Again, EDRP andBlueprint summer school are associated with meaningful gains inlearning in middle schools, although in percentage terms the effect ofBlueprint summer school appears to be bigger at the elementary school
Cha
nge
(%)
NOTES: A bar with a height of zero indicates no statistically significant effect. See Table 4.3 for a full list of insignificant Blueprint elements. For peer apprentice coaches as a percentage of enrollment, we simulated the effect of changing from zero to the mean number of peer apprentice coaches (as a percentage of enrollment). The lack of significance of Blueprint retention reported for middle schools could reflect lack of variation in our data.
–10
0
10
20
30
40
50
60
70
Literacyblock
Literacycore
EDRP Blueprintsummerschool
Inter-session
Blueprintretention
Peerapprentice
Figure 4.2—Predicted Effect of Blueprint Elements on Annual Gain inReading Achievement Among Middle School Students
______________________________________________________________those at similar schools that ranked just slightly higher but which did not receiveadditional resources.

58
level. The figure also shows large predicted effects on gains in readingassociated with participation in literacy block and especially literacy core,the double- and triple-length English classes given to students deemedbelow and significantly below grade level. The predicted effect of literacycore classes—a 72 percent increase in the annual gain—is particularlylarge. Finally, the figure shows the predicted effect of moving from aschool with no peer apprentice coaches to one with the mean number ofpeer apprentice coaches (as a percentage of enrollment). Althoughstatistically significant, the size of the predicted effect is very small.
Figure 4.3 shows the high school results. These results, apart fromone important similarity, differ substantially from the middle schoolresults. The similarity is that again Blueprint summer school is predictedto lead to meaningful increases in learning. In high school, these effects
Cha
nge
(%)
NOTES: See Table 4.3 for a full list of insignificant Blueprint elements. For peer coaches as a percentage of enrollment, we simulated the effect of changing from zero to the mean percentage of peer coaches. Because the variable “Block/core for EL students” was measured for EL students only, the predicted effect on gains in reading achievement was calculated relative to EL high school students’ average annual gains—6.54 points, compared to 3.3 points for the overall population.
Literacyblock
Block/corefor EL students
Blueprintsummer school
Peer coach as% of enrollment
–80
–60
–40
–20
0
20
40
60
80
Figure 4.3—Predicted Effect of Blueprint Elements on Annual Gain inReading Achievement Among High School Students

59
are very large in percentage terms, but as we warned above, the largepercentage effect largely reflects the small average gains in readingachievement in high schools. When we compare the predicted gains inscaled scores accruing to Blueprint summer school participants, we findgains of 4.5, 1.5, and 1.8 points at elementary, middle, and high schools,respectively. As we saw above, the other Blueprint elements that weresignificant at the high school level were all negative. Figure 4.3 showssome fairly large predicted reductions in average rates of learning for eachof these Blueprint elements.11 Again, we need to recall that largepercentage reductions in the annual gains in achievement at the highschool level are not large in an absolute sense compared to the gains inlower grades.
A Tentative Cost-Benefit Comparison of EDRP,Blueprint Summer School/Intersession, and PeerCoaching
A full cost-benefit analysis of the various Blueprint interventions wasbeyond the scope of this initial report. Nonetheless, it is useful tocompare the EDRP, Blueprint summer school, and intersessionprograms, for they share the basic idea of having a teacher spend extratime with lagging students outside the normal school day or school year.Recall that intersession programs are the counterpart of Blueprintsummer school for students at elementary and middle schools thatoperate year-round. We could find no evidence that intersession studiesincreased annual gains in reading achievement, in contrast to Blueprintsummer school. We cannot tell from our data what made intersessionless productive than summer school, although we can imagine thathaving several short periods of study in between regular semesters mightnot have been as efficient as summer school that took place over severalconsecutive weeks. Given a shorter time period, the curriculum may nothave had an opportunity to be effective either. Certainly ways should befound to boost the effectiveness of intersession studies._____________
11Because the EL literacy core/block variable pertains to English Learners only, wedivided the predicted effect by the average gain in reading scores among EL students inhigh schools—about 6.5 points per year.

60
It is possible to create a very crude cost-benefit comparison betweenEDRP and Blueprint summer school. EDRP consisted of three sessionsper week of teacher-supervised reading sessions, each approximately 90minutes in length, over a 25-week period, for a total of about 110 hoursof instruction. Blueprint summer school, in contrast, lasts six weeks andinvolves four hours of study per day, for a total of 120 hours.
Although the two programs involved approximately as much timeper student, summer school involves additional costs such astransportation, administrative time, and student materials that do notapply to the EDRP, which operated at the start or end of regular schooldays. Indeed, American Institutes for Research (2002, p. III-7) reportsthat in 2000–2001, Blueprint summer school and intersession programscost $18.3 million, or 31.8 percent of the total Blueprint budget of$57.5 million. In contrast, the Extended Day program, which at thetime consisted solely of EDRP, cost $3.9 million or 6.7 percent of theoverall Blueprint budget. So summer school/intersession cost the district 4.7 times as much as Extended Day.
To have been equally cost-effective as Extended Day, summerschool/intersession should have contributed 4.7 times as much as didEDRP to average student test score growth. If we take the predictedpercentage effect on rates of learning from Figures 4.1 through 4.3, andmultiply by the average percentage of students participating in2000–2001 using data from Tables 3.1 and 3.2, we obtain an estimate ofthe average effect of each Blueprint element on all students. When wetake the ratio of these effects between Blueprint summer school/intersession and EDRP, we obtain estimates of 1.0 and 1.3 forelementary and middle schools, respectively.12 In other words, summerschool/intersession had about the same average effect as EDRP in_____________
12For example, in elementary schools, average participation rates in 2001 were 31.1percent for EDRP and 14.6 percent for Blueprint summer school. Multiplying thepredicted effects on learning (gains of 8.0 and 17.6 percent, respectively) by theseparticipation shares, we find average effects of 2.5 and 2.6 percent for EDRP and summerschool. This yields a ratio (of summer school to EDRP effect) of 1.04 or about about 1.(Numbers in this footnote have been rounded.) Because intersession was neverstatistically significant, we consider its effect zero and so implicitly conclude that thecombined effect of summer school/intersession is the same as the effect of summer schoolitself.

61
elementary schools and about a 30 percent bigger effect in middleschools. Both of these ratios are far less than the cost ratio of 4.7.Overall, given the cost estimates for 2000–2001, we infer that EDRPwas substantially more cost-effective than Blueprint summer school/intersession.
Obviously, there are some important qualifications that we need tomake here. These rough calculations in no way say that summer schoolhas been a bad investment. Rather, they state that EDRP has beenrelatively more cost-effective. Second, Blueprint summer school wasoffered in high schools, unlike EDRP, and part of the higher cost ofBlueprint summer school, perhaps up to one-third, has no counterpart inthe EDRP. Clearly, though, even an overstatement of elementary andmiddle school summer school and intersession costs by this amountwould still leave the summer school to EDRP cost ratio at about 3, wellabove the ratio of estimated effectiveness between the two programs.
Overall, the tentative conclusion seems to be that although Blueprintsummer school might be a very cost-effective reform, EDRP is morecost-effective.
We found some evidence that by 2001, the peer coach program wasstarting to have an effect in elementary schools, but we typically foundno overall effect or slightly negative effects in elementary and highergradespans. Yet the American Institutes for Research (2002) reportsuggests that the peer coach program cost $13.0 million in 2000–2001,amounting to 22.6 percent of the Blueprint budget. Although weemphasize again that a finding of “no effect” after two years should notbe interpreted to mean that a given Blueprint element will never work, itis nonetheless striking that EDRP has been cut back substantially fromits first year incarnation, when it cost less than a third as much as thepeer coach program while affecting reading achievement to a greaterextent.
ConclusionIt is important to bear in mind that the official launch of the
Blueprint for Student Success was in summer 2000, when the firststudents attended Blueprint summer school, and that our analysis modelsgains in reading achievement from spring 2000 through spring 2002.

62
With only two years of data for most Blueprint elements (genre studies,literacy block, and peer coaches were phased in on a very limited basis in1999–2000), it is certainly possible that we lack enough data to detecteffects of the reforms. This seems most likely for Blueprint graderetention, which began on a very small scale in the last year of oursample.
With this warning in mind, it is quite remarkable how many of ourBlueprint variables proved to be highly statistically significant. The datasuggest that the Blueprint may have had both positive and negativeeffects in its first two years.
The effect of peer coaches is typically not statistically significant, andin a few cases may have been weakly negative. Peer coach experience didnot seem to affect the effect of the peer coach to enrollment ratio.
In contrast, the funneling of targeted resources toward focus and API2 elementary schools beginning in fall 2000 appears to have had apositive and highly significant effect. Similarly, EDRP and Blueprintsummer school both are positive and statistically significant in each ofthe gradespans in which they are offered. The special double- and triple-length English classes, when compared to regular single-period Englishclasses, seem to have had quite different effects at the middle and highschool levels. At the middle school level, we could detect no effect ofgenre studies (the preventive double-length English classes that aresometimes referred to as Enhanced Literacy) but both literacy block andcore were very strongly associated with gains in reading achievement. Atthe high school level, in contrast, literacy block for non-EL students, andblock/core as a whole for EL students, were strongly associated withsmaller reading gains, and literacy core was not statistically different fromsingle-period English classes.
For the most part, we found that the estimated effect of theseBlueprint variables did not depend on the teacher’s experience.
Another way to look at these patterns of significance is by gradespan.On the whole, the Blueprint elements are strongly associated with gainsin reading achievement at the elementary and middle school levels. Atthe high school level, only Blueprint summer school appears to have hada statistically significant and positive influence. Overall, the literacy

63
block/core program is associated with reduced gains in readingachievement at the high school level.
Establishing statistical significance is important, but it leavesunanswered the question: “Has the effect of the Blueprint been large orsmall?” We examined the effect of participating in various Blueprintelements in terms of the percentage change in the average annualachievement gain among students in each of the three gradespans(elementary, middle, and high schools). Many of the Blueprintinterventions appear to have boosted annual gains in readingachievement by 5 or 10 percent, and some Blueprint elements had effectsmuch larger than this. For example, students at schools that weredesignated for additional support as a focus school exhibited an increasein annual reading gains of about one-third after this preventive programwas put in place. At the middle school level, the small number ofstudents participating in literacy core experienced a boost of about two-thirds of the average annual gains in reading achievement. At the highschool level, all of the statistically significant Blueprint interventions,regardless of whether their effect was positive or negative, were predictedto change gains by roughly a quarter to a half. However, because both inSan Diego and statewide, annual gains in reading scores are progressivelysmaller in the higher grades, the high school effects, both positive andnegative, although large in percentage terms, are not especially large inabsolute terms.
In sum, the results suggest that the Blueprint elements hadsignificant and predominantly positive effects in middle and especiallyelementary schools. At the high school level, the effects were bothpositive and negative.
Although a full-scale cost-benefit analysis of the various interventionswas not possible for this study, a rough comparison of EDRP andBlueprint summer school/intersession suggests that EDRP’s price-tag wasjust over a fifth as much as for the latter interventions in 2000–2001 yetyielded comparable or only slightly smaller returns in terms of averageunits of test-score improvement districtwide. EDRP seems to be themore cost-effective reform.


65
5. Cumulative Effect of theBlueprint on Gains in Reading
IntroductionAlthough it is very useful to see the relative effects of each
intervention, as shown in the last chapter, we still have no indication ofthe overall effect within the district on individual students, who mayhave participated in zero, one, or more Blueprint interventions orpreventive strategies per year. In this chapter, we assess the overall effectof the Blueprint’s elements using three measures that combine theregression estimates from Chapter 4 with students’ actual participationpatterns over the two-year period from summer 2000 through spring2002. Together, the three analyses in this chapter provide importantinsights into the overall size of the Blueprint effects on a cumulative two-year basis. We also examine the related question of the extent to whichthe Blueprint altered the achievement gap among students based onlanguage status, parental education, and race/ethnicity over the sameperiod.
In the first method, we examine how the reading scores ofparticipants in Blueprint interventions are predicted to have moved as apercentage of the variation in achievement in their given grade at the endof the 2001–2002 school year.1 The second analysis also usesparticipation patterns of individual students and measures how thisparticipation has affected students’ test-score rankings within the district.The third method uses the estimated effects on reading gains for each_____________
1The measure of variation we use is the standard deviation of test scores within thegiven grade. Note also that throughout this chapter we will frequently refer to“predicted” effects or “estimated” effects of the Blueprint. We say this because althoughwe know the actual exposure of each student to each Blueprint element, we have onlystatistical estimates of the effect of each element on student reading gains.

66
student to estimate the cumulative two-year effect of the Blueprint onpreexisting gaps in achievement related to language status, parentaleducation, and race.
The Cumulative Effect of Size of Participation in theBlueprint
The overall effect of the Blueprint on the performance of studentsdepends on both the size of the predicted effects as well as the rate ofstudent participation. Accordingly, we studied the program participationof all students who in fall 2000 were in grades 3, 6, and 9, and who byspring 2002 were typically in grades 4, 7, and 10. We chose these threegrades because they are the lowest grades in their respective gradespansfor which a prior year test score is available. We follow students’participation patterns as they travel through their gradespan fromsummer 2000 through spring 2002. Using these participation patternsand the estimated effects of each Blueprint element, we were able toestimate the cumulative effect of student participation in the Blueprint.
Next, we needed to find a benchmark against which to comparethese effects. Our first analysis compares the predicted change in testscores from students’ actual Blueprint participation to the standarddeviation in test scores in spring 2002 for all students in the givengrade.2 This produces what is known as an “effect size.”
Table 5.1 shows the overall results for the three cohorts. The figuresin the first column focus on students who participated in any Blueprintintervention from summer 2000 through spring 2002.3 The table shows_____________
2The standard deviation is a measure of variation. For the normal distribution,which has the famous bell curve shape, about 68 percent of the observations would liewithin one standard deviation above or below the mean. Thus, a standard deviationimprovement in test scores would be very big. A good rule of thumb is that any policythat affects an outcome by a tenth of a standard deviation or more is quite large.
3Because the peer coach program is designed as a preventive measure that isintended for all schools, we did not count as a Blueprint participant a student who hadmerely attended a school with one or more peer coaches. Rather, we defined as aBlueprint participant anybody who had participated in EDRP, Blueprint summer school,literacy core or literacy block, or had been Blueprint-retained. However, once we hadidentified Blueprint participants, we estimated the total effect of the Blueprint on themby including the predicted effects of having peer coaching in their schools, in the caseswhere the effects were statistically significant.

67
Table 5.1
Predicted Effect of Blueprint on Participants and All Studentsas a Percentage of the Standard Deviation in Reading Scores
in Spring 2002
Two-Year Simulation forStudents Initially in:
Average Effects forStudents Who
Participated in at LeastOne BlueprintIntervention
Average Effectsfor All Students
Elementary school (grade 3) 22.8 13.6Middle school (grade 6) 5.3 2.6High school (grade 9) –11.0 –8.0
that elementary school participants on average are predicted to havemoved up 23 percent of one standard deviation by spring 2002. This isa very sizeable improvement. In middle schools, participants inBlueprint interventions are predicted to have moved up a still substantial5 percent of one standard deviation. At the high school level, wheremost of the significant interventions had negative effects, Blueprintparticipation is predicted to have lowered students’ reading scores by 11percent of one standard deviation.
A second issue is the effect of the Blueprint on the average studentacross the whole district. For this, we summed the predicted effects onBlueprint participants, as defined above, added the effect of peercoaching on the remainder of students, and divided by the total numberof students. The second column in Table 5.1 shows the results. For theaverage student in grade 3 in fall 2000, the net effect of the Blueprintwas to move him or her up 14 percent of a standard deviation. For thegrade 6 and 9 analyses, the corresponding figures were a gain of 3percent and a loss of 8 percent. There are two reasons for the smallereffects when we calculate over the entire school population rather thanfocusing on participants alone. More obviously, in the second panel, weare averaging out the effect of Blueprint interventions for the subsampleof students who participated over a wider number of students, many ofwhom did not participate in Blueprint interventions. This quitemechanically lowers the average effect. More subtly, at the middle and

68
high school levels, we did find some evidence of a negative link betweenpeer coach or apprentice peer coach to enrollment percentages. Theseeffects are predicted to have influenced all students in a grade regardlessof whether they participated in a Blueprint intervention.
Returning to those who actually participated in at least oneBlueprint intervention, the next logical question is which interventionsmattered most? We know from previous chapters the participation ratesin individual interventions and from the preceding section the size of theeffects of each intervention. But we need to pull together both of theseelements to work out the net contributions made by each Blueprintelement. Table 5.2 shows these decompositions.
At the elementary school level, the focus schools and the summerschool program appear to have the greatest effect, followed by EDRP and
Table 5.2
Decomposition of Predicted Two-Year Effect of BlueprintElements on Participants as a Percentage of the
Standard Deviation in Reading Scoresin Spring 2002
Variable EffectElementary school (grade 3)Focus school 7.1API 2 school 3.2Blueprint summer school 7.1EDRP 5.4Total 22.8Middle school (grade 6)Literacy block 1.8Literacy core 0.3EDRP 1.5Blueprint summer school 3.0Peer coach apprentice –1.3Total 5.3High school (grade 9)Literacy block –2.3Blueprint summer school 2.9Peer coach –6.1Block/core for EL students –5.4Total –11.0

69
the API 2 school reforms. At the middle school level, Blueprint summerschool was by far the most important contributor, following by literacyblock and EDRP. Literacy core contributed less, in spite of its hugepercentage effect on reading gains illustrated above, simply becauserelatively few students enrolled in literacy core. Finally, the “Peer coachapprentice” variable is associated with a small decrease in test scores.
At the high school level, most of the Blueprint effects are negative,with the exception of Blueprint summer school. It is notable that acrossall three gradespans, the net effect of Blueprint summer school has beento move Blueprint participants up by about 3–7 percent of one standarddeviation. Because this effect is calculated for all students who everparticipated in any Blueprint intervention and divided by the totalnumber of “Blueprint participant” students in the grade, this figureunderstates considerably the effect on students who specificallyparticipated in Blueprint summer school.
Estimating the Effect of the Blueprint onParticipating Students’ Overall Ranking in theAchievement Distribution
Our second analysis examines how Blueprint participants moveacross the student test score rankings in their grades as a result of theBlueprint interventions. We use exactly the same approach as above,identifying students who participated in any Blueprint interventionbetween summer 2000 and spring 2002 and then calculating thepredicted effects of the Blueprint on their test scores. But now, insteadof dividing the predicted effects on test scores by the standard deviation,we examine where students would have ranked if the Blueprint had notbeen in place. Accordingly, we began by calculating 10 deciles, withdecile 1 representing the bottom tenth of actual test scores in spring2002 in the given grade and decile 10 the highest. We plot the actualdistribution of Blueprint participants across these 10 deciles in spring2002, at the end of our study period, and then show which decile they
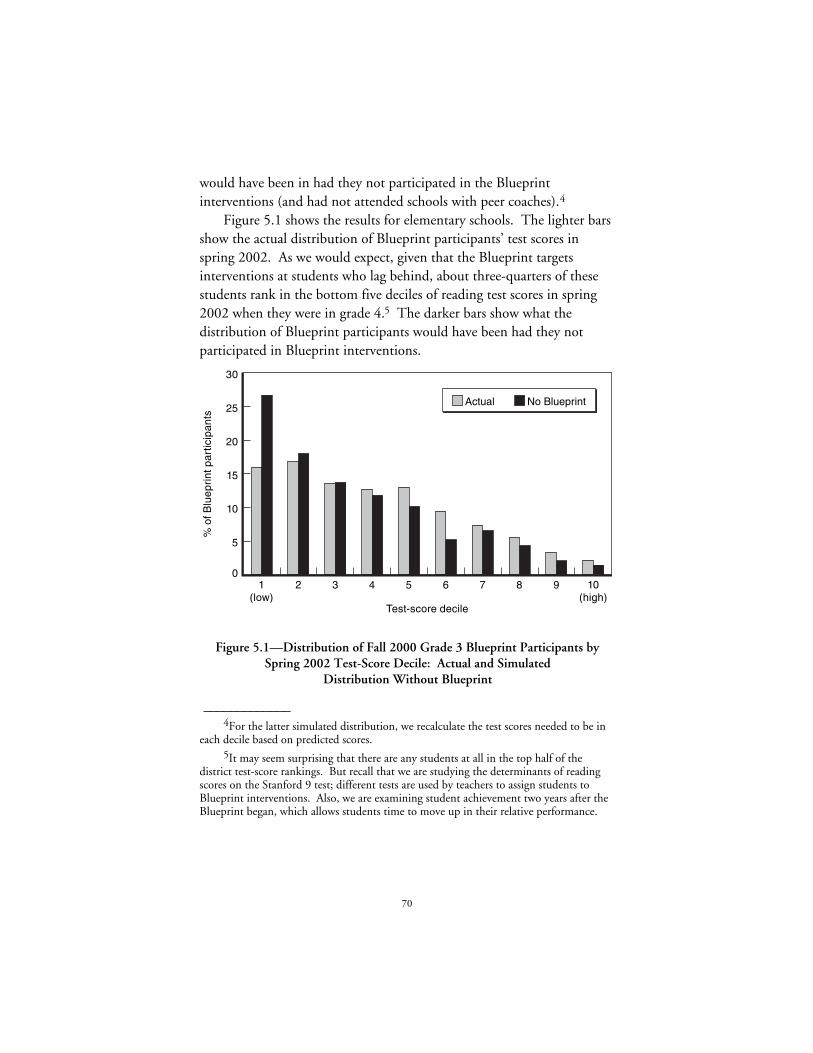
70
would have been in had they not participated in the Blueprintinterventions (and had not attended schools with peer coaches).4
Figure 5.1 shows the results for elementary schools. The lighter barsshow the actual distribution of Blueprint participants’ test scores inspring 2002. As we would expect, given that the Blueprint targetsinterventions at students who lag behind, about three-quarters of thesestudents rank in the bottom five deciles of reading test scores in spring2002 when they were in grade 4.5 The darker bars show what thedistribution of Blueprint participants would have been had they notparticipated in Blueprint interventions.
Actual No Blueprint
0
5
10
15
20
25
30
1(low)
2 3 4 5 6 7 8 9 10(high)
Test-score decile
% o
f Blu
epri
nt p
artic
ipan
ts
Figure 5.1—Distribution of Fall 2000 Grade 3 Blueprint Participants bySpring 2002 Test-Score Decile: Actual and Simulated
Distribution Without Blueprint
_____________4For the latter simulated distribution, we recalculate the test scores needed to be in
each decile based on predicted scores.5It may seem surprising that there are any students at all in the top half of the
district test-score rankings. But recall that we are studying the determinants of readingscores on the Stanford 9 test; different tests are used by teachers to assign students toBlueprint interventions. Also, we are examining student achievement two years after theBlueprint began, which allows students time to move up in their relative performance.

71
The differences are startling. The figure suggests that with theBlueprint, 15.0 percent of Blueprint participants ended up in the bottomdecile of reading by spring 2002 but that in the absence of the Blueprintfully 25.7 percent of these students would have been relegated to thebottom decile. Without the Blueprint, the share of Blueprintparticipants would have also risen slightly in deciles two and three andfallen across the seven highest deciles. In other words, the existence ofthe Blueprint appears to have boosted some of the lowest-scoringstudents in the district into each of the seven highest deciles ofachievement. The entire distribution has shifted.
Figure 5.2 shows corresponding results for middle schools. In thiscase, the Blueprint appears to have shifted roughly 4.2 percent ofstudents from the two lowest deciles into higher deciles. Theinterventions also appear to have shifted a smaller percentage of studentsfrom the fourth decile into a higher decile. Conversely, in Figure 5.3 theby now familiar perverse findings for high school manifest themselves.In this case, had the Blueprint not existed, it apparently would have
Actual No Blueprint
0
5
10
15
20
25
1(low)
2 3 4 5 6 7 8 9 10(high)
Test-score decile
% o
f Blu
epri
nt p
artic
ipan
ts
Figure 5.2—Distribution of Fall 2000 Grade 6 Blueprint Participants bySpring 2002 Test-Score Decile: Actual and Simulated
Distribution Without Blueprint

72
Actual No Blueprint
0
5
10
15
20
25
1(low)
2 3 4 5 6 7 8 9 10(high)
Test-score decile
% o
f Blu
epri
nt p
artic
ipan
ts
Figure 5.3—Distribution of Fall 2000 Grade 9 Blueprint Participants bySpring 2002 Test-Score Decile: Actual and Simulated
Distribution Without Blueprint
reduced the share of Blueprint participants in the bottom decile byroughly 5 percent and increased their share in most of the higher deciles.
A closely related way to gauge the effect of the Blueprint is to ask byhow much the typical Blueprint participant moved in the district testscore rankings. For this analysis we use percentiles, which refer to thepercentage of students who rank below the given student in the givengrade. Actual participation rates show that participants gained 4.8percentile points in elementary school, gained 2.3 percentile points inmiddle schools, and lost 1.6 percentile points in high school as a result ofparticipation in Blueprint activities over two years.
The Effect of the Blueprint on Achievement GapsThe final analysis focuses on various achievement gaps in reading.
The groups we compare are EL versus non-EL students, blacks andHispanics versus whites, and students with less highly educated parentsversus students with at least one parent who has pursued graduate

73
study.6 As in the earlier analyses in this chapter, we focus on students ingrades 3, 6, and 9 in fall 2000 and estimate the extent to which thepreexisting gaps in reading achievement have been influenced by thevarious Blueprint elements over a two-year period.
Table 5.3 provides some perspective by showing the grade equivalentof students in each group and grade level in spring 2000 on the Stanford9 reading test. These grade equivalents are derived from a nationallyrepresentative “norming” sample. Because students take the test near theend of the school year, a student who was on target in, say, grade 8,might be at a reading level of roughly 8.8. A student with a gradeequivalent of 6.8 would be about two years behind national norms. Therightmost panel in the table then calculates the gap in grade equivalentsbetween the top-scoring group of students and the other groups. Forinstance, we see that in grade 2 in 2000, non-EL students scored at agrade equivalent of 3.2, compared to only 2.3 for EL students. The gap,0.8 grade equivalents, suggests that on average, EL students near the endof grade 2 are reading almost one year behind their counterparts who arefluent in English.
Comparison of the achievement gaps related to language, race, andparental education shows that the gaps are quite large as early as grade 2and that the gaps tend to grow, peaking typically around grade 9. Thelargest gap observed is in grade 8, between students whose parents havesome postgraduate study (after the bachelor’s degree) and students whoseparents did not finish high school. Here, the gap is 6.9 gradeequivalents, with the former students reading near the level of a highschool graduate and the latter reading at the level of a student beginninggrade 6._____________
6Here we focus on gaps between whites and blacks and Hispanics, rather than onthe white-Asian gap. Although it is true that Asian students in the district generally lagbehind white students in reading, the gap is very small compared to the black-white andHispanic-white gaps. See Chapter 4 of Betts, Zau, and Rice (2003) for evidence.

74
Table 5.3
Spring 2000 Gaps in Reading Achievement BetweenVarious Student Subgroups, in Stanford 9
Scaled Scores and in Grade Equivalents
Gaps Based on Language AcquisitionGrade Equivalents, 2000
Grade Non-EL EL Gap2 3.2 2.3 0.93 3.8 2.5 1.34 4.4 2.8 1.65 5.4 3.3 2.16 6.7 3.6 3.17 7.4 4.1 3.38 8.6 4.8 3.89 9.4 5.3 4.110 9.9 5.6 4.311 10.5 6.3 4.2
Table 5.3 (continued)
Gaps Based on RaceGrade Equivalents, 2000 Gap
Grade White Black Hispanic White-Black White-Hispanic2 3.6 2.7 2.4 0.9 1.23 4.3 3.1 2.7 1.2 1.64 5.2 3.5 3.1 1.7 2.15 6.9 4.3 3.7 2.6 3.26 7.5 5.0 4.3 2.5 3.27 8.8 5.9 5.2 2.9 3.68 9.9 7.1 6.6 2.8 3.39 12.6 7.4 7.2 5.2 5.410 12.9 7.9 7.7 5.0 5.211 12.9 8.3 8.2 4.6 4.7

Tab
le 5
.3 (
cont
inue
d)
Gap
s B
ased
on
Par
enta
l Edu
cati
onG
rade
Equ
ival
ents
, 200
0G
ap, P
ostg
radu
ate
Min
us:
Gra
de
Less
Tha
nH
igh
Scho
olD
iplo
ma
Hig
h Sc
hool
Dip
lom
aSo
me
Col
lege
Bac
helo
r’s
Deg
ree
Post
grad
uate
Stud
y
Less
Tha
nH
igh
Scho
olD
iplo
ma
Hig
h Sc
hool
Dip
lom
aSo
me
Col
lege
Bac
helo
r’s
Deg
ree
22.
32.
73.
13.
53.
91.
61.
20.
80.
4 3
2.6
3.2
3.7
4.2
4.9
2.3
1.7
1.2
0.7
42.
93.
64.
24.
96.
13.
22.
51.
91.
2 5
3.5
4.4
5.2
6.0
7.5
4.0
3.1
2.3
1.5
64.
05.
16.
37.
18.
44.
43.
32.
11.
3 7
4.8
6.0
7.3
7.7
9.7
4.9
3.7
2.4
2.0
86.
07.
28.
29.
012
.96.
95.
74.
73.
9 9
7.0
7.6
9.1
9.6
12.9
5.9
5.3
3.8
3.3
107.
38.
29.
610
.012
.95.
64.
73.
32.
911
7.7
8.6
9.9
10.5
12.9
5.2
4.3
3.0
2.4
75

76
Although these test score gaps are big, they are quite typical of whatwe see nationally. See for instance Jencks and Phillips (1998) for asummary of the black-white achievement gap at the national level.Moreover, Betts, Zau, and Rice (2003), who studied test score trends inSDUSD between 1998 and 2000, document that achievement gaps inthe district were even larger in 1998 than they were in 2000.
Given these various dimensions of the achievement gap, what hasbeen the contribution of the various elements of the Blueprint toreducing these inequalities? Again, we examine the estimated effect ofBlueprint elements that were statistically significant by examining theexperience of every student in our three cohorts over two years. Wecalculate the predicted change in test scores resulting from participationin the various Blueprint interventions and exposure to peer coaches andcompare it to the initial 2000 achievement gaps. Figures 5.4 through 5.6show the predicted reductions in the initial test score gaps related tolanguage, race, and parental education, respectively.
Per
cent
age
NOTE: The figure shows the predicted two-year reduction in test-score gap between spring 2000 and spring 2002 for students in grades 3, 6, and 9 in fall 2000. A positive/ negative bar indicates that the initial gap is predicted to have narrowed/widened as a result of the Blueprint.
Elementary school Middle school High school
20
15
10
5
0
–5
–10
–15
Figure 5.4—Two-Year Reduction in EL/Non-EL Test-Score GapsAttributable to the Blueprint

77
Per
cent
age
NOTE: The figure shows the predicted two-year reduction in test-score gap between spring 2000 and spring 2002 for students in grades 3, 6, and 9 in fall 2000. A positive/ negative bar indicates that the initial gap is predicted to have narrowed/widened as a result of the Blueprint.
Elementary school Middle school High school
20
15
10
5
0
–5
–10
Black
Hispanic
Figure 5.5—Two-Year Reduction in Test-Score Gaps (Relative to Whites)Attributable to the Blueprint
In elementary schools, all three methods of grouping studentssuggest that the Blueprint has led to quite substantial reductions in theachievement gap in elementary schools. Most impressive in this regardwere the EL/non-EL gap, the Hispanic/white gap, and the gap betweenstudents whose more highly educated parent was a high school dropoutand students who had at least one parent who continued studies beyondthe bachelor’s degree level. Each of these gaps is estimated to haveshrunk by about 15 percent over two years because of the effect of theBlueprint.
Middle school results similarly suggest that the Blueprint reducedthe various achievement gaps, but by less than 5 percent. High schoolresults are uniformly negative in that they suggest that the Blueprintwidened achievement gaps. The most dramatic instance was the highschool EL/non-EL gap, which is predicted to have widened by roughly10 percent. This mainly reflects the large negative predicted effects ofliteracy block and core for EL students reported in the last chapter.

78
Per
cent
age
NOTE: The figure shows the predicted two-year reduction in test-score gap between spring 2000 and spring 2002 for students in grades 3, 6, and 9 in fall 2000. A positive/ negative bar indicates that the initial gap is predicted to have narrowed/ widened as a result of the Blueprint. The comparison group is students whose more highly educated parent had completed some postgraduate education.
Elementary school Middle school High school
20
15
10
5
0
–5
–10
< High school diploma
High school diploma
Some college
Bachelor’s degree
Figure 5.6—Two-Year Reduction in Test-Score Gaps Related to ParentalEducation Attributable to the Blueprint
Although the effects of literacy core for non-EL students and literacyblock/core for EL students were both negative, the relative magnitude ofthe predicted effects played a role in widening the achievement gap. Thepredicted effect of literacy block/core for EL students was much morenegative, contributing to the result that is seen.
It is important to acknowledge that our estimates have assumed thatthe effect of each Blueprint element has been constant across studentgroups. Our estimates of changes in the gap therefore derive fromdifferent participation rates in Blueprint interventions among variousstudent groups. The one major exception is that we have estimated theeffect of literacy core and block on EL students separately from non-ELstudents. Although we devoted considerable time to testing fordifferences in Blueprint effects among the three sorts of groupings ofstudents used in this chapter, we found that with two years of data, welacked the number of observations needed to test convincingly for suchdifferences. Indeed, when we ran models that allowed effects to vary

79
either by race, language status, or parental education, the vast majority ofcases revealed no significant differences. In addition, models estimatedseparately by group typically failed to find statistically significant effectsof Blueprint elements, which clearly reflected our relatively smallsubsamples.
Thus, our assumption of identical effects among groups is likely toproduce a fairly accurate estimate of the effect of the Blueprint onachievement gaps. But future work with additional years of data mayallow us reliably to detect variations in the effect of specific interventionson different groups of students, which could alter our conclusionssomewhat.
ConclusionOverall, the cumulative two-year effects of the various Blueprint
elements have been quite large. The reforms appear to have boosted testscores substantially in elementary schools, boosted them moderately inmiddle schools, and if anything, depressed reading achievement in highschools.
With the major exception of high school, then, we conclude that theBlueprint reforms have meaningfully increased gains in reading. Theyhave done so by boosting the average achievement of those whoparticipated and by “rescuing” students from the bottom 20 percent ofthe test score distribution and moving them into higher deciles. Thatsaid, the lack of similar effects in high school is notable.
We found similar patterns when we examined achievement gaps inSan Diego that relate to language status, race, and parental education.Overall, the Blueprint appears to have reduced fairly dramatically theachievement gaps in elementary schools, to have reduced theachievement gap in middle schools by far more modest amounts, and tohave exacerbated the achievement gap in high schools, typically to amodest degree. These conclusions apply to all three ways in which wegrouped students.
In sum, we find generally positive effects of the Blueprint overall onstudent achievement and in terms of reducing achievement gaps, withhigh schools proving a major exception. We cannot say for certain whythe Blueprint reforms appear to have varied so greatly in their effect

80
across gradespans. Clearly, one reason for the relative success of theBlueprint at the elementary school level has been the package of reformsimplemented at focus and API 2 schools. As for the lack of success of theBlueprint overall at the high school level, literacy core and block do notseem to have had the same positive effects we detected in middle schools.
A general explanation for the declining effect of the reforms inhigher gradespans could be that in elementary schools, where teacherstypically spend most of the school day with the same students, teachershave the time to learn the strengths and weaknesses of each student inreading, and tailor “Balanced Literacy” for each student appropriately.This one-on-one contact diminishes markedly at the high school level.Another possibility, which we discuss further in the concluding chapter,is that the District #2 reforms from New York did not include a highschool component, so that we might expect less initial success in SDUSDin implementing the reforms at the high school level because of a lack ofhistorical precedent. A third possibility is that high school Englishteachers, who typically come to class prepared to teach literature, werenot as focused on basic literacy skills as were homeroom elementaryschool teachers. A fourth possibility is that the double- and triple-lengthEnglish classes backfired at the high school level because students in thatage group felt negatively stigmatized by these pullout classes, in a waythat did not occur with younger middle school students. Indeed, it isquite remarkable that at the high school level, summer school classesseemed to benefit students whereas extra-length high school classesduring the regular school year seemed not to prove beneficial to students.Pullout classes during the school year, because they occurred in full viewof all of the students’ peers, might have stigmatized students to a greaterdegree than the relatively secluded summer school classes. On a relatednote, the high school pullout classes may have damaged student moralebecause they could quite literally see the courses in other subjects thatthey were “missing out on” by looking at their counterparts who werenot asked to participate by virtue of their better reading scores.

81
6. Testing for Variations by Yearin the Effectiveness of theBlueprint
IntroductionOur analysis has examined test score gains in the school years
1999–2000 through 2001–2002. With the official introduction of theBlueprint in summer 2000, a good question is whether the effect of thevarious Blueprint elements varied by year. The most obvious patternwould be that as the districts’ teachers and administrators gainedexperience with the Blueprint, this learning by doing might haveincreased the effectiveness of individual parts of the Blueprint. It is lesslikely, but still conceivable, that interventions might have become lesseffective over time, perhaps because of unobserved actions by anyparents, teachers, students, or administrators who opposed the Blueprint.To test these ideas, this chapter repeats the analysis of Chapter 4 andallows the effect of each intervention to vary by year.
A closely related issue is whether the average effect of an interventiondepended on whether a student enrolled in that intervention for one ortwo years. We examine this as well.
Variations over Time in Blueprint Effects onReading Achievement
Figures 6.1 through 6.3 show the predicted effects of each Blueprintelement that was significant, once we allow each effect to vary by year.Our approach was to estimate a “main” effect for 2001–2002, the lastyear of our study, and to add interactions to test for variations from thismain effect in earlier years. Most Blueprint interventions and preventivestrategies were in place for only two years, 2000–2001 and 2001–2002.

82
Per
cent
age
NOTES: In general, the lack of a bar for 1999–2000 indicates that the program was not in effect in that year. The only programs that we measure in 1999–2000 are the two types of peer coaches.
Focusschool
Blueprintsummerschool
WSEPPeer coachapprentice
Peercoach
API 2school
50
40
30
20
10
0
–10
1999–2000 effect
2000–2001 effect
2001–2002 effect
Figure 6.1—Predicted Effect of Blueprint Elements on Annual Gains inReading Achievement Among Elementary School Students by Year
A few, such as peer coaching and genre studies, were implemented on avery limited basis in 1999–2000 as well, in which case we addedinteractions to test for variations in the effect of these elements between1999–2000 and the base year of 2001–2002.1
In the figures, we present a bar showing the predicted effect of agiven Blueprint element for any year in which, overall, the effect wasstatistically significant. In cases in which we found a significant maineffect for 2001–2002 and no significant difference in an earlier year, weset the overall effect in the earlier year to the main effect. We did this so_____________
1As shown in Table 2.1, literacy block was also implemented on a very limited basisin grade 9 in 1999–2000. However, we were not able to estimate a separate effect ofliteracy block for this year because of small sample size.

83
–20
–10
0
10
20
30
40
50
60
70
80
90
Liter
acy b
lock
Liter
acy c
ore
Block/
core
for
EL stu
dent
s
Genre
stud
ies
EDRP
Bluepr
int
sum
mer
scho
ol
Inte
rses
sion
Peer c
oach
as
% o
f enr
olmen
t
Peer a
ppre
ntice
Ch
ang
e (%
)
NOTES: In general, the lack of a bar for 1999–2000 indicates that the program was not in effect in that year. The only programs that we measure in 1999–2000 are the two types of peer coaches and genre studies.
1999–2000 effect
2000–2001 effect
2001–2002 effect
Figure 6.2—Predicted Effect of Blueprint Elements on Annual Gains inReading Achievement Among Middle School Students by Year
that readers would not read too much into small variations across yearsthat are not statistically meaningful.2
Figure 6.1 shows effects by year in elementary schools. If the effectof a Blueprint element varies across years, typically the effect increases inthe later years. In some cases, these increases in effectiveness are quitedramatic. For example, the estimated effect of EDRP rises from a 2.9percent boost to the average growth in reading achievement in_____________
2In the rare case in which the main effect was not significant but the interaction foran earlier year was significant, we tested that the overall effect for that year, given by thesum, was significant. If so, we used the sum of the main and interaction coefficients toestimate the overall effect for the earlier year. Otherwise, we set the effect for that earlieryear to zero. Note also that by showing identical bars for years where we could find nosignificant difference, we present the “main” 2001–2002 effect. While minimizing inthis way the chance that we are reading “too much” into variations by year, our graphs insome cases consequently suggest overall effects that do not reflect the true overall effectspresented in Chapter 4.

84
–30
–20
–10
0
10
20
30
40
50
60C
han
ge
(%)
Literacyblock
Block/corefor EL
students
Peerapprentice
as % of enrollment
Summerschool
Literacycore
Peer coachas % of
enrollment
NOTES: In general, the lack of a bar for 1999–2000 indicates that the program was not in effect in that year. The only programs that we measure in 1999–2000 are the two types of peer coaches and literacy block.
1999–2000 effect
2000–2001 effect
2001–2002 effect
Figure 6.3—Predicted Effect of Blueprint Elements on Annual Gains inReading Achievement Among High School Students by Year
2000–2001 to a 17.7 percent boost in 2001–2002. Similarly, the effectof attending a focus school or an API 2 school rises from 25.2 percent to43.9 percent, and from 11.3 percent to 25.8 percent, respectively. Moresubtly, peer coaches as a percentage of enrollment, which was notstatistically significant overall, is negative in 1999–2000 and positive inthe two later years and in all cases was significant. This provides somepreliminary evidence that perhaps the effect of having peer coaches in theschool has become more positive with time.
Results for middle and high schools, shown in Figures 6.2 and 6.3,are not as clear cut. The results for middle schools suggest that literacyblock and core and peer coaches may have become slightly more effectiveover time, but EDRP appears to have been effective only in 2000–2001.

85
At the high school level, we find some evidence that the overallnegative effects of literacy block and block/core for EL students may havedisappeared by 2001–2002. On the other hand, the positive effect ofsummer school and the negative estimated effect of peer coaching didnot seem to vary over time.
Variations in the Effectiveness of BlueprintInterventions Depending on Whether a StudentEnrolled for One or More Years
Our main models assume that there are no positive or negativeinteractions between interventions within a year or across years. Onereviewer asked whether a given intervention might be more effective ifaccompanied by another intervention in the same year or preceded bythe same or a second intervention in a prior year. As Chapter 3 shows,of students who participated in at least one intervention in a given year, astrong majority participated in only one intervention, which prevents usfrom performing a meaningful test for interactions among differentinterventions with these first two years of data.
However, as a first step toward addressing the question of possibleinteractions between enrolling in a specific intervention for more thanone year, we re-estimated the models described in the previous section totest the idea that enrolling in a specific intervention for more than oneyear could matter. Theoretically, the effect of enrolling in anintervention for more than one year could go in either direction. Basiceconomic theory suggests that holding other “inputs” constant,increasing one input more and more will eventually lead to diminishingreturns, that is, a decrease in the effectiveness of a given intervention.Similarly, there is the possibility that students who stayed in a givenintervention two years did not get much out of the intervention but werepersuaded to stay by teachers who remained concerned about theirreading ability. Conversely, it is conceivable that it takes two years ofinvolvement with a given intervention for the student to really take off,which suggests the opposite of diminishing returns.
There is a second reason for testing whether the effect ofinterventions and preventive programs differed if a student participated

86
for more than one year. Chapters 4 and 5 document very large positiveeffects of the focus school and API 2 school preventive programs. It ispossible that these represent what are known as Hawthorne effects. Thisrefers to a phenomenon in which any change to an organization leads tobetter outcomes simply because in the short run people are inspired by achange, in particular, by being singled out for additional attention.However, such effects are typically very transient and do not represent apermanent improvement. By testing students who are in focus or API 2school programs for two years in a row, we can test whether the averageeffect is less than if their school had participated in either program forjust one year. If so, it would provide some evidence of a temporary andessentially meaningless Hawthorne effect. Such concerns in fact applyequally to all of the student-based interventions as well.
To allow for such effects across all interventions and preventiveprograms, in addition to allowing the effect of enrolling in, for example,EDRP, in 2000–2001 to differ from the effect of enrolling in2001–2002, we also allowed the average annual effect of EDRP to differfor students who enrolled in EDRP in both 2000–2001 and 2001–2002.For each intervention, we added indicator variables to indicate everypossible combination of participation over time. We then explicitlytested whether the effect of enrolling in a given intervention in anyparticular pattern produced bigger effects than enrolling in 2000–2001only. We reproduced the above results that the effect of enrolling in anintervention did often vary by year of enrollment. However, in all butone case, there was no additional benefit or detriment for those whoenrolled in a specific intervention for more than one year. The exceptionwas literacy block among middle school students: Students who enrolledin this intervention in both 2000–2001 and 2001–2002 had slightlyhigher average effects in terms of reading gains than students whoenrolled only in 2000–2001 or only in 2001–2002. Put differently, thispositive interaction is above and beyond the result that, in general,enrolling in literacy block in 2001–2002 was more effective than takingit in 2000–2001 only.
All in all, we found little evidence that students who enrolled in agiven intervention for two or more years gained more or less per year ofintervention than students who enrolled for one year only. This also

87
provides evidence against the hypothesis that the large benefits producedat focus and API 2 elementary schools were merely transient Hawthorneeffects.
ConclusionOverall, this chapter suggests that the effect of the Blueprint’s
elements has increased over time, most strongly in elementary schoolsand to a lesser extent in middle and high schools. The evidence impliesthat as the district has gained experience with the various reforms, thereforms have on the whole become more effective. This is important toremember, especially for cases in which our overall analyses in Chapter 4suggested that a Blueprint element had no significant effect on readinggains. Although it may be true that on average the given element hashad no effect, over time it appears to have become effective. Mostnotably, in Chapter 4 we reported that overall peer coaching inelementary schools had an effect that was not statistically different fromzero. In the analysis in this chapter, we find some evidence that thisoverall zero effect is composed of a negative effect in 1999–2000 and asmall positive effect in later years. Perhaps the second most importantfinding was that the overall negative effects of literacy block andblock/core for EL students at the high school level may have disappearedby 2001–2002.
We also tested for, and found only scant support for, the notion thatstudents who enroll in a given intervention more than one year receivedisproportionately more or less benefit per year of enrollment than doesa student who enrolls for one year only. This is particularly importantbecause it reduces the chance that the reforms produced only transientHawthorne effects.
Finally, we need to list two caveats to these results. First, sample sizeby year is smaller than in our overall samples, so that on occasion we findeffects in given years to be insignificant even though overall across allyears the results in earlier chapters showed effects to be significant.Second, it is tempting but inappropriate to project these trends into thefuture, thus inferring that the Blueprint may have become more effectivewith each year since 2001–2002, when our analysis ends. This

88
hypothesis could well prove true, but it is just that, a hypothesis. It willtake additional years of data to know for certain.
Those caveats aside, we believe that our results may indeed providesome initial evidence that San Diego has been “learning by doing.” Thisseems all the more likely given the evidence presented by Stein,Hubbard, and Mehan (2004) of the difficulties that initially confrontedSan Diego administrators, instructional leaders, principals, and peercoaches in learning and then disseminating to classroom teachers thecentral ideas of the reading reforms.

89
7. Testing for Possible SideEffects of the Blueprint onOutcomes Apart from Reading
IntroductionAs we stated in the introductory chapter, one initial public concern
about the Blueprint was that its focus on reading would backfire bydiverting students’ attention from other subject areas. This potentialseemed most likely in middle and high school, in which students havebeen directed to double- or triple-length English classes. However, thosewho read poorly may not learn much in their other subjects in partbecause their limited reading skills prevent them from reading theirtextbooks and related materials effectively. This hypothesis wouldsuggest that time spent improving reading skills might actually increasegains in achievement in other subject areas than English.
A second potential side effect has to do with students becomingdisenchanted with school because of the additional effort required invarious Blueprint programs. Anecdotally, the San Diego media havereported complaints by several parents that their students were becoming“burnt out” by either literacy block and core, the extra-length Englishclasses, or EDRP.
Lacking any firm evidence on either of these issues, we decided totest some of these propositions. Math and reading are the two corecompetencies tested at every grade level in which the state of Californiatests students. So we tested the “academic diversion” hypothesis bymodeling gains in Stanford 9 math scores as a function of students’participation in the various Blueprint reading programs. It is obviouslydifficult to test fully the notion that Blueprint participation “burns out”students. We decided that the best approach was to model the

90
percentage of days that students were absent in each year. Obviously thisis a very imperfect proxy for students’ attitudes, but especially in uppergrades it likely reflects students’ desire to be at school.
In both cases, we simultaneously controlled for all sorts of otherfactors that might have contributed to student outcomes. In particular,we continued to add student, school, home zip code, grade, and yearindicator variables to our models. Probably the most important of theseis the indicator variables for each student. These take into accountunobservable but unvarying characteristics across students. Because ofthis, in practice we identify the effect of Blueprint elements by testing fora link between changes in a student’s Blueprint participation and changesin the given outcome for that student.
Effect of the Blueprint Reading Elements on Gainsin Math Achievement
We estimated models that mirror those in Chapter 4, except that thevariable we were now trying to explain was gains in math scores ratherthan gains in reading scores. We used the corresponding vector of mathteacher characteristics, peers’ math test scores, and math class size inthese models.1
Following the approach of Chapter 4, in Figures 7.1 through 7.3 wereport the estimated effect of various Blueprint elements related toreading on gains in math achievement for elementary, middle, and highschools. The vertical axis in these figures, similar to those in Chapter 4,is the predicted percentage effect of a given Blueprint element on theaverage annual gain in math test scores. For instance, a bar in thesegraphs with a height of +10 percent suggests that the given Blueprintprogram is associated with a 10 percent increase in the annual averagegain in math scores we observe for students districtwide.
Figure 7.1 suggests that for elementary school students, participationin various Blueprint reading programs, including schoolwide preventivestrategies, is associated with quite big increases in the rate of gain in mathachievement. The largest effect here is the introduction of a focus school_____________
1This corresponds to model iv in Appendix B. Estimates using the sparser model iwere also estimated, and the results were similar to what we report here.

91
Peer coachexperience
API 2 school Focus school Blueprintsummer school
0
2
4
6
8
10
12
14
Cha
nge
(%)
NOTES: For Figures 7.1 through 7.3, effects are simulated of a student participating in the given intervention or prevention strategy. Exceptions are nonbinary variables related to mean teaching experience of peer coaches, in which case we simulate the effect of a change from zero to the sample mean. For literacy core/block for EL students, we calculate percentage effects by dividing by mean math score gains for EL students.
Figure 7.1—Predicted Effect of Blueprint Elements on Annual Gains in MathAchievement Among Elementary School Students by Year
program at a student’s school, which is associated with an 11.5 percentincrease in the mean rate of gain in math scores. These findings areconsistent with the idea that rather than taking student attention awayfrom math, exposure to supplementary reading programs enhancedstudents’ ability to absorb their math lessons. One variable that appearsto matter for gains in math achievement, unlike in our earlier analysis ofreading achievement, is peer coach experience. Figure 7.1 simulates theeffect of increasing the average years of teaching experience of theschool’s peer coaches from zero to the mean actually observed, which forelementary schools is 12 years.
Figure 7.2, with results for middle schools, suggests a similarconclusion, with participation in a wide array of Blueprint interventionsassociated with gains in math learning for participants. Each of thepositive predicted effects is quite big. Most notably, participation in

92
Block/core forEL students
EDRP Blueprintsummer school
Intersession Peer coachexperience
–15
–10
–5
0
5
10
15
20
Cha
nge
(%)
NOTE: See the notes to Figure 7.1.
Figure 7.2—Predicted Effect of Blueprint Elements on Annual Gains in MathAchievement Among Middle School Students by Year
block/core for EL students and participation in intersession are associatedwith 15 percent gains in math learning. One exception to the overallpattern is that schools at which peer coaches had more experience wereassociated with lower math gains. The predicted drop of about 10percent is meaningful. However, this corresponds to a very large changein peer coach experience, from zero to the sample mean of 13.1 years.
Figure 7.3 shows results for high schools, which are quite differentfrom those in the lower gradespans. Participation in literacy core fornon-EL students is associated with a drop of about one-half in averagegains in math achievement. EL students in literacy core/block are alsopredicted to learn less math, although this effect is far more muted.Finally, peer coach experience is modestly and positively related to mathscore gains. Overall, these high school results are the only evidence wecould find that the Blueprint reading elements may have detracted fromlearning outside of reading, but they are quite dramatic results.

93
Literacy core Block/core forEL students
Peer coachexperience
–60
–50
–40
–30
–20
–10
0
10
20
Cha
nge
(%)
NOTE: See the notes to Figure 7.1.
Figure 7.3—Predicted Effect of Blueprint Elements on Annual Gains in MathAchievement Among High School Students by Year
Effect of the Blueprint Reading Elements on StudentAbsences
We tested the burn-out hypothesis by modeling the percentage ofschool days that a student was reported absent.
Figure 7.4 shows results for elementary schools. Each of theBlueprint elements that is statistically significant is shown in the figure,and each of these elements is predicted to have a negative effect on timeabsent. This is the opposite of what we would have seen if Blueprintprograms were discouraging students from being at school. The effect ofBlueprint retention (in grade 1) is particularly large: Students who areBlueprint-retained reduce their time absent by about one-quartercompared to the year before they are retained. This amounts to areduction in the percentage of time absent of 1.2 percentage points, orabout two days out of a 180-day school year.
We found far more mixed results for middle and high schools.
94
API 2 school EDRP Intersession Blueprintretention
–30
–25
–20
–15
–10
–5
0
Cha
nge
(%)
NOTES: For Figures 7.4 through 7.6, effects are simulated of a student participating in the given intervention or prevention strategy. Exceptions are nonbinary variables related to peer coaches as a percentage of enrollment and mean teaching experience of peer coaches. In both of these cases, we simulate the effect of a change from zero to the sample mean. For literacy core/block for EL students, we calculate percentage effects by dividing by mean math score gains for EL students.
Figure 7.4—Predicted Effect of Blueprint Elements on Time Absent inElementary Schools
Figure 7.5 shows that various Blueprint elements are estimated tohave had moderate, positive, or negative effects on time absent in middleschools. The last bar, in contrasts, suggests that Blueprint retention hada big effect, increasing time absent by 29.7 percent. This is virtually theopposite finding to the elementary school pattern. What does this implyin real terms? On average, middle school students were absent 5.0percent of the time. Blueprint retention is predicted to boost theseabsences to 6.5 percent, or about 2.7 days out of a 180-day school year.
Figure 7.6 shows similarly mixed results at the high school level.Participation in literacy block is predicted to reduce student absences bya small amount. Peer coaches and apprentice peer coaches are predictedto have opposite effects on time absent. Overall, the simulated effect ofgoing from zero peer coaches of either type to the mean percentages in

95
EDRPBlock/corefor EL
students
Genrestudies
Peer coachexperience
Peer coachas % of
enrollment
Blueprintretention
–10
–5
0
5
10
15
20
25
30
35
Cha
nge
(%)
NOTE: See the notes to Figure 7.4.
Figure 7.5—Predicted Effect of Blueprint Elements on Time Absent inMiddle Schools
high schools is predicted to alter time absent by –17.8 percent for regularpeer coaches and +11.0 percent for apprentice peer poaches, for a netreduction in time absent of –6.8 percent. On the other hand, goingfrom inexperienced peer coaches to those with the mean teacherexperience observed in the district is predicted to increase time absent by10.2 percent.
ConclusionThis chapter explores two possible side effects of the Blueprint
reading reforms—“academic diversion” from math to reading and burn-out of students in terms of increased student absences.
Overall, this chapter finds little evidence that the Blueprint’s readingprograms have hurt math achievement. At the elementary and middleschool levels, we in fact found the opposite to be true. These findingssupport the opposing hypothesis that reading ability is a “gateway” skill

96
Literacyblock
Peer coachexperience
Peer coachas % of
enrollment
Peer coachapprentice as %
of enrollment
–10
–20
–15
–5
0
5
10
15
20
25
Cha
nge
(%)
NOTE: See the notes to Figure 7.4.
Figure 7.6—Predicted Effect of Blueprint Elements on Time Absent in HighSchools
that can foster student learning in other subjects. In contrast, highschool results were mixed, but literacy core was associated with a drop ofabout one-half in gains in math. In a sense, this mimics the results forreading gains in earlier chapters suggesting the Blueprint reforms havehad far more beneficial effects in lower grades than in upper grades.
Our test of the burn-out hypothesis suggested something quitedifferent from student burn-out at the elementary school level, wherestudent exposure to Blueprint reading reforms was uniformly predictedto reduce student absences. The estimated effect of Blueprint programson time absent in middle and high school varied by Blueprint element,suggesting the lack of a consistent effect. However, even the mostnegative effect—a predicted 30 percent increase in time absent formiddle schoolers who were Blueprint-retained, translates into an effectthat is meaningful but not huge, specifically, a loss of about 2.7 days outof a 180-day school year.
Overall, then, we conclude that the Blueprint may have hadbeneficial side effects on learning in math in elementary and middle

97
schools and on student absences in elementary schools. We expect thatmany readers will be surprised by these findings. Evidence of negativeside effects crops up mostly at the high school level, but with theexception of a large estimated negative effect of literacy core on gains inmath scores among high school students, these negative effects are quitemodest. The negative finding related to literacy core at the high schoollevel is consistent with results in earlier chapters on the effect of literacycore on reading gains at the high school level.

99
8. Conclusion and TentativeImplications for Policy
IntroductionA study of a major education reform should seek to answer several
key questions, including “Which students participated?” “Did the reformwork?” “How big were the effects?” and more policy-oriented questionssuch as, “In light of the evaluation, what should the district do now?”and “Are there lessons for other districts?” The preceding chapters havegiven detailed answers to the first three questions. Although we willbriefly summarize these findings here, the main goal of this chapter is tofocus on policy advice, such as it may be, both for SDUSD and fordistricts in California and elsewhere. These are particularly importanttasks. In San Diego, the entire Blueprint is at an important crossroads.In winter 2005, the district’s newly elected school board voted to buyout Superintendent Bersin’s contract, and he departed on June 30, 2005,a year before his contract expired. Ironically, although SuperintendentBersin’s early departure places the future of the reforms in greater doubtin San Diego, it also raises statewide and national attention on SanDiego. The main reason is that on July 1, 2005, former SuperintendentBersin became California’s new Secretary of Education, drawingobservers across the state to speculate on what lessons he took from hisSan Diego experience and what statewide reforms he would subsequentlyrecommend. So, what have we learned, and does it hold policyimplications for SDUSD itself or for districts elsewhere more generally?
Patterns of Participation and Patterns of Effects onReading Achievement
First, student participation in Blueprint interventions has been quitehigh, signaling the unusual scope of the Blueprint reforms. At the same

100
time, the reforms have been rather focused in that the interventions havetargeted students who lagged seriously behind in reading. Just underone-quarter of district students participated in at least one Blueprintintervention between summer 2000 and spring 2002. As expected,students who often fall behind in reading, such as EL students, Hispanicand black students, and students in schools serving relativelydisadvantaged students, were much more likely to participate. Ingeneral, the district has used reading test scores to assign students toprograms much as advertised. However, there is much flexibility builtinto the system.
Next, “Did the Blueprint work?” Our analysis suggests that studentparticipation in many of the individual Blueprint elements has boostedstudent gains in reading achievement, sometimes in dramatic ways. Theevidence that the Blueprint has worked is particularly strong at theelementary school level. Reforms at the focus and API 2 elementaryschools as well as EDRP and Blueprint summer school were all associatedwith increased reading gains for individual students. We also findevidence that various Blueprint components at the middle school levelhave overall boosted student achievement in reading, although the gainsare more modest than in elementary schools. Here, literacy block andcore, EDRP, and Blueprint summer school are predicted to lead to gainsin reading achievement. At the high school level, the overall effectappears to have been negative in the initial years of the reform—the onlyBlueprint element for which we found evidence of a positive effect wasBlueprint summer school. Several other elements, especially literacyblock for non-EL students and both block and core for EL students, wereassociated with decreased gains in reading achievement over the period westudied.
It is important to remember that each Blueprint element was inexistence for one to three years during the period of our study and inmost cases only two years. Had we been able to follow the reformsthrough spring 2004 rather than spring 2002, we might have seendifferent results. Notably, when we tested for differences in the effect ofthe Blueprint reforms by year, the most typical pattern was that thereforms worked better in later years.

101
Perhaps nowhere is this point more important than for high schools.Overall, during the 1999–2002 period, the Blueprint reforms appear tohave had a negative effect at the high school level. But closerexamination of the separate effects by year showed that the negativeeffect of literacy core and block had disappeared by 2001–2002, leavingtwo countervailing effects—a moderate negative influence of peer coachintensity and a large positive influence of Blueprint summer school. Inother words, it would be premature to use our results to declare theBlueprint a failure at the high school level. Instead, our high schoolresults imply some very large costs of introducing these reforms that werelargely mitigated by 2001–2002.
As another example of the importance of the dynamics of thereform, the peer coaching program appears to have had no overall effecton student learning. However, we did find some preliminary evidencethat peer coaching was beginning to have a positive effect in elementaryschools by 2000–2001.
Beyond the question of “Did it work?” it is equally important toanswer the question “Were the effects big?” We analyzed the size of theBlueprint effects in several ways. For students who participated in atleast one Blueprint intervention between fall 2000 and spring 2002, thenet effect was a gain in reading achievement equivalent to 22 percent of astandard deviation in elementary schools, an increase of 5 percent inmiddle schools, and a drop in reading achievement of 11 percent in highschools.1 The size of these effects, at least for elementary schoolstudents, is quite dramatic. We also analyzed how Blueprint participantsmoved in the overall test-score distribution over this period. Inelementary and middle schools, we detected a distinct movement out ofthe bottom two test-score deciles and into the higher deciles. Forinstance, we found evidence that the Blueprint had shifted roughly 10percent and 5 percent of participants in elementary and middle schools,respectively, out of the bottom tenth and two-tenths of test-scoreperformance into higher deciles. Again, the elementary school effect, at_____________
1The standard deviation is a measure of variation. See Chapter 6 for moreinformation.

102
least, is rather dramatic. In high schools Blueprint participationappeared to shift about 5 percent of students into lower deciles.
Side Effects?We also investigated concerns voiced locally that the Blueprint’s
emphasis on reading would lead to student burn-out and diminishlearning in other key subject areas. Our initial results partially cast doubton these ideas. At the elementary and middle school levels, the Blueprintmay have in fact improved math achievement, in spite of the Blueprint’sinitial emphasis on reading, and the Blueprint may have also boostedattendance in the elementary schools. The most negative finding weobtained was that in high school, literacy core was associated withsubstantial drops in math growth. Notably, the district has abandonedliteracy core.
Implications for Policy in San DiegoOur analysis of the first two years of the Blueprint should be
regarded as a preliminary and far from final judgment on the success ofthe Blueprint. Many studies of educational reform have shown that ittakes several years for the full effects of reform to take root.2 To befrank, we were quite prepared at the outset of this project to find no oronly small effects of Blueprint reforms in the first two years. We wereactually somewhat surprised to find effects as strong as we have in theinitial two years.
What does seem clear is that the Blueprint has had far more positiveeffects in the lower grades, with elementary schools showing larger(positive) outcomes than middle schools, and high schools showingoverall negative outcomes. An immediate policy question emerges:“Why did the results weaken in middle school and reverse in highschool?” The weaker results in middle school than in elementary schoolsappears to be largely attributable to the whole-school elementary reforms_____________
2For example, the considerable time and effort needed to make school reformsendure is a recurring theme in the collection of papers edited by Cuban and Usdan(2003b).

103
in the focus and API 2 elementary schools, which gave a large boost toelementary reading scores.
The larger puzzle is what went wrong, at least initially, in highschools. We offer four hypotheses. In middle and especially high school,students typically have different teachers for at least some subjects,whereas in elementary school, students typically spend most of their dayswith the homeroom teacher. It could be that the reading reforms workbest when a teacher has the entire school day to observe the student’sstrengths and weaknesses in reading and writing.
A second possibility is that teachers in the earlier gradespans aremore amenable to working with students on basic literacy skills than arehigh school English teachers, who by and large in San Diego have takena rich medley of college English literature courses and who, presumably,are intent at least in part on teaching literature rather than teachingstrictly reading skills that are the main focus of the state test.
A third factor derives from the notion that reforms take time,especially when they lack full historical precedent. Stein, Hubbard, andMehan (2004) observe that the approach to reading that ChancellorAlvarado tried to adapt from his prior experience in District #2 in NewYork had been designed initially for K–4 and was later extended byDistrict #2 staff to grades 5–8. The implication we draw is that readingreforms at the high school level in SDUSD built on less historicalprecedent than did the reforms in earlier grades, and thus they may takelonger to fine-tune.
A final scenario, admittedly our most speculative, is that the double-length and triple-length pullout English classes created a negative stigmaamong struggling high school participants, who, like the typical teenager,hate nothing more than to be singled out in a negative way. One can seehow the double-length and triple-length English courses would createstigma, particularly at the high school level, because the implication isthat more periods spent in English per week must mean fewer periods incourses in other areas. This would potentially create an even bigger gapin the number of college preparatory courses taken in other subjectsbetween those students in literacy block and core and other students.But it is not only the pressure to complete the so-called “a-g” collegepreparatory classes that would have heightened the stigma in high

104
schools relative to middle schools. The general fear of stigmatizationalmost certainly rises as a student progresses through the teenage years.Anecdotal evidence suggests that one reason why nationally thepercentage of students electing to receive federally subsidized schoollunches plummets in the high school years is exactly the heightened andgeneral fear of stigmatization among fifteen- to eighteen-year-oldscompared to their younger counterparts. Indeed, it is interesting that thelone success at the high school level, Blueprint summer school, had asimilar agenda to literacy block and core but was conducted in therelative quiet and anonymity of the summer months, rather than in thebright glare of the regular school day.
For San Diego itself, what are the main policy implications of ouranalysis? Perhaps the most useful way to infer tentative policyconclusions is to summarize and comment on how the district has alteredthe Blueprint since its formal inception in summer 2000.
The changes to the Blueprint reforms over the last few years havebeen legion. From the start, district officials have pored over test scoreresults with a view to fine-tuning the Blueprint, and they clearly havesensed that overall test score trends in high schools have not respondedin the same way as they have in lower grades. Partly in light of thisrecognition, as of 2004–2005 the district no longer offered literacy corein middle or high schools. In an interview with us in July 2004,SDUSD Superintendent Alan Bersin told us:
I think our experience with the Blueprint, which your [PPIC] research bearsout, is that the resource allocation strategy and the instructional strategies thatwe use . . . show a declining benefit as you move up the K–12 ladder. Andcertainly in the ninth grade through the tenth grade, we have not seen anappreciable increase in the graduation rate nor have we seen a significantgrowth in student achievement, notwithstanding the strategies that were inplace, which involve the [literacy core] and so on. So about two years ago, weabandoned those strategies because the data didn’t support that they were inany way having a sufficiently positive effect.
The district’s board has also taken further measures, acting in 2005to dismantle the peer coach program. And before that, beginning in2003–2004, the district began to supplement or replace peer coacheswith “content-level administrators” in literacy, math, and science. Thesecontent-level administrators are different from peer coaches in that they
105
are less generalists and are more focused on subject matter knowledgethan on teaching methods. Although it remains to be seen what effectthese new administrators will have, it is certainly interesting to see thatthe district appears to be moving away from primary reliance on peercoaching.
It is also surely fair to say that between 2000 and today, California’sschool districts have felt continued financial pressure, especially in lightof the state budget situation. The large cost of the Blueprint suggeststhat financial concerns considerably influenced the evolution of thereforms. Partly because of these cost concerns, the district severelycurtailed EDRP in fall 2003, limiting central funding for these classes tostudents who are eligible under the federal NCLB act for supplementalservices. To be eligible, a student must attend a school that is in thesecond year of Program Improvement status, and in addition the studentmust have low test scores. Preference is given to students eligible formeal assistance. EDRP has also been cut from 25 weeks to about 20weeks to facilitate identification and placement of students deemedeligible under NCLB. Together, these two changes produced aconsiderable reduction in the EDRP.3
Blueprint summer school, on the other hand, has survived but nowhas limited spots available, again largely due to budgetary issues.
What do our results suggest about these cutbacks? Certainly, endingliteracy core classes in high schools seems consistent with our findingthat these triple-length classes were associated with lowered gains forindividual high school students, especially if they were EL students.Even here, we need to emphasize that our findings from two years ofexperience do not necessarily imply the long-run effects of any Blueprintelement, and indeed we found evidence that by the second year, literacycore had a zero, rather than a negative, effect on high school participants.Still, our results suggest that literacy core in high schools was initiallyamong the least successful Blueprint elements. In contrast, we foundthat literacy core was associated with gains in reading achievement in_____________
3In addition, a few school sites have apparently elected to keep EDRP and fund itthrough internal resources.

106
middle schools. Eliminating literacy core, especially in middle school,may have been premature.
Similarly, the recent cutbacks to EDRP seem unfortunate: Thisprogram was linked to gains in reading achievement in both elementaryand middle schools, and the effects were meaningful. Moreover, theinformal cost-benefit analysis we reported in Chapter 4 suggests thatEDRP was probably significantly more cost-effective than anotherapparently winning reform, Blueprint summer school.
Our results do not provide strong advice on whether the districtshould have ended the peer coaching program. We did find someevidence that by 2000–2001, the peer coach program was starting tohave a positive effect in elementary schools, but overall, we typicallyfound no overall effect or slightly negative effects in elementary andhigher gradespans. According to our analysis based in part on2000–2001 financial data reported by the American Institutes forResearch (2002), both EDRP and Blueprint summer school appear tohave worked in a more cost-effective manner than peer coaching in thatyear.
To be fair, the argument we have made that reform requires time totake root perhaps is most relevant for the various professionaldevelopment aspects of the Blueprint. In the case of peer coaches, theymust absorb new teaching methods from their assigned instructionalleaders and then must in turn teach these methods to individual teachersat their schools. It might have taken several years for this three-levelhierarchy to transmit new teaching methods to the classroom mosteffectively.
Although the American Institutes for Research (2002) cost data donot separately report the costs of the preventive genre studies classes inthe entry grade(s) to middle/junior high school, we note that unlikeliteracy core and literacy block in middle schools, we could detect nobenefit of these double-length English classes for students near, at, orabove grade level. Again, our findings may very tentatively suggest whereto look for cost savings that could potentially restore some of the alreadycurtailed Blueprint elements that do appear to work, such as EDRP inelementary and middle schools and literacy core in middle schools.
107
What about the troubling case of high schools? One possibility toimprove outcomes at the high school level would be for the district toexpand Blueprint summer schools on a trial basis in certain high schools.Such an expansion may be merited because Blueprint summer school wasthe sole Blueprint element that appears to have had a positive effect onhigh school students’ achievement in the first two years of the program.4
A second possibility, which we cannot guarantee would work, would beto experiment with a variant of EDRP in high school. This after-schoolreading program worked very effectively in lower grades, and it would beless controversial at the high school level than literacy block and corebecause it would not take time away from college preparatory classes inother subjects.
Policy Issues That Merit Further StudySeveral key issues remain unresolved or only partially resolved by this
work. Most obviously, further research will be needed to study how theBlueprint has fared in later years. We have studied the first two years ofthe official Blueprint; in 2004–2005, the Blueprint entered its fifth yearof implementation. More subtly, in recent years the Blueprint expandedto encompass interventions aimed at boosting math achievement. Thisinnovation represents a substantial addition to the reform’s initial focuson reading achievement, and it merits study. Third, it will be interestingto study in more detail the cost-benefit aspects of the reforms. To beconclusive, such research will require additional years of data and moredetailed budget information. Fourth, our initial study has foundevidence that English Learners fared worse than other high schoolstudents in literacy block and core. With additional years of data, itshould become possible to test for further variations in effect acrossvarious groups of students. Such variations could prove to be quiteimportant for improving the selection of Blueprint interventions forspecific students who lag behind._____________
4There is certainly room to expand: In 2000–2001, Blueprint summer school wasavailable only to high school students in grade 9, with 14 percent enrolling; in 2001–2002, 23 percent of grade 9 and 11 percent of grade 10 students enrolled.

108
Take-Away Message for Local and National LeadersThis analysis of the first two years of the Blueprint reforms provides
the first evidence available on the relative effect of the various elements ofthe Blueprint. For district policymakers, this evidence may provide someideas for elements of the Blueprint worth preserving and for studying atthe classroom level what aspects need overhaul. To the San Diegocommunity, this report provides information that may quell some olddebates and inspire some new debates. Overall, the various Blueprintelements have contributed tangibly to growth in reading achievement,and particularly in elementary schools the reforms appear to haveproduced impressive gains.
Clearly, the biggest disappointment in these initial results is that thelarge and positive results in elementary and middle schools have nottransferred to the high school setting. Only Blueprint summer schoolappears to have worked as intended at the high school level. Moreresearch is clearly needed to determine why the reforms have worked lesssuccessfully in the higher grades.
For leaders in the rest of California and the rest of the nation, whatdo our results suggest? As Alan Bersin moves from San Diego to becomeCalifornia’s new Secretary of Education, can he, and should he, drawupon his San Diego experience in promoting new statewide reforms?First, the results suggest that systemic education reform at all levels fromthe district offices down to the individual classroom and student can anddoes work. Second, they suggest that together the various componentsof the Blueprint might indeed provide one possible model for districtsaround the country, at least at the elementary and middle school levels.At the high school level, as is by now obvious, the same cannot be said.
Of course, several words of caution are in order to districts outsideSan Diego or outside California. To what extent are these reformstransferable? The most difficult question here is whether the mosteffective of the specific interventions, such as after-school readingprograms and summer school, would have been so effective without themassive system of teacher professional development that was launched atthe same time. We do not know the answer to this with any certainty,because the professional development was so widespread in the district

109
that there is no obvious comparison group of schools that had the samestudent interventions but lacked professional development. Still, giventhe very limited effect of peer coaching that we observed in the district,we very tentatively infer that the reading programs such as EDRP andsummer school would have succeeded at least partly without the fullsystem of professional development created in the district.
A second note to districts elsewhere is that it is important to look atpatterns of student participation in San Diego. Notions that theBlueprint interventions were mandatory are simply not true, as Chapter3 demonstrates. Although school administrators could and did urgestudents identified as lagging behind to participate, parents could signforms to keep their children out of the reforms. For instance, the highestparticipation rate we documented was for literacy block in 2001–2002,during which 70 percent of eligible students actually participated. Thishas important practical implications: The Blueprint interventionsaffected students whose reading scores made them eligible and whosefamilies agreed to participate. There is no guarantee that similar resultswould have occurred in a system of truly mandatory interventions and,indeed, it is quite easy to imagine how a universal system of interventionscould have produced effects that were either larger or smaller.
Overall, the Blueprint for Student Success has attracted widespreadnational attention and political and financial support from manyindividuals and groups outside San Diego. Initially, this attention wasmerited by the ambitious scope of the reforms alone. Now, looking backat the initial years of the Blueprint, we can say that this nationalattention was also merited by the fact that the Blueprint did appear to beboosting achievement and reducing achievement gaps between students,at least in elementary and middle schools. But at the high school level,the Blueprint did not yet appear to offer a mix of student services that isclearly effective.
Overall, the nation was right to put San Diego schools under amicroscope. It will take careful assessment of several additional years ofdata on individual Blueprint elements to know for sure, but thepromising early results in the lower grades suggest that the entire nationstands to learn important new insights about specific strategies forhelping students to improve their reading achievement.


111
Appendix A
Data and Information on BlueprintInterventions
Betts, Zau, and Rice (2003) provide most of the details on ourvariables related to student background, class size, and teachercharacteristics that we use to model gains in Stanford 9 reading testscores. Their data covered the school years 1997–1998 through1999–2000. For the present study, we gathered similar data to cover theschool years 1999–2000 through 2001–2002. One difference was thatin 2001–2002 the district did a survey of all of its teachers, which led toupdates to measures of teacher experience. In general these updates haveincreased the experience levels beyond the older measures of teacherexperience that were based solely on administrative records. To thisdataset, we added detailed measures of participation in various Blueprintinterventions as well as schoolwide programs such as the hiring of peercoaches and the designation of certain elementary schools as focus or API2 schools.
Participation in a Blueprint intervention depended primarily on test-score results. The interventions that used test scores as criteria foreligibility were literacy block, literacy core, grade retention, intersession,Blueprint summer session, and the Extended Day Reading Program.The following definitions describe what is considered “below grade level”and “significantly below grade level.” On the SDRT, each exam isscored with a grade-level equivalent. The test-taker’s current grade levelis subtracted from this grade level equivalent. The difference is called thegrade-level-equivalent difference. The value may be positive (abovegrade level) or negative (below grade level). The designation “belowgrade level” occurs when a student scores more than 1.1 below gradelevel on the SDRT. The designation “significantly below grade level”occurs when a student scores more than 3.1 below grade level on theSDRT. For example, if a student scored a grade-level equivalent of 6.0

112
and his grade level was 7.9, then his score would be –1.9 or 1.9 belowgrade level.
Literacy Block and Core EligibilityLiteracy block (double-length English class) and core (triple-length
English class) eligibility is determined primarily by the prior years’ testscore results. Students in grades 4–11 (5–9 in 1999–2000) wererequired to take the SDRT. Additionally, students were allowed to takethe ARI if their SDRT score was deemed inconclusive by their teacher.To determine eligibility fairly, both test scores were used and the highestgrade-level-equivalent difference was kept to determine eligibility inliteracy block and core classes. Literacy block classes are typicallyassigned to students who are below grade level but may be extended tothose significantly below grade level in schools where literacy core classesare not offered. Literacy core classes are typically available to studentswho scored significantly below grade level in the sixth grade at middleschools, seventh grade at junior high schools (both beginning in 2001–2002), and ninth grade at high schools.
Eligibility Difference Between Middle and JuniorHigh Schools
Current sixth grade students at middle schools who had nonmissingscores were eligible for genre studies or, if they scored below grade levelor lower, were eligible for literacy block. Current seventh grade studentsat middle schools who had nonmissing scores were eligible for literacyblock or literacy core, depending on their scores. Those below gradelevel would be assigned to literacy block, and those significantly belowgrade level would be assigned to literacy core. Current eighth gradestudents at middle schools who had nonmissing scores were eligible forliteracy block if they were below grade level.
Assignment patterns were slightly different at junior high schoolsbecause the entry grade at these schools is grade 7 rather than grade 6.Current seventh grade students at junior high schools who hadnonmissing scores were eligible for literacy block if they were below

113
grade level. Genre studies were offered for these students if they were ator above grade level, but few students took the class.
Eligibility for EL StudentsCurrent eighth grade (non-EL) students who had nonmissing scores
at junior high schools were eligible for literacy block if they were belowgrade level. If they were significantly below grade level, they were eligiblefor literacy core. In high schools, current ninth grade students who hadnonmissing scores were eligible for literacy core if they were significantlybelow grade level on the SDRT or ARI.
For EL students, the eligibility for literacy block and core issignificantly different. Typically, a student’s placement is determined byhis test score as well as the number of years he has been enrolled at thedistrict. Newcomers enroll in either literacy block or core, depending onwhat the teacher feels is best for the student. This makes it very difficultto determine whether a student was assigned to a class for a particularreason. Only twelfth grade EL students have the option of taking single-period English classes.
Summer School, Intersession, and EDRP EligibilitySummer school eligibility is based on SDRT and DRA scores. A
student who scored below or significantly below grade level on theappropriate exam is eligible for summer session. Students who fail acourse are also eligible for summer session, although those students arenot considered a part of the Blueprint summer school. All EnglishLearners are eligible for Blueprint summer sessions, regardless of testscores.
Intersession is available at year-round schools that serve K–8students. Students who are performing below or significantly belowgrade level are eligible for intersession, as well as all English Learners,regardless of their test score.
EDRP eligibility is similar to summer school. Any non-EL studentin grades 1–8 who is scoring below or significantly below grade level iseligible for EDRP. EL students are automatically eligible andrecommended to participate in EDRP.

114
Peer CoachesPeer coaches are full-time teacher positions at each school designed
to support literacy instruction. The peer coaches use a variety ofstrategies to help teachers in their classrooms, including co-teaching,demonstrations, observations, videotaping, and discussions of studentwork. An important role of the peer coach/staff developers is to providesupport for beginning teachers. The coaches keep their knowledge andskills current by participating in coaching themselves, meeting weeklywith their colleagues to discuss their work, and learning new strategies.
Peer coach information was obtained through teacher records. AMicrosoft Access© query was created to search the California BasicEducational Data System (CBEDS) data for specific codes under theposition title code. Those codes were 2070 and 2071 (2071 is the codefor peer coach apprentice). The records were then merged witheducation records. Sometimes a school will get multiple records for peercoaches. This is because teachers were there at different times. Datacleaning methods were used to account for more than one record bykeeping only teachers who served more than 90 days. The number ofpeer coaches as a percentage of enrollment was then calculated.Additionally, the average experience and education for all the peercoaches at a school were calculated. In the regression results presented inAppendix B, these percentages were further multiplied by 100 to allowfor more convenient presentation of the coefficients.
Focus and API 2 SchoolsFocus schools are elementary schools that scored in the lowest tenth
on the state test. These schools received an extended school year, asecond peer coach, and other funds and staff. Schools that were focusschools in both 2000–2001 and 2001–2002 were Baker, Balboa, Chavez,Emerson/Bandini, Jackson, Kimbrough, King, and Sherman. Schoolsthat were focus schools in 2001–2002 only were Edison and Logan.
API 2 elementary schools scored in the second lowest tenth on thestate test. They received a second peer coach and additional funds, butnot an extended school year. The API 2 schools in 2000–2001 wereBrooklyn, Chollas, Edison (which became a focus school in 2001–2002),

115
Encanto, Euclid, Horton, Kennedy, Logan (which became a focus schoolin 2001–2002), Marshall, North Park, and Perkins. The API 2 schoolsin 2001–2002 were Brooklyn, Burbank, Chollas, Encanto, Euclid,Garfield, Horton, Kennedy, Marshall, North Park, and Perkins. A list ofboth focus schools and API 2 schools was obtained through thedepartment of Standards, Assessment, and Accountability at San DiegoCity schools.
Grade RetentionBlueprint grade retention differs from regular grade retention in that
Blueprint grade retention is based on test scores whereas regular graderetention depends on overall annual progress as assessed by a student’steacher. Blueprint grade retention occurs only at grade levels 1 and 6/7,with the latter depending on whether the school was a middle or juniorhigh school. Blueprint grade retention did not begin until the 2001–2002 school year as underperforming students were given a one-yeargrace period to catch up with their peers.
A list of students who were retained for Blueprint reasons at the firstgrade is compiled by the Office of Research and Reporting. Separate listsfor students in the sixth and seventh grades are also kept. This office’sdata were merged with existing data using a student identificationnumber. Variables were also created that denoted eligibility forBlueprint retention but do not indicate who was actually retained.During the first year of implementation, many students who wereeligible were not actually retained because of miscommunication andmisunderstanding regarding grade retention for Blueprint purposes.Hence, the number of students retained for Blueprint reasons is likelybelow the number who should have been retained. In addition, and bydesign, students can be exempted from Blueprint retention on a numberof grounds. For instance, a student who had already been held back oneor more grades was not Blueprint retained, and certain special educationstudents were exempted as well.


117
Appendix B
Regression Methods and Results
As outlined in the text, we model gains in test scores, or ∆Scoreicgst
for student i in classroom c in grade g in school s in year t as a functionof school, family, personal, and classroom characteristics. (Classroomcharacteristics include teacher characteristics and class size.) Ourregression model is
∆Scoreicgst = αs + βZipcodeit+ γ i + Scoreicgs,t–1ω + FAMILYitE +
PERSONALitΦ + CLASSicgstΓ + SCHOOListΛ +
BLUEPitK + PEERigs,tπ + εit
where the first three variables on the right-hand side represent fixedeffects for the student’s school, home zip code, and also the student;
Scoreicgs,t–1 is the student’s prior year score, added as a control forregression to the mean; the next four items in bold characters indicatevectors of time-varying family, personal, classroom, and schoolcharacteristics; BLUEPit is a vector characterizing student i’sparticipation in Blueprint interventions in year t, along with measures atthe school level of Blueprint elements such as peer coach to enrollmentratios expressed as a percentage; PEERigs,t is the average test scores of astudent’s peers in his or her grade level at the current school, based onthe prior spring’s tests; corresponding Greek letters are vectors ofcoefficients, and εit is an error term.
Chapter 4 outlines the list of right-hand-side variables in the aboveequation, which we use to “explain” the variation in gains in test scores.One explanatory variable that deserves further explanation is the averagetest scores in a student’s grade at the school. Suppose student i is in aschool that has n students in the grade. Define
Scoreg–1,t–1

118
as the average score in grade g – 1 in period t – 1 for all students in thedistrict, with σg–1,t–1 representing the standard deviation across allstudents in the district of the score in grade g – 1 in period t – 1. Then,in period t, we define
PEERigs,t =
Scorej,g–1,t–1jπi∑
n –1− Scoreg–1,t–1
σg–1,t–1
In other words, for student i in grade g in school s in year t, the averagegrade-level peer achievement variable is set to the average test score in theprevious year for all of the other (n – 1) students in the grade at thatschool, minus the district average test score last year in the previousgrade, and all of this divided by the standard deviation of test scores lastyear in the previous grade districtwide. So, a value of 1.0 for this variablemeans that the student’s grade-level peers this year on average last yearscored one standard deviation above the district mean. A value of –2.5means that the student’s grade-level peers last year scored 2.5 standarddeviations below the district average. Betts, Zau, and Rice (2003) findstrong evidence that these peer influences do matter for individualstudent learning.
The inclusion of the student fixed effects in the above modelremoves all unobserved but fixed influences on gains in test scores for theindividual students. We believe that these models provide the mostreliable estimates of the effect of classroom and other factors on studentlearning because they control for unobserved factors such as ability,motivation, and social norms in a neighborhood, to the extent that theyare fixed over time.1
Our regression samples include students enrolled in grades 2 through11 between the 1999–2000 and 2001–2002 school years. Our samplesincluded 46,286 elementary school students, 34,037 middle schoolstudents, and 32,095 high school students, or 112,418 students overall.Together, the modeling of gains in scores and the use of student fixed_____________
1See Appendix A of Betts, Zau, and Rice (2003) for a nontechnical explanation ofthe value of using such fixed-effect specifications.

119
effects means that a student must have three consecutive years of testscores in San Diego to contribute to the estimation of the Blueprinteffects. Looking globally at district students, just under one-half fit thatdescription. There are not more because the youngest students cannotpossibly have taken the state test three times by the end of our sample,because testing begins in grade 2, and they may not have reached grade 4by the end of our sample. But the main reason why about half ofstudents do not have three consecutive test scores is student mobility inand out of the district. In a typical year in San Diego, just under 10percent of students are new to the district, and a similar number haveleft. Simple calculations show that of all the students we would see in adistrict like this over a three-year period, about 60 percent are likely tohave three test scores available, because of student mobility.
For this reason, our estimates of the effect of the Blueprint apply tostudents who remain in the district for three years. They may be lessrepresentative of students who have been in the district for less than threeyears. We did some checks on the demographics of attrition and foundthat blacks were less likely than other racial/ethnic groups to stay in thedistrict three years, at a 42 percent probability compared to 46 percentfor Hispanics, 49 percent for whites, and 57 percent probability forAsians, the most stable group. Similarly, 45 percent of EL studentsremained for three years compared to 49 percent of non-EL students.We cannot say for certain whether the influence of Blueprintparticipation for a given year would have been larger or smaller for oursample of students with three test scores. But it does seem likely that as aresult in Chapter 5 we understate somewhat the net effect of theBlueprint because we undercount the number of affected students in oursimulations of net effects over two years.
We need a reasonable number of students participating in a givenBlueprint element to have a hope of detecting an effect as “statisticallysignificant.” We conclude from our earlier analysis of studentparticipation that our dataset does not allow us to test convincingly forthe effect of Blueprint grade retention because of a lack of studentparticipation.
An important issue with these student fixed-effect models is howmuch variation there is in the Blueprint variables after we remove the

120
mean differences among students by subtracting the student means.(This is an equivalent way to estimate fixed-effect models.) In almost allcases, we found that the standard deviation of our de-meaned Blueprintvariables was about half, and sometimes as much as three-quarters, as bigas the standard deviation in the raw data. In addition, the standarddeviation after de-meaning was typically larger than the raw mean of theBlueprint element in question. This convinces us that there is sufficientvariation in the data to support identification of the Blueprint elements,apart from Blueprint grade retention.
One main reason why we have so much variation in the data is thatwe include the 1999–2000 school year in our panel, which is the yearbefore most Blueprint elements were introduced. However, as noted inChapter 2, Table 2.1, one Blueprint element, peer coaching, was in factwidely implemented even in 1999–2000, with roughly two-thirds ofstudents in schools that were served at least part year by a peer coach.But our overall measure of peer coach intensity, which is the number ofpeer coaches in the school divided by enrollment, shows a fairly largedegree of variation before and after we subtract the means by student.The coefficient of variation (standard deviation divided by mean) in theraw data is 0.6, 0.5, and 0.6 in the elementary, middle, and high schooldata. After imposing the student fixed effect, we find a still respectableamount of variation, with residual coefficients of variation (defined as thestandard deviation after de-meaning, divided by the mean of the rawdata) being 0.4, 0.3, and 0.3, respectively.
We estimated six models for each gradespan (elementary, middle,and high schools). They proceed from very basic to models thatsuccessively add controls for class size (model ii), controls for teacherqualifications but not class size (model iii), controls for both class sizeand teacher qualifications (model iv), controls for class size and teacherqualifications and interactions between teacher experience and literacyblock, core, and the various peer coach variables (model v), and controlsfor class size, teacher qualifications, and interactions between teacherexperience and literacy block, core, and the various peer coach variablesas well as interactions with Blueprint elements that occur outside theregular classroom (EDRP and Blueprint summer school). Tables B.1through B.3 present these regression results.

121
The main results, presented in Chapter 4, are based on model iv,which includes controls for class size and teacher qualifications. Ourreasoning for focusing on this model is that it is important to removepossible omitted variable bias by controlling for these measures thatprevious work by Betts, Zau, and Rice (2003) has shown to be related tostudent outcomes. If, for example, students in literacy block happenedto be allocated the most highly qualified teachers, it is important toidentify the effect of teacher qualifications separately from the directeffect of double-length English classes so as not to overstate the effect ofthe Blueprint. Obviously, the reverse correlation between teacherqualifications and literacy block classes would have led to us understatingthe effect of the Blueprint without including these controls. There is onesense in which model iv may “over-control” for non-Blueprint variables:By adding class size, we remove any benefit to students from the reducedsize of grade 6/7 literacy block and grade 9 block and core classes.However, comparison of our various models suggests that controlling forclass size in middle and high schools has almost no effect on ourestimates of the effect of these Blueprint programs. Although we believethat model (iv) is the most conservative model of Blueprint effects,readers can judge for themselves the differences between this model andthe more sparse models i through iii in the tables that follow. In generalthe differences are not large.
We estimated models v and vi to test whether the effect of Blueprintelements varied with the experience of the student’s teacher. The resultsof these models are discussed in Chapter 4.
In Chapters 6 and 7 we present extensions to the basic model. TheChapter 6 models are versions of model iv that allow the effect ofBlueprint elements to vary by year. In Chapter 7, we model studentabsences and math test score gains as a function of Blueprintparticipation. The sets of explanatory variables in these models are thesame as in model iv with the important exception that for the math testscore gains, we condition on characteristics of math classrooms ratherthan English classrooms, and in addition we use peer test scores formath, not reading. These models are not included in this appendix tosave space but are summarized in the chapters themselves. Results areavailable upon request.

Tab
le B
.1
Reg
ress
ion
Res
ults
for
Ele
men
tary
Sch
ools
Mod
el i
Mod
el ii
Mod
el ii
iM
odel
ivM
odel
vM
odel
vi
Cla
ss s
ize
No
Yes
No
Yes
Yes
Yes
Tea
cher
qua
lific
atio
nsN
oN
oY
esY
esY
esY
esIn
tera
ctio
ns1:
blo
ck, c
ore,
pee
r co
ach
No
No
No
No
Yes
Yes
Inte
ract
ions
2: E
DR
P, s
umm
erN
oN
oN
oN
oN
oY
esFo
cus
scho
ol9.
2838
9.29
568.
8184
8.81
818.
4197
8.29
86(0
.689
0)**
(0.6
906)
* *(0
.694
4)**
(0.6
962)
**(0
.816
2)**
(0.8
184)
**A
PI 2
ele
men
tary
sch
ool
3.93
513.
9484
3.76
523.
7471
3.49
593.
3724
(0.6
025)
**(0
.604
6)* *
(0.6
061)
**(0
.608
0)**
(0.7
375)
**(0
.740
4)**
Ave
rage
yea
rs e
xper
ienc
e of
pee
r co
ach
–0.0
352
–0.0
344
–0.0
314
–0.0
310
–0.0
315
–0.0
315
(0.0
163)
*(0
.016
3)*
(0.0
163)
(0.0
164)
(0.0
164)
(0.0
164)
Peer
coa
ch a
s %
of e
nrol
lmen
t1.
381.
441.
231.
322.
511.
80(0
.019
7)(0
.019
8)(0
.019
8)(0
.019
8)(0
.022
1)(0
.022
2)Pe
er c
oach
app
rent
ice
as %
of
enro
llmen
t0.
470.
550.
720.
800.
600.
68(0
.014
3)(0
.014
3)(0
.014
4)(0
.014
4)(0
.014
5)(0
.014
5)E
DR
P pa
rtic
ipat
ion
2.01
972.
0434
2.01
472.
0412
2.03
082.
6633
(0.2
848)
**(0
.285
7)* *
(0.2
847)
**(0
.285
6)**
(0.2
858)
**(0
.382
8)**
Sum
mer
sch
ool p
arti
cipa
tion
4.59
384.
6232
4.50
094.
5206
4.53
794.
7677
(0.5
504)
**(0
.550
9)* *
(0.5
506)
**(0
.551
2)**
(0.5
515)
**(0
.633
3)**
Inte
rses
sion
par
tici
pati
on–0
.887
7–0
.883
7–0
.872
8–0
.866
5–0
.905
8–0
.868
5(0
.673
7)(0
.675
8)(0
.673
9)(0
.676
1)(0
.676
5)(0
.677
8)B
luep
rint
ret
aine
d0.
0000
0.00
000.
0000
0.00
000.
0000
0.00
00(0
.000
0)(0
.000
0)(0
.000
0)(0
.000
0)(0
.000
0)(0
.000
0)
122

Tab
le B
.1 (
cont
inue
d)
Mod
el i
Mod
el ii
Mod
el ii
iM
odel
ivM
odel
vM
odel
vi
Inte
ract
ions
of B
luep
rint
Var
iabl
es w
ith
Tea
cher
Cha
ract
eris
tics
Peer
coa
ch a
nd 0
–2 y
ears
exp
erie
nce
–1.4
372
–0.0
952
(1.8
871)
(1.9
195)
Peer
coa
ch a
nd 3
–5 y
ears
exp
erie
nce
–0.1
582
0.03
82(0
.725
4)(0
.735
7)Pe
er c
oach
and
6–9
yea
rs e
xper
ienc
e–0
.634
2–0
.605
8(0
.420
8)(0
.428
7)Fo
cus
scho
ol a
nd 0
–2 y
ears
exp
erie
nce
0.44
680.
8749
(0.6
102)
(0.6
250)
Focu
s sc
hool
and
3–5
yea
rs e
xper
ienc
e0.
2365
0.26
45(0
.256
9)(0
.261
9)Fo
cus
scho
ol a
nd 6
–9 y
ears
exp
erie
nce
0.06
510.
0817
(0.1
553)
(0.1
585)
API
2 s
choo
l and
0–2
yea
rs e
xper
ienc
e–0
.028
30.
3921
(0.6
025)
(0.6
203)
API
2 s
choo
l and
3–5
yea
rs e
xper
ienc
e–0
.026
80.
0527
(0.2
217)
(0.2
247)
API
2 s
choo
l and
6–9
yea
rs e
xper
ienc
e0.
3668
0.36
73(0
.156
6)*
(0.1
594)
*E
DR
P an
d 0–
2 ye
ars
expe
rien
ce–1
.639
7(0
.451
0)**
ED
RP
and
3–5
year
s ex
peri
ence
–0.1
936
(0.1
583)
123

Tab
le B
.1 (
cont
inue
d)
Mod
el i
Mod
el ii
Mod
el ii
iM
odel
ivM
odel
vM
odel
vi
ED
RP
and
6–9
year
s ex
peri
ence
–0.0
584
(0.1
023)
Sum
mer
ses
sion
and
0–2
yea
rsex
peri
ence
inte
ract
ion
–0.2
181
(0.5
377)
Sum
mer
ses
sion
and
3–5
yea
rsex
peri
ence
inte
ract
ion
–0.2
022
(0.1
862)
Sum
mer
ses
sion
and
6–9
yea
rsex
peri
ence
inte
ract
ion
0.02
31(0
.121
0)N
umbe
r of
obs
erva
tion
s73
,778
73,5
4773
,749
73,5
1873
,518
73,5
18R
–squ
ared
0.73
0.73
0.73
0.73
0.73
0.73
NO
TE
S: F
or a
list
of o
ther
reg
ress
ors
in th
e m
odel
s, s
ee T
able
s 4.
1 an
d 4.
2. E
ach
colu
mn
repr
esen
ts r
eadi
ng s
core
s, u
sing
scho
ol a
nd s
tude
nt fi
xed-
effe
cts
mod
els.
Pee
r co
ache
s an
d ap
pren
tice
coa
ches
as
a pe
rcen
tage
of e
nrol
lmen
t are
mul
tipl
ied
by 1
00.
Stan
dard
err
ors
are
in p
aren
thes
es.
*Sig
nific
ant a
t 5 p
erce
nt.
**Si
gnifi
cant
at 1
per
cent
.
124

Tab
le B
.2
Reg
ress
ion
Res
ults
for
Mid
dle
Scho
ols
Mod
el i
Mod
el ii
Mod
el ii
iM
odel
ivM
odel
vM
odel
vi
Cla
ss s
ize
No
Yes
No
Yes
Yes
Yes
Tea
cher
qua
lific
atio
nsN
oN
oY
esY
esY
esY
esIn
tera
ctio
ns1:
blo
ck, c
ore,
pee
r co
ach
No
No
No
No
Yes
Yes
Inte
ract
ions
2: E
DR
P, s
umm
erN
oN
oN
oN
oN
oY
esLi
tera
cy b
lock
1.77
941.
5230
1.33
851.
2475
1.37
211.
2134
(0.3
503)
**(0
.368
1)**
(0.3
796)
* *(0
.404
9)**
(0.5
239)
**(0
.528
6)*
Lite
racy
cor
e10
.814
910
.512
910
.865
410
.486
510
.952
810
.344
4(2
.907
6)**
(2.9
104)
**(3
.091
9)* *
(3.0
949)
**(3
.897
3)**
(3.9
074)
**Li
tera
cy b
lock
/cor
e fo
r E
L st
uden
ts0.
9128
0.82
620.
4935
0.55
520.
5668
0.61
96(0
.470
2)(0
.471
7)(0
.535
6)(0
.538
6)(0
.540
5)(0
.541
5)G
enre
stu
dies
–0.0
620
–0.1
841
0.48
53–0
.206
10.
5063
0.46
91(0
.521
3)(0
.524
0)(0
.503
2)(0
.539
9)(0
.650
2)(0
.651
3)E
DR
P1.
2707
1.29
011.
1707
1.18
231.
1856
1.56
99(0
.356
1)**
(0.3
562)
**(0
.394
1)* *
(0.3
940)
**(0
.394
4)**
(0.4
919)
**Su
mm
er s
essi
on1.
5888
1.58
941.
5245
1.49
371.
5007
2.02
17(0
.379
2)**
(0.3
791)
**(0
.410
1)* *
(0.4
100)
**(0
.412
0)**
(0.5
066)
**In
ters
essi
on0.
8128
0.83
730.
5105
0.56
100.
5674
0.48
35(0
.569
7)(0
.569
8)(0
.615
9)(0
.615
9)(0
.618
2)(0
.619
9)A
vera
ge y
ears
exp
erie
nce
of p
eer
coac
h–0
.014
4–0
.013
2–0
.012
9–0
.014
6–0
.013
5–0
.013
1(0
.015
0)(0
.015
0)(0
.016
2)(0
.016
2)(0
.016
3)(0
.016
3)Pe
er c
oach
as
% o
f enr
ollm
ent
1.48
2.16
1.96
3.05
3.31
3.08
(0.0
260)
(0.0
262)
(0.0
307)
(0.0
311)
(0.0
370)
(0.0
370)
125

Tab
le B
.2 (
cont
inue
d)
Mod
el i
Mod
el ii
Mod
el ii
iM
odel
ivM
odel
vM
odel
vi
Peer
coa
ch a
ppre
ntic
e as
% o
f enr
ollm
ent
–5.0
4(0
.030
2)–5
.44
(0.0
302)
–8.0
4(0
.039
1)*
–8.4
3(0
.039
3)*
–9.1
3(0
.039
7)*
–9.0
5(0
.039
7)*
Blu
epri
nt r
eten
tion
–6.0
351
–6.0
900
–3.0
670
–3.1
252
–2.9
476
–2.7
516
(2.6
309)
*(2
.630
8)*
(2.8
736)
(2.8
729)
(2.9
439)
(2.9
470)
Inte
ract
ions
of B
luep
rint
Var
iabl
es w
ith
Tea
cher
Cha
ract
eris
tics
Gen
re s
tudi
es a
nd 0
–2 y
ears
teac
her
expe
rien
ce–1
.253
0–1
.282
2(0
.721
7)(0
.721
9)G
enre
stu
dies
and
3–5
yea
rs te
ache
r ex
peri
ence
–0.4
174
–0.4
088
(0.3
009)
(0.3
010)
Gen
re s
tudi
es a
nd 6
–9 y
ears
teac
her
expe
rien
ce–0
.137
7–0
.138
7(0
.135
5)(0
.135
6)Li
tera
cy b
lock
and
0–2
yea
rs te
ache
r ex
peri
ence
0.07
750.
2947
(0.4
711)
(0.4
798)
Lite
racy
blo
ck a
nd 3
–5 y
ears
teac
her
expe
rien
ce–0
.016
60.
0452
(0.1
968)
(0.2
035)
Lite
racy
blo
ck a
nd 6
–9 y
ears
teac
her
expe
rien
ce–0
.149
1–0
.124
5(0
.121
6)(0
.125
1)Li
tera
cy c
ore
and
0–2
year
s te
ache
r ex
peri
ence
3.51
454.
2534
(4.4
996)
(4.5
117)
Lite
racy
cor
e an
d 3–
5 ye
ars
teac
her
expe
rien
ce–0
.955
4–0
.776
0(1
.755
4)(1
.764
8)Li
tera
cy c
ore
and
6–9
year
s te
ache
r ex
peri
ence
–0.4
897
–0.4
224
(0.8
530)
(0.8
576)
126

Tab
le B
.2 (
cont
inue
d)
Mod
el i
Mod
el ii
Mod
el ii
iM
odel
ivM
odel
vM
odel
vi
Peer
coa
ch a
nd 0
–2 y
ears
teac
her
expe
rien
ce0.
0531
0.05
23(0
.062
6)(0
.062
7)Pe
er c
oach
and
3–5
yea
rs te
ache
r ex
peri
ence
–0.0
714
–0.0
694
(0.0
732)
(0.0
736)
Peer
coa
ch a
nd 6
–9 y
ears
teac
her
expe
rien
ce–0
.022
2–0
.020
9(0
.076
2)(0
.076
2)E
DR
P an
d 0–
2 ye
ars
teac
her
expe
rien
ce–0
.092
4(0
.652
4)E
DR
P an
d 3–
5 ye
ars
teac
her
expe
rien
ce–0
.210
8(0
.206
6)E
DR
P an
d 6–
9 ye
ars
teac
her
expe
rien
ce–0
.135
9(0
.108
5)Su
mm
er s
choo
l and
0–2
yea
rs te
ache
r ex
peri
ence
–1.2
463
(0.5
507)
*Su
mm
er s
choo
l and
3–5
yea
rs te
ache
r ex
peri
ence
–0.1
814
(0.2
181)
Sum
mer
sch
ool a
nd 6
–9 y
ears
teac
her
expe
rien
ce–0
.078
3(0
.125
8)N
umbe
r of
obs
erva
tion
s60
,151
60,1
5152
,614
52,6
1452
,614
52,6
14R
–squ
ared
0.70
0.70
0.70
0.70
0.70
0.70
NO
TE
S: F
or a
list
of o
ther
reg
ress
ors
in th
e m
odel
s, s
ee T
able
s 4.
1 an
d 4.
2 an
d th
e di
scus
sion
in C
hapt
er 4
of t
he a
ddit
iona
l con
trol
s at
the
mid
dle
and
high
sch
ool l
evel
s fo
r te
ache
rs’ s
ubje
ct a
utho
riza
tion
and
the
num
ber
of E
nglis
h co
urse
s ta
ken
by e
ach
stud
ent.
At t
he m
iddl
e sc
hool
and
high
sch
ool l
evel
s, te
ache
r an
d cl
assr
oom
cha
ract
eris
tics
ref
er to
the
Eng
lish
clas
sroo
m.
Eac
h co
lum
n re
pres
ents
rea
ding
sco
res,
usi
ng s
choo
l and
stud
ent f
ixed
-eff
ects
mod
els.
Pee
r co
ache
s an
d ap
pren
tice
coa
ches
as
a pe
rcen
tage
of e
nrol
lmen
t are
mul
tipl
ied
by 1
00.
Stan
dard
err
ors
are
inpa
rent
hese
s.*S
igni
fican
t at 5
per
cent
.**
Sign
ifica
nt a
t 1 p
erce
nt.
127

Tab
le B
.3
Reg
ress
ion
Res
ults
for
Hig
h Sc
hool
s
Mod
el i
Mod
el ii
Mod
el ii
iM
odel
ivM
odel
vM
odel
vi
Cla
ss s
ize
No
Yes
No
Yes
Yes
Yes
Tea
cher
Qua
lific
atio
nsN
oN
oY
esY
esY
esY
esIn
tera
ctio
ns1:
blo
ck, c
ore,
pee
r co
ach
No
No
No
No
Yes
Yes
Inte
ract
ions
2: E
DR
P, s
umm
erN
oN
oN
oN
oN
oY
esLi
tera
cy b
lock
–1.1
758
–1.2
624
–1.1
147
–1.2
039
–1.3
433
–1.4
280
(0.4
025)
**(0
.404
3)**
(0.4
074)
**(0
.409
4)**
(0.5
085)
**(0
.510
1)**
Lite
racy
cor
e–0
.945
5–1
.034
9–0
.923
1–1
.015
4–0
.253
6–0
.567
8(1
.109
2)(1
.109
8)(1
.114
9)(1
.115
6)(1
.683
3)(1
.693
2)Li
tera
cy b
lock
/cor
e fo
r E
L st
uden
ts–4
.246
2–4
.225
4–4
.136
6–4
.125
2–4
.051
3–4
.038
4(0
.638
6)**
(0.6
386)
**(0
.644
0)**
(0.6
440)
**(0
.645
1)**
(0.6
452)
**Su
mm
er s
essi
on1.
9009
1.89
281.
7627
1.75
481.
7657
2.62
05(0
.574
8)**
(0.5
747)
**(0
.576
4)**
(0.5
764)
**(0
.577
5)**
(0.7
684)
**A
vera
ge y
ears
exp
erie
nce
of p
eer
coac
h–0
.008
4–0
.003
4–0
.002
30.
0011
0.00
350.
0034
(0.0
216)
(0.0
217)
(0.0
223)
(0.0
224)
(0.0
224)
(0.0
224)
Peer
coa
ch a
s %
of e
nrol
lmen
t–1
4.30
–15.
43–1
6.28
–16.
73–2
1.03
–20.
79(0
.075
1)(0
.075
3)*
(0.0
779)
*(0
.077
9)*
(0.0
844)
*(0
.084
4)*
Peer
coa
ch a
ppre
ntic
e as
% o
f enr
ollm
ent
8.21
8.52
7.24
7.20
7.07
6.95
(0.0
474)
(0.0
474)
(0.0
489)
(0.0
489)
(0.0
491)
(0.0
492)
128

Tab
le B
.3 (
cont
inue
d)
Mod
el i
Mod
el ii
Mod
el ii
iM
odel
ivM
odel
vM
odel
vi
Inte
ract
ions
of B
luep
rint
Var
iabl
es w
ith
Tea
cher
Cha
ract
eris
tics
Lite
racy
blo
ck a
nd 0
–2 y
ears
teac
her
expe
rien
ce0.
7359
0.86
06(0
.528
8)(0
.531
9)Li
tera
cy b
lock
and
3–5
yea
rs te
ache
r ex
peri
ence
–0.1
715
–0.1
522
(0.2
325)
(0.2
345)
Lite
racy
blo
ck a
nd 6
–9 y
ears
teac
her
expe
rien
ce0.
0197
0.02
52(0
.119
3)(0
.119
9)Li
tera
cy c
ore
and
0–2
year
s te
ache
r ex
peri
ence
–0.9
834
–0.4
718
(1.4
517)
(1.4
712)
Lite
racy
cor
e an
d 3–
5 ye
ars
teac
her
expe
rien
ce–0
.659
7–0
.534
9(0
.794
3)(0
.802
5)Li
tera
cy c
ore
and
6–9
year
s te
ache
r ex
peri
ence
0.30
910.
3472
(0.4
902)
(0.4
974)
Peer
coa
ch a
nd 0
–2 y
ears
teac
her
expe
rien
ce0.
1493
0.15
23(0
.081
3)(0
.081
3)Pe
er c
oach
and
3–5
yea
rs te
ache
r ex
peri
ence
0.07
780.
0798
(0.1
117)
(0.1
118)
Peer
coa
ch a
nd 6
–9 y
ears
teac
her
expe
rien
ce–0
.023
7–0
.022
6(0
.107
4)(0
.107
5)Su
mm
er s
choo
l and
0–2
yea
rs te
ache
r ex
peri
ence
–1.8
624
(0.8
506)
*
129

Tab
le B
.3 (
cont
inue
d)
Mod
el i
Mod
el ii
Mod
el ii
iM
odel
ivM
odel
vM
odel
vi
Sum
mer
sch
ool a
nd 3
–5 y
ears
teac
her
expe
rien
ce–0
.305
7(0
.449
1)Su
mm
er s
choo
l and
6–9
yea
rs te
ache
r ex
peri
ence
–0.0
508
(0.2
603)
Num
ber
of o
bser
vati
ons
50,6
7750
,677
50,6
7750
,677
50,6
7750
,677
R–s
quar
ed0.
650.
650.
650.
650.
650.
65
NO
TE
S: F
or a
list
of o
ther
reg
ress
ors
in th
e m
odel
s, s
ee T
able
s 4.
1 an
d 4.
2 an
d th
e di
scus
sion
in C
hapt
er 4
of t
he a
ddit
iona
l con
trol
sat
the
mid
dle
and
high
sch
ool l
evel
s fo
r te
ache
rs’ s
ubje
ct a
utho
riza
tion
and
the
num
ber
of E
nglis
h co
urse
s ta
ken
by e
ach
stud
ent.
At t
hem
iddl
e sc
hool
and
hig
h sc
hool
leve
ls, t
each
er a
nd c
lass
room
cha
ract
eris
tics
ref
er to
the
Eng
lish
clas
sroo
m.
Eac
h co
lum
n re
pres
ents
rea
ding
scor
es, u
sing
sch
ool a
nd s
tude
nt fi
xed-
effe
cts
mod
els.
Pee
r co
ache
s an
d ap
pren
tice
coa
ches
as
a pe
rcen
tage
of e
nrol
lmen
t are
mul
tipl
ied
by10
0. S
tand
ard
erro
rs a
re in
par
enth
eses
*Sig
nific
ant a
t 5 p
erce
nt.
**Si
gnifi
cant
at 1
per
cent
.
130

131
References
American Institutes for Research, Evaluation of the Blueprint for StudentSuccess in a Standards-Based System, Palo Alto, California, 2002.
Betts, Julian R., and Anne Danenberg, “An Assessment of Resources andStudent Achievement,” in Jon Sonstelie and Peter Richardson (eds.),School Finance and California’s Master Plan for Education, PublicPolicy Institute of California, San Francisco, California, pp. 47–79,2001.
Betts, Julian R., Kim S. Rueben, and Anne Danenberg, Equal Resources,Equal Outcomes? The Distribution of School Resources and StudentAchievement in California, Public Policy Institute of California, SanFrancisco, California, 2000.
Betts, Julian R., Andrew C. Zau, and Lorien A. Rice, Determinants ofStudent Achievement: New Evidence from San Diego, Public PolicyInstitute of California, San Francisco, California, 2003.
Bohrnstedt, George W., and Brian M. Stecher (eds.), Class Size Reductionin California: Early Evaluation Findings, 1996–1998, CSR ResearchConsortium, Year 1 Evaluation Report, American Institutes forResearch, Palo Alto, California, 1999.
Bohrnstedt, George W., and Brian M. Stecher (eds.), Class Size Reductionin California: Findings from 1999–00 and 2000–01, CaliforniaDepartment of Education, Sacramento, California, 2002.
Clinton, William J., 1998 State of the Union Address, January 27, 1998,downloaded from http://www.washingtonpost.com/wp-srv/politics/special/states/docs/sou98.htm.
Coleman, James S., Equality of Educational Opportunity, GovernmentPrinting Office, Washington, D.C., 1966.
CSR Research Consortium, Class Size Reduction in California 1996–98:Early Findings Signal Promise and Concerns, American Institutes forResearch, Palo Alto, California, 1999.

132
CSR Research Consortium, Class Size Reduction in California: The1998–99 Evaluation Findings, American Institutes for Research, PaloAlto, California, 2000.
Cuban, Larry, and Michael Usdan, “Fast and Top-Down: SystemicReform and Student Achievement in San Diego City Schools,” inLarry Cuban and Michael Usdan (eds.), Powerful Reforms withShallow Roots: Improving America’s Urban Schools, Teachers CollegePress, New York, 2003a, pp. 77–95.
Cuban, Larry, and Michael Usdan (eds.), Powerful Reforms with ShallowRoots: Improving America’s Urban Schools, Teachers College Press,New York, 2003b.
Gootman, Elissa, “Fewer New York Schools Are Cited for PoorPerformance,” New York Times, January 5, 2005, p. A23.
Hanushek, Eric A., “School Resources and Student Performance,” inGary Burtless (ed.), Does Money Matter? The Effect of School Resourceson Student Achievement and Adult Success, Brookings Institution,Washington, D.C., 1996, pp. 43–73.
Hess, Frederick M. (ed.), Urban School Reform: Lessons from San Diego,Harvard Education Press, Cambridge, Massachusetts, 2005.
Hightower, Amy M., “San Diego’s Big Boom: Systemic InstructionalChange in the Central Office and Schools,” in Amy M. Hightower,Michael S. Knapp, Julie A. Marsh, and Milbrey W. McLaughlin(eds.), School Districts and Instructional Renewal, Teachers CollegePress, New York, 2002, pp. 76–93.
Jencks, Christopher, and Meredith Phillips (eds.), The Black-White TestScore Gap, Brookings Institution Press, Washington, D.C., 1998.
Jepsen, Christopher, and Steven Rivkin, Class Size Reduction, TeacherQuality, and Academic Achievement in California Public ElementarySchools, Public Policy Institute of California, San Francisco,California, 2002.
McGee, Maureen, “School Reforms Receive Grant Support,” San DiegoUnion Tribune, November 6, 2001.
The National Commission on Excellence in Education, A Nation AtRisk: The Imperative for Educational Reform, Washington, D.C.,1983.

133
Ochoa, Alberto, Op-ed in the San Diego Union Tribune, October 26,2001a.
Ochoa, Alberto, letter to SDUSD Board Members on behalf of the SanDiego County Latino Coalition of Education, October 9, 2001b.
Price, Hugh B., and Cecil H. Steppe, “The Achievement Gap IsClosing,” San Diego Union Tribune, October 25, 2002, p. B7.
Quick, Heather E., Beatrice F. Birman, Lawrence P. Gallagher, JeanWolman, Kassandra Chaney, and Hiroyuki Hikawa, Evaluation of theBlueprint for Student Success in a Standards-Based System, Year 2Interim Report, American Institutes for Research, Palo Alto,California, 2003.
Sonstelie, Jon, Eric Brunner, and Kenneth Ardon, For Better or ForWorse? School Finance Reform in California, Public Policy Institute ofCalifornia, San Francisco, California, 2000.
Stein, Mary Kay, Lea Hubbard, and Hugh Mehan, “Reform Ideas ThatTravel Far Afield: The Two Cultures of Reform in New York City’sDistrict #2 and San Diego,” Journal of Educational Change, Vol. 5,No. 2, June 2004, pp. 161–197.


135
About the Authors
JULIAN R. BETTS
Julian R. Betts is a senior fellow at the Public Policy Institute ofCalifornia and a professor of economics at the University of California,San Diego. Much of his research has focused on the economic analysis ofpublic schools. He has written extensively on the link between studentoutcomes and measures of school spending, including class size andteacher qualifications. He has also studied the role that standards andexpectations play in student achievement. He is serving or has served onnumerous U.S. Department of Education technical review and grantadjudication committees, two National Research Council committees, TheNational Working Commission on Choice in K–12 Education, and thenational advisory boards of both the Center for Research on EducationOutcomes at Stanford University and the National Charter SchoolResearch Center at the University of Washington. He holds a Ph.D. ineconomics from Queen’s University and the M.Phil. in economics fromOxford University.
ANDREW C. ZAU
Andrew C. Zau is a senior statistician in the Department ofEconomics at the University of California, San Diego. Previously, hewas a research associate at PPIC. His current research focuses on thedeterminants of student achievement in the San Diego Unified SchoolDistrict. Before joining PPIC, he was an SAS programmer and researchassistant at the Naval Health Research Center in San Diego, where heinvestigated the health consequences of military service during OperationsDesert Shield and Desert Storm. He holds a B.S. in bioengineering fromthe University of California, San Diego, and an M.P.H. in epidemiologyfrom San Diego State University.
KEVIN KING
Kevin King is a doctoral candidate in the Department of Economicsat the University of California, San Diego. Previously, he worked for theBoard of Governors of the Federal Reserve as a research assistant. He holdsa B.A. in economics from the University of Virginia and an M.A. andC. Phil. in economics from the University of California, San Diego.


137
Related PPIC Publications
Equal Resources, Equal Outcomes? The Distribution of School Resources andStudent Achievement in CaliforniaJulian R. Betts, Kim S. Rueben, and Anne Danenberg
Determinants of Student Achievment: New Evidence from San DiegoJulian R. Betts, Andrew C. Zau, and Lorien A. Rice
Class Size Reduction, Teacher Quality, and Academic Achievement inCalifornia Public Elementary SchoolsChristopher Jepsen and Steven Rivkin
School Finance and California’s Master Plan for EducationJon Sonstelie and Peter Richardson (editors)
PPIC publications may be ordered by phone or from our website(800) 232-5343 [mainland U.S.]
(415) 291-4400 [outside mainland U.S.]www.ppic.org
