friction and hair dynamics - · pdf filefriction and hair dynamics ... the basic equation ......
TRANSCRIPT


Playability study of a bowed string physicalmodel including finite-width thermalfriction and hair dynamics
MSc Modelling for Science and Engineering
Quim Llimona Torras
Master Thesis / 2015
THESIS ADVISORSEsteban Maestre, Susana SernaDepartament de Matemàtiques
ii

ABSTRACT
In this work, we present a playability study of a state-of-the-art bowed stringcomputational model that includes finite-width thermal friction and hair dynamics,primarily targeted at sound synthesis. The concept of playability itself is controver-sial; it can be loosely defined as how large (and physically feasible) is the regionof the possible input controls (namely bow force, bow-bridge distance, and bowvelocity) to the instrument that result in good-sounding vibration regimes. Thereare numerous studies on the qualitative analysis of vibration regime distributionover different variants of the model, but here we aim at taking a more quantitativeapproach so that it is possible to compute a functional playability over modelparameter ranges. We introduce an algorithm for automatic detection and classi-fication of vibration regimes based on studying the periodicity of the simulatedstring velocity under the bow. Based on such automatic classification, we proposea scalar playability descriptor computed as the portion of the input control spacethat leads to each of the vibration regimes into consideration. Some preliminaryresults are presented by sweeping a range of thermal-related parameters, whichdisplay a clear region of easily-achievable Helmholtz regime. Other promisingresults related to patterns on the distribution of anomalous low frequency vibrationregimes over input control space are also presented, opening ground for furtherinvestigations.
iii


Contents
ABSTRACT iii
Index of figures viii
1 INTRODUCTION 11.1 On physically-informed sound synthesis . . . . . . . . . . . . . . 11.2 Statement of purpose . . . . . . . . . . . . . . . . . . . . . . . . 3
2 BACKGROUND ON BOWED STRING INSTRUMENTS 52.1 Mathematical and computer representations of sound . . . . . . . 62.2 Musical instruments: the bowed string . . . . . . . . . . . . . . . 7
2.2.1 The wave equation as a string vibration model . . . . . . . 82.2.2 Physical models of the bow-string interaction . . . . . . . 112.2.3 Model used in the experiments . . . . . . . . . . . . . . . 12
2.3 The concept of playability in bowed string instruments . . . . . . 142.3.1 The acoustic, control, and parameter spaces . . . . . . . . 142.3.2 Spatial mappings . . . . . . . . . . . . . . . . . . . . . . 152.3.3 What is playability? . . . . . . . . . . . . . . . . . . . . 16
3 REGIME ESTIMATION AND PLAYABILITY SCORING 193.1 String regime estimation . . . . . . . . . . . . . . . . . . . . . . 193.2 Playability measures . . . . . . . . . . . . . . . . . . . . . . . . 23
4 COMPUTED SCHELLENG DIAGRAMS AND PLAYABILITY MAPS27
4.1 High-resolution regime maps . . . . . . . . . . . . . . . . . . . . 274.2 Playability . . . . . . . . . . . . . . . . . . . . . . . . . . . . . . 31
v

5 OUTLOOK 33
Bibliography 35
vi

List of Figures
2.1 Sketch of the temporal evolution of the string profile. . . . . . . . 9
2.2 Temporal evolution of the string point selected for rendering forthe basic equation. . . . . . . . . . . . . . . . . . . . . . . . . . 10
2.3 Overview of the bowed string model used in the simulations, takenfrom Maestre et al. [2014]. . . . . . . . . . . . . . . . . . . . . . 13
2.4 A replica of the original Schelleng diagram, published in Schelleng[1973]. . . . . . . . . . . . . . . . . . . . . . . . . . . . . . . . . 16
3.1 Temporal evolution of the differential string velocity under differ-ent vibration regimes. The top plot corresponds to decaying sound,the middle one to regular Helmholtz motion, and the bottom oneto multiple stick-slip. . . . . . . . . . . . . . . . . . . . . . . . . 21
3.2 Features used for determining the vibration regime. The top plot onthe left side shows the detected regime, with white being Schelleng,black being decaying, light gray aperiodic, gray ALF, and darkgrey multiple stick-slip. The top right plot shows the detectedaperiodicity of the signal in logarithmic scale for better contrast,the bottom left plot shows the mean energy, and the bottom rightplot shows the detected fundamental frequency. The model wasplayed at a bowing velocity of 0.2 m/s on its G string, with anexpected fundamental frequency of 196 Hz. . . . . . . . . . . . . 22
3.3 Computed Schelleng diagram for the model with two different“warm” coefficients. Different colors indicate different regimes;green means Helmholtz motion, blue means aperiodic, purplemeans ALF, orange means multiple stick-slip, and red means de-caying. . . . . . . . . . . . . . . . . . . . . . . . . . . . . . . . 24
vii

4.1 High-resolution rendering of the Schelleng diagram, focused onthe raucous region. The pitch detector has been configured todetect very low pitches. White indicated Helmholtz motion, lightgrey aperiodic motion, dark grey anomalous low frequencies, andblack other artifacts such as multiple stick-slip. . . . . . . . . . . 29
4.2 3D Schelleng diagram displaying how the regime distribution onthe force vs bow-bridge distance plane varies according to velocity.Axes do not indicate the actual units, but just the simulation index. 30
4.3 Functional playability of the model, depending on how quickly thebow hair heats up during friction. . . . . . . . . . . . . . . . . . . 31
4.4 Two-dimensional functional playability map, displaying the regimedistribution on the Schelleng diagram for differentand cool, hori-zontal axis (how quickly the hair cools), and warm, vertical axis(how quickly the bow hair heats up with friction) model param-eters. The units have been reduced two orders of magnitude forbetter display. The color intensity represents the percentage of theselected Schelleng diagram that each of the regimes covers. . . . . 32
viii

Chapter 1
INTRODUCTION
1.1 On physically-informed sound synthesis
Music has always depended on technology - even cavemen used their tools to buildpercussion instruments that could accompany their chants. It is no wonder, then,that as soon as computers appeared people started thinking about how to makemusic with them. At the beginning of the computer era, computational constraintsenforced the used of fairly basic synthesis methods, such as wavetable lookup.Frequency Modulation synthesis was a great breakthrough because of the greatrange of timbres it gave for such an algorithmically simple method, thanks to itsnon-linearities.
Nowadays, the great compuational capabilities that even handheld devices suchas smartphones offer allow real-time physically-based synthesis, that is, synthesisbased on numerically solving mathematical models of how real instruments behave.As computing power grows and research on such methods advances, more and morerefined methods become available, aiming always at what many argue impossible- to trick a musician into thinking a fully synthetic sound is actually the result ofrecording an acoustic instrument.
In the meanwhile, the community has developed numerous artistic applications ofsuch methods, such as the synthesis of sounds physically impossible to produce atreasonable costs (i.e. without breaking the instrument), or the synthesis of an entiresymphonic orchestra (where individual detail is no that notiecable, especially whenall musicians play in a tutti) at a minimum expense.
1

Physically-informed sound synthesis has been very closely related to research onorganology and musical acoustics, that is, on the physical foundations behind thesound producing mechanisms of musical instruments. Not only the synthesizersare based on equations that acousticians derived, but the numerical models areenabling more and more the validation of theoretical or experimental findingsand actually contributing to science themselves. State-of-the-art physical modelsof instruments have such a detail that allow generating sounds with a physicallyunfeasible degree of control. This can lead to novel discoveries of the innerworkings of musical instruments at a microscale, and these findings can be latelycorroborated through extensive (and expensive) experiments involving purposely-built mechanical instrument players such as described in Schoonderwaldt et al.[2008], and viceversa.
These findings greatly contribute to our understanding of how musical instrumentswork, and can be later applied to a range of fields, such as instrument making andmanufacturing (is it possible to optimize current instruments? To what extent canwe predict how good an instrument is before playing it?) or pedagogy (how can astudent choose a violin best suited to her needs?).
While explicitely not trying to modify or improve our physically-based bowedstring synthesiser of choice, in this project we aim at exploring how it respondsto different inputs and at discovering the possibilities that such a state-of-the-artartifact can offer. In plain words, we want to know what does it do when it isplayed.
2

1.2 Statement of purpose
The main goal of this project is to explore novel ways of determining the playabilityof a physical model of a bowed string instrument such as the violin. Althoughmodels (and implementations of those) that are computationally efficient enoughto apply our analysis methods while being physically accurate are scarce, ourobjective is not to score the model itself but to compare different configurations ofit.
In particular, our objectives are:
• To devise a method for efficiently and accurately determining under whichvibration regime the model is.• To build vibration regime maps that show how a specific configuration of the
model reacts to different gestural inputs.• To define exploratory playability descriptors based on such maps, that allow
easier comparation of different configuration layouts.• To present preliminary playability maps on a defined range over specific
configuration parameters.
This report is structured as follows: after a brief context on sound, bowed strings,and the concept of playability, the method for estimating the vibration regime ofa particular state of our model is presented, followed by some proposed compu-tational indicators of playability. The results we obtained with these methods arepresented afterwards, including well-known diagrams of unprecedented resolu-tion that arise new, interesting questions. Finally, the main contributions of thisthesis (both on playability and on generic understanding of the bowed string) aresummarized.
3

Chapter 2
BACKGROUND ON BOWEDSTRING INSTRUMENTS
Given the nature of the field where this thesis is being presented, we deemed it ap-propiate to give a short introduction on what is sound, how do musical instrumentsproduce it, and how can we represent it through mathematical formulations. It isvery difficult to summarize an entire field in such as short space, but references areprovided along the way for those interested.
This chapter is structured as follows: first, the basic principles of sound are pre-sented, together with a rationale on how to treat it and a few notes on how musicalinstruments work from a conceptual point of view. Then, we pay more attentionto string instruments, and in particular to free string vibration first and secondlyto bowed strings, together with an outlook of how to model them efficiently asphysical systems. Finally, we define the concept of playability, introducing somewell-known diagrams and concepts that help explain how bowed string instrumentssuch as the violin work.
5

2.1 Mathematical and computer representations ofsound
Sound is a very complex phenomenon at the perceptual and cognitive levels, butbased on a relatively simple physical event: the perturbation of air molleculescausing local deviations in air pressure, which moves a membrane located insideour ear and transmits this movement to the sensory system. Within the range ofaudible while non-damaging sound, perturbations on the fabric of air follow thewave equation; therefore, the perturbations expand in all directions, travelling andbecoming locally fainter. Some may argue there is also an energy loss due tofriction, but we can safely ignore this for now.
The way we perceive these perturbations is through oscillations; this is natural,since many of the air perturbations we are interested in perceiving (i.e. thoseresulting from something moving) will be of an oscillatory nature due to theelasticity or stiffness of objects. Therefore, when talking about a sonic event one ismainly interested in the spectral components of it: which oscillation frequenciesare present, and at which intensity.
Ignoring now that we have two ears and therefore binaural hearing, a person hearinga sound can be modelled through a one-dimensional, time-dependent variable thatindicates fluctuations around the mean air pressure at a particular point in spaceinside their ear. It is better, however, to think of this signal as the fluctuations asource (such as a speaker) adds to the environtment; then, these effects can beconsidered linear and therefore just additive. In the case of the listener wearingheadphones, the two models can be considered equivalent; this is what we will beassuming, because although the propagation of sound through space by itself doesnot add much to the question (just linear attenuation), very complex phenomenaarise when the sonic waves bounce off walls or in the ear pavement.
Moreover, the room where the acoustic event takes place further modifies thesound; its walls act as boundaries for the wave equation, and the wavefrontsare reflected back. This creates both resonance modes, that emphatize certainfrequential components of the sound, and reverberation, which plays a key role inmusic through softening note transitions. The reader is refeered to Kuttruff [2009]for a complete guide on room acoustics, where these effects are discussed in depth.
For further reading on musical acoustics, please refer to Benade [1990].
6

2.2 Musical instruments: the bowed string
Most musical instruments can be accurately described through the following frame-work:
• Excitation source: a device that makes use of a certain physical phenomenato generate a complex oscillation pattern at a certain rate using an inputenergy.• Radiator: a device that is mechanically attached to the excitation source, and
transmits the vibration to the air through a coupling device such as a plate.
While radiators can be represented safely and linearly through a convolution with akernel, excitation sources require more advanced techniques, and their modellingusing PDE’s that reflect how the underlying phyisical system works is an area ofactive research. In the case of string instruments such as the violin, the string actsas an excitation source; its tension propagates perturbations as waves, and its quiterigid ends reflect the perturbations giving rise to periodic oscillations. The stringtransmits these perturbations to the bridge, which is connected to the body, ourradiator. The body acts as an impedance adapter from the very narrow vibration ofthe string powerful enough to move such as big mass to the big plates of the violinthat can move a bigger volume of air. Notice that while in plucked strings such asthe guitar the string is given an initial excitation and then let resonate, in bowedstrings there is a continued flow of energy, giving rise to self-sustained oscillations.
In this project, we will use a non-linear model for the excitation source, the stringitself, coupled through one of its ends to a bridge modelled through a linearadmittance filter measured experimentally and implemented as a battery of two-pole resonators. Further details about the model will be given throughout thechapter, and can be found in Maestre et al. [2014].
The solution function u of our equations represents the transversal velocity of thestring at time t and position x, with x being a scalar that indicates distance fromthe origin. Notice that strings can have transversal waves in two dimensions orpolarizations, horizontal and vertical; they are usually simulated independentlyand interact at the boundaries, but we will for now assume that we only simulatethe horizontal polarization, the one that follows the bowing (or plucking) direction.The solution will be defined within the domain x ∈ [0, L], where L is the length ofthe string. The boundaries of such domain can for now be fixed to 0, that is, the
7

string is “glued” at the terminations and cannot move; this, as we will see, willcause waves to reflect back inverted. Notice that, as the model gets perfected, theseboundaries will have additional conditions on the derivatives of u, representingthe damping caused by the string stopper not being ideal (especially in the case offingers) and introducing an energy loss, or the boundary not being fixed but slightlyfree and coupled with the movement of other strings on the instrument.
2.2.1 The wave equation as a string vibration model
A very basic model for the behaviour of a tense string is the 1D wave equation:
uxx = c2utt
As shown by D’Alembert in the XVIII century, this equation has as a generalsolution that consists of two fronts propagating the initial excitation in oppositedirections (travelling waves) and at speed v, that is:
u(x, t) = F (x− ct) + G(x + ct)
However, when a fixed (Dirichlet) boundary is added to both ends of the string, thewaves reflect back with reversed sign. It can be shown that this originates standingwaves on the string, or longitudinal oscillations that do not propagate in space.A very rough intuition about why this happens is that the two travelling waves“cancel out” after bouncing.
The propagation speed, together with the string length L, define the oscillationfrequency, which has the perceptual equivalent of pitch (in plain terms, which noteis being played); notice that the effective length is actually double, because for afull cycle to complete the wave needs to travel back and forth across the wholestring:
f0 = c/2L
When tuning a string, it is useful to select the desired frequency of oscillation giventhe string length, although we will refer to c in this report for simplicity:
8

u(x, t) = F
(x− f0
2Lt
)+ G
(x +
f02L
t
)
This general solution to the equation allows solving it without requiring expensiveschemes such as the finite difference method; one simply needs to calculate thedisplacement during the time step (that is, c∆t), and make whatever memoryarrangements are required. In the 1D case, this can be achieved with a computa-tionally cheap delay line, which even allows interpolation in case the displacementis not an even number of samples. This method is known as Digital Waveguides.
Such an equation has a very fundamental issue: once excited, the oscillation on thestring is stationary and does not decay. This is completely unnatural, since it wouldcorrespond to a note that never ends! However, it serves its purpose on showinghow a string can oscillate given a once-only initial energy input.
0 0.05 0.1 0.15 0.2 0.25 0.3 0.35 0.4 0.45 0.5
−1
−0.5
0
0.5
1
x
u(x
, t*
)
Figure 2.1: Sketch of the temporal evolution of the string profile.
The reason why real strings have a deacaying oscillation are losses mainly due todamping at the string ends, friction, and internal dispersion. They all contribute touniform damping and to frequency-related damping, more related to higher orderderivatives. However, they can all be modelled through linear and time-invariantdigital filters (i.e. through a convolution with a specifically designed response).Thanks to the commutativity of these filters, it is possible to group (lump) them allin a single point, usually at the end of the string or at the reading point, and applyall the losses through a single convolution.
9

0 0.005 0.01 0.015 0.02 0.025 0.03 0.035 0.04 0.045 0.05
−1
−0.5
0
0.5
1
t
u(x
r, t)
Figure 2.2: Temporal evolution of the string point selected for rendering for thebasic equation.
For a more extensive but plain introduction to Digital Waveguide modelling, seeSmith [1992].
The methods presented until now model the movement of the string itelf, but arenot enough to produce musically pleasant sound. Real string instruments get all thecolor and tone from the resonance of their bodies, often made of wood. Moreover,some reverberation due to reflections on the walls of the hall or room usuallyneeds to be added. Adding reverberation is usually accomplished by convolvingthe output signal with a measured impulse response from a concert or throughspecifically designed digital filters consisting mainly of delays and all-pass filters,but adding body resonance can be more complicated.
Although body resonance is often implemented using digital filters as well - asit physically consists on the superposition of selectively attenuated and delayedcopies of the signal that bounce back and forth inside the body -, the tricky partis to know the desired response and therefore the coefficients to use. One of themost successful approaches - and the one we will be using - is based on measuringthe admittance of the body at the bridge, which is where energy from the stringvibration is transmitted to the body. This admittance, which is the impulse responseof the bridge velocity as a response to a Dirichlet’s delta excitation, is then fitted toa battery of parallel two-pole scalar resonating filters, each of them representingone of the modes of vibration of the body - hence its name, a modal approachMaestre et al. [2013]. However, this technique does not model how the instrumentradiates sound to the outside world; it provides an output similar to that of apiezoelectric sensor mounted in the bridge, as it is usually done when amplifyingbowed string instruments - especially in contemporary or jazz music traditions. Inorder to get an output closer to what a microphone would capture, further filteringis needed, although designing a filter by hand is usually enough to get pleasing
10

results. For a review of other body modeling techniques, see Karjalainen and Smith[1996].
Another source of damping mentioned before, the string ends, is modelled directlyusing hand-crafted low-pass filters. Although getting a realistic synthetic note iseasy with this technique, it is very difficult to model the dynamics of this filteras the amount of damping varies greatly when what stops the string is a fingerrather than the fingerboard end. Depending on the pressure and tilt of the finger, itcan range from almost the same as the fingerboard end (very resonant) to a highlydamped sound - and musicians use this fact a lot during performance (Kinoshitaand Obata [2009]).
Shortly after Digital Waveguide methods appeared, a technique known as commutedsynthesis became popular, which consisted in taking advantage of the fact that boththe resonance of the instrument body and the room can be modelled as linear filters,and therefore could be actually convolved with the excitation signal before actuallyrunning the synthesis itself. Even more advanced methods that require non-linearinteractions, such as bowed strings, can partially benefit from this approach bycomputing most of the linear elements together (Smith [1997]).
2.2.2 Physical models of the bow-string interaction
While plucked string instruments, such as the guitar or the violin when playingpizzicato, can be implemented with what has been described until now - they onlyrequire an initial excitation -, bowed strings are basically an extension of them witha much more complex energy input mechanism, sometimes described as periodicplucking. The string is basically dragged and released at each vibration cycle bythe bow, therefore getting a continuous input of energy and being able to sustain anote without decay undefinetely; that is why it is called a self-sustained oscillator.This kind of motion was first observed by Helmholtz [1862], and honoring hisname is known as Helmholtz motion.
The first complete model of the bow-string interaction was provided by Raman[1918], and his analysis (performed by hand) already hinted some of the possiblebehaviours of the system. In his model, he assumed that the friction force is aknown non-linear function of the string velocity. Some years later, Friedlander[1953] and Keller [1953] solved the model numerically by imposing a linearcondition on the force-velocity relationship that depends on the past values, foundthrough drawing characterstic lines and bouncing them at the boundaries avoiding
11

crossing the non-linear contact point. By finding the intersection between this lineand the known non-linear function, both the friction force and the string velocitycan be found at each time step.
McIntyre and Woodhouse [1979] later proposed an hysteresis rule to solve ambigu-ous cases of the intersection, together with a dispersive method for introducingcorner rounding. In Woodhouse [2003], the friction coefficients were modulatedaccording to heat, which was propagated with a finite difference scheme, insteadof relying on the contact velocity alone for determining the friction force. Thisavoided having to solve the hysteresis explicitely on the v − f curve. The rosinprogressively warms up during the slipping phase, and it cools progressively duringsticking; therefore, the hysteresis appears naturally. See Smith and Woodhouse[2000] for a discussion on how rosin affects the friction of the system.
Independently, other researchers had already developed models with finite-widthcontact point where the bow-string contact zone was represented as a line of nodes,with each node representing an equivalent hair, although most models exploringnew friction formulations had ignored this fact (Piteroff and Woodhouse [1998]).This finite-width formulation demonstrated for the first time partial slips, where aportion of the bow is already slipping while another is still stuck.
For a complete guide on physically-informed musical instrument synthesis, thereader is referred to Smith [2010]. For further reading on the acoustics of bowedstring instruments, please see Woodhouse and Galluzzo [2004] and Cremer [1984].
A relevant contribution posterior to such reviews is the simulation of the verticalstring polarization (perpendicular to the bowing direction), as described in Mansouret al. [2013].
2.2.3 Model used in the experiments
The model we will be using in this project, described in Maestre et al. [2014],considers two string polarizations: horizontal, parallel to the bowing plane, andvertical, perpendicular to the bowing plane. The friction coefficient is modulatedwith heat along a finite-width contact zone that includes hair dynamics, and usesdigital waveguides for corner propagation. At the bridge, a two-dimensional modalformulation of the admittance is applied to account for body effects as a frequency-dependent reflectance matrix. An overview of the model is provided in Figure2.3.
12

Heat diffusion via FDTDHeat diffusion via FDTDMotivation
To integrate temperature‐dependent (dynamic) friction into aTo integrate temperature‐dependent (dynamic) friction into afinite‐width, multi‐hair bow‐string interaction model.
DW DW + FDTD IIRDWSCALAR IIRIIR
BRIDGE REFLECTANCE
WAVE PROPAGATIONWAVE PROPAGATION BOW‐STRING INTERACTION
DW DW + FDTD IIR FILTER
DW
NUT REFLECTANCE
SCALAR SCATTERING
LOSSLOSS
IIR FILTER
IIR FILTER
REFLECTANCEINTERACTION
TRAVELING WAVE SOLUTION
REFLECTANCE
TRAVELING WAVE SOLUTION + NON‐LINEARITY VIA TEMPERATURE‐DRIVEN FRICTION+ HAIR COMPLIANCE/ELASTICITY via FDTD
INDIVIDUAL (equivalent) HAIR TEMPERATURE
INDIVIDUAL (equivalent) HAIR FRICTION FORCE AND SLIDING VELOCITY
NON‐HOMOGENEOUS (HEAT) DIFFUSSION EQUATION (ALONG THE BOW WIDTH)
Figure 2.3: Overview of the bowed string model used in the simulations, takenfrom Maestre et al. [2014].
Horizontal and vertical transverse waves get coupled at the nut, at the bridge, andat the the finite-width bow-string contact. At the nut, both polarizations interactthrough a 2D reflectance matrix. At the bridge, both polarizations of all four stringsget coupled through a lumped 2D admittance matrix that represents the instrumentbody, and contains complex, frequency-dependent elements.
This body representation is constructed with a modal approach, and is describedin Maestre et al. [2013]. It consists of a battery of two-pole resonators in parallelparametrized by their central frequency, bandwith, and (complex) amplitude. Modefrequencies and bandwidths are first estimated in the frequency domain by solvinga non-convex, constrained optimization problem. Then, mode amplitudes areestimated through semidefinite programming while enforcing passivity. Thisprocedure is repeated for each combination of excitation and response polarizations,therefore providing the 4 elements needed for the admittance matrix.
Bow-string interaction is represented by a line of nodes, each modeling an equiv-alent hair-string contact. Here, bow and string interact in both polarizations:non-linear interaction happens on the horizontal plane, while linear interactionhappens on the vertical plane. Polarization coupling happens through the normalforce exerted by the string on the hair. In between nodes, we use the traveling wavesolution provided by digital waveguides. Interaction in the horizontal plane takesplace through a nonlinear friction characteristic that is solved at each node: thecoefficient of friction is dynamically modulated by temperature changes. Then,hair compliance and elasticity are included in each node with finite differences,
13

leading to a non-linearity that can be solved graphically a la Friedlander. In thevertical plane, each node is represented as a mass-loaded spring-dashpot system.
Temperature at each of the nodes (including lateral nodes without bow contactto allow for diffusion) is increased via the conduction of heat due to the slidingfriction, with the source term of the diffusion expression fed by sliding velocityand normal force. Temperature loss is caused either by convection during sliding,or by diffusion.
The model does not take torsional waves, hair-hair interaction, or finger-stringinteraction into account.
2.3 The concept of playability in bowed string in-struments
Before understanding what playability means and how to measure it, it is importantto give more context about bowed string models from a more functional perspective:beyond the equations, what kind of parameters do they have? How are theycontrolled during the simulation of a performance? Although not formally definedin the literature, we find the division in acoustic, parameter, and control spaces tobe useful for writing about bowed strings and communicating how they work.
2.3.1 The acoustic, control, and parameter spaces
The complex nature of the bow and string mechanism are only enablers of whatmakes the bowed string a great instrument family. Non-linearities present in thesystem, especially in the string-hair interaction, produce very rich and diversesounds. These sounds are not by themselves very complex, as they are justperiodic oscillations, but they can vary greatly as a response to relatively smallchanges in the system state. We will call this range of different sounds, or regimes,that can be produced the acoustic space of the instrument. Since the goal ofplaying is to produce sound, we will also refer to it as the target space. Thisspace can be described by diverse descriptors that represent attributes related tothe spectrum of this oscillatory signal, although it is more convenient to referin which of the possible regimes of oscillation the string is; this regime can bedetermined experimentally through those low-level descriptors; Raman [1918]
14

already provided a list of possible regimes in 1918, deduced entirely by hand withanalytical formulations of a very simplifed model of string vibration.
On the other hand, this interaction is, as we mentioned, very sensitive to changesin the system. These changes can come from two sources: the instrument itself,such as in changes in the constants that drive the friction or elasticity components,or the player, through the way she controls (or plays) the instrument, such as therelative instantaneous velocity between bow and string, or the exerted force onit. We will call these sources of change the parameter space, for the ones due tothe instrument, and the control space, for the ones due to the player. Notice thatthe parameter space is expected to be adjusted beforehand and mantained constantduring the performance, while the control space is expected to vary and is wherethe art of playing bowed strings is.
2.3.2 Spatial mappings
In 1973, Schelleng defined a parametrized mapping between the control andacoustic spaces Schelleng [1973]: given a projection of the control space thatonly takes into account bow force and relative distance between the contact pointof bow and string and the bridge, there are three regions separated by two linesthat correspond to different sound characteristics: the expected periodic motionin the middle, raucous sound on one side, and surface sound on the other, asseen in Figure 2.4. These areas have been further divided in the literature: withinthe raucous region two different regimes can take place: aperiodic motion, andanomalous low frequency oscillations. Within the lower surface sounding region,two different regimes also exist: higher-frequency modes due to multiple stick-slipcycles per period, and regions where there is not enough energy to actually produceany oscillation (i.e. the bow is always slipping), usually labelled as having decayingenergy.
The Schelleng diagram alone is not enough to fully represent how the control andacoustic spaces map. For instance, it is known that, when the bowing speed ischanged, the slope of the line that separes surface sound from the Helmholtz regionalso moves. Moreover, it represents a static portrait of the mapping; what makesbowed strings really difficult to master are their dynamics. The Guettler diagram isanother proposal that focuses on, assuming there is Helmholtz motion, how longdoes it take to get there starting with no velocity; it sweeps the space based on theacceleration of the bow and the bow pressure.
15

Figure 2.4: A replica of the original Schelleng diagram, published in Schelleng[1973].
These acoustic and control space mappings are valid for a given point of theparameter space, or a given configuration of the model. Different configurationswill be indeed fully characterized by their acoustic-control mapping, expressedthrough tools such as the mentioned diagrams - even more than by the coefficientsthemselves that one has to input to the system.
2.3.3 What is playability?
According to Woodhouse and Galluzzo [2004], what makes a violin (or any bowedstring instrument, for that matter) good is a combination of its tone and its playa-bility. The instrument’s tone refers to its sonic signature, to how listeners may rateits sound, and is usually associated with the spectral shape of the sound, closelyrelated to the resonance modes of the body and therefore to its impulse response.Playability, by contrast, refers to how easy it is to obtain good tone from the instru-ment, where good tone means Helmholtz motion, regardless of its quality. Thesetwo dimensions are not necessarily correlated; it is well known that Stradiavariviolins, considered amongst the best in the world, have actually bad playability;unless played with great care and good tuning, they will not deliver what onewould expect from them. This leads to a very important - and well-known by violinprofessors - corollary: the dream violin of a consolidated concertist might be avery bad choice for a beginner, since she would find it too difficult to get good tone
16

from it (especially considering how expensive such a violin would probably be).
It follows from intuition that an instrument with a very wide region of the controlspace where there is Helmholtz motion (that is, with a wide Helholtz band on ahypothetical multi-dimensional Schelleng diagram) will be easier to play, since abroader range of gestures will end up providing “good tone”. Therefore, one mayargue that the Schelleng diagram can be used as a (partial) playability indicator,assuming there is not much variability when changing other control variables suchas terminal velocity. Similarly, instruments that show very short transient times inthe Guettler diagram, that is, that very quickly achieve Helmholtz motion, are alsovery playable.
Some may argue that playability is more than easily reaching Helmholtz motion; afundamental part of bowed string performance consists precisely on playing withthe duration and character of transients, art known as articulation, and having aninstrument that systematically switches to Helmholtz motion as soon as the bowstarts to move would not be the best choice. It would then be necessary to:
1) Define acoustic and control space mapping diagrams that reflect the differentarticulations that a musician uses.
2) Study what do musicians prefer, i.e., what is their sweet spot amongst thepossible shapes of such diagrams.
3) Find a reliable distance metric that can estimate how close a given mappingis to what a musician expects.
This is beyond the scope of our work, but it raises an interesting point wheninterpreting the playability results that will arise after the experiments.
Notice that we are talking about playability from an acoustician’s point of view.Another issue is the playability of a virtual instrument from a usability point ofview: are the controllers that the player uses to control the model easy to use andintuitive? Are they expressive (i.e. do they allow exploring a wide range of sonicpossiblities)? For a control-oriented discussion on playability and a more detaileddistinction between what can people mean by playability, please refer to Youngand Serafin [2003].
17


Chapter 3
REGIME ESTIMATION ANDPLAYABILITY SCORING
In this chapter, we present the tools we chose for estimating the vibration regimeof the string given a numerical simulation, together with a brief overview of theliterature on this specific topic, and our approach to quantifying playability to beable to better compare different versions of the model.
3.1 String regime estimation
The core of this project is the computation of a Schelleng-like diagram by numeri-cally playing our model using different combinations of bow-bridge distance andbow force controls given a model state or snapshot, i.e., a complete parameter-spaceconfiguration, and constant controls such as pitch or bow velocity. The diagramsweeps, as proposed by Schelleng, the bow-bridge distance relative to the effectivestring length and the bow pressure, both in logarithmic scale. For each evaluatedpoint on the lattice, we compute the regime of the string.
There are different methods mentioned in the literature for computing the regime ofa simulated bowed string. The first article that mentions the numerical estimationof vibrational regimes in simulated bowed strings is Woodhouse [1993], in whichthe author suggests driving a nonlinear model with a variety of inputs that sweep aspace in order to get a map, a la Mandelbrot. He suggests simulating a note with a
19
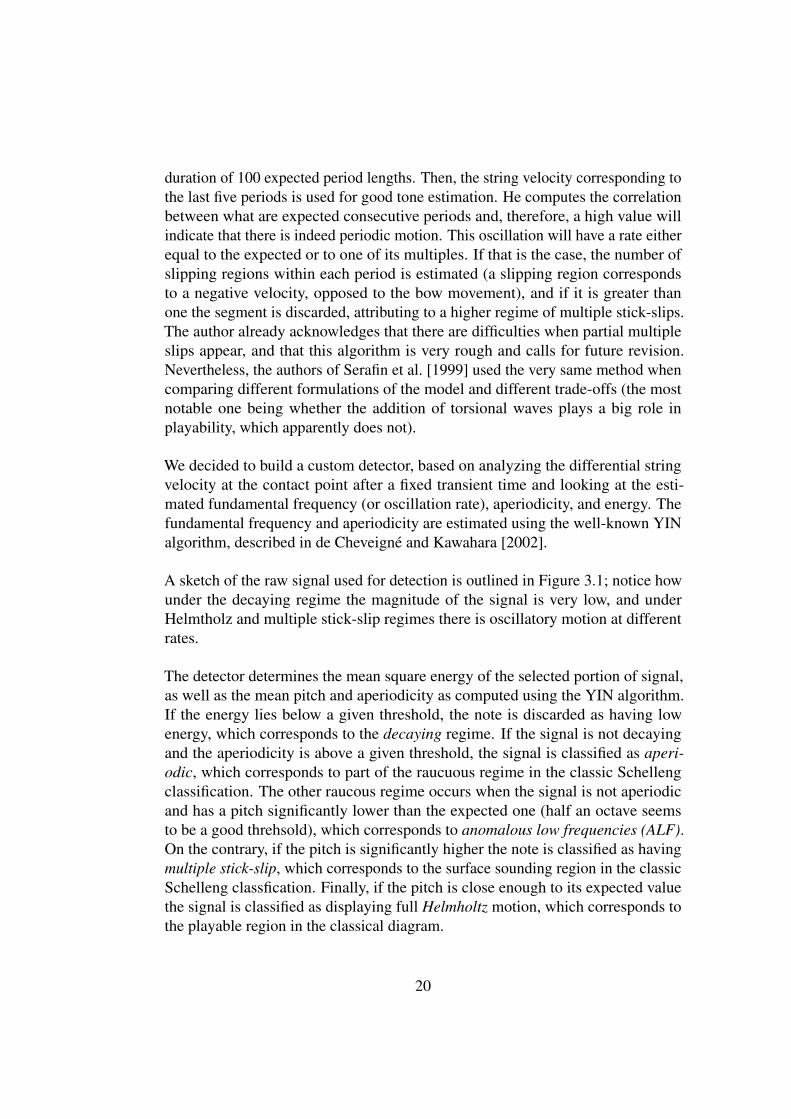
duration of 100 expected period lengths. Then, the string velocity corresponding tothe last five periods is used for good tone estimation. He computes the correlationbetween what are expected consecutive periods and, therefore, a high value willindicate that there is indeed periodic motion. This oscillation will have a rate eitherequal to the expected or to one of its multiples. If that is the case, the number ofslipping regions within each period is estimated (a slipping region correspondsto a negative velocity, opposed to the bow movement), and if it is greater thanone the segment is discarded, attributing to a higher regime of multiple stick-slips.The author already acknowledges that there are difficulties when partial multipleslips appear, and that this algorithm is very rough and calls for future revision.Nevertheless, the authors of Serafin et al. [1999] used the very same method whencomparing different formulations of the model and different trade-offs (the mostnotable one being whether the addition of torsional waves plays a big role inplayability, which apparently does not).
We decided to build a custom detector, based on analyzing the differential stringvelocity at the contact point after a fixed transient time and looking at the esti-mated fundamental frequency (or oscillation rate), aperiodicity, and energy. Thefundamental frequency and aperiodicity are estimated using the well-known YINalgorithm, described in de Cheveigné and Kawahara [2002].
A sketch of the raw signal used for detection is outlined in Figure 3.1; notice howunder the decaying regime the magnitude of the signal is very low, and underHelmtholz and multiple stick-slip regimes there is oscillatory motion at differentrates.
The detector determines the mean square energy of the selected portion of signal,as well as the mean pitch and aperiodicity as computed using the YIN algorithm.If the energy lies below a given threshold, the note is discarded as having lowenergy, which corresponds to the decaying regime. If the signal is not decayingand the aperiodicity is above a given threshold, the signal is classified as aperi-odic, which corresponds to part of the raucuous regime in the classic Schellengclassification. The other raucous regime occurs when the signal is not aperiodicand has a pitch significantly lower than the expected one (half an octave seemsto be a good threhsold), which corresponds to anomalous low frequencies (ALF).On the contrary, if the pitch is significantly higher the note is classified as havingmultiple stick-slip, which corresponds to the surface sounding region in the classicSchelleng classfication. Finally, if the pitch is close enough to its expected valuethe signal is classified as displaying full Helmholtz motion, which corresponds tothe playable region in the classical diagram.
20

Figure 3.1: Temporal evolution of the differential string velocity under differentvibration regimes. The top plot corresponds to decaying sound, the middle one toregular Helmholtz motion, and the bottom one to multiple stick-slip.
21

Figure 3.2 outlines the values that these features used during the classification takealong the Schelleng diagram space. Notice how regions with low energy get indeedclassified as decaying, regions with high aperiodicity as aperiodic, and so on. Themultiple stick-slip and ALF regions match very closely twice the fundamentalfrequency and half of it respectively, which are their expected values on the mostprominent regions.
Schelleng at v = 0.20 m/s
0
0.5
1Mean log(ap)
−15
−10
−5
Mean energy (dB)
−120
−100
−80
−60
−40
−20
Mean f0 (Hz)
100
200
300
Figure 3.2: Features used for determining the vibration regime. The top plot onthe left side shows the detected regime, with white being Schelleng, black beingdecaying, light gray aperiodic, gray ALF, and dark grey multiple stick-slip. Thetop right plot shows the detected aperiodicity of the signal in logarithmic scale forbetter contrast, the bottom left plot shows the mean energy, and the bottom rightplot shows the detected fundamental frequency. The model was played at a bowingvelocity of 0.2 m/s on its G string, with an expected fundamental frequency of 196Hz.
Notice that the decision threshold for determining the octave (which discriminatesHelmholtz, ALF, and multiple stick-slip regimes) needs a certain margin becauseof the flattening effect, which lowers the pitch when the bow force is high. Thiseffect can be observed in the detected fundamental frequency subplot of Figure 3.2,and is thoroughly explained in McIntyre and Woodhouse [1979].
22

Because of the dynamic nature of the model, it is crucial to take care during theexcitation or transient phase. At first, we probed the system by starting with noforce or velocity, and applying a constant acceleration to both of them until thedesired value. However, depending on the target values, the system got stuck inaperiodic motion at points where it was obvious that regular Helmholtz motioncould be established. We found another pattern to work better, based on startingwith the target force already on place, and applying dynamics only on the bowvelocity.
Changing these profiles corresponds to playing with different gestures or articu-lations, that musicians traditionally use to give different characters to notes. Thediscussed excitation patterns correspond quite closely to the two main groups ofbowing styles that musicians alternate during performance: the legato stroke, witha soft attack and a gradual force buildup, and the martele stroke, with a strongattack granting an explosive onset that adds “punch”. See Galamian [1999] for atreaty on different bow strokes for a more complete description.
3.2 Playability measures
Most of the literature on playability has focused on rendering diagrams such as theones proposed for different settings or variants of the models, and then qualitativelydiscussing which one is better. While this approach provides with great insight onthe models and allows for extensive comments and discussions, we believe that aquantified approach is sometimes needed, especially when the number of trials toevaluate grows larger. Our goal is not only to run playability evaluations on a largenumber of versions of the model, but to construct functional maps that can hinthow the playability changes according to model-related variables (as one smoothlynavigates the parameter space). Therefore, we have devised some preliminaryscalar indicators of bowed string playability.
As detailed previously, if one understands the playability of an instrument as ameasure of how big are the regions of the control space that map to musically validregions of the acoustic space, it becomes obvious that the Schelleng diagram canbe of great help for a first approximation. It is only required to define a metric that,given the Schelleng diagram for a particular position in the parameter space, hintshow well it fits into what is expected.
As an example, see Figure 3.3, which displays the computed Schelleng diagram
23

under identical conditions except for the “warm” coefficient of the parameter space,which controls how quickly the bow hair warms up due to friction. It seems, forinstance, that the warmest version has less regions with decaying sound, and theHelmholtz region is therefore slightly wider.
Figure 3.3: Computed Schelleng diagram for the model with two different “warm”coefficients. Different colors indicate different regimes; green means Helmholtzmotion, blue means aperiodic, purple means ALF, orange means multiple stick-slip,and red means decaying.
If the region of the bow force and bow-bridge distance plane covered by thecomputed diagram is big enough, a valid first approximation to estimating howeasy it is to lie inside the Helmholtz regime region would be to just count theportion of space that the Helmholtz regime (and each of the other regimes, justfor completeness) takes. This will be our proposed playability metric for a givensnapshot of the model, the results of which will be presented in the next chapter.This reflects what Serafin et al. [1999] proposes as playability; namely, “Playabilitycan be loosely defined as the volume of the multidimensional parameter space inwhich good tone is produced.”. Notice that their parameter space is what we call thecontrol space, in order to distinguish it from the instrinsic instrument parameters.
Indeed, by estimating this playability indicator on a large number of adjacentpoints on the parameter space of the model (e.g. by sweeping a chosen friction-related coefficient), we can construct a functional playability map of our model,although for now limited to one and two-dimensional projections of the parameterspace. Such functional maps have two main applications that makes them highlyinteresting:
• Automatic model calibration using non-convex optimization techniques on
24

the parameter space.• Deeper qualitative understanding of the effect of the model parameters on
the control-acoustic spatial mapping, and possible empirical law extraction.
Notice that when automatically calibrating the model, the objective function shouldnot only take into account playability as has been defined here (a maximizer onthe area of the Helmholtz region of the Schelleng diagram), but also the achievedtone quality - same as happens with acoustic instruments. Moreover, more realisticplayability measures should be developed that also take into account the desiredand musically useful aperiodic region, navigated especially in note transitions.
Unfortunately, these applications - especially the first one - lie outside the scope ofthis project, and are therefore left for future investigations.
The problem with our approach lies, of course, on determining what big enoughmeans when deciding the portion of the control space to cover during playabilityestimation. In our case, we decided to select a range that makes sense both froma physical point of view, i.e., within the limits of what a musician could use (andadequately control) during performance - although we pushed bow force a littlefurther, to see well the effect of aperiodic and ALF regions that are scarce onmoderate and high bow velocities.
25


Chapter 4
COMPUTED SCHELLENGDIAGRAMS AND PLAYABILITYMAPS
In this chapter, we present the results obtained with our simulations using a com-plete model of the bowed string that includes thermal friction, hair dynamics withfinite hair width, and a modal formulation of the bridge admittance. First, someindividual results are presented of Schelleng diagram estimations, followed byfunctional playability maps generated by sweeping regions of the parameter spaceof the model and driving them with different gestures on the control space.
4.1 High-resolution regime maps
The computational efficiency of the model, especially thanks to its native imple-mentation in C and its posterior parallelization in OpenMP, allowed us to computeSchelleng-like regime maps of great resolution, only matched by previous exper-iments run in expensive parallel computers. Actually, the bottleneck ended upbeing the regime analysis rather than the simulation itself. Figure 4.1 displays arendering of the Schelleng space using a 50 by 50 lattice of control permutations.
Although this high resolution rendering was just a by-product, because our goalwas to simulate lots of such lattices with less resolution, it provided us with deep
27

insights about the qualitative behaviour of the system. Two very important featuresthat need further study arise at first sight: the shape of the playable region, and thedistribution of the anomalous low frequency regions.
It has been long believed that there is a playable region in the Schelleng diagramseparated by straight lines in a log-log representation. However, our detailedsimulation shows a pronounced curvature on both limits of the region. Thiscurvature varies depending on the constants of the model, and is a subject worhtyof further study.
Another feature that requires more consideration are the anomalous low frequencyregime (ALF) regions that arise. Traditionally, some sporadic points of the raucousregion have been considered as displaying ALF, while others as aperiodic withoutany apparent order. This fact was probably attributed to the excitation of particularfeatures of the system. However, our detailed analysis bowing at relatively lowspeed reveals several dense regions where low-frequency regimes are established.These regions have stripe-like shapes, and present a very clear pattern - in adirection roughly normal to the edge of the playable region, stripes are alternatedwith pure aperiodic regions. If one looks at the detected fundamental frequency ofeach low-frequency zone, it decreases as one goes further from the playable region,that is, as the force increases and the bow-bridge distance decreases.
In the regime classification scheme proposed, we purposely avoided mentioningsomething that most violin players are well aware of: if the bow force is too high,especially at low velocity, it gets to a point where the sound is no longer aperiodicor raucous for that matter, but just a series of clicks corresponding to the bowdragging the string along with it several millimeters, and then releasing it. Thiscan easily go as slow as two or three clicks per second. Although it is easy tocome upon this behavior when playing, there are not many references to it inthe literature. However, our diagram proposes an explanation: they are actuallyanomalous low frequencies themselves, only at such a low frequency that they lieway beyond the hearing threshold of 20 Hz, and are therefore perceived as seriesof clicks.
Another simulation that was possible was the so-called 3D Schelleng diagram,which adds a third dimension that sweeps different terminal velocities. In Schoonder-waldt et al. [2008], the authors mechanically bow a string at different velocities,and present the results in separate Schelleng diagrams; we decided to take thisconcept further and present a single 3D rendering of the resulting volumes, wherethe manifolds that contain regions of the same regime are displayed. In the men-tioned article the authors observed that, as the velocity increases, the maximum
28

Figure 4.1: High-resolution rendering of the Schelleng diagram, focused on theraucous region. The pitch detector has been configured to detect very low pitches.White indicated Helmholtz motion, light grey aperiodic motion, dark grey anoma-lous low frequencies, and black other artifacts such as multiple stick-slip.
29

force before breaking Helmholtz motion is increased, but the slope of the minimumrequired force to achieve it is also modified; we can report similar results using ourvirtual synthesizer. Figure 4.2 provides a representation of such diagram, where thespatial distribution of the different modes is graphed; the change in slope can benoticed in the tf0 subplot (corresponding to Helmholtz motion), while the change inmaximum force is more obvious in the aperiodic subplot. Notice also how regionswith multiple stick-slip regime increase greatly at higher terminal velocities.
Figure 4.2: 3D Schelleng diagram displaying how the regime distribution on theforce vs bow-bridge distance plane varies according to velocity. Axes do notindicate the actual units, but just the simulation index.
30

4.2 Playability
As a very rough measure, we will sweep a large portion of the feasible parameterspace, and we will count the percentage of this space that lies in each of the possibleregimes. Figure 4.3 shows these counts and how they change when the “warm”coefficient of the parameter space is modified. We can see that the portion offull Helmholtz motion and aperiodic regions grows with the coefficient, while theportion of decaying sound shrinks. It is difficult to give an explanation to this fact,but since large portions of space with decaying sound have it because of numericalartifacts, it could be the case that the system is more stable when it heats up faster.It could also have a more classical explanation whereby at low forces, which iswhen we would expect decaying sound, the contact does not heat up enough totrigger oscillatory motion; if it heats faster, it will be easier to reach that threshold.
Figure 4.3: Functional playability of the model, depending on how quickly thebow hair heats up during friction.
This analysis can be expanded to a 2D parameter sweep; in Figure 4.4, we cansee how the regime distribution changes depending on both the “warm” (alreadypresented) and “cool” (which controls how quickly the system cools down) coeffi-cients. Notice how the decaying regime shows that the model barely works whenthe coefficients are opposite. In the top left corner, where the system heats quicklyand cools slowly, the rosin does not cool down enough during sticking and heatbuilds up; in the real world, the string would melt! This is of course unrealistic. In
31

the bottom right corner, where the system heats slowly and cools quickly, the rosindoes not warm up enough during slipping to initiate periodic motion. As we go tothe center from this bottom right corner, regions of the Schelleng diagram with highforce (which heat up more) already bridge the critical point, and aperiodic regionsappear. The Helmtholz region is similar, because these bridged points correspondto high forces unlikely to result in Helmholtz motion. It is also interesting to seehow multiple stick-slips do not happen at all when cooling is slow. Finally, themost playable heat configuration seems to be near the top right corner, where theHelmholtz region is broader.
Figure 4.4: Two-dimensional functional playability map, displaying the regimedistribution on the Schelleng diagram for differentand cool, horizontal axis (howquickly the hair cools), and warm, vertical axis (how quickly the bow hair heatsup with friction) model parameters. The units have been reduced two orders ofmagnitude for better display. The color intensity represents the percentage of theselected Schelleng diagram that each of the regimes covers.
32
Chapter 5
OUTLOOK
Although this work only scratches the surface of the experimental analysis thatcan be performed in our bowed string model, we have successfully achievedour objectives and demonstrated that it is indeed possible to extract meaningfulinformation from computer simulations similar to the ones described.
We have successfully computed Schelleng diagrams for given configurations of themodel, which has lead to the discovery of Anomalous Low-Frequency stripes inthe raucuous region with an unexpected organization.
The efficiency of the diagram extraction method has also allowed us to compute itin three dimensions, incorporating terminal bow velocity as another of the variablesrather than performing a handful of simulations at different speeds, although wefound visualization issues and only extracted from it a portion of the informationthe diagram for sure conveys.
We have also experimented with how the diagram changes when specific parametersof the model are changed, taking the “warm” coefficient as a case study, and fromthis we have constructed a functional playability indicator that shows how theoverall playability changes when the parameter space is navigated.
These functional playability maps hint towards automatic model calibration, byexploring the parameter space while optimizing the playability metric on it. Thiscould give rise to important future work, since model calibration is still one of themajor issues in using physically-based synthesis for musical purposes; most of theparameters are too far from the physical reality to be determined experimentally,
33

especially when they relate to very intrinsic properties of the materials that makeup the violin, which tend to be compound and very complex.
Besides this and the obvious future research lines that the ALF strips and the 3Drepresentation of the Schelleng diagram offer, there are several aspects of thisproject that call for refinement:
• The incorporation of control dynamics to the playability metric throughGuettler-like diagrams.• The evaluation of playability beyond the Helmholtz regime, i.e., by studying
how players use aperiodic transients in a musical context.• A depper sweeping of the parameter space, by taking into account all possible
parameters. Notice that this is no small task, since the parameters aremost likely dependent (so sweeping them separately will be helpful but notcomplete), and the number of parameters can be increased by reconsideringsome design choices during the design of the model that admit other options.
While it may seem there are lots of future work to do and that may make the projectlook incomplete, I think that’s quite the contrary; realizing that there are so manyreally open questions has given me the energy to pursue them even further, and Isincerely hope to do my best at giving an answer to them in the future.
I would like to express my deepest gratitude to Esteban Maestre, for teachingme all I know (especially what I was not aware that I did not know) about whathappens when you play the violin and how to tell a computer to do it. It is beingreally rewarding to see my intuition as a violinist to make sense with what sciencesays and feel like it all “clicks”. I would also like to thank all the professors ofthe Master’s, for making me realize mathematics and modelling are more thanequations and for providing me with intuition and insight about models that maylook complex on paper but actually represent everyday phenomena. Finally, Iwould also like to thank Marina, my wife, for supporting and taking care of meduring these period of intensive work. This thesis was started in Barcelona andfinished in Montréal, and moving across continents has not been an easy task.
Barcelona / Montréal, 2015
34

Bibliography
A. Benade. Fundamentals of Musical Acoustics. Dover Publications, secondedition, 1990.
L. Cremer. The physics of the violin. MIT Press, 1984.
A. de Cheveigné and H. Kawahara. YIN, a fundamental frequency estimatorfor speech and music. Journal of the Acoustical Society of America, 111(4):1917–1930, 2002.
F. G. Friedlander. On the oscillations of the bowed string. Proceedings of theCambridge Philosophical Society, 49:516–530, 1953.
I. Galamian. Principles of Violin Playing and Teaching, 3rd edition. Shar ProductsCo., 1999.
H. von Helmholtz. Lehre von den Tonempfindungen. Braunschweig, 1862.
M. Karjalainen and Julius O. Smith. Body modeling techniques for string in-strument synthesis. In Proceedings of the 1996 International Computer MusicConference, Hong Kong, 1996.
J. B. Keller. Bowing of violin strings. Comm. Pure and Applied Maths, 6:283–495,1953.
H. Kinoshita and S. Obata. Left hand finger force in violin playing: Tempo,loudness, and finger differences. Journal of the Acoustical Society of America,126(1):388–395, 2009.
H. Kuttruff. Room acoustics. Taylor & Francis, New York, USA, 5th edition, 2009.
E. Maestre, G. Scavone, and J. O. Smith. Digital modeling of bridge driving-pointadmittances from measurements on violin-family instruments. In Proceedingsof the Stockholm Music Acoustics Conference, 2013.
35

E Maestre, C. Spa, and J. O. Smith. A bowed string physical model includingfinite-width thermal friction and hair dynamics. In Proceedings of the 2014International Computer Music Conference, 2014.
H. Mansour, J. Woodhouse, and G. Scavone. Time-domain simulation of the bowedcello string: dual-polarization effect. In International Congress on Acoustics,2013.
M. E. McIntyre and J. Woodhouse. On the fundamentals of bowed string dynamics.Acustica, 43(2):93–108, 1979.
J. Piteroff and J. Woodhouse. Mechanics of the contact area between a violin bowand a string, Part II: simulating the bowed string. Acustica united with Actaacustica, 84:744–757, 1998.
C. V. Raman. On the mechanical theory of the vibrations of bowed strings. Bulletinof the Indian Association for the Cultivation of Science, 15:1–158, 1918.
J. C. Schelleng. The bowed string and the player. Journal of the Acoustical Societyof America, 53:26–41, 1973.
E. Schoonderwaldt, K. Guettler, and A. Askenfelt. An empirical investigation ofbow-force limits in the schelleng diagram. Acta Acustica united with Acustica,94:604–622, 2008.
S. Serafin, J. O. Smith, and J. Woodhouse. An investigation on the impact oftorsion waves and friction characteristics on the playability of virtual bowedstrings. In Proceedings of the 1999 IEEE Workshop on Applications of SignalProcessing to Audio and Acoustics, New Platz, New York, USA, 1999.
J. H. Smith and J. Woodhouse. The tribology of rosin. J. Mech. Phys. Solids, 48:1633–1681, 2000.
J. O. Smith. Physical modeling using digital waveguides. Computer Music Journal,16(4):74–91, 1992.
J.O. Smith. Nonlinear commuted synthesis of bowed strings. In Proceedings ofthe 1997 International Computer Music Conference, 1997.
Julius O. Smith. Physical Audio Signal Processing: for Virtual Musical Instrumentsand Digital Audio Effects. W3K, 2010.
J. Woodhouse. On the playability of violins. part ii: Minimum bow force andtransients. Acustica, 78:137–153, 1993.
36

J. Woodhouse. Bowed string simulation using a thermal friction model. ActaAcustica united with Acustica, 89:355–368, 2003.
J. Woodhouse and P.M. Galluzzo. The bowed string as we know it today. Acustica- Acta Acustica, 90(4):579–589, 2004.
D. Young and S. Serafin. Playability evaluation of a virtual bowed string instrument.In Proceedings of the 2006 International Conference on New Interfaces formusical Expression, pages 104–108, Montréal, 2003.
37
