freshwater environment affects growth rate and muscle fibre
TRANSCRIPT
Many species of teleost fish exhibit indeterminate growth(Weatherley and Gill, 1987). Muscle fibres reach a maximumdiameter, which is dictated by metabolic demands anddiffusional constraints related to nutrient assimilation and/or
metabolite removal. An important consequence ofindeterminate growth is that the number of fibres needs toincrease throughout much of the life cycle as the muscle massincreases, involving a prolonged period of postembryonic
1337The Journal of Experimental Biology 206, 1337-1351© 2003 The Company of Biologists Ltddoi:10.1242/jeb.00262
The influence of freshwater environment on musclegrowth in seawater was investigated in an inbredpopulation of farmed Atlantic salmon (Salmo salarL.).The offspring from a minimum of 64 families per groupwere incubated at either ambient temperature (ambienttreatment) or in heated water (heated treatment). Growthwas investigated using a mixed-effect statistical modelwith repeated measures, which included terms fortreatment effect and random fish effects for individualgrowth rate (α) and the instantaneous growth rate perunit change in temperature (γ). Prior to seawater transfer,fish were heavier in the heated (61.6±1.0·g; N=298) than inthe ambient (34.1±0.4·g; N=206) treatments, reflectingtheir greater growth opportunity: 4872·degree-days and4281·degree-days, respectively. However, the subsequentgrowth rate of the heated group was lower, such thattreatments had a similar body mass (3.7–3.9·kg) afterapproximately 450·days in seawater. The total cross-sectional area of fast muscle and the number (FN) and sizedistribution of the fibres was determined in a subset of thefish. We tested the hypothesis that freshwater temperatureregime affected the rate of recruitment and hypertrophyof muscle fibres. There were differences in FNbetweentreatments and a significant age×treatment interaction butno significant cage effect (ANOVA). Cessation of fibrerecruitment was identified by the absence of fibres of<10·µm diameter. The maximum fibre number was 22.4%more in the ambient (9.3×10⁵±2.0×10⁴ than in the heated
(7.6×10⁵±1.5×10⁴) treatments (N=44 and 40 fish,respectively; P<0.001). For fish that had completed fibrerecruitment, there was a significant correlation betweenFN and individual growth rate, explaining 35% of thetotal variation. The density of myogenic progenitor cellswas quantified using an antibody to c-met and wasapproximately 2-fold higher in the ambient than in theheated group, equivalent to 2–3% of the total musclenuclei. The number of myonuclei in isolated fibresegments showed a linear relationship with fibre diameter.On average, there were 20.6% more myonuclei in 200-µm-diameter fibres isolated from the ambient(3734·myonuclei·cm–1) than from the heated(3097·myonuclei·cm–1) treatments. The maximum fibrediameter was greater in heated than in ambient groups,whereas the age×treatment interaction was notsignificantly different (ANCOVA). There were also noconsistent differences in the rate of hypertrophy of musclefibres between treatments. It was concluded thatfreshwater temperature regime affected fibre number andthe nuclear content of fast muscle in seawater but not therate of fibre hypertrophy. The mechanisms and life historyconsequences of developmental plasticity in fibre numberare discussed.
Key words: muscle growth, myogenic cells, muscle fibrerecruitment, temperature, growth, developmental plasticity, fish,Salmo salar.
Summary
Introduction
Freshwater environment affects growth rate and muscle fibre recruitment inseawater stages of Atlantic salmon (Salmo salarL.)
Ian A. Johnston1,*, Sujatha Manthri1, Richard Alderson2, Alistair Smart3, Patrick Campbell2,David Nickell4, Billy Robertson3, Charles G. M. Paxton5 and M. Louise Burt5
1Gatty Marine Laboratory, School of Biology, University of St Andrews, St Andrews, Fife, Scotland, KY16 8LB, UK,2BioMar Ltd, North Shore Road, Grangemouth Docks, Grangemouth, Scotland, FK3 8UL, UK,
3Marine Harvest Scotland Ltd, Craigcrook Castle, Edinburgh, Scotland, EH4 3TU, UK,4Roche Vitamins Ltd, Heanor, Derbyshire, England, DE75 7SG, UKand 5Research Unit for Wildlife
Population Assessment, School of Mathematics and Statistics, University of St Andrews, St Andrews, Fife,Scotland, KY16 9LZ, UK
*Author for correspondence (e-mail: [email protected])
Accepted 23 January 2003
1338
hyperplasia (Greer-Walker, 1970; Stickland, 1983). Speciesthat reach a large ultimate body size require more musclefibres than do small species, and therefore hyperplasiacontinues for longer in the life cycle (Weatherley et al., 1988).Variations in the duration of muscle fibre recruitment alsounderlie sexual dimorphism in body size. For example, infemale Argentine hake (Merluccius hubbsi), fibre recruitmentceased at 55–60·cm total length (TL) compared with45–52·cm TL in males, reflecting their greater maximum size(Calvo, 1989). Postembryonic muscle growth in fish involvesa highly proliferative population of myogenic progenitor cellsthat have many of the characteristics of the satellite cells foundbeneath the basal lamina of muscle fibres in mammals(Koumans and Akster, 1995; Fauconneau and Paboeuf, 2001).However, some myogenic cells are located outside the basallamina in the larval and juvenile stages of teleosts (Veggettiet al., 1990; Johnston, 1993). The pool of proliferatingmyoblasts donates a large number of nuclei to muscle fibresas they expand in diameter (hypertrophic growth; Koumans etal., 1991).
Two main processes of fibre recruitment have beenidentified in teleost myotomal muscle. In the late embryo,larval and early juvenile stages, muscle fibres are added fromdiscrete germinal zones (Veggetti et al., 1990; Rowlerson etal., 1995; Johnston et al., 1998; Barresi et al., 2001) in aprocess that has been termed ‘stratified hyperplasia’(Rowlerson and Veggetti, 2001). The anatomical location ofthese germinal zones varies among muscle fibre types andspecies (Rowlerson et al., 1995; Johnston et al., 1998). Inmost fish, the final and most important mechanism of muscleexpansion is ‘mosaic hyperplasia’ (Rowlerson and Veggetti,2001). Mosaic hyperplasia involves the widespread activationof myogenic precursors scattered throughout the myotome(Koumans and Akster, 1995; Johnston et al., 1999; Johnston,2001). Proliferating myoblasts withdraw from the cell cycleand fuse to form myotubes on the surface of existing musclefibres (Veggetti et al., 1990; Johnston et al., 1998, 2000a). Inthe fast muscle, immature muscle fibres have a higher contentof glycogen and aerobic enzymes than do mature ones,resulting in a characteristic mosaic pattern of fibre diameterand histochemical staining characteristics (Johnston et al.,1975; Matsuoka and Iwai, 1984; Rowlerson et al., 1995).Cells with the ultrastructural characteristics ofundifferentiated myoblasts are first observed after thecompletion of segmentation and the formation of theembryonic muscle (Atlantic herring Clupea harengus,Vieira and Johnston, 1992; rainbow trout Oncorhynchusmykissand pearl fish Rutilus frisii meidingeri, Stoiber andSänger, 1996).
The number and diameter of muscle fibres present in themyotomes from hatching to first feeding has been shown tovary with egg incubation temperature in such diverse speciesas Atlantic salmon (Salmo salar; Stickland et al., 1988;Johnston and McLay, 1997), whitefish (Coregonus lavaretus;Hanel et al., 1996), rainbow trout (Matschak et al., 1998),Atlantic herring (Vieira and Johnston, 1992), plaice
(Pleuronectes platessa; Brooks and Johnston, 1993), turbot(Scophthalmus maximus; Gibson and Johnston, 1995) andAtlantic cod (Gadus morhua; Galloway et al., 1998). Themuscle fibres present in these early stages of ontogeny reflectthe processes of embryonic myogenesis (Devoto et al., 1996;Johnston, 1993; Veggetti et al., 1990) and fibre recruitmentby stratified hyperplasia (Johnston et al., 1998; Barresi et al.,2001). The number of myogenic precursors identified byultrastructural criteria was found to be significantly higher in1-day-old Atlantic herring larvae reared at 8°C than at 5°C(Johnston, 1993). Furthermore, after 80·days at ambienttemperature, there were more fast muscle fibres in herringlarvae hatching from eggs incubated at 8°C than at 5°C,consistent with an effect of development temperature onmosaic hyperplasia (Johnston et al., 1998, 2001). Thenumber of fast and slow muscle fibres has also been reportedto vary with development temperature throughout the larvalstages of sea bassDicentrarchus labrax(Ayala et al., 2001)and in the freshwater parr stages of Atlantic salmon (Johnstonet al., 2000b). For salmon, the treatment group with thehighest fibre number also had the highest density of cellsexpressing c-met (Johnston et al., 2000a,b), a molecularmarker of myogenic precursor cells (Cornelison and Wold,1997). There is therefore evidence that developmenttemperature has persistent effects on all three phases ofmuscle growth.
The recruitment and hypertrophy of fast muscle fibres wasshown to vary with growth rate in rainbow trout fed differentration levels (Rasmussen and Ostenfeld, 2000). Valente et al.(1999) found evidence for a faster rate of fibre recruitment ina fast-growing strain of rainbow trout compared with a slow-growing strain, although there was a similar number of musclefibres at any given body length. Numerous structural andregulatory genetic loci are likely to influence growth potentialin teleosts (Mommsen and Moon, 2001). Inter-specificcomparisons indicate that a high growth rate and a large bodysize are related to the capacity to recruit new muscle fibres(Weatherley et al., 1988).
Salmo salarL. is a migratory species with a remarkablyplastic and complex life history (Stabell, 1984). Adult stagesspawn in freshwater rivers, where the parr remain for 1–5·yearsbefore smolting and migrating to the sea. The salmon thenspend 1–4·years on oceanic feeding grounds in the Arcticbefore sexually maturing and migrating back to their natalstream to spawn. In the present study, we have exploited theavailability of an inbred population of farmed salmon to testtwo hypotheses concerning postembryonic growth. Our firsthypothesis was that relatively small differences in freshwatertemperature regime have persistent effects on the recruitmentand hypertrophy of fast muscle fibres during growth inseawater. The second hypothesis was that in fish fed to appetitethere would be a correlation between the final number ofmuscles recruited and individual growth rate. In order to testthese hypotheses it was necessary to develop a statistical modelthat accounted for the effects of scale and temperature ongrowth rate.
I. A. Johnston and others
1339Plasticity of muscle growth in salmon
Materials and methodsFish
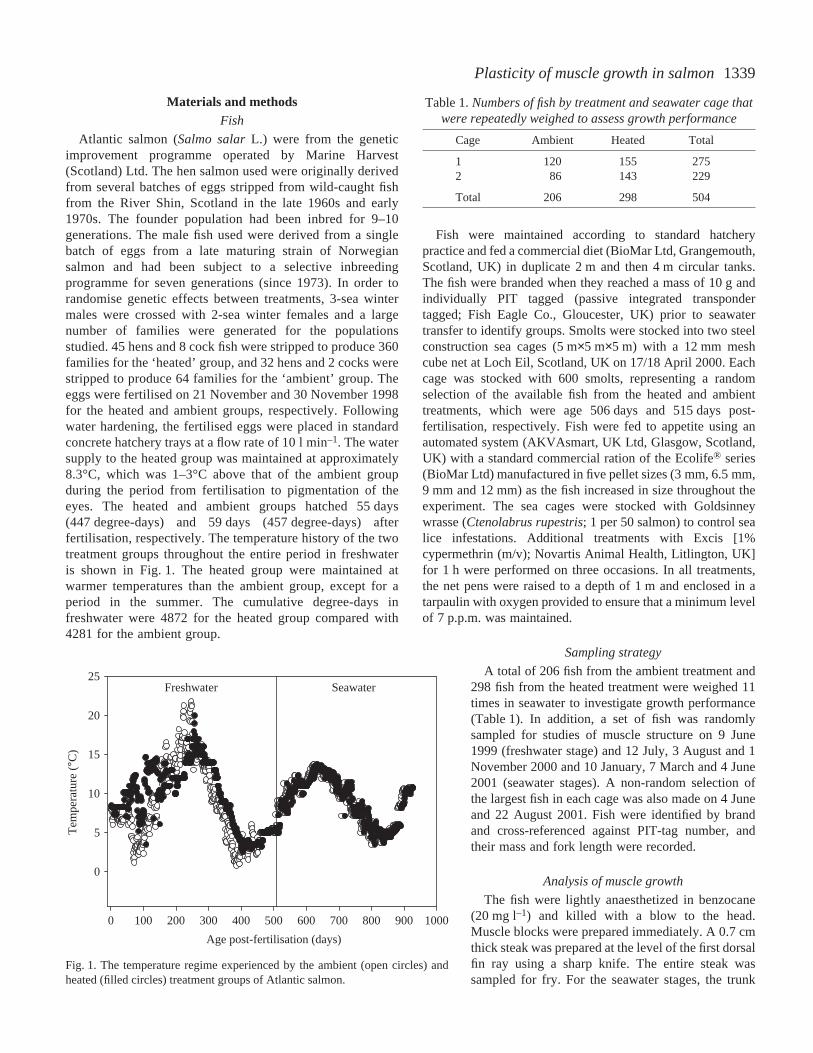
Atlantic salmon (Salmo salarL.) were from the geneticimprovement programme operated by Marine Harvest(Scotland) Ltd. The hen salmon used were originally derivedfrom several batches of eggs stripped from wild-caught fishfrom the River Shin, Scotland in the late 1960s and early1970s. The founder population had been inbred for 9–10generations. The male fish used were derived from a singlebatch of eggs from a late maturing strain of Norwegiansalmon and had been subject to a selective inbreedingprogramme for seven generations (since 1973). In order torandomise genetic effects between treatments, 3-sea wintermales were crossed with 2-sea winter females and a largenumber of families were generated for the populationsstudied. 45 hens and 8 cock fish were stripped to produce 360families for the ‘heated’ group, and 32 hens and 2 cocks werestripped to produce 64 families for the ‘ambient’ group. Theeggs were fertilised on 21 November and 30 November 1998for the heated and ambient groups, respectively. Followingwater hardening, the fertilised eggs were placed in standardconcrete hatchery trays at a flow rate of 10·l·min–1. The watersupply to the heated group was maintained at approximately8.3°C, which was 1–3°C above that of the ambient groupduring the period from fertilisation to pigmentation of theeyes. The heated and ambient groups hatched 55·days(447·degree-days) and 59·days (457·degree-days) afterfertilisation, respectively. The temperature history of the twotreatment groups throughout the entire period in freshwateris shown in Fig.·1. The heated group were maintained atwarmer temperatures than the ambient group, except for aperiod in the summer. The cumulative degree-days infreshwater were 4872 for the heated group compared with4281 for the ambient group.
Fish were maintained according to standard hatcherypractice and fed a commercial diet (BioMar Ltd, Grangemouth,Scotland, UK) in duplicate 2·m and then 4·m circular tanks.The fish were branded when they reached a mass of 10·g andindividually PIT tagged (passive integrated transpondertagged; Fish Eagle Co., Gloucester, UK) prior to seawatertransfer to identify groups. Smolts were stocked into two steelconstruction sea cages (5·m×5·m×5·m) with a 12·mm meshcube net at Loch Eil, Scotland, UK on 17/18 April 2000. Eachcage was stocked with 600 smolts, representing a randomselection of the available fish from the heated and ambienttreatments, which were age 506·days and 515·days post-fertilisation, respectively. Fish were fed to appetite using anautomated system (AKVAsmart, UK Ltd, Glasgow, Scotland,UK) with a standard commercial ration of the Ecolife® series(BioMar Ltd) manufactured in five pellet sizes (3·mm, 6.5·mm,9·mm and 12·mm) as the fish increased in size throughout theexperiment. The sea cages were stocked with Goldsinneywrasse (Ctenolabrus rupestris; 1 per 50 salmon) to control sealice infestations. Additional treatments with Excis [1%cypermethrin (m/v); Novartis Animal Health, Litlington, UK]for 1·h were performed on three occasions. In all treatments,the net pens were raised to a depth of 1·m and enclosed in atarpaulin with oxygen provided to ensure that a minimum levelof 7·p.p.m. was maintained.
Sampling strategy
A total of 206 fish from the ambient treatment and298 fish from the heated treatment were weighed 11times in seawater to investigate growth performance(Table·1). In addition, a set of fish was randomlysampled for studies of muscle structure on 9 June1999 (freshwater stage) and 12 July, 3 August and 1November 2000 and 10 January, 7 March and 4 June2001 (seawater stages). A non-random selection ofthe largest fish in each cage was also made on 4 Juneand 22 August 2001. Fish were identified by brandand cross-referenced against PIT-tag number, andtheir mass and fork length were recorded.
Analysis of muscle growth
The fish were lightly anaesthetized in benzocane(20·mg·l–1) and killed with a blow to the head.Muscle blocks were prepared immediately. A 0.7·cmthick steak was prepared at the level of the first dorsalfin ray using a sharp knife. The entire steak wassampled for fry. For the seawater stages, the trunk
Age post-fertilisation (days)
Freshwater Seawater
0 100 200 300 400 500 600 700 800 900 1000
Tem
pera
ture
(°C)
0
5
10
15
20
25
Fig.·1. The temperature regime experienced by the ambient (open circles) andheated (filled circles) treatment groups of Atlantic salmon.
Table 1. Numbers of fish by treatment and seawater cage thatwere repeatedly weighed to assess growth performance
Cage Ambient Heated Total
1 120 155 2752 86 143 229
Total 206 298 504
1340
cross-section was traced onto acetate sheets in triplicate usinga fine pen, identifying slow and fast myotomal muscle, the finmuscles and non-muscle components. The fast myotomalmuscle component of the steak from one side of the body wasdivided into a series of evenly spaced blocks ranging fromthree per individual in the smallest fish to 12 per individual inthe largest fish. Blocks were mounted on cork sheets andfrozen in 2-methyl butane cooled to near its freezing point(–159°C) in liquid nitrogen. The blocks were wrapped in tinfoil and stored in a liquid nitrogen refrigerator until they couldbe processed. The blocks were equilibrated to –20°C, and7·µm transverse frozen sections were cut, mounted on poly-L-lysine-coated slides, air dried and either stained withMayer’s haematoxylin or used for immunohistochemistry.Randomly selected fields containing 100–300 muscle fibresper block were digitised using an image analysis system(SigmaScan software; SPSS Inc., Chicago, IL, USA), and themean fibre diameter was calculated. A minimum of 800 andan average of 1000 muscle fibres were measured per fish, andthe fibre number was estimated from the total cross-sectionalarea as described previously (Johnston et al., 1999). Themaximum fibre diameter in each fish was determined from themean of the 10 largest measured diameters in the sampledfibres.
Immunocytochemistry
Myogenic cells were identified by their expression of c-met(Johnston et al., 1999), and their location was determined usingan antibody to laminin (Koumans et al., 1991), a majorcomponent of the basal lamina of muscle fibres. 18-µm-thickfrozen sections were fixed in acetone for 10·min and then airdried for 10·min. Non-specific binding sites were blocked in asolution containing 20% (v/v) normal goat serum, 1.5% (m/v)bovine serum albumin (BSA) and 1% (v/v) Triton X-100 inphosphate-buffered saline (PBS) (all from Sigma Chemicals,Poole, UK). Anti-rabbit polyclonal immunoglobulin G (IgG)antibodies to laminin and m-met were obtained from SantaCruz Biotechnology Inc. (Santa Cruz, CA, USA). Bothantibodies were shown to cross-react with the salmon muscleproteins. The antibodies were diluted 1:100 (v/v) (laminin) or1:20 (m-met) in 1% Triton X-100, 1.5% (m/v) BSA, 10% (v/v)normal goat serum in PBS. The sections were rinsed in PBSfor 5·min and incubated in the primary antibody overnight at4°C. The sections were washed in PBS and incubated in a1:800 (v/v) dilution of the secondary antibody (biotin-conjugated anti-rabbit IgG; Sigma). The sections were rinsedin PBS and were incubated for 1·h in the dark in a 1:100 (v/v)dilution of extravidin–Cy3 conjugate (Sigma). The sectionswere equilibrated in 2×SSC (300·mmol·l–1 NaCl, 30·mmol·l–1
sodium citrate, pH 7.0 at 20°C) for 5·min, counterstainedin Sytox green® (Molecular Probes Inc., Leiden, TheNetherlands) and then mounted in a fluorescent medium(DAKO Corp., Carpinteria, CA, USA). The sections wereviewed with a laser confocal microscope (BioRad Radiance2000). The density of myonuclei (stained green with Sytoxgreen) and c-met+ve cells (stained yellow) were quantified in
sequential scanning mode in five or six fields of 0.37·mm2
tissue section per fish using LaserPix v.4.0 software (BioRad,Hemel Hempstead, UK). Nuclear counts were corrected forsection thickness and the mean diameter of nuclei(Abercrombie, 1946) previously determined from electronmicrographs (Johnston et al., 2000a).
Nuclear content of isolated muscle fibres
Small bundles of fast muscle fibres were isolated from thedorsal myotome just behind the region sampled for histology.Fibre bundles were pinned at their resting length on strips ofSylgard (RS Ltd, Corby, UK) and fixed for 6–10·h in 4% (m/v)paraformaldehyde in PBS. Single muscle fibres freed fromconnective tissue were isolated in PBS using a binocularmicroscope fitted with dark-field illumination. Fibres weresuspended in 1% (m/v) saponin in PBS for 3·h, washed threetimes in PBS and treated with 2·µg·ml–1 units RNase (Sigma).Following further washes in PBS, the nuclei were stained with30·µmol·l–1 Sytox green in PBS for 5·min in the dark. Fibreswere mounted on glass slides using fluorescent mountingmedium (DAKO) and viewed with a laser confocal microscope(BioRad Radiance 2000). The density of fluorescent myonucleiwas quantified in fibre segments 0.3–0.6·mm long using a z-series of 1·µm optical thick sections and LaserPix v.4.0software.
The growth model
The specific growth rate (GRt) for a period of time tisdefined as:
where M0 is the initial body mass and Mt is the mass aftert·days.
Mooij et al. (1994) modelled the expected instantaneousgrowth rate of a fish (dMˆ t/dt) as a temperature-dependentpower function of Mt as follows:
where the parameters are listed in Table·2. For constanttemperatures, Elliott (1975) gave the following mass–timefunction (equation·3) as a solution to equation·2:
where the expected mass after tdays, M̂t, can be calculatedgiven M0 and the other parameters. After a further t′days, theexpected mass will be given by:
Mooij et al. (1994) assumed that β had the value 0.6 andestimated the parameters αand γ by minimising the sum of thesquared differences between the log-transformed observed andpredicted masses as shown in equation·5, whereN is the
(4)M̂t+t′ = {M̂t1–β + t′(1 − β)[α + γ(T − Tavg)]} .1
1–β
(3)M̂t = {M01–β + t(1 − β)[α + γ(T − Tavg)]} ,1
1–β
(2)= [α + γ(T − Tavg)]Mtβ ,dM̂t
dt
(1)
Mt
M0GRt =
log
× 100 ,t
I. A. Johnston and others
1341Plasticity of muscle growth in salmon
number of fish and k is the number of observations for eachfish:
Rearranging equation 4 and using observed, rather thanpredicted, masses gives:
Thus, the change in mass from time tto t′ is a function of timet′, temperature and the growth rates αand γ.
A standard multiple regression equation has the form:
y = a + bx1 + cx2 + ε·, (7)
where y is the response term, x1 and x2 are the explanatoryvariables, a is the intercept, band c are the regressioncoefficients and εis the error, or residual, term.
Letting y=(Mt+t′1–β–Mt1–β)/(1–β), x1=t′ and x2=t′(T–Tavg)allows equation·6 to be specified as shown below in model 1:
y = αx1 + γx2 + ε·. (Model 1)
Here, we assume that the intercept term is zero so that whentime equals zero, the change in mass will also equal zero. Theregression coefficients of model 1 are the growth rates αandγ (defined in Table·2), and these can be estimated usingmultiple linear regression. The units of α and γare g1–β·day–1
and g1–β·day–1·deg.–1,·respectively. Models were fitted usingcomputer programmes written in R, an open source dialect ofS-plus.
Model 1 estimates a mean value of the growth rates α andγ, but a treatment effect can be included as shown in model 2:
y = αix1 + γix2 + ε·, (Model 2)
where i=1,...,n and n is the number of treatments. The changein mass is now a function of time, temperature, growth ratesand treatment. Analysis of variance (ANOVA) was used todetermine whether including a treatment effect significantlyimproved the fit of the model, thus indicating whether therewas a statistical difference in the growth rate between the
treatments. Similarly, the effects of the duplicate sea cages canbe assessed. In model 3, sea cage was included so that thegrowth rates αand γ were now functions of both treatment iand cage k:
y = αikx1 + γikx2 + ε·. (Model 3)
The parameter of interest is the growth rate αand this will varyfrom fish to fish. Thus, for an individual fish j, it can be thoughtof as being composed of a component due to treatment i, α i
from model 2 (or αik from model 3), plus a random component,Aj. Model 4 incorporates a random effect for fish:
y = (αi + Aj)x1 + γix2 + ε·. (Model 4)
The random component Aj can then be thought of as a randomvariable with a distribution that is assumed to be Normal witha mean of zero and a variance σ2A [Aj ~ N(0,σ2A)]. Essentially,the term αi is the mean growth rate for treatment i, and Aj
represents the difference between the growth rate of the jth fishand the mean growth rate for a fish. Thus, the change in massis expressed as a function of time, temperature, growth rates,treatment and fish. Model 4 also takes into account the repeatednature of the observations; the data consist of severalmeasurements on the same fish and so each growth period fora particular fish cannot strictly be treated as an independentpiece of information. Including fish as a random component inthis way takes the repeated measurement aspect into account.Since model 4 includes both random and fixed effects itrepresents a mixed-effects model.
Model 4 included a random fish effect for α but we wouldalso expect that γ, the change in instantaneous growth rate perunit change in temperature, varies randomly for each fish. Thisis included in model 5:
y = (αi + Aj)x1 + (γi + Gj)x2 + ε·, (Model 5)
where Gj is the random component and is distributed asN(0,σ2G).
Statistical analyses
The effect of treatment group on fibre number (FN) and themaximum fibre diameter in relation to age post-fertilisation wasinvestigated with a General Linear Model ANOVA with anormal error structure using sequential sums of squares(MinitabTM statistical software; Minitab Inc., State College,USA). The model fitted had treatment, age and an age–treatmentinteraction term as fixed factors. Cage was nested in treatment,with cage as a random effect and age post-fertilisation as acovariate. The FNdata were square-root transformed tonormalise the residuals. The effect of treatment and total musclecross-sectional area (TCA) on FNwas analysed using a similarmodel with a TCA3–treatment interaction term, and with TCAas a covariate with cage as a random factor nested in treatment.The data on the density of nuclei and c-met+ve cells wereanalysed using a one-way analysis of covariance (ANCOVA).Post-hoctesting was by Fisher’s least-significant difference test.Plots of residuals versusfitted values, normal probability versusresiduals and histograms of the residuals were examined for eachof the data sets.
(6)= αt′ + γt′(T − Tavg) .Mt+t′1–β − Mt1–β
1 − β
(5)[log(Mt) − log(M̂t)]2 .
N̂ k̂
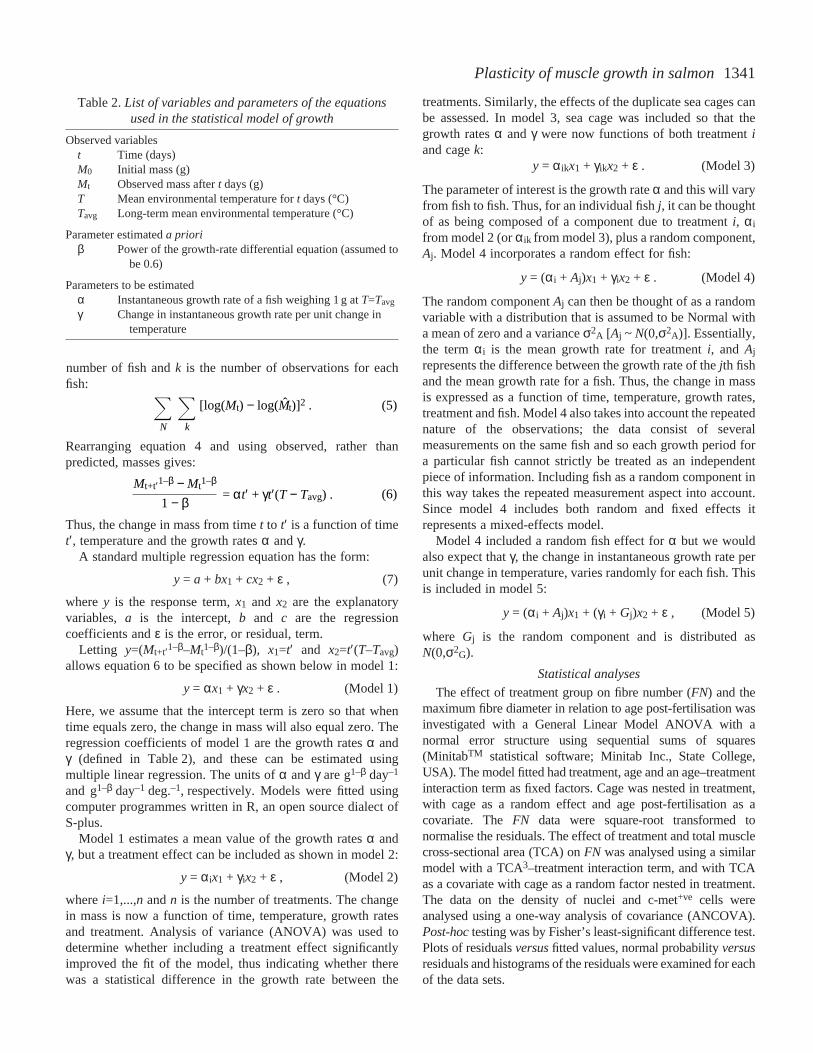
Table 2.List of variables and parameters of the equationsused in the statistical model of growth
Observed variablest Time (days)M0 Initial mass (g)Mt Observed mass after tdays (g)T Mean environmental temperature for tdays (°C)Tavg Long-term mean environmental temperature (°C)
Parameter estimated a prioriβ Power of the growth-rate differential equation (assumed to
be 0.6)
Parameters to be estimatedα Instantaneous growth rate of a fish weighing 1 g at T=Tavg
γ Change in instantaneous growth rate per unit change in temperature
1342
Nonparametric statistical techniques were used to fit smoothedprobability density functions to the measured diameters using akernel function as described in Bowman and Azzalini (1997).The application of these methods to the analysis of muscle fibrediameters has been described in detail previously (Johnston et al.,1999). Values for the smoothing parameter h (Bowman andAzzalini, 1997) were in the range of 0.13 to 0.20 with nosystematic differences between groups. Bootstrap techniqueswere used to distinguish underlying structure in the distributionsfrom random variation (Bowman and Azzalini, 1997; Davisonand Hinkley, 1997; Johnston et al., 1999). The Kolmogorov–Smirnov two-sample test statistic was used to test the nullhypothesis that the probability density functions of treatmentgroups were equal over all diameters. A Wilcoxen nonparametrictest was used to test the hypothesis that the median value of the50th percentile was equivalent between groups.
ResultsEffect of freshwater treatment on seawater growth
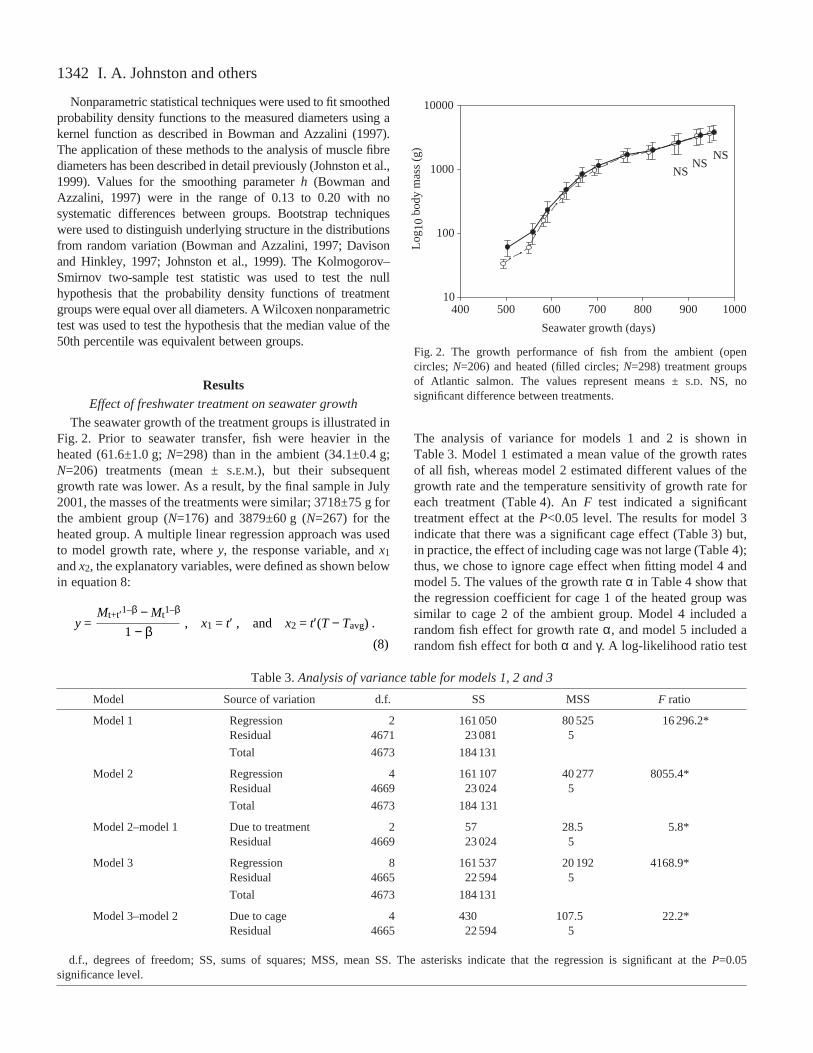
The seawater growth of the treatment groups is illustrated inFig.·2. Prior to seawater transfer, fish were heavier in theheated (61.6±1.0·g; N=298) than in the ambient (34.1±0.4·g;N=206) treatments (mean ±S.E.M.), but their subsequentgrowth rate was lower. As a result, by the final sample in July2001, the masses of the treatments were similar; 3718±75·g forthe ambient group (N=176) and 3879±60·g (N=267) for theheated group. A multiple linear regression approach was usedto model growth rate, where y, the response variable, and x1
and x2, the explanatory variables, were defined as shown belowin equation·8:
The analysis of variance for models 1 and 2 is shown inTable·3. Model 1 estimated a mean value of the growth ratesof all fish, whereas model 2 estimated different values of thegrowth rate and the temperature sensitivity of growth rate foreach treatment (Table·4). An Ftest indicated a significanttreatment effect at the P<0.05 level. The results for model 3indicate that there was a significant cage effect (Table·3) but,in practice, the effect of including cage was not large (Table·4);thus, we chose to ignore cage effect when fitting model 4 andmodel 5. The values of the growth rate α in Table·4 show thatthe regression coefficient for cage 1 of the heated group wassimilar to cage 2 of the ambient group. Model 4 included arandom fish effect for growth rate α, and model 5 included arandom fish effect for both αand γ. A log-likelihood ratio test(8)
, x1 = t′ , and x2 = t′(T − Tavg) .y =Mt+t′1–β − Mt1–β
1 − β
I. A. Johnston and others
Seawater growth (days)
400 500 600 700 800 900 1000
Log 1
0 bo
dy m
ass
(g)
10
100
1000
10000
NSNS
NS
Fig.·2. The growth performance of fish from the ambient (opencircles; N=206) and heated (filled circles; N=298) treatment groupsof Atlantic salmon. The values represent means ±S.D. NS, nosignificant difference between treatments.
Table 3.Analysis of variance table for models 1, 2 and 3
Model Source of variation d.f. SS MSS F ratio
Model 1 Regression 2 161 050 80 525 16 296.2*Residual 4671 23 081 5
Total 4673 184 131
Model 2 Regression 4 161 107 40 277 8055.4*Residual 4669 23 024 5
Total 4673 184 131
Model 2–model 1 Due to treatment 2 57 28.5 5.8*Residual 4669 23 024 5
Model 3 Regression 8 161 537 20 192 4168.9*Residual 4665 22 594 5
Total 4673 184 131
Model 3–model 2 Due to cage 4 430 107.5 22.2*Residual 4665 22 594 5
d.f., degrees of freedom; SS, sums of squares; MSS, mean SS. The asterisks indicate that the regression is significant at the P=0.05significance level.
1343Plasticity of muscle growth in salmon
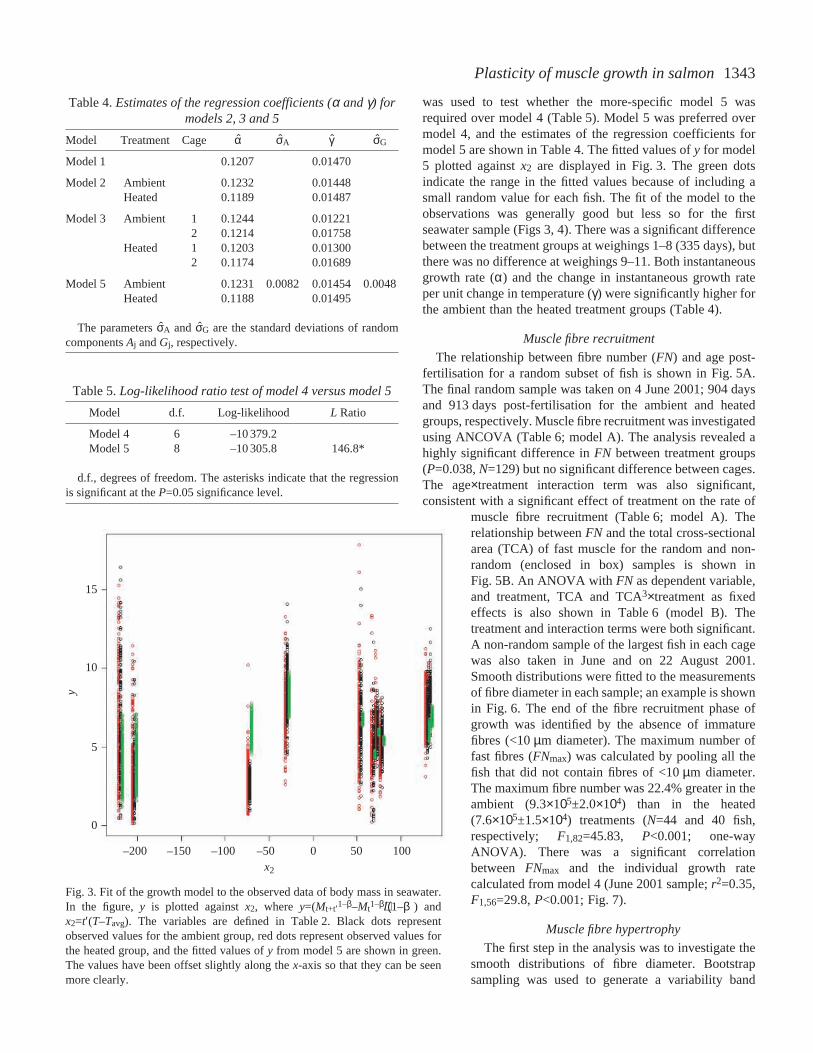
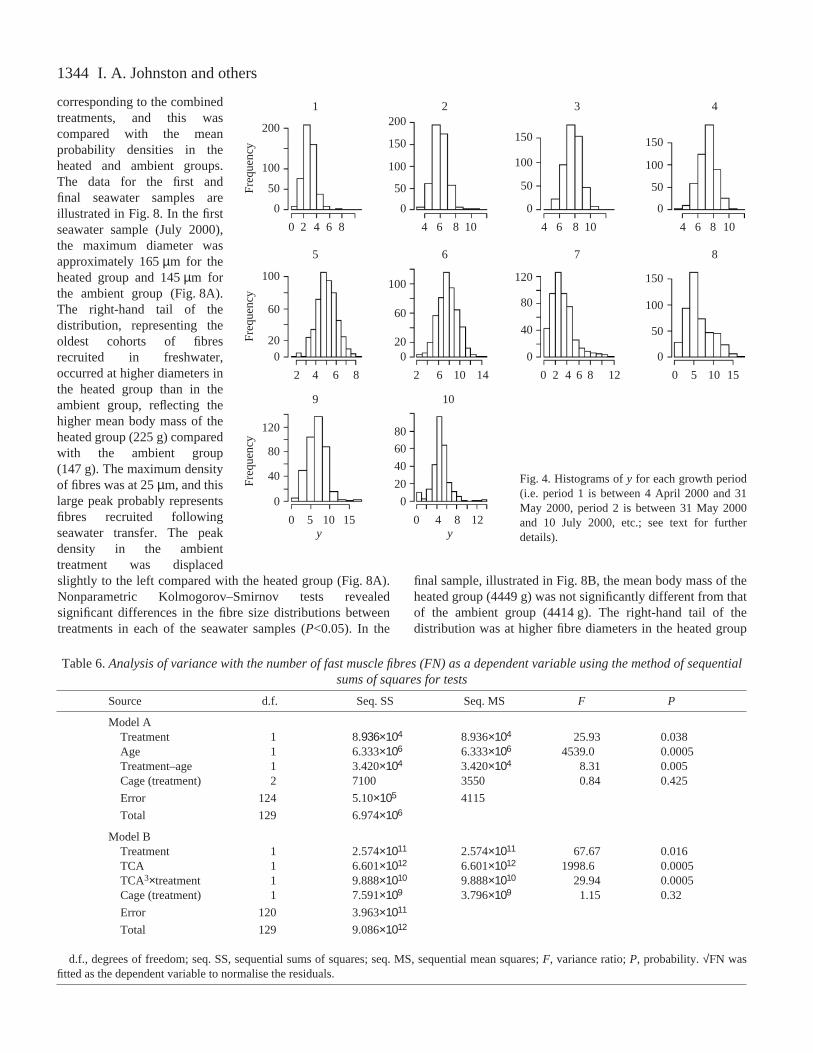
was used to test whether the more-specific model 5 wasrequired over model 4 (Table·5). Model 5 was preferred overmodel 4, and the estimates of the regression coefficients formodel 5 are shown in Table·4. The fitted values of y for model5 plotted against x2 are displayed in Fig.·3. The green dotsindicate the range in the fitted values because of including asmall random value for each fish. The fit of the model to theobservations was generally good but less so for the firstseawater sample (Figs·3, 4). There was a significant differencebetween the treatment groups at weighings 1–8 (335·days), butthere was no difference at weighings 9–11. Both instantaneousgrowth rate (α) and the change in instantaneous growth rateper unit change in temperature (γ) were significantly higher forthe ambient than the heated treatment groups (Table·4).
Muscle fibre recruitment
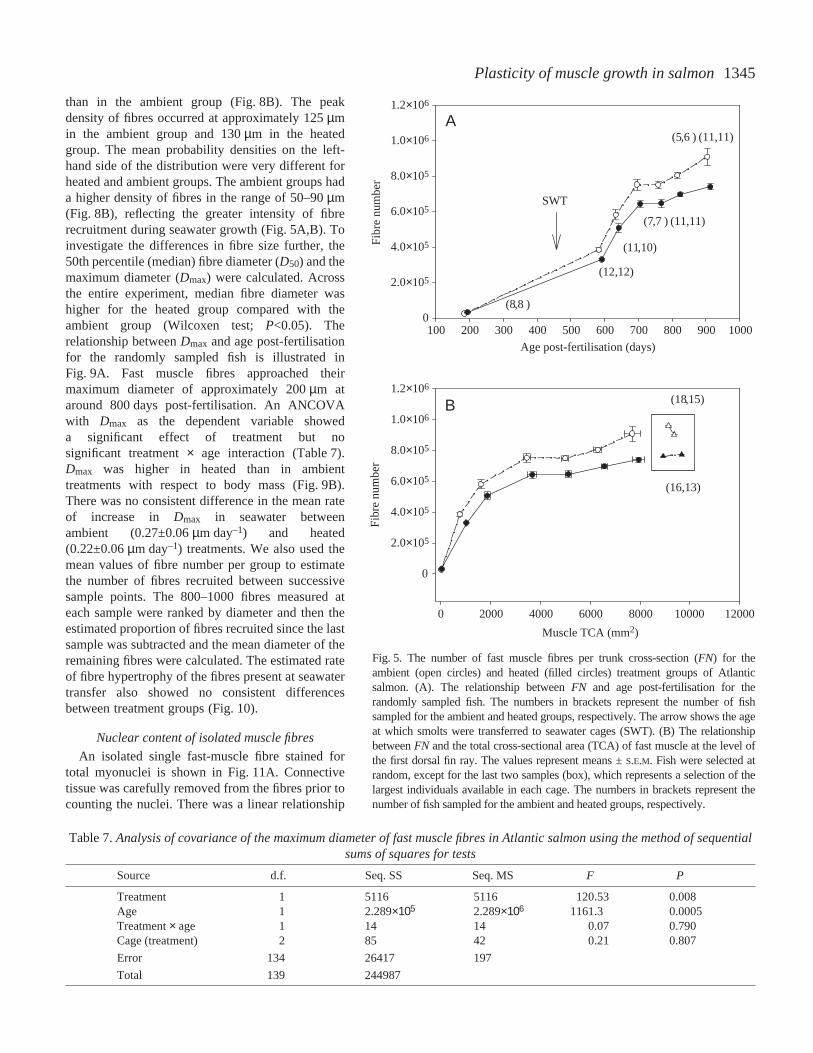
The relationship between fibre number (FN) and age post-fertilisation for a random subset of fish is shown in Fig.·5A.The final random sample was taken on 4 June 2001; 904·daysand 913·days post-fertilisation for the ambient and heatedgroups, respectively. Muscle fibre recruitment was investigatedusing ANCOVA (Table·6; model A). The analysis revealed ahighly significant difference in FN between treatment groups(P=0.038, N=129) but no significant difference between cages.The age×treatment interaction term was also significant,consistent with a significant effect of treatment on the rate of
muscle fibre recruitment (Table·6; model A). Therelationship between FNand the total cross-sectionalarea (TCA) of fast muscle for the random and non-random (enclosed in box) samples is shown inFig.·5B. An ANOVA with FN as dependent variable,and treatment, TCA and TCA3×treatment as fixedeffects is also shown in Table·6 (model B). Thetreatment and interaction terms were both significant.A non-random sample of the largest fish in each cagewas also taken in June and on 22 August 2001.Smooth distributions were fitted to the measurementsof fibre diameter in each sample; an example is shownin Fig.·6. The end of the fibre recruitment phase ofgrowth was identified by the absence of immaturefibres (<10·µm diameter). The maximum number offast fibres (FNmax) was calculated by pooling all thefish that did not contain fibres of <10·µm diameter.The maximum fibre number was 22.4% greater in theambient (9.3×10⁵±2.0×10⁴) than in the heated(7.6×10⁵±1.5×10⁴) treatments (N=44 and 40 fish,respectively; F1,82=45.83, P<0.001; one-wayANOVA). There was a significant correlationbetween FNmax and the individual growth ratecalculated from model 4 (June 2001 sample; r2=0.35,F1,56=29.8, P<0.001; Fig.·7).
Muscle fibre hypertrophy
The first step in the analysis was to investigate thesmooth distributions of fibre diameter. Bootstrapsampling was used to generate a variability band
Table 4.Estimates of the regression coefficients (α and γ) formodels 2, 3 and 5
Model Treatment Cage α̂ σ̂A γ̂ σ̂G
Model 1 0.1207 0.01470
Model 2 Ambient 0.1232 0.01448Heated 0.1189 0.01487
Model 3 Ambient 1 0.1244 0.012212 0.1214 0.01758
Heated 1 0.1203 0.013002 0.1174 0.01689
Model 5 Ambient 0.1231 0.0082 0.01454 0.0048Heated 0.1188 0.01495
The parameters σˆA and σ̂G are the standard deviations of randomcomponents Aj and Gj, respectively.
Table 5.Log-likelihood ratio test of model 4 versus model 5
Model d.f. Log-likelihood L Ratio
Model 4 6 –10 379.2Model 5 8 –10 305.8 146.8*
d.f., degrees of freedom. The asterisks indicate that the regressionis significant at the P=0.05 significance level.
15
10
–200 –100x2
–150 –50 0 50 100
y
5
0
Fig.·3. Fit of the growth model to the observed data of body mass in seawater.In the figure, y is plotted against x2, where y=(Mt+t′1–β–Mt1–β)/(1–β) andx2=t′(T–Tavg). The variables are defined in Table·2. Black dots representobserved values for the ambient group, red dots represent observed values forthe heated group, and the fitted values of y from model 5 are shown in green.The values have been offset slightly along the x-axis so that they can be seenmore clearly.
1344
corresponding to the combinedtreatments, and this wascompared with the meanprobability densities in theheated and ambient groups.The data for the first andfinal seawater samples areillustrated in Fig.·8. In the firstseawater sample (July 2000),the maximum diameter wasapproximately 165·µm for theheated group and 145·µm forthe ambient group (Fig.·8A).The right-hand tail of thedistribution, representing theoldest cohorts of fibresrecruited in freshwater,occurred at higher diameters inthe heated group than in theambient group, reflecting thehigher mean body mass of theheated group (225·g) comparedwith the ambient group(147·g). The maximum densityof fibres was at 25·µm, and thislarge peak probably representsfibres recruited followingseawater transfer. The peakdensity in the ambienttreatment was displacedslightly to the left compared with the heated group (Fig.·8A).Nonparametric Kolmogorov–Smirnov tests revealedsignificant differences in the fibre size distributions betweentreatments in each of the seawater samples (P<0.05). In the
final sample, illustrated in Fig.·8B, the mean body mass of theheated group (4449·g) was not significantly different from thatof the ambient group (4414·g). The right-hand tail of thedistribution was at higher fibre diameters in the heated group
I. A. Johnston and others
200
Fre
quen
cy
100
50
0
0
1 2 3 4
2 4 6 8
200
150
100
50
0
104 6 8
150
100
50
0
104 6 8
150
100
50
0
104 6 8
100
Fre
quen
cy
60
200
5 6 7 8
y y
2 4 6 8
100
60
200
142 6 10
120
Fre
quen
cy
80
40
0
9 10
0 5 10 15
80
60
40
20
0
120 4 8
120
80
40
0
12420 6 8
150
100
50
0
150 5 10
Table 6.Analysis of variance with the number of fast muscle fibres (FN) as a dependent variable using the method of sequentialsums of squares for tests
Source d.f. Seq. SS Seq. MS F P
Model ATreatment 1 8.936×10⁴ 8.936×10⁴ 25.93 0.038Age 1 6.333×10⁶ 6.333×10⁶ 4539.0 0.0005Treatment–age 1 3.420×10⁴ 3.420×10⁴ 8.31 0.005Cage (treatment) 2 7100 3550 0.84 0.425
Error 124 5.10×10⁵ 4115
Total 129 6.974×10⁶
Model BTreatment 1 2.574×10¹¹ 2.574×10¹¹ 67.67 0.016TCA 1 6.601×10¹² 6.601×10¹² 1998.6 0.0005TCA3×treatment 1 9.888×10¹⁰ 9.888×10¹⁰ 29.94 0.0005Cage (treatment) 1 7.591×10⁹ 3.796×10⁹ 1.15 0.32
Error 120 3.963×10¹¹
Total 129 9.086×10¹²
d.f., degrees of freedom; seq. SS, sequential sums of squares; seq. MS, sequential mean squares; F, variance ratio; P, probability. √FN wasfitted as the dependent variable to normalise the residuals.
Fig.·4. Histograms of yfor each growth period(i.e. period 1 is between 4 April 2000 and 31May 2000, period 2 is between 31 May 2000and 10 July 2000, etc.; see text for furtherdetails).
1345Plasticity of muscle growth in salmon
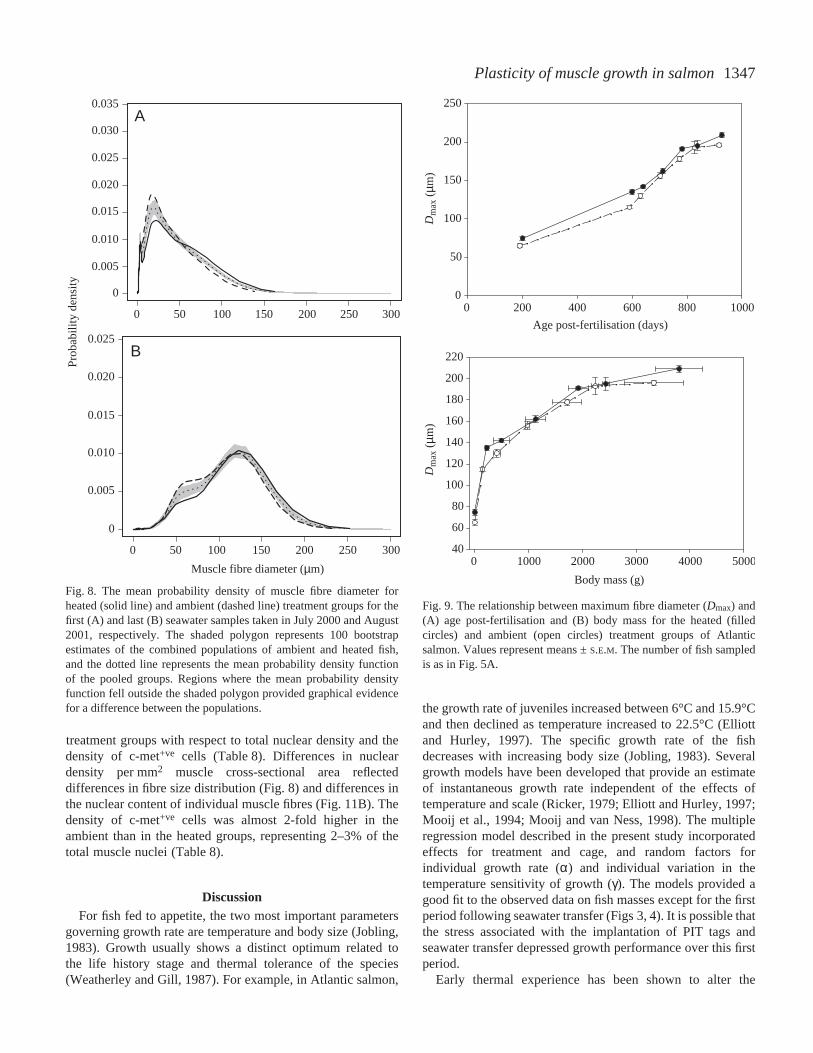
than in the ambient group (Fig.·8B). The peakdensity of fibres occurred at approximately 125·µmin the ambient group and 130·µm in the heatedgroup. The mean probability densities on the left-hand side of the distribution were very different forheated and ambient groups. The ambient groups hada higher density of fibres in the range of 50–90·µm(Fig.·8B), reflecting the greater intensity of fibrerecruitment during seawater growth (Fig.·5A,B). Toinvestigate the differences in fibre size further, the50th percentile (median) fibre diameter (D50) and themaximum diameter (Dmax) were calculated. Acrossthe entire experiment, median fibre diameter washigher for the heated group compared with theambient group (Wilcoxen test; P<0.05). Therelationship between Dmax and age post-fertilisationfor the randomly sampled fish is illustrated inFig.·9A. Fast muscle fibres approached theirmaximum diameter of approximately 200·µm ataround 800·days post-fertilisation. An ANCOVAwith Dmax as the dependent variable showeda significant effect of treatment but nosignificant treatment × age interaction (Table·7).Dmax was higher in heated than in ambienttreatments with respect to body mass (Fig.·9B).There was no consistent difference in the mean rateof increase in Dmax in seawater betweenambient (0.27±0.06·µm·day–1) and heated(0.22±0.06·µm·day–1) treatments. We also used themean values of fibre number per group to estimatethe number of fibres recruited between successivesample points. The 800–1000 fibres measured ateach sample were ranked by diameter and then theestimated proportion of fibres recruited since the lastsample was subtracted and the mean diameter of theremaining fibres were calculated. The estimated rateof fibre hypertrophy of the fibres present at seawatertransfer also showed no consistent differencesbetween treatment groups (Fig.·10).
Nuclear content of isolated muscle fibres
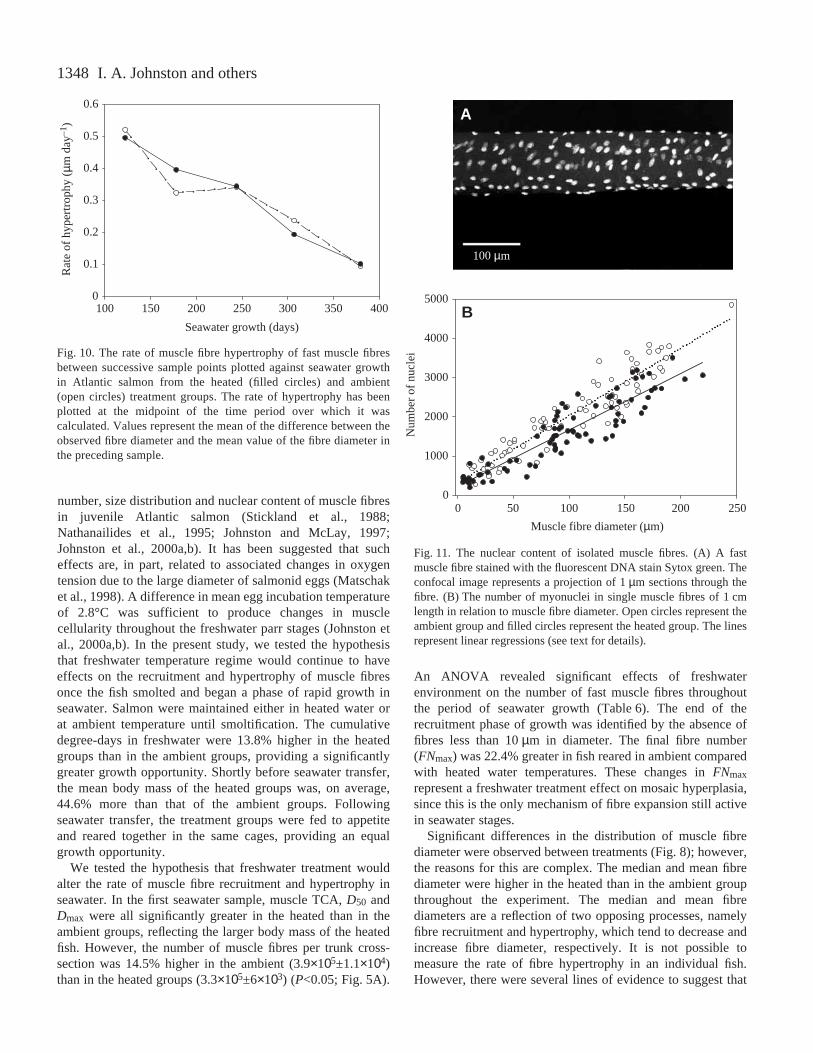
An isolated single fast-muscle fibre stained fortotal myonuclei is shown in Fig.·11A. Connectivetissue was carefully removed from the fibres prior tocounting the nuclei. There was a linear relationship
Age post-fertilisation (days)
100 200 300 400 500 600 700 800 900 1000
Fib
re n
umbe
r
0
2.0×10⁵
4.0×10⁵
6.0×10⁵
8.0×10⁵
1.0×10⁶
1.2×10⁶
SWT
Muscle TCA (mm2)
0 2000 4000 6000 8000 10000 12000
Fib
re n
umbe
r
0
2.0×10⁵
4.0×10⁵
6.0×10⁵
8.0×10⁵
1.0×10⁶
1.2×10⁶
A
B
(8,8 )
(12,12)
(11,10)
(7,7 ) (11,11)
(5,6 ) (11,11)
(18,15)
(16,13)
Fig.·5. The number of fast muscle fibres per trunk cross-section (FN) for theambient (open circles) and heated (filled circles) treatment groups of Atlanticsalmon. (A). The relationship between FN and age post-fertilisation for therandomly sampled fish. The numbers in brackets represent the number of fishsampled for the ambient and heated groups, respectively. The arrow shows the ageat which smolts were transferred to seawater cages (SWT). (B) The relationshipbetween FN and the total cross-sectional area (TCA) of fast muscle at the level ofthe first dorsal fin ray. The values represent means ±S.E.M. Fish were selected atrandom, except for the last two samples (box), which represents a selection of thelargest individuals available in each cage. The numbers in brackets represent thenumber of fish sampled for the ambient and heated groups, respectively.
Table 7.Analysis of covariance of the maximum diameter of fast muscle fibres in Atlantic salmon using the method of sequentialsums of squares for tests
Source d.f. Seq. SS Seq. MS F P
Treatment 1 5116 5116 120.53 0.008Age 1 2.289×10⁵ 2.289×10⁶ 1161.3 0.0005Treatment ×age 1 14 14 0.07 0.790Cage (treatment) 2 85 42 0.21 0.807
Error 134 26417 197
Total 139 244987
1346
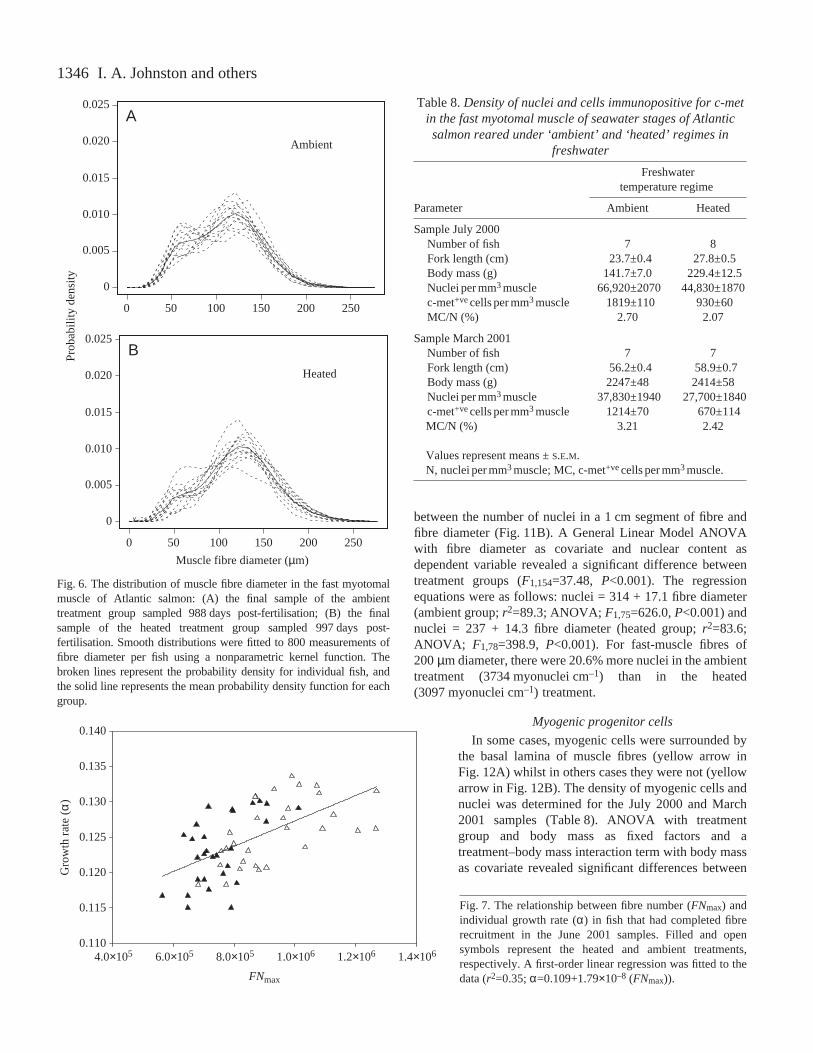
between the number of nuclei in a 1·cm segment of fibre andfibre diameter (Fig.·11B). A General Linear Model ANOVAwith fibre diameter as covariate and nuclear content asdependent variable revealed a significant difference betweentreatment groups (F1,154=37.48, P<0.001). The regressionequations were as follows: nuclei = 314 + 17.1 fibre diameter(ambient group; r2=89.3; ANOVA; F1,75=626.0, P<0.001) andnuclei = 237 + 14.3 fibre diameter (heated group; r2=83.6;ANOVA; F1,78=398.9, P<0.001). For fast-muscle fibres of200·µm diameter, there were 20.6% more nuclei in the ambienttreatment (3734·myonuclei·cm–1) than in the heated(3097·myonuclei·cm–1) treatment.
Myogenic progenitor cells
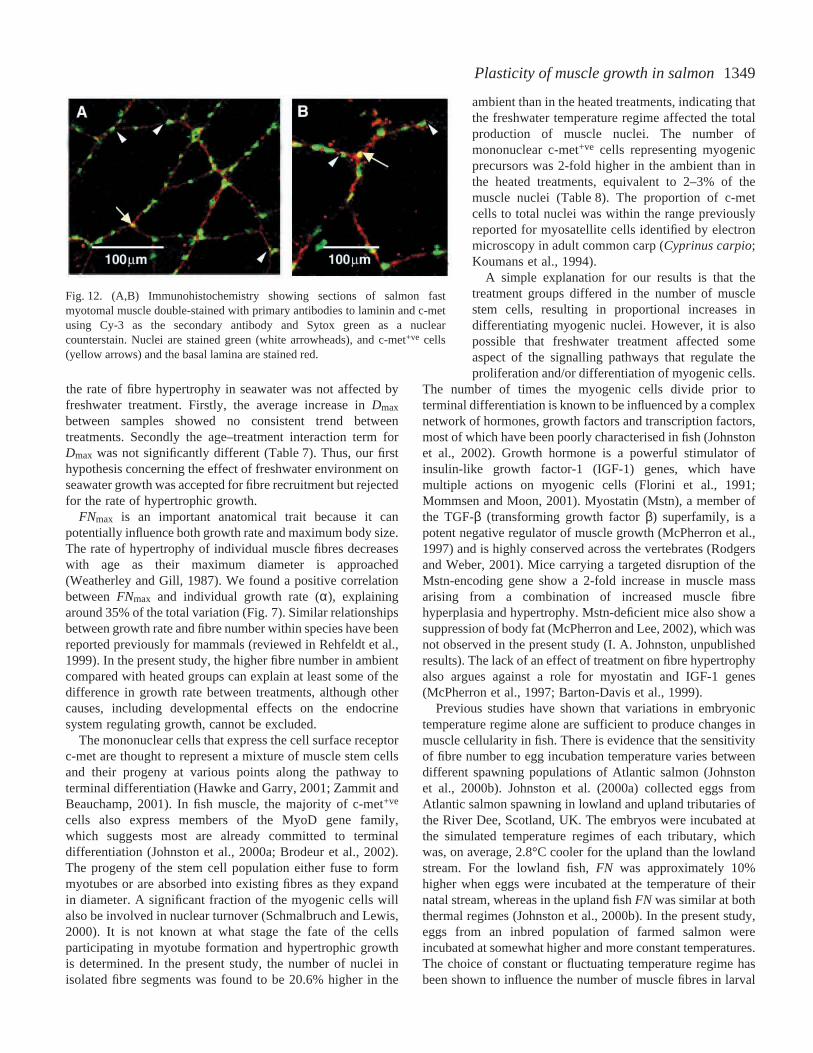
In some cases, myogenic cells were surrounded bythe basal lamina of muscle fibres (yellow arrow inFig.·12A) whilst in others cases they were not (yellowarrow in Fig.·12B). The density of myogenic cells andnuclei was determined for the July 2000 and March2001 samples (Table·8). ANOVA with treatmentgroup and body mass as fixed factors and atreatment–body mass interaction term with body massas covariate revealed significant differences between
I. A. Johnston and others
Heated
Ambient
Muscle fibre diameter (µm)
Pro
babi
lity
dens
ity
A
B
0.025
0.020
0.015
0.010
0.005
0
0.025
0.020
0.015
0.010
0.005
0
0 50 100 150 200 250
0 50 100 150 200 250
Fig.·6. The distribution of muscle fibre diameter in the fast myotomalmuscle of Atlantic salmon: (A) the final sample of the ambienttreatment group sampled 988·days post-fertilisation; (B) the finalsample of the heated treatment group sampled 997·days post-fertilisation. Smooth distributions were fitted to 800 measurements offibre diameter per fish using a nonparametric kernel function. Thebroken lines represent the probability density for individual fish, andthe solid line represents the mean probability density function for eachgroup.
FNmax
4.0×10⁵ 6.0×10⁵ 8.0×10⁵ 1.0×10⁶ 1.2×10⁶ 1.4×10⁶
Gro
wth
rat
e (α)
0.110
0.115
0.120
0.125
0.130
0.135
0.140
Table 8.Density of nuclei and cells immunopositive for c-metin the fast myotomal muscle of seawater stages of Atlanticsalmon reared under ‘ambient’ and ‘heated’ regimes in
freshwater
Freshwater temperature regime
Parameter Ambient Heated
Sample July 2000Number of fish 7 8Fork length (cm) 23.7±0.4 27.8±0.5Body mass (g) 141.7±7.0 229.4±12.5Nuclei per mm3muscle 66,920±2070 44,830±1870c-met+vecells per mm3muscle 1819±110 930±60MC/N (%) 2.70 2.07
Sample March 2001Number of fish 7 7Fork length (cm) 56.2±0.4 58.9±0.7Body mass (g) 2247±48 2414±58Nuclei per mm3muscle 37,830±1940 27,700±1840c-met+vecells per mm3muscle 1214±70 670±114MC/N (%) 3.21 2.42
Values represent means ±S.E.M. N, nuclei per mm3muscle; MC, c-met+vecells per mm3muscle.
Fig.·7. The relationship between fibre number (FNmax) andindividual growth rate (α) in fish that had completed fibrerecruitment in the June 2001 samples. Filled and opensymbols represent the heated and ambient treatments,respectively. A first-order linear regression was fitted to thedata (r2=0.35; α=0.109+1.79×10⁻⁸ (FNmax)).
1347Plasticity of muscle growth in salmon
treatment groups with respect to total nuclear density and thedensity of c-met+ve cells (Table·8). Differences in nucleardensity per·mm2 muscle cross-sectional area reflecteddifferences in fibre size distribution (Fig.·8) and differences inthe nuclear content of individual muscle fibres (Fig.·11B). Thedensity of c-met+ve cells was almost 2-fold higher in theambient than in the heated groups, representing 2–3% of thetotal muscle nuclei (Table·8).
DiscussionFor fish fed to appetite, the two most important parameters
governing growth rate are temperature and body size (Jobling,1983). Growth usually shows a distinct optimum related tothe life history stage and thermal tolerance of the species(Weatherley and Gill, 1987). For example, in Atlantic salmon,
the growth rate of juveniles increased between 6°C and 15.9°Cand then declined as temperature increased to 22.5°C (Elliottand Hurley, 1997). The specific growth rate of the fishdecreases with increasing body size (Jobling, 1983). Severalgrowth models have been developed that provide an estimateof instantaneous growth rate independent of the effects oftemperature and scale (Ricker, 1979; Elliott and Hurley, 1997;Mooij et al., 1994; Mooij and van Ness, 1998). The multipleregression model described in the present study incorporatedeffects for treatment and cage, and random factors forindividual growth rate (α) and individual variation in thetemperature sensitivity of growth (γ). The models provided agood fit to the observed data on fish masses except for the firstperiod following seawater transfer (Figs·3, 4). It is possible thatthe stress associated with the implantation of PIT tags andseawater transfer depressed growth performance over this firstperiod.
Early thermal experience has been shown to alter the
Muscle fibre diameter (µm)
Pro
babi
lity
dens
ity
A
B
0.035
0.025
0.020
0.030
0.015
0.010
0.005
0
0.025
0.020
0.015
0.010
0.005
0
0 50 100 150 200 250 300
0 50 100 150 200 250 300
Fig.·8. The mean probability density of muscle fibre diameter forheated (solid line) and ambient (dashed line) treatment groups for thefirst (A) and last (B) seawater samples taken in July 2000 and August2001, respectively. The shaded polygon represents 100 bootstrapestimates of the combined populations of ambient and heated fish,and the dotted line represents the mean probability density functionof the pooled groups. Regions where the mean probability densityfunction fell outside the shaded polygon provided graphical evidencefor a difference between the populations.
Age post-fertilisation (days)
0 200 400 600 800 1000
Dm
ax (
µm)
Dm
ax (
µm)
0
50
100
150
200
250
Body mass (g)
0 1000 2000 3000 4000 500040
60
80
100
120
140
160
180
200
220
Fig.·9. The relationship between maximum fibre diameter (Dmax) and(A) age post-fertilisation and (B) body mass for the heated (filledcircles) and ambient (open circles) treatment groups of Atlanticsalmon. Values represent means ±S.E.M. The number of fish sampledis as in Fig.·5A.
1348
number, size distribution and nuclear content of muscle fibresin juvenile Atlantic salmon (Stickland et al., 1988;Nathanailides et al., 1995; Johnston and McLay, 1997;Johnston et al., 2000a,b). It has been suggested that sucheffects are, in part, related to associated changes in oxygentension due to the large diameter of salmonid eggs (Matschaket al., 1998). A difference in mean egg incubation temperatureof 2.8°C was sufficient to produce changes in musclecellularity throughout the freshwater parr stages (Johnston etal., 2000a,b). In the present study, we tested the hypothesisthat freshwater temperature regime would continue to haveeffects on the recruitment and hypertrophy of muscle fibresonce the fish smolted and began a phase of rapid growth inseawater. Salmon were maintained either in heated water orat ambient temperature until smoltification. The cumulativedegree-days in freshwater were 13.8% higher in the heatedgroups than in the ambient groups, providing a significantlygreater growth opportunity. Shortly before seawater transfer,the mean body mass of the heated groups was, on average,44.6% more than that of the ambient groups. Followingseawater transfer, the treatment groups were fed to appetiteand reared together in the same cages, providing an equalgrowth opportunity.
We tested the hypothesis that freshwater treatment wouldalter the rate of muscle fibre recruitment and hypertrophy inseawater. In the first seawater sample, muscle TCA, D50 andDmax were all significantly greater in the heated than in theambient groups, reflecting the larger body mass of the heatedfish. However, the number of muscle fibres per trunk cross-section was 14.5% higher in the ambient (3.9×10⁵±1.1×10⁴)than in the heated groups (3.3×10⁵±6×10³) (P<0.05; Fig.·5A).
An ANOVA revealed significant effects of freshwaterenvironment on the number of fast muscle fibres throughoutthe period of seawater growth (Table·6). The end of therecruitment phase of growth was identified by the absence offibres less than 10·µm in diameter. The final fibre number(FNmax) was 22.4% greater in fish reared in ambient comparedwith heated water temperatures. These changes in FNmax
represent a freshwater treatment effect on mosaic hyperplasia,since this is the only mechanism of fibre expansion still activein seawater stages.
Significant differences in the distribution of muscle fibrediameter were observed between treatments (Fig.·8); however,the reasons for this are complex. The median and mean fibrediameter were higher in the heated than in the ambient groupthroughout the experiment. The median and mean fibrediameters are a reflection of two opposing processes, namelyfibre recruitment and hypertrophy, which tend to decrease andincrease fibre diameter, respectively. It is not possible tomeasure the rate of fibre hypertrophy in an individual fish.However, there were several lines of evidence to suggest that
I. A. Johnston and others
Seawater growth (days)
100 150 200 250 300 350 400
Rat
e of
hyp
ertr
ophy
(µm
day
–1)
0
0.1
0.2
0.3
0.4
0.5
0.6
Fig.·10. The rate of muscle fibre hypertrophy of fast muscle fibresbetween successive sample points plotted against seawater growthin Atlantic salmon from the heated (filled circles) and ambient(open circles) treatment groups. The rate of hypertrophy has beenplotted at the midpoint of the time period over which it wascalculated. Values represent the mean of the difference between theobserved fibre diameter and the mean value of the fibre diameter inthe preceding sample.
Muscle fibre diameter (µm)
0 50 100 150 200 250
Num
ber
of n
ucle
i
0
1000
2000
3000
4000
5000B
A
100 µm
Fig.·11. The nuclear content of isolated muscle fibres. (A) A fastmuscle fibre stained with the fluorescent DNA stain Sytox green. Theconfocal image represents a projection of 1·µm sections through thefibre. (B) The number of myonuclei in single muscle fibres of 1·cmlength in relation to muscle fibre diameter. Open circles represent theambient group and filled circles represent the heated group. The linesrepresent linear regressions (see text for details).
1349Plasticity of muscle growth in salmon
the rate of fibre hypertrophy in seawater was not affected byfreshwater treatment. Firstly, the average increase in Dmax
between samples showed no consistent trend betweentreatments. Secondly the age–treatment interaction term forDmax was not significantly different (Table·7). Thus, our firsthypothesis concerning the effect of freshwater environment onseawater growth was accepted for fibre recruitment but rejectedfor the rate of hypertrophic growth.
FNmax is an important anatomical trait because it canpotentially influence both growth rate and maximum body size.The rate of hypertrophy of individual muscle fibres decreaseswith age as their maximum diameter is approached(Weatherley and Gill, 1987). We found a positive correlationbetween FNmax and individual growth rate (α), explainingaround 35% of the total variation (Fig.·7). Similar relationshipsbetween growth rate and fibre number within species have beenreported previously for mammals (reviewed in Rehfeldt et al.,1999). In the present study, the higher fibre number in ambientcompared with heated groups can explain at least some of thedifference in growth rate between treatments, although othercauses, including developmental effects on the endocrinesystem regulating growth, cannot be excluded.
The mononuclear cells that express the cell surface receptorc-met are thought to represent a mixture of muscle stem cellsand their progeny at various points along the pathway toterminal differentiation (Hawke and Garry, 2001; Zammit andBeauchamp, 2001). In fish muscle, the majority of c-met+ve
cells also express members of the MyoD gene family,which suggests most are already committed to terminaldifferentiation (Johnston et al., 2000a; Brodeur et al., 2002).The progeny of the stem cell population either fuse to formmyotubes or are absorbed into existing fibres as they expandin diameter. A significant fraction of the myogenic cells willalso be involved in nuclear turnover (Schmalbruch and Lewis,2000). It is not known at what stage the fate of the cellsparticipating in myotube formation and hypertrophic growthis determined. In the present study, the number of nuclei inisolated fibre segments was found to be 20.6% higher in the
ambient than in the heated treatments, indicating thatthe freshwater temperature regime affected the totalproduction of muscle nuclei. The number ofmononuclear c-met+ve cells representing myogenicprecursors was 2-fold higher in the ambient than inthe heated treatments, equivalent to 2–3% of themuscle nuclei (Table·8). The proportion of c-metcells to total nuclei was within the range previouslyreported for myosatellite cells identified by electronmicroscopy in adult common carp (Cyprinus carpio;Koumans et al., 1994).
A simple explanation for our results is that thetreatment groups differed in the number of musclestem cells, resulting in proportional increases indifferentiating myogenic nuclei. However, it is alsopossible that freshwater treatment affected someaspect of the signalling pathways that regulate theproliferation and/or differentiation of myogenic cells.
The number of times the myogenic cells divide prior toterminal differentiation is known to be influenced by a complexnetwork of hormones, growth factors and transcription factors,most of which have been poorly characterised in fish (Johnstonet al., 2002). Growth hormone is a powerful stimulator ofinsulin-like growth factor-1 (IGF-1) genes, which havemultiple actions on myogenic cells (Florini et al., 1991;Mommsen and Moon, 2001). Myostatin (Mstn), a member ofthe TGF-β(transforming growth factor β) superfamily, is apotent negative regulator of muscle growth (McPherron et al.,1997) and is highly conserved across the vertebrates (Rodgersand Weber, 2001). Mice carrying a targeted disruption of theMstn-encoding gene show a 2-fold increase in muscle massarising from a combination of increased muscle fibrehyperplasia and hypertrophy. Mstn-deficient mice also show asuppression of body fat (McPherron and Lee, 2002), which wasnot observed in the present study (I. A. Johnston, unpublishedresults). The lack of an effect of treatment on fibre hypertrophyalso argues against a role for myostatin and IGF-1 genes(McPherron et al., 1997; Barton-Davis et al., 1999).
Previous studies have shown that variations in embryonictemperature regime alone are sufficient to produce changes inmuscle cellularity in fish. There is evidence that the sensitivityof fibre number to egg incubation temperature varies betweendifferent spawning populations of Atlantic salmon (Johnstonet al., 2000b). Johnston et al. (2000a) collected eggs fromAtlantic salmon spawning in lowland and upland tributaries ofthe River Dee, Scotland, UK. The embryos were incubated atthe simulated temperature regimes of each tributary, whichwas, on average, 2.8°C cooler for the upland than the lowlandstream. For the lowland fish, FN was approximately 10%higher when eggs were incubated at the temperature of theirnatal stream, whereas in the upland fish FN was similar at boththermal regimes (Johnston et al., 2000b). In the present study,eggs from an inbred population of farmed salmon wereincubated at somewhat higher and more constant temperatures.The choice of constant or fluctuating temperature regime hasbeen shown to influence the number of muscle fibres in larval
Fig.·12. (A,B) Immunohistochemistry showing sections of salmon fastmyotomal muscle double-stained with primary antibodies to laminin and c-metusing Cy-3 as the secondary antibody and Sytox green as a nuclearcounterstain. Nuclei are stained green (white arrowheads), and c-met+ve cells(yellow arrows) and the basal lamina are stained red.
1350
pearl fish (Stoiber et al., 2002). Without information on theshape of the reaction norm relating fibre number todevelopment temperature, it is difficult to interpret differencesin the direction of responses among studies. For example, abell-shaped reaction norm could produce either an increase, adecrease or no change in fibre number depending on where onthe temperature range the eggs were incubated.
It has been estimated that approximately one-third of thevariation in fibre number in limb muscles of the pig isphenotypic and not related to genetic origin (Rehfeldt et al.,1999). Several studies have shown that in mammals poormaternal nutrition causes a low birth mass and a reduction ofthe number of secondary myotubes, resulting in a permanentreduction in the number of muscle fibres (Wilson et al., 1988;Dwyer et al., 1995). Developmental plasticity of musclegrowth has been reported previously in birds prior to theestablishment of effective thermoregulation. In this case, mildheat exposure in young broiler chickens (Gallus domesticus)resulted in a transient growth halt followed by immediatecompensatory growth (Yahav and Hurwitz, 1996). Suchthermal conditioning was associated with an immediateincrease in circulating IGF-1 concentration followed bysatellite cell proliferation (Halevy et al., 2001).
The temperature prior to hatching is critical for determiningthe number of myogenic cells (Johnston et al., 2000a) and fibrenumber post-hatch in Atlantic salmon (Stickland et al., 1988;Johnston and McLay, 1997; Johnston et al., 2000b). Adverseconditions during early development have a negative impacton subsequent growth in a wide range of species (Lindström,1999). The present study found that FNmax was reduced by18.3% for a relatively modest rise in temperature duringfreshwater development. The heated treatment could not beconsidered stressful since growth was increased relative to theambient group. Such phenotypic variation in FNmax in fish forecologically relevant temperature changes has the potential toinfluence a range of life history characteristics, includinggrowth rate and ultimate body size. However, an effect ofFNmaxon ultimate size would require an independence of fibrenumber and size. Studies in mammals suggest that this may notbe the case because in animals that have stopped growing, fibrenumber and mean diameter are inversely correlated (Rehfeldtet al., 1999). Developmental plasticity in growth characteristicsmay be relatively commonplace in ectotherms. For example,egg incubation temperature was shown to influence subsequentgrowth rate and body size at defined developmental stages inlizards (Braña and Ji, 2000) and turtles (O’Steen, 1998; Rhenand Lang, 1999), although in these studies the effects onmuscle fibre number were not investigated.
This work was supported by an industry LINK grant fromthe Biotechnology & Biological Sciences (49/LKD12865).We are grateful to Pinney’s of Scotland and AKVAsmart UKfor financial support, with special thanks to Alistair Dingwelland David Whyte for their contributions to projectmanagement. We thank Mr Ron Stuart for expert technicalassistance.
ReferencesAbercrombie, M. (1946). Estimation of nuclear population from microtome
sections. Anat Rec. 94, 239-247.Ayala, M. D., López-Albors, O., Gil, F., García-Alcázar, A., Abellán, E.,
Alarcón, J. A., Alvarez, M. C., Ramírez-Zarosa, G. R. and Moreno, F.(2001). Temperature effects on muscle growth in two populations (Atlanticand Mediterranean) of sea bass, Dicentrarchus labraxL. Aquaculture101,359-370.
Barresi, M. J. F., D’Angelo, J. A., Herandez, P. and Devoto, S. H. (2001).Distinct mechanisms regulate slow-muscle development. Curr. Biol.11,1432-1438.
Barton-Davis, E. R., Shoturma, D. I. and Sweeney, H. L. (1999).Contribution of satellite cells to IGF-1-induced hypertrophy of skeletalmuscle. Acta Physiol. Scand.167, 301-305.
Bowman, A. W. and Azzalini, A. (1997). Applied Smoothing Techniques forData Analysis. The Kernel Approach With S-Plus Illustrations. OxfordScience Publications. Oxford: Oxford University Press.
Braña, F. and Ji, X. (2000). Influence of incubation temperature onmorphology, locomotor performance and early growth of hatching walllizards (Podarcis muralis). J. Exp. Zool. 286, 422-433.
Brodeur, J. C., Peck, L. S. and Johnston, I. A. (2002). Feeding increasesMyoD and PCNA expression in myogenic progenitor cells of Nototheniacoriiceps. J. Fish Biol. 60, 1475-1485.
Brooks, S. and Johnston, I. A. (1993). Influence of development and rearingtemperature on the distribution, ultrastructure and myosin sub-unitcomposition of myotomal muscle fibre types in the plaice Pleuronectesplatessa. Mar. Biol. 117, 501-513.
Calvo, J. (1989). Sexual differences in the increase of white muscle fibres inArgentine hake, Merluccius hubbsi, from the San Matias Gulf (Argentina).J. Fish Biol.35, 207-214.
Cornelison, D. D. W. and Wold, B. J. (1997). Single-cell analysis ofregulatory gene expression in quiescent and activated mouse skeletal musclesatellite cells. Dev. Biol. 191, 270-283.
Davison, A. C. and Hinkley, D. V.(1997). Bootstrap Methods and TheirApplications. Cambridge: Cambridge University Press.
Devoto, S. H., Melancon, E., Eisen, J. S. and Westerfield, M. (1996).Identification of separate slow and fast muscle precursor cells in vivo, priorto somite formation. Development 122, 3371-3380.
Dwyer, C. M., Madgwick, A. J. A., Ward, S. and Stickland, N. C. (1995).Effect of maternal undernutrition in early gestation on the development offetal myofibres in the guinea-pig. Reprod. Fertil. Dev.7, 1285-1292.
Elliott, J. M. (1975). The growth rate of brown trout (Salmo trutta L.) fed onmaximum rations. J. Anim. Ecol.44, 805-821.
Elliott, J. M. and Hurley, M. A. (1995). The functional relationship betweenbody size and growth rate in fish. Funct. Ecol.9, 625-627.
Elliott, J. M. and Hurley, M. A. (1997). A functional model for maximumgrowth of Atlantic salmon parr, Salmo salar, from two populations innorthwest England. Funct. Ecol. 11, 592-603.
Fauconneau, B. and Paboeuf, G. (2001). Muscle satellite cells in fish. InMuscle Development and Growth, vol. 18, Fish Physiology(ed. I. A.Johnston), pp. 73-101. San Diego: Academic Press.
Florini, J. R., Ewton, D. Z. and Magri, K. A. (1991). Hormones, growthfactors and myogenic differentiation. Annu. Rev. Physiol. 53, 201-216.
Galloway, T. F., Kjørsvik, E. and Kyrivi, H. (1998). Effect of temperatureon viability and axial muscle development in embryos and yolk-sac larvaeof the Northeast arctic cod (Gadus morhua). Mar. Biol. 132, 559-567.
Gibson, S. and Johnston, I. A. (1995). Temperature and development inlarvae of the turbot, Scophthalmus maximus. Mar. Biol. 124, 17-25.
Greer-Walker, M. G. (1970). Growth and development of the skeletal musclefibres of the cod (Gadus morhuaL.). J. Cons. Perm. Int. Explor. Mer. 33,228-244.
Halevy, O., Krispin, A., Leshem, Y., McMurty, J. P. and Yahav, S. (2001).Early-age heat exposure affects skeletal muscle satellite cell proliferationand differentiation in chicks. Am. J. Physiol. 281, R302-R309.
Hanel, R., Karjalainen, J. and Wieser, W. (1996). Growth of swimmingmuscles and its metabolic cost in larvae of whitefish at differenttemperatures. J. Fish Biol.48, 937-951.
Hawke, T. J. and Garry, D. J. (2001). Myogenic satellite cells: physiologyto molecular biology. J. Appl. Physiol. 91, 534-551.
Jobling, M. (1983). Growth studies with fish – overcoming the problems withsize variation. J. Fish Biol. 22, 153-157.
Johnston, I. A. (1993). Temperature influences muscle differentiation and therelative timing of organogenesis in herring (Clupea harengus) larvae. Mar.Biol. 116, 363-379.
I. A. Johnston and others
1351Plasticity of muscle growth in salmon
Johnston, I. A. (2001). Genetic and environmental determinants of musclegrowth patterns. In Muscle Development and Growth, vol. 18, FishPhysiology(ed. I. A. Johnston), pp. 141-186. San Diego: Academic Press.
Johnston, I. A., Cole, N. J., Abercromby, M. and Vieira, V. L. A.(1998).Embryonic temperature modulates muscle growth characteristics in larvaland juvenile herring. J. Exp. Biol.201, 623-646.
Johnston, I. A., Hall, T. E. and Fernandez, D. A. (2002). Genes regulatingthe growth of myotomal muscle in teleost fish. In Aquatic Genomics StepsToward a Great Future(ed. N. Shimizu, T. Aoki, I. Hirono and F.Takashima), pp. 153-166. Tokyo: Springer-Verlag.
Johnston, I. A. and McLay, H. A. (1997). Temperature and family effectson muscle cellularity at hatch and first feeding in Atlantic salmon (Salmosalar L.). Can J. Zool. 75, 64-74.
Johnston, I. A., McLay, H. A., Abercromby, M. and Robins, D. (2000a).Phenotypic plasticity of early myogenesis and satellite cell numbers inAtlantic salmon spawning in upland and lowland tributaries of a riversystem. J. Exp. Biol.203, 2539-2552.
Johnston, I. A., McLay, H. A., Abercromby, M. and Robins, D. (2000b).Egg incubation temperature produces different effects on muscle fibrerecruitment patterns in spring- and autumn-running Atlantic salmonpopulations. J. Exp. Biol.203, 2553-2564.
Johnston, I. A., Strugnell, G., McCracken, M. L. and Jonstone, R. (1999).Muscle growth and development in normal-sex-ratio and all-female diploidand triploid Atlantic salmon. J. Exp. Biol.202, 1991-2016.
Johnston, I. A., Temple, G. K. and Vieira, V. L. A. (2001). Impact oftemperature on the growth and differentiation of muscle in herring larvae.In Environment and Animal Development: Genes, Life Histories andPlasticity (ed. D. Atkinson and M. Thorndyke), pp. 99-120. Oxford: BiosScientific Publishers Ltd.
Johnston, I. A., Ward, P. S. and Goldspink, G. (1975). Studies on theswimming musculature of the rainbow trout. I. Fibre types. J. Fish Biol. 7,451-458.
Koumans, J. T. M. and Akster, H. A. (1995). Myogenic cells in developmentand growth of fish. Comp. Biochem. Physiol. A 110, 3-20.
Koumans, J. T. M., Akster, H. A., Brooms, G. H. R., Lemmens, C. J. J.and Osse, J. W. M. (1991). Numbers of myosatellite cells in white axialmuscles of growing fish, Cyprinus carpioL. (Teleostei). Am. J. Anat. 192,418-424.
Koumans, J. T. M., Akster, H. A., Witkam, A. and Osse, J. W. M. (1994).Numbers of muscle nuclei and myosatellite cell nuclei in red and white axialmuscle during growth of the carp (Cyprinus carpio). J. Fish Biol. 44, 391-408.
Lindström, J. (1999). Early development and fitness in birds and mammals.Trends Ecol. Evol.9, 343-348.
Matschak, T. W., Hopcroft, T., Mason, P. S., Crook, A. R. and Stickland,N. C. (1998). Temperature and oxygen tension influence the developmentof muscle cellularity in embryonic rainbow trout. J. Fish Biol. 53, 581-590.
Matsuoka, M. and Iwai, T. (1984). Development of the myotomalmusculature in the red sea bream. Bull. Jap. Soc. Fish. Sci. 50, 29-35.
McPherron, A. C., Lawler, A. M. and Lee, S.-J. (1997). Regulation ofskeletal muscle mass in mice by a new TGF-βsuperfamily member. Nature387, 83-90.
McPherron, A. C. and Lee, S.-J. (2002). Suppression of body fataccumulation in myostatin-deficient mice. J. Clin. Invest.109, 595-601.
Mommsen, T. P. and Moon, T. W. (2001). Hormonal regulation of musclegrowth. In Muscle Development and Growth, vol. 18, Fish Physiology(ed.I. A. Johnston), pp. 251-308. San Diego: Academic Press.
Mooij, W. M., Lammens, E. H. R. R. and Van Densen, W. L. T. (1994).Growth rate of 0+ fish in relation to temperature, body size and food inshallow eutrophic Lake Tjeukemeer. Can. J. Fish. Aquat. Sci.51, 516-526.
Mooij, W. M. and van Ness, E. H. (1998). Statistical analysis of the somaticgrowth rate of 0+ fish in relation to temperature under natural conditions.Can. J. Fish. Aquat. Sci.55, 451-458.
Nathanailides, C., Lopez-Albors, O. and Stickland, N. C. (1995).Influence of prehatch temperature on the development of musclecellularity in post-hatch Atlantic salmon (Salmo salar). Can. J. Fish.Aquat. Sci. 52, 675-680.
O’Steen, S.(1998). Embryonic temperature influences juvenile choice and
growth rate in snapping turtlesChelydra serpentina. J. Exp. Biol. 201, 439-449.
Rasmussen, R. S. and Ostenfeld, T. H. (2000). Influence of growth rate onwhite muscle dynamics in rainbow trout and brook trout. J. Fish Biol.56,1548-1552.
Rehfeldt, C., Stickland, N. C., Fiedler, I. and Wegner, J. (1999).Environmental and genetic factors as sources of variation in skeletal musclefibre number. Basic Appl. Myol.9, 235-253.
Rhen, T. and Lang, J. W. (1999). Temperature during embryonic andjuvenile development influences growth in hatchling snapping turtles,Chelydra serpentina. J. Therm. Biol. 24, 33-41.
Ricker, W. E. (1979). Growth rates and models. In Fish Physiology, vol. VIII(ed. W. S. Hoar, D. J. Randall and J. R. Brett), pp. 677-743. New York:Academic Press.
Rodgers, B. D. and Weber, G. M.(2001). Sequence conservation among fishmyostatin orthologues and the characterisation of two additional cDNAclones from Morone saxatilisand Morone Americana. Comp. Biochem.Physiol. B 129, 597-603.
Rowlerson, A., Mascarello, F., Radaelli, G. and Veggetti, A. (1995).Differentiation and growth of muscle in the fish Sparus aurata(L). IIHyperplastic hypertrophic growth of lateral muscle from hatching to adult.J. Muscle Res. Cell Motil. 16, 223-236.
Rowlerson, A. and Veggetti, A. (2001). Cellular mechanisms of post-embryonic growth in aquaculture species. In Muscle Development andGrowth, vol. 18, Fish Physiology(ed. I. A. Johnston), pp. 103-140. SanDiego: Academic Press.
Schmalbruch, H. and Lewis, D. M.(2000). Dynamics of nuclei of musclefibers and connective tissue cells in normal and denervated rat muscles.Muscle Nerve23, 617-626.
Stabell, O. B. (1984). Homing and olfaction in salmonids: a critical reviewwith special reference to Atlantic salmon. Biol. Rev. 59, 333-338.
Stickland, N. C. (1983). Growth and development of muscle fibres in therainbow trout (Salmo gairdneri). J. Anat. 137, 323-333.
Stickland, N. C., White, R. N., Mescall, P. E., Crook, A. R. and Thorpe,J. E. (1988). The effect of temperature on myogenesis in embryonicdevelopment of the Atlantic salmon (Salmo salarL.). Anat. Embryol. 178,253-257.
Stoiber, H., Haslett, J. R., Wenk, R., Steinbacher, P., Gollman, H. P. andSänger, A. M. (2002). Cellularity changes in developing red and white fishmuscle at different temperatures: simulating natural environmentalconditions for a temperate freshwater cyprinid. J. Exp. Biol.205, 2349-2364.
Stoiber, W. and Sänger, A. M. (1996). An electron microscopic investigationinto the possible source of new muscle fibres in teleost fish. Anat. Embryol.194, 569-579.
Valente, L. M. P., Rocha, E., Gomes, E. F. S., Silva, M. W., Oliveira, M.H., Monteiro, R. A. F. and Faucconneau, B. (1999). Growth dynamics ofwhite and red muscle fibres in fast- and slow-growing strains of rainbowtrout. J. Fish Biol. 55, 675-691.
Veggetti, A., Mascarello, F., Scapolo, P. A. and Rowlerson, A. (1990).Hyperplastic and hypertrophic growth of lateral muscle in Dicentrarchuslabrax (L.). An ultrastructural and morphometric study. Anat. Embryol.182,1-10.
Vieira, V. L. A. and Johnston, I. A. (1992). Influence of temperature onmuscle-fibre development in larvae of the herring Clupea harengus. Mar.Biol. 112, 333-341.
Weatherley, A. H. and Gill, H. S. (1987). The Biology of Fish Growth.London: Academic Press.
Weatherley, A. H., Gill, H. S. and Lobo, A. F. (1988). Recruitment andmaximal diameter of axial muscle fibres in teleosts and their relationship tosomatic growth and ultimate size. J. Fish Biol. 33, 851-859.
Wilson, S. J., Ross, J. J. and Harris, A. J. (1988). A critical period forformation of secondary myotubes defined by prenatal undernourishment inrats. Development102, 815-821.
Yahav, S. and Hurwitz, S. (1996). Induction of thermal tolerance in malebroiler chickens by temperature conditioning at an early age.Poultry Sci.75, 402-406.
Zammit, P. S. and Beauchamp J. R. (2001). The skeletal muscle satellitecell: stem cell or son of stem cell. Differentiation68, 193-204.