examination of the influence of selected fibre properties ... · n measurement of fibre bundle ......
TRANSCRIPT
FIBRES amp TEXTILES in Eastern Europe July September 2006 Vol 14 No 3 (57)52 53FIBRES amp TEXTILES in Eastern Europe July September 2006 Vol 14 No 3 (57)
n Introduction In todayrsquos highly competitive and glo-bal textile market product quality has become of paramount importance In order to produce high-quality cotton yarns which will in turn produce high-quality woven amp knitted fabrics and end products emphasis must be placed on the quality and processing of cotton fibres [1]
There is a direct correlation between the quality of raw materials and the end products The lower quality of cotton fibres means the lower quality of yarn produced from such a raw material High-quality cotton blends are superior with respect to properties such as length fineness elongation and brightness suf-ficiently mature and without any trash particles and displaying a high capacity of spinning consistency
Starting from harvesting cotton is ex-posed to numerous processes Mechani-cal outer actions during yarn manufactur-ing cause significant changes of almost all the properties of processed cotton Such mechanical actions and processing conditions cause increases in short fibre content nep formation a decrease in fib-re strength and problems such as cotton stickiness Therefore these matters result in the fibre quality and economical value decreasing
One of the most important fibre parame-ters that causes a decrease of cotton qual-ity is neps a nep can be defined as ldquoa small knot of entangled fibres consisting entirely of fibres (ie a fibre neps) or of foreign matter (ie a seed-coat fragment) entangled with fibresrdquo [1]
Neps in a yarn are defined as ldquopoint agglomerations of fibres entangled into yarn causing the increase of yarn di-
Examination of the Influence of SelectedFibre Properties on Yarn Neppiness
Gonca Ozcelik Erhan Kırtay
ameterrdquo The number of neps in cotton yarn depends on two main factors the characteristics of the raw material used for the yarn production and the condi-tions of the technological process in the spinning mill [2]
The opening and cleaning processes in the blow room line are the operations in which the formation of mechanical neps takes place as well as fibre damage In todayrsquos spinning market together with the increment in demand for cleaner cot-ton and the increased prices paid for the cleaner cotton cotton fibres are exposed to two or more stages of lint cleaning in the ginning process which improves the cotton grade and removes foreign materi-als from cotton However the lint clean-ers tend to break seed-coat fragments into very small fragments to reduce fibre length and it becomes very difficult to remove them in opening and cleaning lines Therefore in order to clean the fibres from these fragments sufficiently mechanical treatments in the blow room line become more exhaustive During the opening and cleaning processes for re-moving trash and dust particles from cot-ton beating drawing and rolling motions take place and these actions cause neps formation Furthermore the pneumatic transport of fibres between particular machines in the technological line cause an increment in the number of neps as the more open fibre stream means in-creased tendencies of fibres to form neps Therefore it can be stated that regular air stream and clean air circulation are sig-nificant in these preliminary processes
n Problems with neps Neps in cotton lint cause short thick places in yarns resulting in uneven fabric appearance Often erratic fibre orientation in these areas can cause weak
Abstract Yarn neppiness one of the most important aspects of cotton yarn quality has significant influences on the downstream processes therefore it should be well controlled In this study in order to examine the changes in nep count during the production of yarn cotton materials from different origins have been investigated at some parts of the production line of carded yarn Moreover to predict of the yarn nep count from fibre properties measured by HVI and AFIS instruments the regression equations were obtained by means of multiple regression analysis In order to see the validity of each equation the correlations between the measured and estimated yarn nep counts were obtained
Key words cotton fibre neps yarn neps AFIS HVI regression analysis
places in yarns This can lead to a loss of spinning efficiency weaving and knitting machine stoppage and fabric defects
While manufacturing knitted fabric when transferring yarns from bobbins to knitting needles neps in yarns can block the holes of yarn guides and nee-dle hooks resulting in yarns breaking Therefore the knitted fabric produced will have a hole which minimises the value of the product
Neps on the surface of a fabric can cause undyed or unprinted spots during dyeing or printing The most disturbing effect of these white spots is that they cannot be recognised until dyeing or printing This problem becomes very troublesome es-pecially when dealing with dark colours Neps sometimes contain immature fibres which are usually weaker than normal fibres This weakness can lead to fibre fragments breaking off which creates excessive fibre dust fly and lint deposits
n Materials and methods In this study in order to make a progno-sis of the nep content in the finished yarn based on the raw material properties and to investigate the changes in neps content of the fibre stream during yarn manufac-turing an experimental study was carried out in a Turkish spinning mill on a carded yarn production line
The first aim of this study was to deter-mine the relationship between the cotton fibre properties measured by HVI (High Volume Instrument) AFIS (Advanced Fibre Information System) instruments and the amount of yarn neps and the second was to examine the changes in nep amount during the production stages As raw material cotton fibre which is commonly used in the textile industry
Ege University Textile Engineering Department
35100 Bornova İzmir Turkey E-mail goncaozcelikegeedutr
E-mail kirtayegenetcomtr
FIBRES amp TEXTILES in Eastern Europe July September 2006 Vol 14 No 3 (57)52 53FIBRES amp TEXTILES in Eastern Europe July September 2006 Vol 14 No 3 (57)
in Turkey and worldwide was utilised and cotton blends were selected from the types processed in spinning mills
In the first part of the study in order to determine the changes of the neps and seed coat neps during yarn manufactur-ing 11 different cotton blends consisting of different ratios of the Greek Aegean African Uzbek and Turkish (Diyarbakir and Hatay) cottons were examined (see Table 1) It should be noted that the geo-graphic denotations indicate a particular cotton batch and do not characterise in general the cotton of the particular country
The processing stages in the yarn produc-tion line where the nep count of the ma-terial is measured are given in Table 2 In the second part of the study to predict yarn neps by means of fibre properties the AFIS and HVI data of 30 cotton blends were used and by using these values a multiple regression analysis was carried out with the SPSS statistical program
The parameter to be predicted in the study yarn neps was considered as a dependent variable (y) and the fibre properties were dealt with as independent variables Besides as it is known from proceeding studies that there is a close
correlation between yarn count (linear density) and yarn neps yarn count was also included in the regression analysis With the regression analysis we tried to obtain the highest regression coefficient of determination (R2)
The fibre properties were measured with the following principles and instrumentsn measurement of fibre bundle (HVI
ndash High Volume Instrument) n measurement of single fibres (AFIS ndash
Advanced Fibre Information System)
In this respect regression analyses were done separately for each set of data taken from the instruments However yarn count was added for both analyses Also measurement of yarn neps was carried out with a Uster Tester 3 instrument
The fibre parameters measured by the HVI instrument and included in the reg-ression analyses are as follows n 25 span length mmn 25 span length CV n Uniformity index n Fibre strength cNtexn Fibre elongation n Fibre fineness microner
The fibre parameters measured by the AFIS system and included in the regres-sion analyses are as follows n Short fibre content by number n Fibre fineness mtexn Immature fibre content n Fibre maturityn Nep number countgn Seed-coat nep number countgn Dust number countgn Trash number countgn Visible foreign material
After the regression analyses a step-wise regression procedure was applied to determine the independent variables which effectively made the maximum contribution to the coefficient of deter-mination In this method starting from the independent variable providing the maximum contribution the increment in
the coefficient of determination was cal-culated by the contribution of the other independent variables in turn With the aid of this method it is possible to deter-mine the most important fibre properties that influence yarn nep formation
n Results and discussion Examining the effect of process stages on nep content By using the AFIS system starting from the bale the important fibre parameters of each semi-product and end product of yarn manufacturing can be meas-ured and so each processing stage can be controlled The role of machines in handling fibres has become more critical because of the nature of todayrsquos machin-ery Accordingly the absence of close monitoring of the process may result in significant changes in fibre characteris-tics Specifically fibres are likely to be damaged nepped and fine trash is likely to cling to the fibres [4]
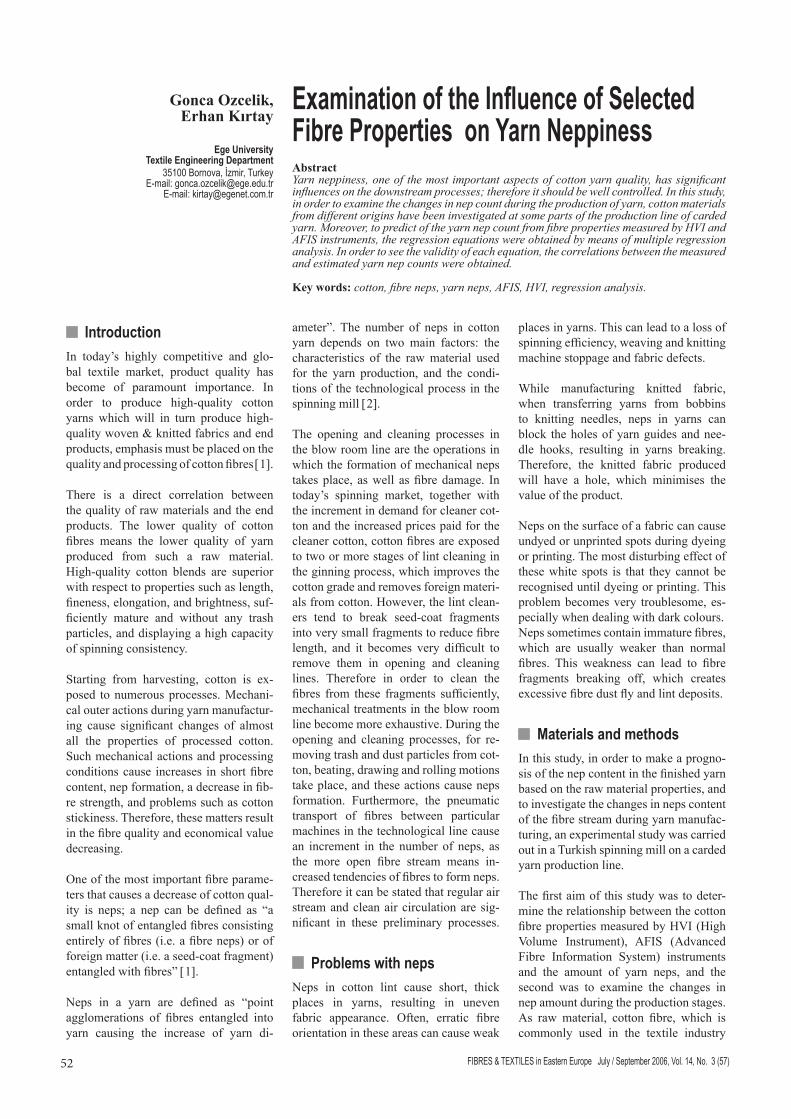
In order to examine the changes in nep count in cotton during processing cotton samples taken from different stages of the blow room line for 11 different cotton blends were tested with the AFIS system (see Figure 1) In the cotton blends ob-served the fibre nep content ranges from 81 countg to 264 countg As can be seen from Figure 5 the minimum nep content belongs to the fourth cotton blend ie 100 Turkish cotton (Hatay) whereas the maximum nep content belongs to the fifth cotton blend 100 Greek cot-ton An increment in nep number from the bale to the dust separator is observed Generally the reason for this increment is external mechanical factors which are connected with actions of the machinersquos working elements on the fibres as well as by the pneumatic transport of fibres between particular machines
The next machine after the blow room line in yarn manufacturing is the card-ing machine which is also called the lsquoheart of the spinning millrsquo To evaluate the carding performances and select the optimum card settings the NRE (nep removal efficiency) should be monitored The NRE shows the relation between input material card mat and the output material card sliver [4]
Zelleweger Uster reported that a 70 nep reduction by card is low 80 is average and 90 is high The nep removal effi-
Table 1 Cotton blends used in the study taken from the carded production line
Blend number Blend Composition
1 100 Uzbek2 100 Turkish (Aegean)3 100 Turkish (Diyarbakır)4 100 Turkish (Hatay)5 100 Greece6 100 African7 50 Uzbek ndash 50 Turkish (Aegean)8 60 Uzbek ndash 40 Greece9 70 Greece ndash 30 Iranian
10 59 Turkish (Aegean) ndash 24 African ndash 17 Turkish (Hatay)
11 64 Uzbek ndash 25 Turkish (Aegean) ndash 11 African
Table 2 Process stages at which the cotton samples were taken
Carded yarn production line
Bale
Opening and cleaning lineCleaning (CVT3)Opening (Tuftomat)Dust separator (Dustex)
Carding machine Card matCard sliver
1st passage draw frame machine2nd passage draw frame machine
Sliver from the 1st passage draw frameSliver from the 2nd passage draw frame
FIBRES amp TEXTILES in Eastern Europe July September 2006 Vol 14 No 3 (57)54 55FIBRES amp TEXTILES in Eastern Europe July September 2006 Vol 14 No 3 (57)
ciency (NRE) of a carding machine can be calculated by the following equation
NRE () =
whereNfeed = the neps number in the feeding
web neps countgNdel = the neps number in the delivered
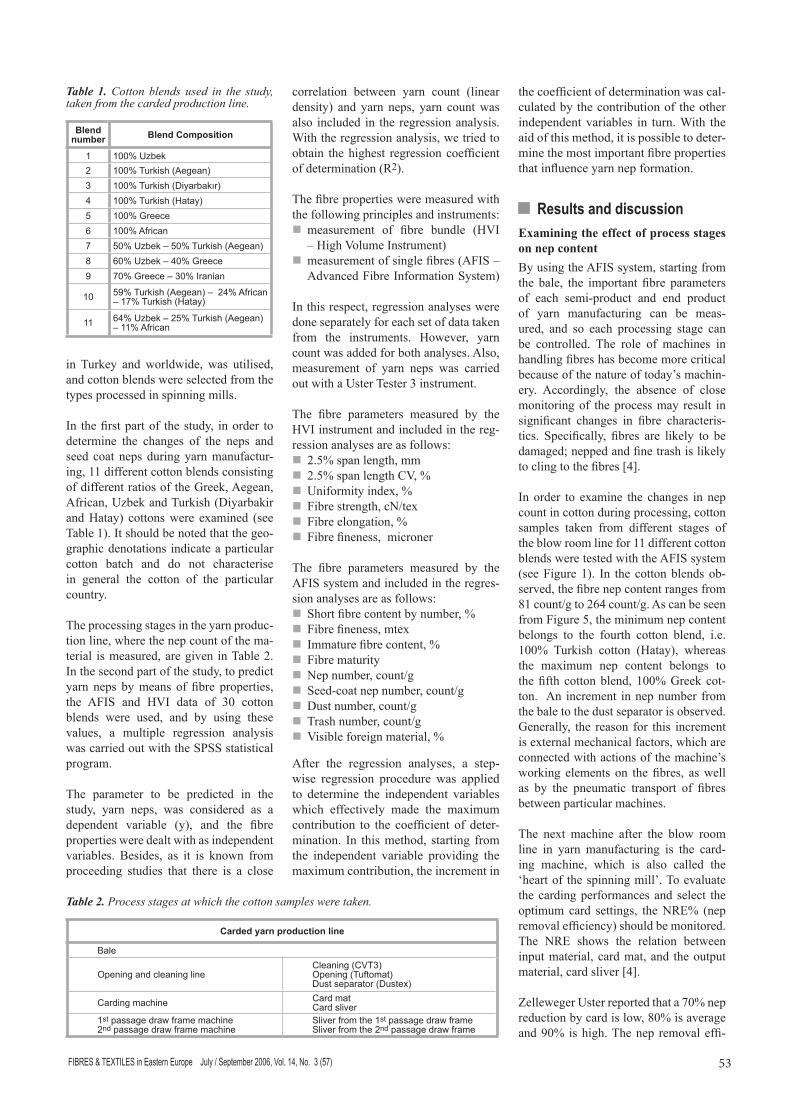
sliver neps countg In Figure 2 the average nep and seed-coat nep numbers of the card mats and slivers are presented It can be stated
from the results that a considerable re-duction of the fibre and seed-coat nep number occurs in carding machines
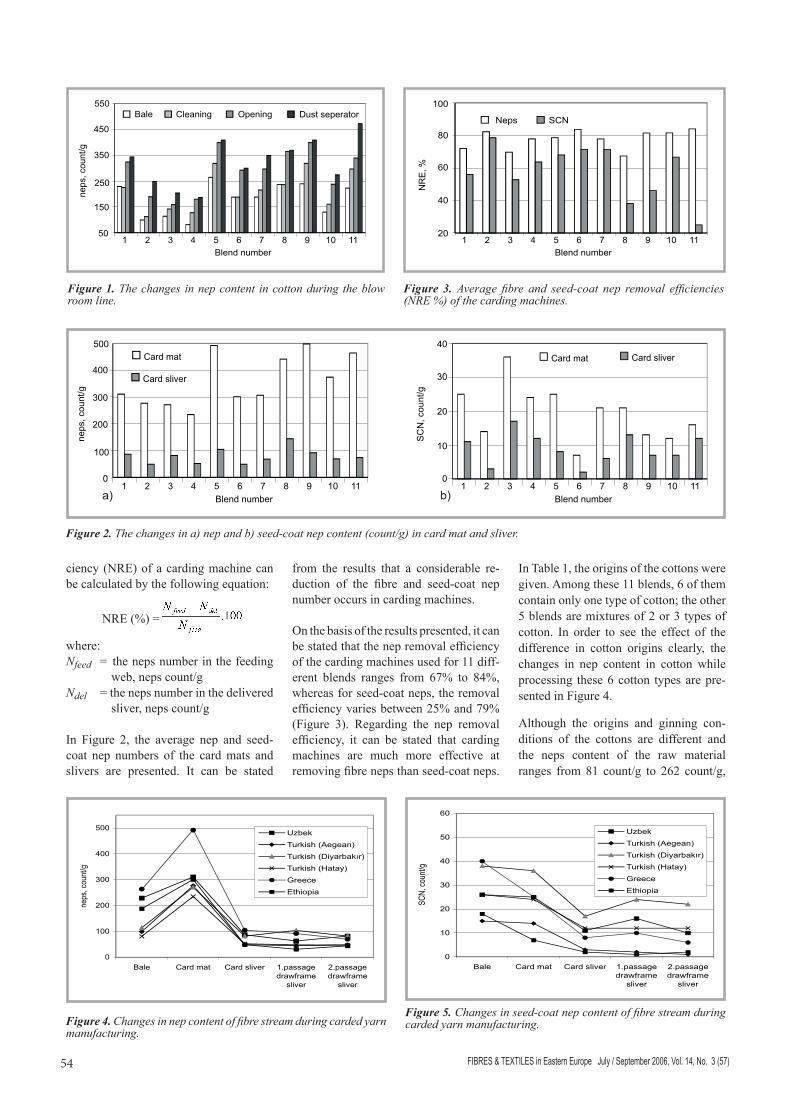
On the basis of the results presented it can be stated that the nep removal efficiency of the carding machines used for 11 diff-erent blends ranges from 67 to 84 whereas for seed-coat neps the removal efficiency varies between 25 and 79 (Figure 3) Regarding the nep removal efficiency it can be stated that carding machines are much more effective at removing fibre neps than seed-coat neps
In Table 1 the origins of the cottons were given Among these 11 blends 6 of them contain only one type of cotton the other 5 blends are mixtures of 2 or 3 types of cotton In order to see the effect of the difference in cotton origins clearly the changes in nep content in cotton while processing these 6 cotton types are pre-sented in Figure 4
Although the origins and ginning con-ditions of the cottons are different and the neps content of the raw material ranges from 81 countg to 262 countg
Figure 1 The changes in nep content in cotton during the blow room line
Figure 2 The changes in a) nep and b) seed-coat nep content (countg) in card mat and sliver
a) b)
Figure 3 Average fibre and seed-coat nep removal efficiencies (NRE ) of the carding machines
Figure 4 Changes in nep content of fibre stream during carded yarn manufacturing
Figure 5 Changes in seed-coat nep content of fibre stream during carded yarn manufacturing
FIBRES amp TEXTILES in Eastern Europe July September 2006 Vol 14 No 3 (57)54 55FIBRES amp TEXTILES in Eastern Europe July September 2006 Vol 14 No 3 (57)
the changes in nep content during yarn manufacturing stages are similar In all blends preliminary treatment of cotton in the opening and cleaning lines causes an increment in the nep number In the carding process a significant decrease in the level of neps takes place
For drawing and mixing the card slivers the 1st and 2nd passage draw-frame machines are used after the carding process On the basis of the results as can be seen from Figure 4 and 5 it can be stated that there is no significant change in the nep and seed-coat nep content at this stage of production The reason for the slight changes in nep content may arise from the doubling proc-ess because several card slivers containing different amount of neps are gathered and drawn together But however the 2nd pas-sage draw-frame sliver the raw material of which contains a higher nep content also includes many more neps
Prediction of yarn neps with fibre properties In the second part of the study cotton yarns whose counts (linear densities) range from 33 tex to 16 tex were pro-duced on a carded yarn manufacturing line In order to predict yarn neps by using the fibre parameters measured by the HVI and AFIS systems multivariate regression analyses were carried out Yarn neps measured by the Uster Tester instrument were considered as depend-ent-variable (y) and the yarn count and fibre parameters measured by the HVI and AFIS systems were considered as independent variables (x) The regression equations were derived separately for both the HVI and AFIS fibre parameters
Since the regression equations consist of so many fibre parameters in order to determine the most effective independ-ent variables which make the maximum contributions to the prediction of yarn neps a stepwise regression procedure was applied
In Table 3 the regression equations de-rived from HVI data are presented
As a result of the regression analyses with HVI parameters 3 different models for estimating yarn neps have been derived For controlling the appropriateness of the regression equations variance analyses were carried out for a significance coef-ficient of α = 005 the calculated F and p values have been found to be significant
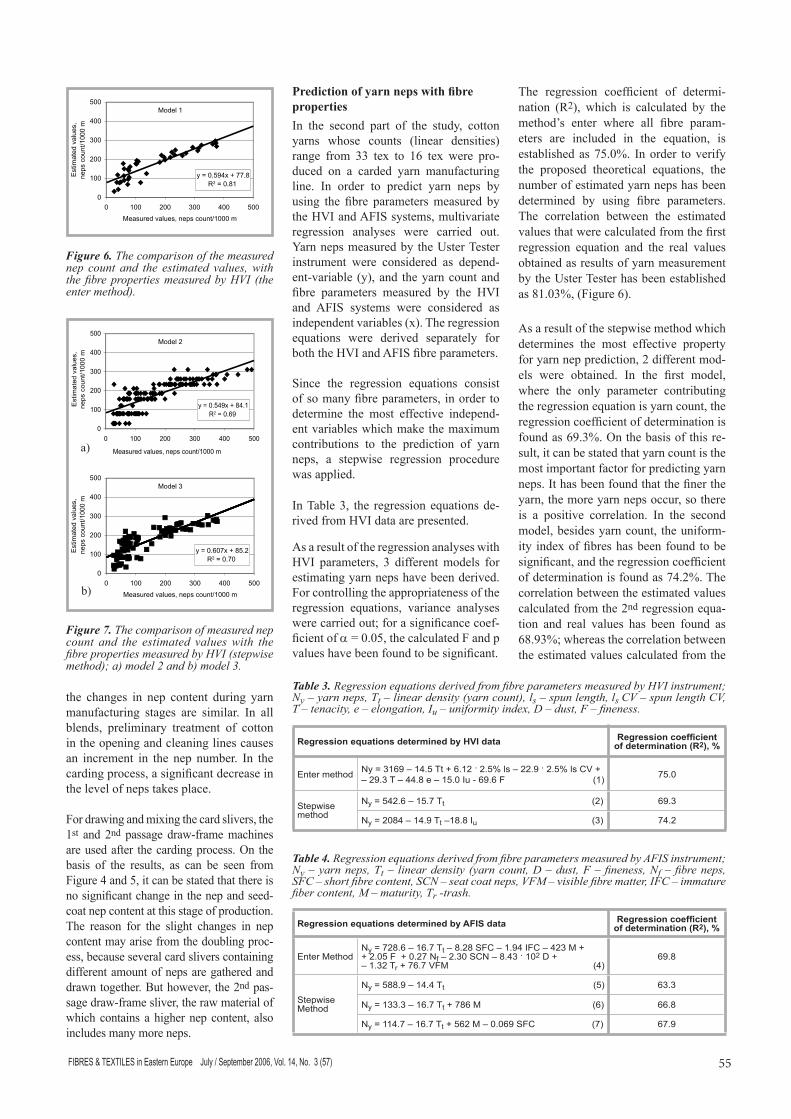
The regression coefficient of determi-nation (R2) which is calculated by the methodrsquos enter where all fibre param-eters are included in the equation is established as 750 In order to verify the proposed theoretical equations the number of estimated yarn neps has been determined by using fibre parameters The correlation between the estimated values that were calculated from the first regression equation and the real values obtained as results of yarn measurement by the Uster Tester has been established as 8103 (Figure 6)
As a result of the stepwise method which determines the most effective property for yarn nep prediction 2 different mod-els were obtained In the first model where the only parameter contributing the regression equation is yarn count the regression coefficient of determination is found as 693 On the basis of this re-sult it can be stated that yarn count is the most important factor for predicting yarn neps It has been found that the finer the yarn the more yarn neps occur so there is a positive correlation In the second model besides yarn count the uniform-ity index of fibres has been found to be significant and the regression coefficient of determination is found as 742 The correlation between the estimated values calculated from the 2nd regression equa-tion and real values has been found as 6893 whereas the correlation between the estimated values calculated from the
Table 3 Regression equations derived from fibre parameters measured by HVI instrument Ny ndash yarn neps Tt ndash linear density (yarn count) ls ndash spun length ls CV ndash spun length CV T ndash tenacity e ndash elongation Iu ndash uniformity index D ndash dust F ndash fineness
Regression equations determined by HVI data Regression coefficient of determination (R2)
Enter method Ny = 3169 ndash 145 Tt + 612 25 ls ndash 229 25 ls CV +ndash 293 T ndash 448 e ndash 150 Iu - 696 F (1) 750
Stepwisemethod
Ny = 5426 ndash 157 Tt (2) 693
Ny = 2084 ndash 149 Tt ndash188 Iu (3) 742
Table 4 Regression equations derived from fibre parameters measured by AFIS instrument Ny ndash yarn neps Tt ndash linear density (yarn count D ndash dust F ndash fineness Nf ndash fibre neps SFC ndash short fibre content SCN ndash seat coat neps VFM ndash visible fibre matter IFC ndash immature fiber content M ndash maturity Tr -trash
Regression equations determined by AFIS data Regression coefficient of determination (R2)
Enter MethodNy = 7286 ndash 167 Tt ndash 828 SFC ndash 194 IFC ndash 423 M ++ 205 F + 027 Nf ndash 230 SCN ndash 843 102 D +ndash 132 Tr + 767 VFM (4)
698
StepwiseMethod
Ny = 5889 ndash 144 Tt (5) 633
Ny = 1333 ndash 167 Tt + 786 M (6) 668
Ny = 1147 ndash 167 Tt + 562 M ndash 0069 SFC (7) 679
Figure 6 The comparison of the measured nep count and the estimated values with the fibre properties measured by HVI (the enter method)
Figure 7 The comparison of measured nep count and the estimated values with the fibre properties measured by HVI (stepwise method) a) model 2 and b) model 3
a)
b)
FIBRES amp TEXTILES in Eastern Europe July September 2006 Vol 14 No 3 (57)56 57FIBRES amp TEXTILES in Eastern Europe July September 2006 Vol 14 No 3 (57)
3rd equation and real values has been found as 6967 (see Figure 7)
By using the AFIS system (Advanced Fibre Information System) based on single fibre measurement several fibre properties were measured and regres-sion analyses carried out In Table 4 the regression equations derived from AFIS data are presented
As a result of the regression analyses carried out with AFIS parameters 4 dif-ferent models for estimating yarn neps have been derived In order to control the appropriateness of the regression equa-
tions variance analyses were carried out According to the significance coefficient of α = 005 the calculated F and p values have been found to be significant In this respect the regression between the yarn neps and fibre properties obtained from the AFIS system can be considered as significant
The determination coefficient of the re-gression equation as determined by the enter method in which all the fibre prop-erties are included in analysis was found to be 698 In order to check the valid-ity of this regression equation in practice the theoretical yarn nep count was calcu-lated by using the fibre parameters of the yarns produced The correlation coeffi-cient between the real and theoretical yarn nep counts (nep count per 1000 m) as calculated from the 4th equation was determined as 7818 The correlation between the real and theoretical values is represented in Figure 8
As the fibre parameters included in regres-sion equations are too difficult to calcu-late in order to determine the most effec-tive fibre properties that contribute to the regression equations more than the other parameters a regression analysis was car-ried out according to the stepwise method and 3 different equations were derived
In the fifth model where the only parame-ter contributing to the regression equation is yarn count the regression coefficient of determination is found to be 633 Similar to the regression results obtained from HVI parameters it can be stated that yarn count is the most important fac-tor for predicting the yarn nep number
In the sixth regression equation besides yarn count fibre maturity was found to be significant for estimating the yarn neps and the determination coefficient has been determined as 668 Fibre maturity in-fluences the tendency of fibres to entangle and form neps Many researchers have concluded that the tendency to cotton neps increases with the increment in immature and dead fibres Immature fibres have low rigidities and high buckling coefficients and can therefore become entangled into neps during mechanical processes In this study the effect of fibre maturity on yarn nep count has also been verified
In the seventh model determined by the stepwise method the regression equation contains yarn count the fibre maturity ratio and also the short-fibre content
The determination coefficient of the re-gression equation is 679 Short-fibre content in cotton means the ratio of fibres whose length is below 125 mm Due to the breaking of excessively long fibres or a lack of fibre orientation during in-tensive cleaning and opening of fibres short-fibre content (SFC) increases and indirectly the nep count will increase
In order to verify the proposed theoreti-cal regression equations calculated by the AFIS data the correlation between the real and measured yarn neps counts was compared For the 5th regression equa-tion which includes only yarn count as an independent variable the correlation between theoretical and real nep counts was determined as 7020 In the 6th regression equation of which independ-ent variables are yarn count and fibre maturity the correlation coefficient was determined as 7427 whereas in the 7th regression equation which includes yarn count fibre maturity and short-fibre content as independent variables the cor-relation coefficient was found as 7471 The correlation between estimated and measured values is presented in Figure 9
n Summary and conclusions In the first part of the study cottons from 11 different origins were investigated in respect to their nep content The neps content of raw materials was between 81 and 262 neps countg Turkish cottons from the Hatay region have the minimum nep amount whereas Greek cotton have the maximum quantity The difference in the nep content of raw cotton fibres can be explained by the fact that cottons from different origins are also subjected to dif-ferent ginning conditions
A first significant reduction in the nep content of the material takes place in card-ing process In this study with regard to fibre neps nep removal efficiency ranged between 67 and 84 whereas for seed-coat nep reduction this ranged between 25 and 79 On the basis of this result the following conclusions can be statedn The carding process is more effective
for the removal of fibre neps com-pared with seed-coat neps
n Nep removal efficiency should be calculated for each carding machines in a spinning mill this is especially important for evaluating carding performance and selecting optimum machine settings
Figure 8 The comparison of measured nep count and the estimated values with the fibre properties measured by AFIS (the enter method)
Figure 9 The comparison of measured nep count and estimated values with the fibre properties measured by AFIS (the stepwise method)
FIBRES amp TEXTILES in Eastern Europe July September 2006 Vol 14 No 3 (57)56 57FIBRES amp TEXTILES in Eastern Europe July September 2006 Vol 14 No 3 (57)
In the second part of the study in order to make a prognosis of the nep content in yarn which considerably influences yarn quality multivariate regression analyses have been carried out by using fibre properties measured by the HVI and AFIS instruments As it is known from previous studies that there is a clear connection between yarn count and yarn nep content yarn count is included both regression analyses assessed by HVI and AFIS data The analysis has shown that n yarn count makes the highest contri-
bution to the determination coefficient of regression equations
n to predict the number of yarn neps the most important fibre property measured by HVI is the uniformity in-dex whereas maturity ratio and short fibre content are the crucial properties measured by AFIS for determining yarn neps
n in order to estimate the yarn nep count which may affect the yarn and therefore the end product quality sig-nificantly both fibre properties meas-ured with HVI and AFIS instruments can be used
n However in spinning mills where both instruments are available the fibre properties measured with HVI instruments can be a satisfactory pre-dictor for yarn neps also especially as only two parameters are included in the equation and the regression coef-ficient of determination is higher the third model can be used
References1 Layton JM Buchanan RD Neps In
Cotton Lint Textile Progress Oxford 1999 28(4) 50p
2 Matusiak M and Frydrych I Effect of Raw Material and Processing Conditions on Yarn Neppiness 2002
3 Bel-Berger P And Roberts G 2002 Neps Devalue Cotton Australian Cotton Research Centre
4 Frydrych I and Matusiak M Trends of AFIS Application in Research and Industry Fibres and Textiles in Eastern Europe 2002 JulySeptember 35-39
5 Mogahzy Y Utilisation of the advanced fibre information system (AFIS) in the evaluation of the textile process 1997 Melliand English 78 1-4
6 Herbert JJ Mangialardi G And Ramey HH Neps in Cotton Processing Textile Research Journal 1986 56 (2) 108-111
7 Frydrych I and Matusiak M Predicting the Nep Number in Cotton Yarn-Determi-ning the Critical Nep Size Textile Rese-arch Journal 2002 72 (10) 917-923
Received 17092004 Reviewed 24082005
12th Workshop of the Polish Chitin Society
lsquoNew Aspects in Chitin Chemistry and Application of Chitin and its Derivativesrsquo
20 ndash 22 September 2006 Szczyrk PolandCo-Organisersn Institute of Biopolymers and Chemical Fibres Łoacutedź Polandn University of BielskondashBiała Bielsko-Biała Poland
Scientific CommitteeChairperson Małgorzata Jaworska Ph D EngMembers n Prof Danuta Pięta Ph D D Scn Anna Wojtasz-Pająk Ph Dn Jan Ignacak Ph Dn Marcin H Struszczyk Ph D Eng
Organisation CommitteeChairperson Antonii Niekraszewicz Ph D EngMembers M Kucharska Ph D Eng M Wiśniewska-Wrona M Sc Eng A Bodek Ph D Eng K Brzoza-Malczewska M Sc Eng
Three conference sessions are providedn Session A lsquoPolymer Problemsrsquo ndash chairpersons Jan Ignacak Ph D and Małgorzata
Jaworska Ph D Engn Session B lsquoBiological and Medical Aspectsrsquo ndash chairpersons
prof Danuta Pięta Ph D D Sc and Anna Wojtasz-Pająk Ph Dn Session C lsquoAgriculture Applicationrsquo ndash chairperson prof Maria Mucha Ph D D Sc
Selected lecturesn lsquoDetermination of the FA Value of Chitin and Chitosan Materials by a Sorption
Methodrsquo George A F Roberts University of Nottingham UKn lsquoSupermolecular Structure of Krill Chitin in the Field of Spectroscopic Inves-
tigationsrsquo Dorota Biniaś Włodzimierz Biniaś Stefan Boryniec University of BielskondashBiała Poland
n lsquoPartly Resorptional Surgical Netsrsquo Antonii Niekraszewicz Marcin H Struszczyk Magdalena Kucharska Dariusz Wawro Institute of Biopolymers and Chemical Fibres (IBChF) Łoacutedź Poland Tricomed Co Łoacutedź Poland
n lsquoBio-active Composite Materialsrsquo Magdalena Kucharska Antonii Niekrasze-wicz Jolanta Lebioda Kinga Brzoza-Malczewska Ewa Wesołowska Insti-tute of Biopolymers and Chemical Fibres (IBChF) Łoacutedź Poland
n lsquoMedical Applications of Chitin and Its Derivativesrsquo Marcin H Struszczyk Katarzyna Struszczyk Tricomed Co Łoacutedź Poland Technical University of Łoacutedź Poland
n lsquoInvestigation into Properties of Biological Products of Chitosan Degradationrsquo Maria Wiśniewska-Wrona Antonii Niekraszewicz Danuta Ciechańska Hen-ryk Pospieszny Leszek B Orlikowski Institute of Biopolymers and Chemical Fibres (IBChF) Łoacutedź Poland
n lsquoInfluence of Temperature and Chitosan Form on the Process of Sorption of Metal Ionsrsquo K Henryka Bodek Medical University Łoacutedź Poland
n lsquoInfluence of Temperature and Metal Ions on the Optical Properties of Chi-tosan in an Aqueous Solutionrsquo Marceli Koralewski K Henryka Bodek To-masz Wachowski University of Poznań Poland Medical University Łoacutedź Poland
n lsquoChanges of the Molecular Characteristic of Dibutyrylchitin Influenced by Ultrasoundsrdquo Joanna Szumilewicz Barbara Papin-Szafko Technical Uni-versity of Łoacutedź Poland Technical University of Szczecin Poland
n lsquoThermal Effects Concomitant with the Adsorption Process of Water by Chi-tosan with Different Deacetylation Degreesrsquo Maria Mucha Jacek Balcerzak Technical University of Łoacutedź Poland
For more information please contact
Conference Secretariat M Wiśniewska-Wrona M Sc Eng Tel (48-42) 637-03-39 E-mail biomateribwchlodzpl
Institute of Biopolymers and Chemical Fibresul M Skłodowskiej-Curie 1927 90-570 Łoacutedż Poland
FIBRES amp TEXTILES in Eastern Europe July September 2006 Vol 14 No 3 (57)52 53FIBRES amp TEXTILES in Eastern Europe July September 2006 Vol 14 No 3 (57)
in Turkey and worldwide was utilised and cotton blends were selected from the types processed in spinning mills
In the first part of the study in order to determine the changes of the neps and seed coat neps during yarn manufactur-ing 11 different cotton blends consisting of different ratios of the Greek Aegean African Uzbek and Turkish (Diyarbakir and Hatay) cottons were examined (see Table 1) It should be noted that the geo-graphic denotations indicate a particular cotton batch and do not characterise in general the cotton of the particular country
The processing stages in the yarn produc-tion line where the nep count of the ma-terial is measured are given in Table 2 In the second part of the study to predict yarn neps by means of fibre properties the AFIS and HVI data of 30 cotton blends were used and by using these values a multiple regression analysis was carried out with the SPSS statistical program
The parameter to be predicted in the study yarn neps was considered as a dependent variable (y) and the fibre properties were dealt with as independent variables Besides as it is known from proceeding studies that there is a close
correlation between yarn count (linear density) and yarn neps yarn count was also included in the regression analysis With the regression analysis we tried to obtain the highest regression coefficient of determination (R2)
The fibre properties were measured with the following principles and instrumentsn measurement of fibre bundle (HVI
ndash High Volume Instrument) n measurement of single fibres (AFIS ndash
Advanced Fibre Information System)
In this respect regression analyses were done separately for each set of data taken from the instruments However yarn count was added for both analyses Also measurement of yarn neps was carried out with a Uster Tester 3 instrument
The fibre parameters measured by the HVI instrument and included in the reg-ression analyses are as follows n 25 span length mmn 25 span length CV n Uniformity index n Fibre strength cNtexn Fibre elongation n Fibre fineness microner
The fibre parameters measured by the AFIS system and included in the regres-sion analyses are as follows n Short fibre content by number n Fibre fineness mtexn Immature fibre content n Fibre maturityn Nep number countgn Seed-coat nep number countgn Dust number countgn Trash number countgn Visible foreign material
After the regression analyses a step-wise regression procedure was applied to determine the independent variables which effectively made the maximum contribution to the coefficient of deter-mination In this method starting from the independent variable providing the maximum contribution the increment in
the coefficient of determination was cal-culated by the contribution of the other independent variables in turn With the aid of this method it is possible to deter-mine the most important fibre properties that influence yarn nep formation
n Results and discussion Examining the effect of process stages on nep content By using the AFIS system starting from the bale the important fibre parameters of each semi-product and end product of yarn manufacturing can be meas-ured and so each processing stage can be controlled The role of machines in handling fibres has become more critical because of the nature of todayrsquos machin-ery Accordingly the absence of close monitoring of the process may result in significant changes in fibre characteris-tics Specifically fibres are likely to be damaged nepped and fine trash is likely to cling to the fibres [4]
In order to examine the changes in nep count in cotton during processing cotton samples taken from different stages of the blow room line for 11 different cotton blends were tested with the AFIS system (see Figure 1) In the cotton blends ob-served the fibre nep content ranges from 81 countg to 264 countg As can be seen from Figure 5 the minimum nep content belongs to the fourth cotton blend ie 100 Turkish cotton (Hatay) whereas the maximum nep content belongs to the fifth cotton blend 100 Greek cot-ton An increment in nep number from the bale to the dust separator is observed Generally the reason for this increment is external mechanical factors which are connected with actions of the machinersquos working elements on the fibres as well as by the pneumatic transport of fibres between particular machines
The next machine after the blow room line in yarn manufacturing is the card-ing machine which is also called the lsquoheart of the spinning millrsquo To evaluate the carding performances and select the optimum card settings the NRE (nep removal efficiency) should be monitored The NRE shows the relation between input material card mat and the output material card sliver [4]
Zelleweger Uster reported that a 70 nep reduction by card is low 80 is average and 90 is high The nep removal effi-
Table 1 Cotton blends used in the study taken from the carded production line
Blend number Blend Composition
1 100 Uzbek2 100 Turkish (Aegean)3 100 Turkish (Diyarbakır)4 100 Turkish (Hatay)5 100 Greece6 100 African7 50 Uzbek ndash 50 Turkish (Aegean)8 60 Uzbek ndash 40 Greece9 70 Greece ndash 30 Iranian
10 59 Turkish (Aegean) ndash 24 African ndash 17 Turkish (Hatay)
11 64 Uzbek ndash 25 Turkish (Aegean) ndash 11 African
Table 2 Process stages at which the cotton samples were taken
Carded yarn production line
Bale
Opening and cleaning lineCleaning (CVT3)Opening (Tuftomat)Dust separator (Dustex)
Carding machine Card matCard sliver
1st passage draw frame machine2nd passage draw frame machine
Sliver from the 1st passage draw frameSliver from the 2nd passage draw frame
FIBRES amp TEXTILES in Eastern Europe July September 2006 Vol 14 No 3 (57)54 55FIBRES amp TEXTILES in Eastern Europe July September 2006 Vol 14 No 3 (57)
ciency (NRE) of a carding machine can be calculated by the following equation
NRE () =
whereNfeed = the neps number in the feeding
web neps countgNdel = the neps number in the delivered
sliver neps countg In Figure 2 the average nep and seed-coat nep numbers of the card mats and slivers are presented It can be stated
from the results that a considerable re-duction of the fibre and seed-coat nep number occurs in carding machines
On the basis of the results presented it can be stated that the nep removal efficiency of the carding machines used for 11 diff-erent blends ranges from 67 to 84 whereas for seed-coat neps the removal efficiency varies between 25 and 79 (Figure 3) Regarding the nep removal efficiency it can be stated that carding machines are much more effective at removing fibre neps than seed-coat neps
In Table 1 the origins of the cottons were given Among these 11 blends 6 of them contain only one type of cotton the other 5 blends are mixtures of 2 or 3 types of cotton In order to see the effect of the difference in cotton origins clearly the changes in nep content in cotton while processing these 6 cotton types are pre-sented in Figure 4
Although the origins and ginning con-ditions of the cottons are different and the neps content of the raw material ranges from 81 countg to 262 countg
Figure 1 The changes in nep content in cotton during the blow room line
Figure 2 The changes in a) nep and b) seed-coat nep content (countg) in card mat and sliver
a) b)
Figure 3 Average fibre and seed-coat nep removal efficiencies (NRE ) of the carding machines
Figure 4 Changes in nep content of fibre stream during carded yarn manufacturing
Figure 5 Changes in seed-coat nep content of fibre stream during carded yarn manufacturing
FIBRES amp TEXTILES in Eastern Europe July September 2006 Vol 14 No 3 (57)54 55FIBRES amp TEXTILES in Eastern Europe July September 2006 Vol 14 No 3 (57)
the changes in nep content during yarn manufacturing stages are similar In all blends preliminary treatment of cotton in the opening and cleaning lines causes an increment in the nep number In the carding process a significant decrease in the level of neps takes place
For drawing and mixing the card slivers the 1st and 2nd passage draw-frame machines are used after the carding process On the basis of the results as can be seen from Figure 4 and 5 it can be stated that there is no significant change in the nep and seed-coat nep content at this stage of production The reason for the slight changes in nep content may arise from the doubling proc-ess because several card slivers containing different amount of neps are gathered and drawn together But however the 2nd pas-sage draw-frame sliver the raw material of which contains a higher nep content also includes many more neps
Prediction of yarn neps with fibre properties In the second part of the study cotton yarns whose counts (linear densities) range from 33 tex to 16 tex were pro-duced on a carded yarn manufacturing line In order to predict yarn neps by using the fibre parameters measured by the HVI and AFIS systems multivariate regression analyses were carried out Yarn neps measured by the Uster Tester instrument were considered as depend-ent-variable (y) and the yarn count and fibre parameters measured by the HVI and AFIS systems were considered as independent variables (x) The regression equations were derived separately for both the HVI and AFIS fibre parameters
Since the regression equations consist of so many fibre parameters in order to determine the most effective independ-ent variables which make the maximum contributions to the prediction of yarn neps a stepwise regression procedure was applied
In Table 3 the regression equations de-rived from HVI data are presented
As a result of the regression analyses with HVI parameters 3 different models for estimating yarn neps have been derived For controlling the appropriateness of the regression equations variance analyses were carried out for a significance coef-ficient of α = 005 the calculated F and p values have been found to be significant
The regression coefficient of determi-nation (R2) which is calculated by the methodrsquos enter where all fibre param-eters are included in the equation is established as 750 In order to verify the proposed theoretical equations the number of estimated yarn neps has been determined by using fibre parameters The correlation between the estimated values that were calculated from the first regression equation and the real values obtained as results of yarn measurement by the Uster Tester has been established as 8103 (Figure 6)
As a result of the stepwise method which determines the most effective property for yarn nep prediction 2 different mod-els were obtained In the first model where the only parameter contributing the regression equation is yarn count the regression coefficient of determination is found as 693 On the basis of this re-sult it can be stated that yarn count is the most important factor for predicting yarn neps It has been found that the finer the yarn the more yarn neps occur so there is a positive correlation In the second model besides yarn count the uniform-ity index of fibres has been found to be significant and the regression coefficient of determination is found as 742 The correlation between the estimated values calculated from the 2nd regression equa-tion and real values has been found as 6893 whereas the correlation between the estimated values calculated from the
Table 3 Regression equations derived from fibre parameters measured by HVI instrument Ny ndash yarn neps Tt ndash linear density (yarn count) ls ndash spun length ls CV ndash spun length CV T ndash tenacity e ndash elongation Iu ndash uniformity index D ndash dust F ndash fineness
Regression equations determined by HVI data Regression coefficient of determination (R2)
Enter method Ny = 3169 ndash 145 Tt + 612 25 ls ndash 229 25 ls CV +ndash 293 T ndash 448 e ndash 150 Iu - 696 F (1) 750
Stepwisemethod
Ny = 5426 ndash 157 Tt (2) 693
Ny = 2084 ndash 149 Tt ndash188 Iu (3) 742
Table 4 Regression equations derived from fibre parameters measured by AFIS instrument Ny ndash yarn neps Tt ndash linear density (yarn count D ndash dust F ndash fineness Nf ndash fibre neps SFC ndash short fibre content SCN ndash seat coat neps VFM ndash visible fibre matter IFC ndash immature fiber content M ndash maturity Tr -trash
Regression equations determined by AFIS data Regression coefficient of determination (R2)
Enter MethodNy = 7286 ndash 167 Tt ndash 828 SFC ndash 194 IFC ndash 423 M ++ 205 F + 027 Nf ndash 230 SCN ndash 843 102 D +ndash 132 Tr + 767 VFM (4)
698
StepwiseMethod
Ny = 5889 ndash 144 Tt (5) 633
Ny = 1333 ndash 167 Tt + 786 M (6) 668
Ny = 1147 ndash 167 Tt + 562 M ndash 0069 SFC (7) 679
Figure 6 The comparison of the measured nep count and the estimated values with the fibre properties measured by HVI (the enter method)
Figure 7 The comparison of measured nep count and the estimated values with the fibre properties measured by HVI (stepwise method) a) model 2 and b) model 3
a)
b)
FIBRES amp TEXTILES in Eastern Europe July September 2006 Vol 14 No 3 (57)56 57FIBRES amp TEXTILES in Eastern Europe July September 2006 Vol 14 No 3 (57)
3rd equation and real values has been found as 6967 (see Figure 7)
By using the AFIS system (Advanced Fibre Information System) based on single fibre measurement several fibre properties were measured and regres-sion analyses carried out In Table 4 the regression equations derived from AFIS data are presented
As a result of the regression analyses carried out with AFIS parameters 4 dif-ferent models for estimating yarn neps have been derived In order to control the appropriateness of the regression equa-
tions variance analyses were carried out According to the significance coefficient of α = 005 the calculated F and p values have been found to be significant In this respect the regression between the yarn neps and fibre properties obtained from the AFIS system can be considered as significant
The determination coefficient of the re-gression equation as determined by the enter method in which all the fibre prop-erties are included in analysis was found to be 698 In order to check the valid-ity of this regression equation in practice the theoretical yarn nep count was calcu-lated by using the fibre parameters of the yarns produced The correlation coeffi-cient between the real and theoretical yarn nep counts (nep count per 1000 m) as calculated from the 4th equation was determined as 7818 The correlation between the real and theoretical values is represented in Figure 8
As the fibre parameters included in regres-sion equations are too difficult to calcu-late in order to determine the most effec-tive fibre properties that contribute to the regression equations more than the other parameters a regression analysis was car-ried out according to the stepwise method and 3 different equations were derived
In the fifth model where the only parame-ter contributing to the regression equation is yarn count the regression coefficient of determination is found to be 633 Similar to the regression results obtained from HVI parameters it can be stated that yarn count is the most important fac-tor for predicting the yarn nep number
In the sixth regression equation besides yarn count fibre maturity was found to be significant for estimating the yarn neps and the determination coefficient has been determined as 668 Fibre maturity in-fluences the tendency of fibres to entangle and form neps Many researchers have concluded that the tendency to cotton neps increases with the increment in immature and dead fibres Immature fibres have low rigidities and high buckling coefficients and can therefore become entangled into neps during mechanical processes In this study the effect of fibre maturity on yarn nep count has also been verified
In the seventh model determined by the stepwise method the regression equation contains yarn count the fibre maturity ratio and also the short-fibre content
The determination coefficient of the re-gression equation is 679 Short-fibre content in cotton means the ratio of fibres whose length is below 125 mm Due to the breaking of excessively long fibres or a lack of fibre orientation during in-tensive cleaning and opening of fibres short-fibre content (SFC) increases and indirectly the nep count will increase
In order to verify the proposed theoreti-cal regression equations calculated by the AFIS data the correlation between the real and measured yarn neps counts was compared For the 5th regression equa-tion which includes only yarn count as an independent variable the correlation between theoretical and real nep counts was determined as 7020 In the 6th regression equation of which independ-ent variables are yarn count and fibre maturity the correlation coefficient was determined as 7427 whereas in the 7th regression equation which includes yarn count fibre maturity and short-fibre content as independent variables the cor-relation coefficient was found as 7471 The correlation between estimated and measured values is presented in Figure 9
n Summary and conclusions In the first part of the study cottons from 11 different origins were investigated in respect to their nep content The neps content of raw materials was between 81 and 262 neps countg Turkish cottons from the Hatay region have the minimum nep amount whereas Greek cotton have the maximum quantity The difference in the nep content of raw cotton fibres can be explained by the fact that cottons from different origins are also subjected to dif-ferent ginning conditions
A first significant reduction in the nep content of the material takes place in card-ing process In this study with regard to fibre neps nep removal efficiency ranged between 67 and 84 whereas for seed-coat nep reduction this ranged between 25 and 79 On the basis of this result the following conclusions can be statedn The carding process is more effective
for the removal of fibre neps com-pared with seed-coat neps
n Nep removal efficiency should be calculated for each carding machines in a spinning mill this is especially important for evaluating carding performance and selecting optimum machine settings
Figure 8 The comparison of measured nep count and the estimated values with the fibre properties measured by AFIS (the enter method)
Figure 9 The comparison of measured nep count and estimated values with the fibre properties measured by AFIS (the stepwise method)
FIBRES amp TEXTILES in Eastern Europe July September 2006 Vol 14 No 3 (57)56 57FIBRES amp TEXTILES in Eastern Europe July September 2006 Vol 14 No 3 (57)
In the second part of the study in order to make a prognosis of the nep content in yarn which considerably influences yarn quality multivariate regression analyses have been carried out by using fibre properties measured by the HVI and AFIS instruments As it is known from previous studies that there is a clear connection between yarn count and yarn nep content yarn count is included both regression analyses assessed by HVI and AFIS data The analysis has shown that n yarn count makes the highest contri-
bution to the determination coefficient of regression equations
n to predict the number of yarn neps the most important fibre property measured by HVI is the uniformity in-dex whereas maturity ratio and short fibre content are the crucial properties measured by AFIS for determining yarn neps
n in order to estimate the yarn nep count which may affect the yarn and therefore the end product quality sig-nificantly both fibre properties meas-ured with HVI and AFIS instruments can be used
n However in spinning mills where both instruments are available the fibre properties measured with HVI instruments can be a satisfactory pre-dictor for yarn neps also especially as only two parameters are included in the equation and the regression coef-ficient of determination is higher the third model can be used
References1 Layton JM Buchanan RD Neps In
Cotton Lint Textile Progress Oxford 1999 28(4) 50p
2 Matusiak M and Frydrych I Effect of Raw Material and Processing Conditions on Yarn Neppiness 2002
3 Bel-Berger P And Roberts G 2002 Neps Devalue Cotton Australian Cotton Research Centre
4 Frydrych I and Matusiak M Trends of AFIS Application in Research and Industry Fibres and Textiles in Eastern Europe 2002 JulySeptember 35-39
5 Mogahzy Y Utilisation of the advanced fibre information system (AFIS) in the evaluation of the textile process 1997 Melliand English 78 1-4
6 Herbert JJ Mangialardi G And Ramey HH Neps in Cotton Processing Textile Research Journal 1986 56 (2) 108-111
7 Frydrych I and Matusiak M Predicting the Nep Number in Cotton Yarn-Determi-ning the Critical Nep Size Textile Rese-arch Journal 2002 72 (10) 917-923
Received 17092004 Reviewed 24082005
12th Workshop of the Polish Chitin Society
lsquoNew Aspects in Chitin Chemistry and Application of Chitin and its Derivativesrsquo
20 ndash 22 September 2006 Szczyrk PolandCo-Organisersn Institute of Biopolymers and Chemical Fibres Łoacutedź Polandn University of BielskondashBiała Bielsko-Biała Poland
Scientific CommitteeChairperson Małgorzata Jaworska Ph D EngMembers n Prof Danuta Pięta Ph D D Scn Anna Wojtasz-Pająk Ph Dn Jan Ignacak Ph Dn Marcin H Struszczyk Ph D Eng
Organisation CommitteeChairperson Antonii Niekraszewicz Ph D EngMembers M Kucharska Ph D Eng M Wiśniewska-Wrona M Sc Eng A Bodek Ph D Eng K Brzoza-Malczewska M Sc Eng
Three conference sessions are providedn Session A lsquoPolymer Problemsrsquo ndash chairpersons Jan Ignacak Ph D and Małgorzata
Jaworska Ph D Engn Session B lsquoBiological and Medical Aspectsrsquo ndash chairpersons
prof Danuta Pięta Ph D D Sc and Anna Wojtasz-Pająk Ph Dn Session C lsquoAgriculture Applicationrsquo ndash chairperson prof Maria Mucha Ph D D Sc
Selected lecturesn lsquoDetermination of the FA Value of Chitin and Chitosan Materials by a Sorption
Methodrsquo George A F Roberts University of Nottingham UKn lsquoSupermolecular Structure of Krill Chitin in the Field of Spectroscopic Inves-
tigationsrsquo Dorota Biniaś Włodzimierz Biniaś Stefan Boryniec University of BielskondashBiała Poland
n lsquoPartly Resorptional Surgical Netsrsquo Antonii Niekraszewicz Marcin H Struszczyk Magdalena Kucharska Dariusz Wawro Institute of Biopolymers and Chemical Fibres (IBChF) Łoacutedź Poland Tricomed Co Łoacutedź Poland
n lsquoBio-active Composite Materialsrsquo Magdalena Kucharska Antonii Niekrasze-wicz Jolanta Lebioda Kinga Brzoza-Malczewska Ewa Wesołowska Insti-tute of Biopolymers and Chemical Fibres (IBChF) Łoacutedź Poland
n lsquoMedical Applications of Chitin and Its Derivativesrsquo Marcin H Struszczyk Katarzyna Struszczyk Tricomed Co Łoacutedź Poland Technical University of Łoacutedź Poland
n lsquoInvestigation into Properties of Biological Products of Chitosan Degradationrsquo Maria Wiśniewska-Wrona Antonii Niekraszewicz Danuta Ciechańska Hen-ryk Pospieszny Leszek B Orlikowski Institute of Biopolymers and Chemical Fibres (IBChF) Łoacutedź Poland
n lsquoInfluence of Temperature and Chitosan Form on the Process of Sorption of Metal Ionsrsquo K Henryka Bodek Medical University Łoacutedź Poland
n lsquoInfluence of Temperature and Metal Ions on the Optical Properties of Chi-tosan in an Aqueous Solutionrsquo Marceli Koralewski K Henryka Bodek To-masz Wachowski University of Poznań Poland Medical University Łoacutedź Poland
n lsquoChanges of the Molecular Characteristic of Dibutyrylchitin Influenced by Ultrasoundsrdquo Joanna Szumilewicz Barbara Papin-Szafko Technical Uni-versity of Łoacutedź Poland Technical University of Szczecin Poland
n lsquoThermal Effects Concomitant with the Adsorption Process of Water by Chi-tosan with Different Deacetylation Degreesrsquo Maria Mucha Jacek Balcerzak Technical University of Łoacutedź Poland
For more information please contact
Conference Secretariat M Wiśniewska-Wrona M Sc Eng Tel (48-42) 637-03-39 E-mail biomateribwchlodzpl
Institute of Biopolymers and Chemical Fibresul M Skłodowskiej-Curie 1927 90-570 Łoacutedż Poland
FIBRES amp TEXTILES in Eastern Europe July September 2006 Vol 14 No 3 (57)54 55FIBRES amp TEXTILES in Eastern Europe July September 2006 Vol 14 No 3 (57)
the changes in nep content during yarn manufacturing stages are similar In all blends preliminary treatment of cotton in the opening and cleaning lines causes an increment in the nep number In the carding process a significant decrease in the level of neps takes place
For drawing and mixing the card slivers the 1st and 2nd passage draw-frame machines are used after the carding process On the basis of the results as can be seen from Figure 4 and 5 it can be stated that there is no significant change in the nep and seed-coat nep content at this stage of production The reason for the slight changes in nep content may arise from the doubling proc-ess because several card slivers containing different amount of neps are gathered and drawn together But however the 2nd pas-sage draw-frame sliver the raw material of which contains a higher nep content also includes many more neps
Prediction of yarn neps with fibre properties In the second part of the study cotton yarns whose counts (linear densities) range from 33 tex to 16 tex were pro-duced on a carded yarn manufacturing line In order to predict yarn neps by using the fibre parameters measured by the HVI and AFIS systems multivariate regression analyses were carried out Yarn neps measured by the Uster Tester instrument were considered as depend-ent-variable (y) and the yarn count and fibre parameters measured by the HVI and AFIS systems were considered as independent variables (x) The regression equations were derived separately for both the HVI and AFIS fibre parameters
Since the regression equations consist of so many fibre parameters in order to determine the most effective independ-ent variables which make the maximum contributions to the prediction of yarn neps a stepwise regression procedure was applied
In Table 3 the regression equations de-rived from HVI data are presented
As a result of the regression analyses with HVI parameters 3 different models for estimating yarn neps have been derived For controlling the appropriateness of the regression equations variance analyses were carried out for a significance coef-ficient of α = 005 the calculated F and p values have been found to be significant
The regression coefficient of determi-nation (R2) which is calculated by the methodrsquos enter where all fibre param-eters are included in the equation is established as 750 In order to verify the proposed theoretical equations the number of estimated yarn neps has been determined by using fibre parameters The correlation between the estimated values that were calculated from the first regression equation and the real values obtained as results of yarn measurement by the Uster Tester has been established as 8103 (Figure 6)
As a result of the stepwise method which determines the most effective property for yarn nep prediction 2 different mod-els were obtained In the first model where the only parameter contributing the regression equation is yarn count the regression coefficient of determination is found as 693 On the basis of this re-sult it can be stated that yarn count is the most important factor for predicting yarn neps It has been found that the finer the yarn the more yarn neps occur so there is a positive correlation In the second model besides yarn count the uniform-ity index of fibres has been found to be significant and the regression coefficient of determination is found as 742 The correlation between the estimated values calculated from the 2nd regression equa-tion and real values has been found as 6893 whereas the correlation between the estimated values calculated from the
Table 3 Regression equations derived from fibre parameters measured by HVI instrument Ny ndash yarn neps Tt ndash linear density (yarn count) ls ndash spun length ls CV ndash spun length CV T ndash tenacity e ndash elongation Iu ndash uniformity index D ndash dust F ndash fineness
Regression equations determined by HVI data Regression coefficient of determination (R2)
Enter method Ny = 3169 ndash 145 Tt + 612 25 ls ndash 229 25 ls CV +ndash 293 T ndash 448 e ndash 150 Iu - 696 F (1) 750
Stepwisemethod
Ny = 5426 ndash 157 Tt (2) 693
Ny = 2084 ndash 149 Tt ndash188 Iu (3) 742
Table 4 Regression equations derived from fibre parameters measured by AFIS instrument Ny ndash yarn neps Tt ndash linear density (yarn count D ndash dust F ndash fineness Nf ndash fibre neps SFC ndash short fibre content SCN ndash seat coat neps VFM ndash visible fibre matter IFC ndash immature fiber content M ndash maturity Tr -trash
Regression equations determined by AFIS data Regression coefficient of determination (R2)
Enter MethodNy = 7286 ndash 167 Tt ndash 828 SFC ndash 194 IFC ndash 423 M ++ 205 F + 027 Nf ndash 230 SCN ndash 843 102 D +ndash 132 Tr + 767 VFM (4)
698
StepwiseMethod
Ny = 5889 ndash 144 Tt (5) 633
Ny = 1333 ndash 167 Tt + 786 M (6) 668
Ny = 1147 ndash 167 Tt + 562 M ndash 0069 SFC (7) 679
Figure 6 The comparison of the measured nep count and the estimated values with the fibre properties measured by HVI (the enter method)
Figure 7 The comparison of measured nep count and the estimated values with the fibre properties measured by HVI (stepwise method) a) model 2 and b) model 3
a)
b)
FIBRES amp TEXTILES in Eastern Europe July September 2006 Vol 14 No 3 (57)56 57FIBRES amp TEXTILES in Eastern Europe July September 2006 Vol 14 No 3 (57)
3rd equation and real values has been found as 6967 (see Figure 7)
By using the AFIS system (Advanced Fibre Information System) based on single fibre measurement several fibre properties were measured and regres-sion analyses carried out In Table 4 the regression equations derived from AFIS data are presented
As a result of the regression analyses carried out with AFIS parameters 4 dif-ferent models for estimating yarn neps have been derived In order to control the appropriateness of the regression equa-
tions variance analyses were carried out According to the significance coefficient of α = 005 the calculated F and p values have been found to be significant In this respect the regression between the yarn neps and fibre properties obtained from the AFIS system can be considered as significant
The determination coefficient of the re-gression equation as determined by the enter method in which all the fibre prop-erties are included in analysis was found to be 698 In order to check the valid-ity of this regression equation in practice the theoretical yarn nep count was calcu-lated by using the fibre parameters of the yarns produced The correlation coeffi-cient between the real and theoretical yarn nep counts (nep count per 1000 m) as calculated from the 4th equation was determined as 7818 The correlation between the real and theoretical values is represented in Figure 8
As the fibre parameters included in regres-sion equations are too difficult to calcu-late in order to determine the most effec-tive fibre properties that contribute to the regression equations more than the other parameters a regression analysis was car-ried out according to the stepwise method and 3 different equations were derived
In the fifth model where the only parame-ter contributing to the regression equation is yarn count the regression coefficient of determination is found to be 633 Similar to the regression results obtained from HVI parameters it can be stated that yarn count is the most important fac-tor for predicting the yarn nep number
In the sixth regression equation besides yarn count fibre maturity was found to be significant for estimating the yarn neps and the determination coefficient has been determined as 668 Fibre maturity in-fluences the tendency of fibres to entangle and form neps Many researchers have concluded that the tendency to cotton neps increases with the increment in immature and dead fibres Immature fibres have low rigidities and high buckling coefficients and can therefore become entangled into neps during mechanical processes In this study the effect of fibre maturity on yarn nep count has also been verified
In the seventh model determined by the stepwise method the regression equation contains yarn count the fibre maturity ratio and also the short-fibre content
The determination coefficient of the re-gression equation is 679 Short-fibre content in cotton means the ratio of fibres whose length is below 125 mm Due to the breaking of excessively long fibres or a lack of fibre orientation during in-tensive cleaning and opening of fibres short-fibre content (SFC) increases and indirectly the nep count will increase
In order to verify the proposed theoreti-cal regression equations calculated by the AFIS data the correlation between the real and measured yarn neps counts was compared For the 5th regression equa-tion which includes only yarn count as an independent variable the correlation between theoretical and real nep counts was determined as 7020 In the 6th regression equation of which independ-ent variables are yarn count and fibre maturity the correlation coefficient was determined as 7427 whereas in the 7th regression equation which includes yarn count fibre maturity and short-fibre content as independent variables the cor-relation coefficient was found as 7471 The correlation between estimated and measured values is presented in Figure 9
n Summary and conclusions In the first part of the study cottons from 11 different origins were investigated in respect to their nep content The neps content of raw materials was between 81 and 262 neps countg Turkish cottons from the Hatay region have the minimum nep amount whereas Greek cotton have the maximum quantity The difference in the nep content of raw cotton fibres can be explained by the fact that cottons from different origins are also subjected to dif-ferent ginning conditions
A first significant reduction in the nep content of the material takes place in card-ing process In this study with regard to fibre neps nep removal efficiency ranged between 67 and 84 whereas for seed-coat nep reduction this ranged between 25 and 79 On the basis of this result the following conclusions can be statedn The carding process is more effective
for the removal of fibre neps com-pared with seed-coat neps
n Nep removal efficiency should be calculated for each carding machines in a spinning mill this is especially important for evaluating carding performance and selecting optimum machine settings
Figure 8 The comparison of measured nep count and the estimated values with the fibre properties measured by AFIS (the enter method)
Figure 9 The comparison of measured nep count and estimated values with the fibre properties measured by AFIS (the stepwise method)
FIBRES amp TEXTILES in Eastern Europe July September 2006 Vol 14 No 3 (57)56 57FIBRES amp TEXTILES in Eastern Europe July September 2006 Vol 14 No 3 (57)
In the second part of the study in order to make a prognosis of the nep content in yarn which considerably influences yarn quality multivariate regression analyses have been carried out by using fibre properties measured by the HVI and AFIS instruments As it is known from previous studies that there is a clear connection between yarn count and yarn nep content yarn count is included both regression analyses assessed by HVI and AFIS data The analysis has shown that n yarn count makes the highest contri-
bution to the determination coefficient of regression equations
n to predict the number of yarn neps the most important fibre property measured by HVI is the uniformity in-dex whereas maturity ratio and short fibre content are the crucial properties measured by AFIS for determining yarn neps
n in order to estimate the yarn nep count which may affect the yarn and therefore the end product quality sig-nificantly both fibre properties meas-ured with HVI and AFIS instruments can be used
n However in spinning mills where both instruments are available the fibre properties measured with HVI instruments can be a satisfactory pre-dictor for yarn neps also especially as only two parameters are included in the equation and the regression coef-ficient of determination is higher the third model can be used
References1 Layton JM Buchanan RD Neps In
Cotton Lint Textile Progress Oxford 1999 28(4) 50p
2 Matusiak M and Frydrych I Effect of Raw Material and Processing Conditions on Yarn Neppiness 2002
3 Bel-Berger P And Roberts G 2002 Neps Devalue Cotton Australian Cotton Research Centre
4 Frydrych I and Matusiak M Trends of AFIS Application in Research and Industry Fibres and Textiles in Eastern Europe 2002 JulySeptember 35-39
5 Mogahzy Y Utilisation of the advanced fibre information system (AFIS) in the evaluation of the textile process 1997 Melliand English 78 1-4
6 Herbert JJ Mangialardi G And Ramey HH Neps in Cotton Processing Textile Research Journal 1986 56 (2) 108-111
7 Frydrych I and Matusiak M Predicting the Nep Number in Cotton Yarn-Determi-ning the Critical Nep Size Textile Rese-arch Journal 2002 72 (10) 917-923
Received 17092004 Reviewed 24082005
12th Workshop of the Polish Chitin Society
lsquoNew Aspects in Chitin Chemistry and Application of Chitin and its Derivativesrsquo
20 ndash 22 September 2006 Szczyrk PolandCo-Organisersn Institute of Biopolymers and Chemical Fibres Łoacutedź Polandn University of BielskondashBiała Bielsko-Biała Poland
Scientific CommitteeChairperson Małgorzata Jaworska Ph D EngMembers n Prof Danuta Pięta Ph D D Scn Anna Wojtasz-Pająk Ph Dn Jan Ignacak Ph Dn Marcin H Struszczyk Ph D Eng
Organisation CommitteeChairperson Antonii Niekraszewicz Ph D EngMembers M Kucharska Ph D Eng M Wiśniewska-Wrona M Sc Eng A Bodek Ph D Eng K Brzoza-Malczewska M Sc Eng
Three conference sessions are providedn Session A lsquoPolymer Problemsrsquo ndash chairpersons Jan Ignacak Ph D and Małgorzata
Jaworska Ph D Engn Session B lsquoBiological and Medical Aspectsrsquo ndash chairpersons
prof Danuta Pięta Ph D D Sc and Anna Wojtasz-Pająk Ph Dn Session C lsquoAgriculture Applicationrsquo ndash chairperson prof Maria Mucha Ph D D Sc
Selected lecturesn lsquoDetermination of the FA Value of Chitin and Chitosan Materials by a Sorption
Methodrsquo George A F Roberts University of Nottingham UKn lsquoSupermolecular Structure of Krill Chitin in the Field of Spectroscopic Inves-
tigationsrsquo Dorota Biniaś Włodzimierz Biniaś Stefan Boryniec University of BielskondashBiała Poland
n lsquoPartly Resorptional Surgical Netsrsquo Antonii Niekraszewicz Marcin H Struszczyk Magdalena Kucharska Dariusz Wawro Institute of Biopolymers and Chemical Fibres (IBChF) Łoacutedź Poland Tricomed Co Łoacutedź Poland
n lsquoBio-active Composite Materialsrsquo Magdalena Kucharska Antonii Niekrasze-wicz Jolanta Lebioda Kinga Brzoza-Malczewska Ewa Wesołowska Insti-tute of Biopolymers and Chemical Fibres (IBChF) Łoacutedź Poland
n lsquoMedical Applications of Chitin and Its Derivativesrsquo Marcin H Struszczyk Katarzyna Struszczyk Tricomed Co Łoacutedź Poland Technical University of Łoacutedź Poland
n lsquoInvestigation into Properties of Biological Products of Chitosan Degradationrsquo Maria Wiśniewska-Wrona Antonii Niekraszewicz Danuta Ciechańska Hen-ryk Pospieszny Leszek B Orlikowski Institute of Biopolymers and Chemical Fibres (IBChF) Łoacutedź Poland
n lsquoInfluence of Temperature and Chitosan Form on the Process of Sorption of Metal Ionsrsquo K Henryka Bodek Medical University Łoacutedź Poland
n lsquoInfluence of Temperature and Metal Ions on the Optical Properties of Chi-tosan in an Aqueous Solutionrsquo Marceli Koralewski K Henryka Bodek To-masz Wachowski University of Poznań Poland Medical University Łoacutedź Poland
n lsquoChanges of the Molecular Characteristic of Dibutyrylchitin Influenced by Ultrasoundsrdquo Joanna Szumilewicz Barbara Papin-Szafko Technical Uni-versity of Łoacutedź Poland Technical University of Szczecin Poland
n lsquoThermal Effects Concomitant with the Adsorption Process of Water by Chi-tosan with Different Deacetylation Degreesrsquo Maria Mucha Jacek Balcerzak Technical University of Łoacutedź Poland
For more information please contact
Conference Secretariat M Wiśniewska-Wrona M Sc Eng Tel (48-42) 637-03-39 E-mail biomateribwchlodzpl
Institute of Biopolymers and Chemical Fibresul M Skłodowskiej-Curie 1927 90-570 Łoacutedż Poland
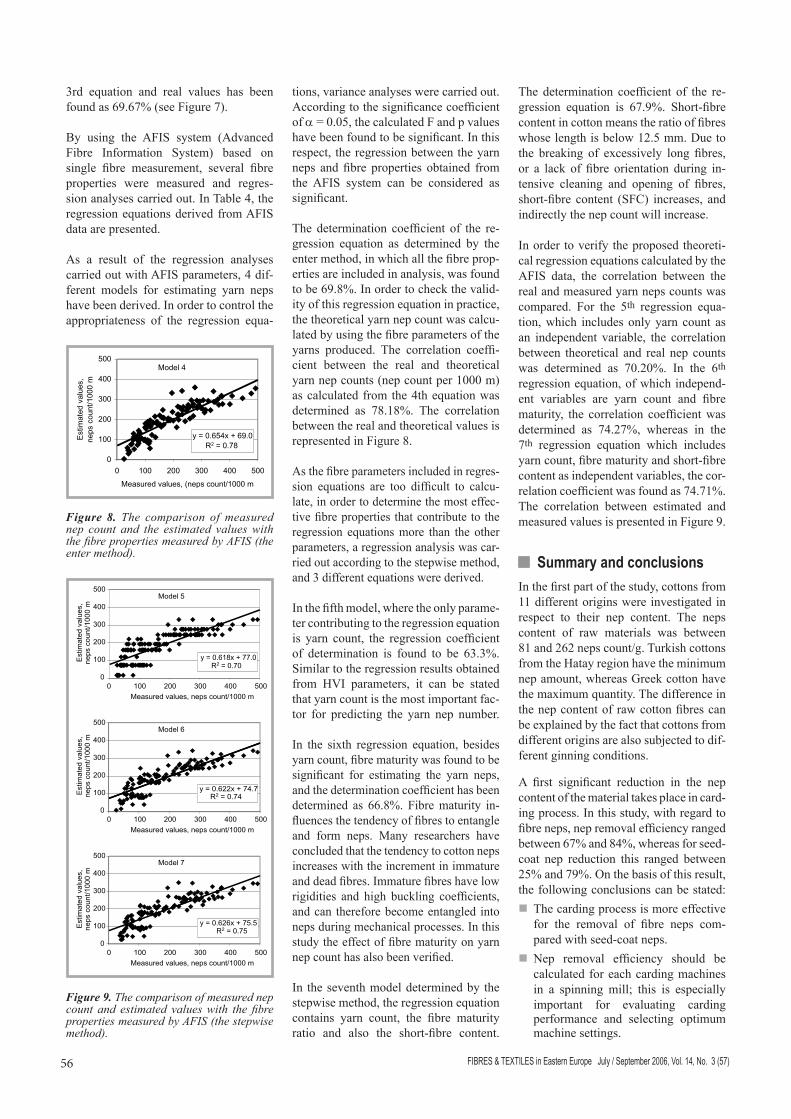
FIBRES amp TEXTILES in Eastern Europe July September 2006 Vol 14 No 3 (57)56 57FIBRES amp TEXTILES in Eastern Europe July September 2006 Vol 14 No 3 (57)
3rd equation and real values has been found as 6967 (see Figure 7)
By using the AFIS system (Advanced Fibre Information System) based on single fibre measurement several fibre properties were measured and regres-sion analyses carried out In Table 4 the regression equations derived from AFIS data are presented
As a result of the regression analyses carried out with AFIS parameters 4 dif-ferent models for estimating yarn neps have been derived In order to control the appropriateness of the regression equa-
tions variance analyses were carried out According to the significance coefficient of α = 005 the calculated F and p values have been found to be significant In this respect the regression between the yarn neps and fibre properties obtained from the AFIS system can be considered as significant
The determination coefficient of the re-gression equation as determined by the enter method in which all the fibre prop-erties are included in analysis was found to be 698 In order to check the valid-ity of this regression equation in practice the theoretical yarn nep count was calcu-lated by using the fibre parameters of the yarns produced The correlation coeffi-cient between the real and theoretical yarn nep counts (nep count per 1000 m) as calculated from the 4th equation was determined as 7818 The correlation between the real and theoretical values is represented in Figure 8
As the fibre parameters included in regres-sion equations are too difficult to calcu-late in order to determine the most effec-tive fibre properties that contribute to the regression equations more than the other parameters a regression analysis was car-ried out according to the stepwise method and 3 different equations were derived
In the fifth model where the only parame-ter contributing to the regression equation is yarn count the regression coefficient of determination is found to be 633 Similar to the regression results obtained from HVI parameters it can be stated that yarn count is the most important fac-tor for predicting the yarn nep number
In the sixth regression equation besides yarn count fibre maturity was found to be significant for estimating the yarn neps and the determination coefficient has been determined as 668 Fibre maturity in-fluences the tendency of fibres to entangle and form neps Many researchers have concluded that the tendency to cotton neps increases with the increment in immature and dead fibres Immature fibres have low rigidities and high buckling coefficients and can therefore become entangled into neps during mechanical processes In this study the effect of fibre maturity on yarn nep count has also been verified
In the seventh model determined by the stepwise method the regression equation contains yarn count the fibre maturity ratio and also the short-fibre content
The determination coefficient of the re-gression equation is 679 Short-fibre content in cotton means the ratio of fibres whose length is below 125 mm Due to the breaking of excessively long fibres or a lack of fibre orientation during in-tensive cleaning and opening of fibres short-fibre content (SFC) increases and indirectly the nep count will increase
In order to verify the proposed theoreti-cal regression equations calculated by the AFIS data the correlation between the real and measured yarn neps counts was compared For the 5th regression equa-tion which includes only yarn count as an independent variable the correlation between theoretical and real nep counts was determined as 7020 In the 6th regression equation of which independ-ent variables are yarn count and fibre maturity the correlation coefficient was determined as 7427 whereas in the 7th regression equation which includes yarn count fibre maturity and short-fibre content as independent variables the cor-relation coefficient was found as 7471 The correlation between estimated and measured values is presented in Figure 9
n Summary and conclusions In the first part of the study cottons from 11 different origins were investigated in respect to their nep content The neps content of raw materials was between 81 and 262 neps countg Turkish cottons from the Hatay region have the minimum nep amount whereas Greek cotton have the maximum quantity The difference in the nep content of raw cotton fibres can be explained by the fact that cottons from different origins are also subjected to dif-ferent ginning conditions
A first significant reduction in the nep content of the material takes place in card-ing process In this study with regard to fibre neps nep removal efficiency ranged between 67 and 84 whereas for seed-coat nep reduction this ranged between 25 and 79 On the basis of this result the following conclusions can be statedn The carding process is more effective
for the removal of fibre neps com-pared with seed-coat neps
n Nep removal efficiency should be calculated for each carding machines in a spinning mill this is especially important for evaluating carding performance and selecting optimum machine settings
Figure 8 The comparison of measured nep count and the estimated values with the fibre properties measured by AFIS (the enter method)
Figure 9 The comparison of measured nep count and estimated values with the fibre properties measured by AFIS (the stepwise method)
FIBRES amp TEXTILES in Eastern Europe July September 2006 Vol 14 No 3 (57)56 57FIBRES amp TEXTILES in Eastern Europe July September 2006 Vol 14 No 3 (57)
In the second part of the study in order to make a prognosis of the nep content in yarn which considerably influences yarn quality multivariate regression analyses have been carried out by using fibre properties measured by the HVI and AFIS instruments As it is known from previous studies that there is a clear connection between yarn count and yarn nep content yarn count is included both regression analyses assessed by HVI and AFIS data The analysis has shown that n yarn count makes the highest contri-
bution to the determination coefficient of regression equations
n to predict the number of yarn neps the most important fibre property measured by HVI is the uniformity in-dex whereas maturity ratio and short fibre content are the crucial properties measured by AFIS for determining yarn neps
n in order to estimate the yarn nep count which may affect the yarn and therefore the end product quality sig-nificantly both fibre properties meas-ured with HVI and AFIS instruments can be used
n However in spinning mills where both instruments are available the fibre properties measured with HVI instruments can be a satisfactory pre-dictor for yarn neps also especially as only two parameters are included in the equation and the regression coef-ficient of determination is higher the third model can be used
References1 Layton JM Buchanan RD Neps In
Cotton Lint Textile Progress Oxford 1999 28(4) 50p
2 Matusiak M and Frydrych I Effect of Raw Material and Processing Conditions on Yarn Neppiness 2002
3 Bel-Berger P And Roberts G 2002 Neps Devalue Cotton Australian Cotton Research Centre
4 Frydrych I and Matusiak M Trends of AFIS Application in Research and Industry Fibres and Textiles in Eastern Europe 2002 JulySeptember 35-39
5 Mogahzy Y Utilisation of the advanced fibre information system (AFIS) in the evaluation of the textile process 1997 Melliand English 78 1-4
6 Herbert JJ Mangialardi G And Ramey HH Neps in Cotton Processing Textile Research Journal 1986 56 (2) 108-111
7 Frydrych I and Matusiak M Predicting the Nep Number in Cotton Yarn-Determi-ning the Critical Nep Size Textile Rese-arch Journal 2002 72 (10) 917-923
Received 17092004 Reviewed 24082005
12th Workshop of the Polish Chitin Society
lsquoNew Aspects in Chitin Chemistry and Application of Chitin and its Derivativesrsquo
20 ndash 22 September 2006 Szczyrk PolandCo-Organisersn Institute of Biopolymers and Chemical Fibres Łoacutedź Polandn University of BielskondashBiała Bielsko-Biała Poland
Scientific CommitteeChairperson Małgorzata Jaworska Ph D EngMembers n Prof Danuta Pięta Ph D D Scn Anna Wojtasz-Pająk Ph Dn Jan Ignacak Ph Dn Marcin H Struszczyk Ph D Eng
Organisation CommitteeChairperson Antonii Niekraszewicz Ph D EngMembers M Kucharska Ph D Eng M Wiśniewska-Wrona M Sc Eng A Bodek Ph D Eng K Brzoza-Malczewska M Sc Eng
Three conference sessions are providedn Session A lsquoPolymer Problemsrsquo ndash chairpersons Jan Ignacak Ph D and Małgorzata
Jaworska Ph D Engn Session B lsquoBiological and Medical Aspectsrsquo ndash chairpersons
prof Danuta Pięta Ph D D Sc and Anna Wojtasz-Pająk Ph Dn Session C lsquoAgriculture Applicationrsquo ndash chairperson prof Maria Mucha Ph D D Sc
Selected lecturesn lsquoDetermination of the FA Value of Chitin and Chitosan Materials by a Sorption
Methodrsquo George A F Roberts University of Nottingham UKn lsquoSupermolecular Structure of Krill Chitin in the Field of Spectroscopic Inves-
tigationsrsquo Dorota Biniaś Włodzimierz Biniaś Stefan Boryniec University of BielskondashBiała Poland
n lsquoPartly Resorptional Surgical Netsrsquo Antonii Niekraszewicz Marcin H Struszczyk Magdalena Kucharska Dariusz Wawro Institute of Biopolymers and Chemical Fibres (IBChF) Łoacutedź Poland Tricomed Co Łoacutedź Poland
n lsquoBio-active Composite Materialsrsquo Magdalena Kucharska Antonii Niekrasze-wicz Jolanta Lebioda Kinga Brzoza-Malczewska Ewa Wesołowska Insti-tute of Biopolymers and Chemical Fibres (IBChF) Łoacutedź Poland
n lsquoMedical Applications of Chitin and Its Derivativesrsquo Marcin H Struszczyk Katarzyna Struszczyk Tricomed Co Łoacutedź Poland Technical University of Łoacutedź Poland
n lsquoInvestigation into Properties of Biological Products of Chitosan Degradationrsquo Maria Wiśniewska-Wrona Antonii Niekraszewicz Danuta Ciechańska Hen-ryk Pospieszny Leszek B Orlikowski Institute of Biopolymers and Chemical Fibres (IBChF) Łoacutedź Poland
n lsquoInfluence of Temperature and Chitosan Form on the Process of Sorption of Metal Ionsrsquo K Henryka Bodek Medical University Łoacutedź Poland
n lsquoInfluence of Temperature and Metal Ions on the Optical Properties of Chi-tosan in an Aqueous Solutionrsquo Marceli Koralewski K Henryka Bodek To-masz Wachowski University of Poznań Poland Medical University Łoacutedź Poland
n lsquoChanges of the Molecular Characteristic of Dibutyrylchitin Influenced by Ultrasoundsrdquo Joanna Szumilewicz Barbara Papin-Szafko Technical Uni-versity of Łoacutedź Poland Technical University of Szczecin Poland
n lsquoThermal Effects Concomitant with the Adsorption Process of Water by Chi-tosan with Different Deacetylation Degreesrsquo Maria Mucha Jacek Balcerzak Technical University of Łoacutedź Poland
For more information please contact
Conference Secretariat M Wiśniewska-Wrona M Sc Eng Tel (48-42) 637-03-39 E-mail biomateribwchlodzpl
Institute of Biopolymers and Chemical Fibresul M Skłodowskiej-Curie 1927 90-570 Łoacutedż Poland
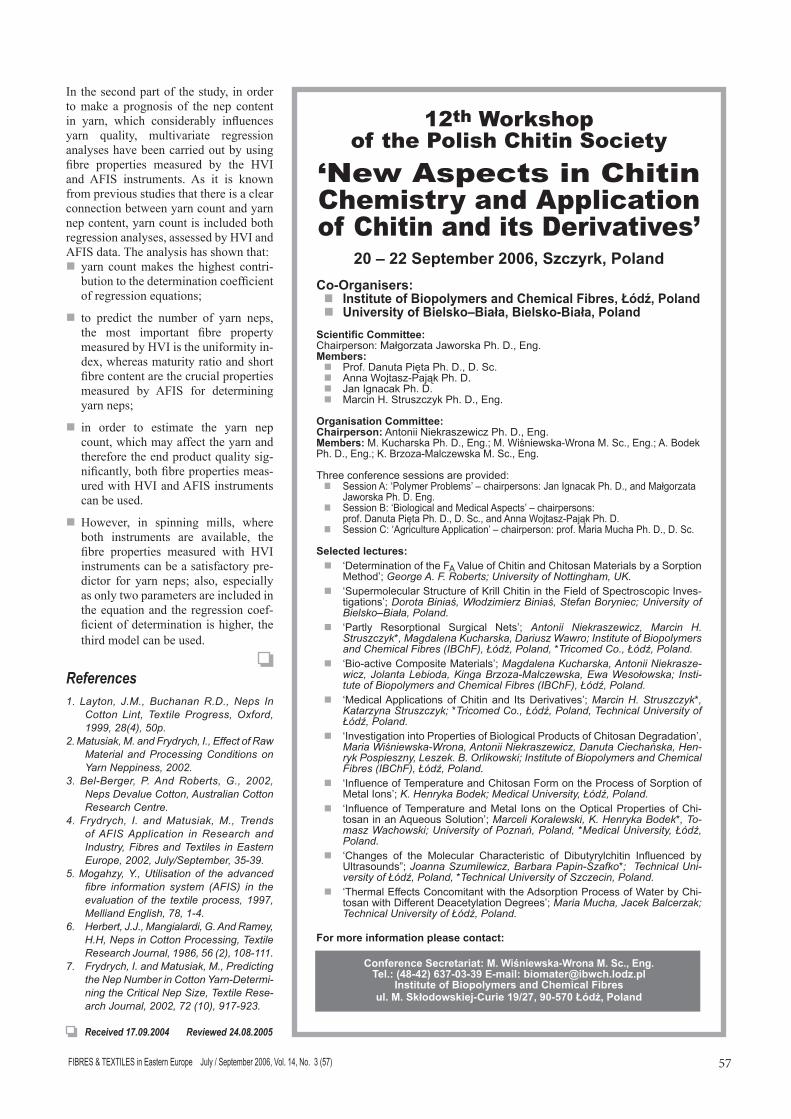
FIBRES amp TEXTILES in Eastern Europe July September 2006 Vol 14 No 3 (57)56 57FIBRES amp TEXTILES in Eastern Europe July September 2006 Vol 14 No 3 (57)
In the second part of the study in order to make a prognosis of the nep content in yarn which considerably influences yarn quality multivariate regression analyses have been carried out by using fibre properties measured by the HVI and AFIS instruments As it is known from previous studies that there is a clear connection between yarn count and yarn nep content yarn count is included both regression analyses assessed by HVI and AFIS data The analysis has shown that n yarn count makes the highest contri-
bution to the determination coefficient of regression equations
n to predict the number of yarn neps the most important fibre property measured by HVI is the uniformity in-dex whereas maturity ratio and short fibre content are the crucial properties measured by AFIS for determining yarn neps
n in order to estimate the yarn nep count which may affect the yarn and therefore the end product quality sig-nificantly both fibre properties meas-ured with HVI and AFIS instruments can be used
n However in spinning mills where both instruments are available the fibre properties measured with HVI instruments can be a satisfactory pre-dictor for yarn neps also especially as only two parameters are included in the equation and the regression coef-ficient of determination is higher the third model can be used
References1 Layton JM Buchanan RD Neps In
Cotton Lint Textile Progress Oxford 1999 28(4) 50p
2 Matusiak M and Frydrych I Effect of Raw Material and Processing Conditions on Yarn Neppiness 2002
3 Bel-Berger P And Roberts G 2002 Neps Devalue Cotton Australian Cotton Research Centre
4 Frydrych I and Matusiak M Trends of AFIS Application in Research and Industry Fibres and Textiles in Eastern Europe 2002 JulySeptember 35-39
5 Mogahzy Y Utilisation of the advanced fibre information system (AFIS) in the evaluation of the textile process 1997 Melliand English 78 1-4
6 Herbert JJ Mangialardi G And Ramey HH Neps in Cotton Processing Textile Research Journal 1986 56 (2) 108-111
7 Frydrych I and Matusiak M Predicting the Nep Number in Cotton Yarn-Determi-ning the Critical Nep Size Textile Rese-arch Journal 2002 72 (10) 917-923
Received 17092004 Reviewed 24082005
12th Workshop of the Polish Chitin Society
lsquoNew Aspects in Chitin Chemistry and Application of Chitin and its Derivativesrsquo
20 ndash 22 September 2006 Szczyrk PolandCo-Organisersn Institute of Biopolymers and Chemical Fibres Łoacutedź Polandn University of BielskondashBiała Bielsko-Biała Poland
Scientific CommitteeChairperson Małgorzata Jaworska Ph D EngMembers n Prof Danuta Pięta Ph D D Scn Anna Wojtasz-Pająk Ph Dn Jan Ignacak Ph Dn Marcin H Struszczyk Ph D Eng
Organisation CommitteeChairperson Antonii Niekraszewicz Ph D EngMembers M Kucharska Ph D Eng M Wiśniewska-Wrona M Sc Eng A Bodek Ph D Eng K Brzoza-Malczewska M Sc Eng
Three conference sessions are providedn Session A lsquoPolymer Problemsrsquo ndash chairpersons Jan Ignacak Ph D and Małgorzata
Jaworska Ph D Engn Session B lsquoBiological and Medical Aspectsrsquo ndash chairpersons
prof Danuta Pięta Ph D D Sc and Anna Wojtasz-Pająk Ph Dn Session C lsquoAgriculture Applicationrsquo ndash chairperson prof Maria Mucha Ph D D Sc
Selected lecturesn lsquoDetermination of the FA Value of Chitin and Chitosan Materials by a Sorption
Methodrsquo George A F Roberts University of Nottingham UKn lsquoSupermolecular Structure of Krill Chitin in the Field of Spectroscopic Inves-
tigationsrsquo Dorota Biniaś Włodzimierz Biniaś Stefan Boryniec University of BielskondashBiała Poland
n lsquoPartly Resorptional Surgical Netsrsquo Antonii Niekraszewicz Marcin H Struszczyk Magdalena Kucharska Dariusz Wawro Institute of Biopolymers and Chemical Fibres (IBChF) Łoacutedź Poland Tricomed Co Łoacutedź Poland
n lsquoBio-active Composite Materialsrsquo Magdalena Kucharska Antonii Niekrasze-wicz Jolanta Lebioda Kinga Brzoza-Malczewska Ewa Wesołowska Insti-tute of Biopolymers and Chemical Fibres (IBChF) Łoacutedź Poland
n lsquoMedical Applications of Chitin and Its Derivativesrsquo Marcin H Struszczyk Katarzyna Struszczyk Tricomed Co Łoacutedź Poland Technical University of Łoacutedź Poland
n lsquoInvestigation into Properties of Biological Products of Chitosan Degradationrsquo Maria Wiśniewska-Wrona Antonii Niekraszewicz Danuta Ciechańska Hen-ryk Pospieszny Leszek B Orlikowski Institute of Biopolymers and Chemical Fibres (IBChF) Łoacutedź Poland
n lsquoInfluence of Temperature and Chitosan Form on the Process of Sorption of Metal Ionsrsquo K Henryka Bodek Medical University Łoacutedź Poland
n lsquoInfluence of Temperature and Metal Ions on the Optical Properties of Chi-tosan in an Aqueous Solutionrsquo Marceli Koralewski K Henryka Bodek To-masz Wachowski University of Poznań Poland Medical University Łoacutedź Poland
n lsquoChanges of the Molecular Characteristic of Dibutyrylchitin Influenced by Ultrasoundsrdquo Joanna Szumilewicz Barbara Papin-Szafko Technical Uni-versity of Łoacutedź Poland Technical University of Szczecin Poland
n lsquoThermal Effects Concomitant with the Adsorption Process of Water by Chi-tosan with Different Deacetylation Degreesrsquo Maria Mucha Jacek Balcerzak Technical University of Łoacutedź Poland
For more information please contact
Conference Secretariat M Wiśniewska-Wrona M Sc Eng Tel (48-42) 637-03-39 E-mail biomateribwchlodzpl
Institute of Biopolymers and Chemical Fibresul M Skłodowskiej-Curie 1927 90-570 Łoacutedż Poland