frequency-dependent dielectric properties and...
TRANSCRIPT

1
Frequency-Dependent Dielectric Properties and Percolation Behavior of Alumina-Silicon Carbide Whisker Composites Brian D. Bertram and Rosario A. Gerhardt* School of Materials Science and Engineering Georgia Institute of Technology Atlanta, GA 30332-0245 USA 1 *To whom correspondence should be addressed: Prof. R.A. Gerhardt, Telephone (404) 894-6886, e-mail: [email protected] Keywords: percolation, Maxwell-Wagner, silicon carbide, whiskers, interfacial, space-charge, polarization, relaxation, damped resonance, alumina, ceramic-matrix composites, fluctuation-induced tunneling, insulator-conductor composites, conductive fillers, impedance spectroscopy, dielectric spectroscopy, permittivity, electrical properties, resistivity, conductivity, dielectric constant, dielectric loss, lossy materials, microwave heating Abstract
The electrical and dielectric properties of hot-pressed composites containing alumina and silicon
carbide (SiC) whiskers were characterized over a wide frequency range (0.1 Hz – 1.8 GHz).
Percolation of the whiskers caused a drastic increase in the dc conductivity and the prominence
of a dc-conductivity tail associated with a high-frequency Maxwell-Wagner interfacial
polarization. In percolated samples, conduction seemed to be controlled by fluctuation-induced
tunneling and the tail obscured the dielectric loss peak. In non-percolated samples, the loss peak
was observed and the complex permittivity data was fit with a modified Maxwell-Wagner
equation to account for a distribution of relaxation times. Orientation dependencies of the fitting
parameters, dc-conductivity, and permittivity dispersions (both real and imaginary) were
discussed in terms of the average distances for tunneling or high-frequency capacitive coupling
between the SiC inclusions along the different directions of the axisymmetric microstructure.
Stereological measurements indicated that these distances are probably longer along the hot-
pressing direction compared to the perpendicular direction. Also, a damped resonance was
Funding from NSF DMR-0604211 and an additional Georgia Tech Presidential Fellowship for BDB are acknowledged and appreciated.
2
observed between 1.4 - 1.7 GHz and was attributed to impurities in the whiskers. This resonance
and the Maxwell-Wagner relaxation likely influence the commercial application of this
composite system.
Keywords: percolation, Maxwell-Wagner, silicon carbide, whiskers, interfacial, space-charge,
polarization, relaxation, damped resonance, alumina, ceramic-matrix composites, fluctuation-
induced tunneling, insulator-conductor composites, conductive fillers, hot pressing, impedance
spectroscopy, dielectric spectroscopy, permittivity, electrical properties, resistivity, conductivity,
dielectric constant, dielectric loss, lossy materials, microwave heating
Introduction
Ceramic composites of alumina (Al2O3) filled with silicon carbide whiskers (SiCw) have
a commercialized application in grills and flat stones for microwave heating and cooking.1-2 It
has been deduced that some characteristic of the SiC whiskers produced by Advanced Composite
Materials results in faster heating rates compared to other forms of SiC when subjected to a
microwave electric field.3 The microwave-frequency dielectric properties of the composites are
the basis of the heating application but most of the previous work on electrical properties of these
composites has focused on the dc-conductivity of the bulk and electrodes.4-6 Some work has been
done on the dielectric properties of similar composites which use mullite in place of alumina for
the matrix.7-9 These studies show snapshots of particular high frequencies and do not show the
complete spectrum transitioning to the microwave range from lower frequencies. Regardless of
matrix material, the electrical and dielectric properties of SiCw-containing composites have been
found to depend on the orientation of the electrical measurement relative to the preferred
orientation of the whiskers5,8,10 and the axisymmetric microstructure which results from hot-
pressing.11-13
3
In general, the frequency-dependent complex relative dielectric constant εr* is composed
of a real part εr′ and an imaginary part jεr″ and is often written as14-15
εr* = εr′ - jεr″ (1)
where -εr″ is called the dielectric loss, j = 1− and the subscript “r” indicates relation to the
vacuum permittivity ε0, i.e. the complex permittivity of a medium is ε* = εr*ε0.
The volumetric microwave heating rate
dt
dT
V
of a material at a particular frequency
depends on the imaginary part in Equation 1 and is given by the equation15
dt
dT
V
= ( )
DC
fE
p
ε″ε−π 0r
2
2 (2)
where f is the frequency, E is the magnitude of electric field, Cp is the heat capacity at constant
pressure, and D is the material density. Thus, the dielectric loss is the material property that
determines the power delivered per unit volume (i.e. the numerator in Equation 2) and generally
includes loss contributions from all forms of frequency-dependent polarization or resonance and
the dc conductivity σdc of the material, i.e.
(-εr″) = (-εr″)di + (-εr″)ion + (-εr″)el + (-εr″)MW + επ
σf2 0
dc (3)
Here, the superscripts refer to dipolar (di), ionic (ion), electronic (el) and Maxwell-Wagner
(MW) polarizations and the last term in the sum follows from the Maxwell-Wagner theory of a
two-layer condenser.16 In this theory, interfacial space-charge polarization occurs at the interface
of two contacting slabs of frequency-independent materials with significantly different
conductivities (σ1, σ2) and real dielectric constants (ε1, ε2). The relaxation time constant τ of
such a polarization can be written as

4
τ = ε0VV
VV
1221
1221
σ+σε+ε
(4)
where V2 and V1 are the volume fractions of the two different materials. The complex dielectric
constant resulting from a Maxwell-Wagner interfacial space-charge polarization (εr*) MW can be
written as
(εr*)MW = ′ε∞ + ( ) −
ωτ+
′ε−′εα−
∞
j 1s
1 ωεσ
0
dcj (5)
where ε∞′ and εs′ are the real parts of the complex relative dielectric constant at the high- and
low-frequency extremes, ω=2πf, and (1-α) is an empirical fitting exponent which accounts for a
distribution of relaxation times. For an ideal Maxwell-Wagner polarization with a single
relaxation time, α=0. Cole and Cole first introduced such an exponent to modify the Debye
equation, which has a similar form and describes dipole polarizations. In their 1941 paper, the
effect of α on the related real and imaginary parts of εr* is explicitly shown.14
In 2001, Runyan, Gerhardt and Ruh employed such an exponent to account for a
distribution of relaxation times and fit the real (εr′) part of data for a Maxwell-Wagner
polarization in another composite system based on SiC conductivity.17 Maxwell-Wagner
polarizations generally result in a peak in the loss function (-εr″).16 However, significant dc
conductivity in the material gives rise to a “tail,” i.e. the -εr″ function increases with decreasing
frequency. This dc-conductivity tail follows from the rightmost term in Equation 5 and
superimposes on top of and can fully or partially obscure the presence of the loss peak.15
The formation of a conductive percolated network in a composite can be expected to have
a strong influence on the dielectric loss because it is known to cause a dramatic increase in the

5
conductivity of these composites. In general, the complex impedance Z* of a material-electrode
system has a real part Z′ and an imaginary part jZ″, i.e.
Z* = Z′ - jZ″ (6)
and is related to the loss of the system by
-εr″ = ( ) ( ) ]ZZ[ 22
0 ′′+′ω
′
C
Z (7)
where C0 is the empty-cell capacitance associated with the parallel-plate sample geometry, i.e. C0
=ε0A/d where A and d are the cross-sectional area and thickness of the sample, respectively. The
real part of the impedance can be used to calculate the dc conductivity of the material-electrode
system at the low-frequency extreme by
σdc = AZ
d′
(8)
For Al2O3-SiCw composites, it is possible to separate the dc conductivity of the bulk material
from the electrode impedance.4,6 A commonly used scaling law18-20 for describing the bulk dc
conductivity of percolated composite systems is
σdc ∝ (p-pc)t (9)
where p is the volume fraction of the conductive phase, t is the conductivity exponent, and the
subscript “c” denotes the critical concentration of filler needed for percolation. It has been shown
that for systems where fluctuation-induced tunneling21 is the controlling mechanism of
conductivity, the relation
ln(σdc) ∝ p-1/3 (10)
is expected to hold22 because the tunneling gap width is approximately proportional to p-1/3.

6
Experimental
Large quantities of dry powder blends (~5 kg) of Al2O3 with varying volume fractions of
SiCw were mixed in an attempt to achieve the target compositions given in Table I. These SiCw
were nominally of the cubic β-polytype. Oxide sintering additives (1.0 wt% total), including a
rare-earth metal oxide, were also incorporated in each composition. The same four mills and
alumina media were used for all compositions and for both the wet and dry milling phases,
which lasted 8 and 6 hours, respectively. In between, the mills and media were dried for several
hours. To expedite the production of these powder blends, the mills and media were not cleaned
between compositions. Presumably, this resulted in dilution of the blends to lower-than-target
values for whisker content due to carryover from previous compositions. To compensate for such
dilution, extra SiCw were added such that the volume percentage of whiskers in the weighed-out
powder was increased by a small amount (see Table I). The actual whisker content in each milled
blend was measured experimentally with a LECO carbon analyzer which tracked the oxidized
carbon products of SiC decomposition. The average results and error (standard deviation) are
reported in Table I. These measured composition values are used throughout this paper for all
SiCw-containing samples. The measurement of 1.09 ± 0.04 vol% carbon in the mills where no
whiskers were added is suggestive of non-SiC carbon contamination such as that which might
arise from the plastic walls of the milling jars. Subtracting off the 1.09 vol% as background for
the low-content mixes results in corrected compositions (Table I) which seem reasonable and
might be more accurate.
Powder blends were screened to 20 mesh. For each composition, ~6 discs of ~29 mm
diameter were hot-pressed for 20 minutes in flowing N2 at peak temperatures. These
temperatures and resulting densities are reported in Table I. The disc samples were made with
7
two different thicknesses (~7.2 and ~2.6 mm) for all compositions. All samples were fully dense
to within experimental error except for those with the higher whisker content, i.e. the 25% and
30% compositions. Thick samples were sectioned parallel to the hot-pressing direction (HPD) to
form ~1-2 mm thick rectangular slices so that they could be measured with the electric field
applied perpendicular to the HPD. For electrical measurements, the hot-pressed discs were
ground to ~6 µm roughness with embedded-diamond grinding wheels. For microscopy, samples
underwent additional polishing down to 0.25 µm with diamond paste and a final 0.05 µm
colloidal silica step.
The microstructure of percolated samples was imaged with a Hitachi 800S SEM without
sputter-coating the surface with a conductive metal. Instead of the previously developed
comprehensive stereological method13 for quantifying the axisymmetric microstructure of hot-
pressed whisker composites, a simplified method was used in this paper. This method estimates
the average distances (di) between the SiC phase (i.e. whiskers, clusters, and particles) strictly in
the directions parallel and perpendicular to the symmetry axis (i.e. the hot-pressing direction) for
the 14.5 vol% composition. For the former measurement, sets of equally-spaced test lines aligned
parallel to the hot-pressing direction were randomly placed on images of planes parallel to the
hot-pressing direction, e.g. Figure 1a. For the latter measurement, equally-spaced test lines with
arbitrary alignment were randomly placed on images showing planes perpendicular to the hot-
pressing direction, e.g. Figure 1b. The average distances (di) were then calculated from the
inverse of the number of intersections of the SiC phase with test line per unit length of test line
(Ni). This calculation assumes that the width of the SiC intersections along the test line is small
compared to the distances between the intersections. For each plane type, data was gathered at
2,000 times magnification from an area of ~9000 µm2.
8
Electrical characterization was performed with two different impedance analyzers. A
Solartron 1260 impedance/gain-phase analyzer was used for the 0.1 Hz -10 MHz range. An
additional Solartron 1296 Dielectric Interface was used for samples with SiCw content ≤12.5%.
An Agilent 4291B with a 16453A fixture was employed for the 1 MHz – 1.8 GHz range.
Sputtered Ag electrodes were applied to samples in a manner described previously.4 The
measurement direction (i.e. the direction of the applied electric field) was and this was either
parallel or perpendicular to the hot-pressing direction. For some measurements on thin discs,
additional shadow-masking was used to limit the sputtered electrode diameters to ~10.5 mm.
This additional step was found to be the best method to obtain good matching between data from
the different analyzers in the 1-10 MHz range while minimizing high-frequency artifacts from
the Agilent. Wafers of undoped and n-type doped α-polytype SiC were also measured for
comparison.
Results and Discussion
Microstructure
Figure 1a and 1b are SEM images of typical sample microstructures of the 14.5 vol% samples.
These images show the planes which are parallel and perpendicular to the hot-pressing direction,
respectively. The dispersions of whiskers appear similar to those in previous investigations.4,6
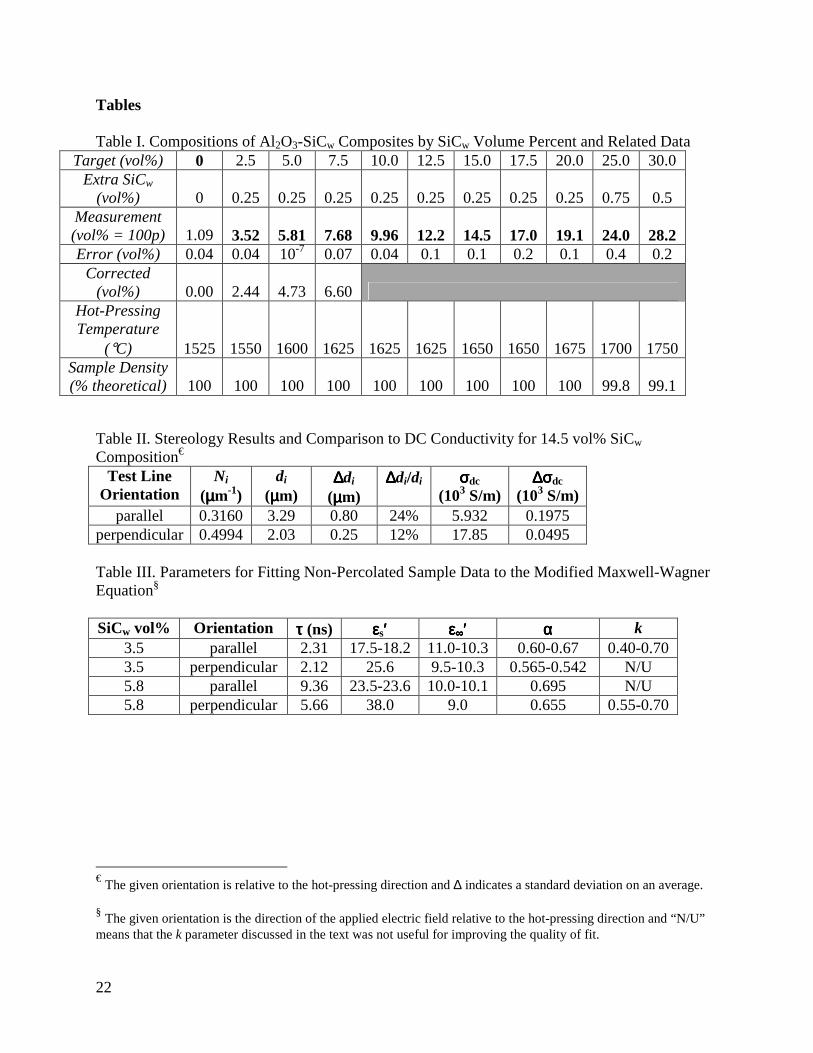
The results of the stereological measurements on the 14.5 vol% composition are given in Table II.
The average distances between SiC were 3.29 ± 0.80 µm and 2.03 ± 0.25 µm in the directions
parallel and perpendicular to the symmetry axis, respectively. This is a significant difference and
provides insight into the orientation dependence of the electrical response, as discussed later. The
apparent charging of select whisker-containing areas in both Figures 1a and 1b suggests that
9
some whiskers on the composite surface are not connected to percolated pathways, as previously
asserted by the authors.4
Percolation Behavior
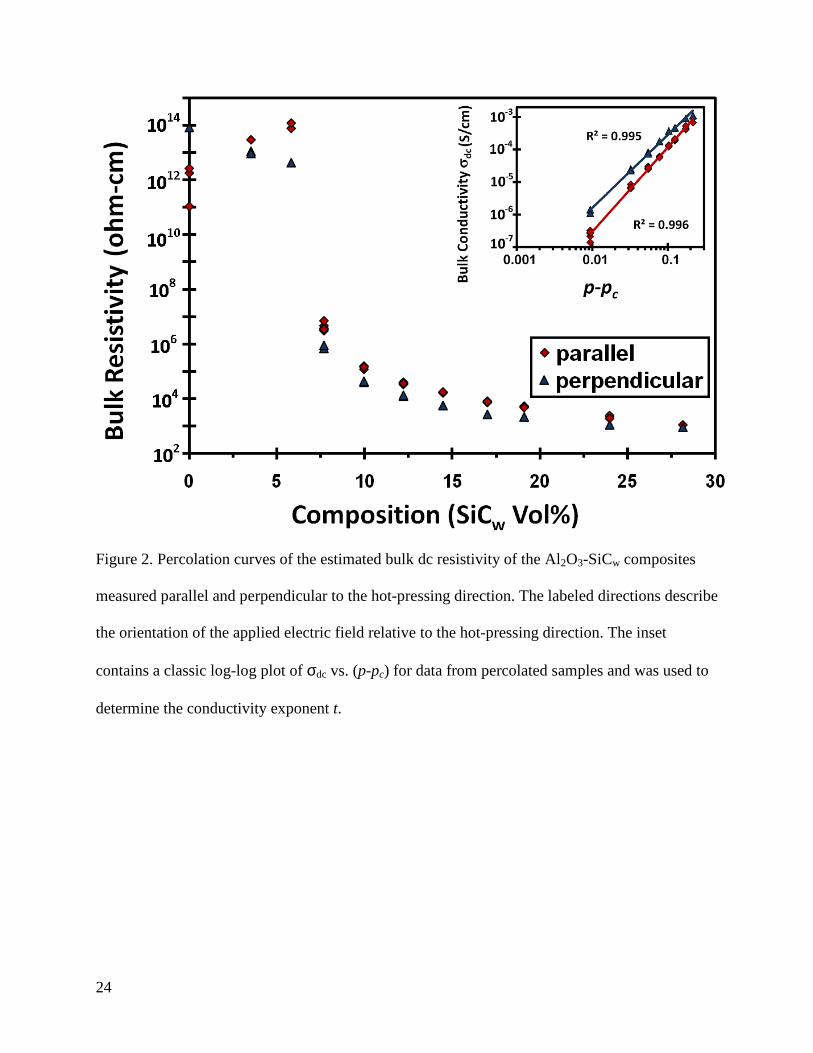
Figure 2 shows the dc-resistivity percolation curves associated with the electric field
being applied parallel and perpendicular to the hot-pressing direction. Percolation for both
directions occurs between 5.8 and 7.7 vol%. For percolated samples with more than 7.7 vol%
SiCw, the impedance of the bulk could be separated from the contacts due to the presence of two
separable semicircles in the complex impedance plane, with only one semicircle being dependent
on electrode material and bias, consistent with previous investigations.4,6 Samples with 7.7 vol%
whiskers or less did not have a separable electrode semicircle in the complex impedance and thus
the associated resistivity data on the percolation curve relates to the total sample resistivity. The
inset of Figure 2 shows the data replotted for the determination of t by Equation 9 with a
linearly-interpolated percolation threshold of pc = 0.06745. The t-values for conductivity parallel
and perpendicular to the hot-pressing direction are 2.59 and 2.24, respectively. These values
increase to 3.01 and 2.59 if an adjusted value of pc = 0.0620 is used to account for dilution of
SiCw and this causes the average of the R2 correlation coefficients to decrease by 0.008.
Figure 3 shows the dc conductivity σdc plotted against p-1/3 for the percolated samples,
after the work of Connor et al.22 The good linear fits suggest that interparticle tunneling is the
controlling mechanism for both conductivity directions because p-1/3 is approximately
proportional to the tunneling gap distance. The circled points are not included with this fit
because they relate to 7.7% samples for which the electrode semicircle is inseparable and thus
show misleadingly low conductivity. If 1.09 vol% is subtracted from each composition to
account for SiCw dilution, the average of R2 for these fits increases by 0.004.
10
In consideration of a tunneling model, the question of hard-contact vs. soft-contact
percolation should be addressed. Generally speaking, the percolation threshold of a composite
system with rod-like filler depends on the filler orientation, aspect ratio, and dispersion.23-24 But
in the Al2O3-SiCw composite materials system, the onset of a rigid, hard-contact, interlocking,
sample-spanning, percolated network of SiCw in direct contact with one another is expected25-27
for samples having SiCw content greater than ~10 vol% and thus for many of the samples in this
study. The concept of a hard-contact percolated network has been used to explain certain
phenomena for this system, such as the high-temperature creep behavior25-27 and the inhibition of
densification caused by the SiCw phase during sintering.24 However, the electrical properties of
insulator-conductor composites, including percolated samples of this system6 and other
systems21,23 have been explained in terms of tunneling transport, suggesting that the fillers
particles do not form a physically connected network.
This apparent contradiction might be resolved by considering that mechanical forces can
be fully transmitted between two objects having point contact via Newton’s 3rd Law without a
dependence on contact area. By contrast, the transmission of electrical charge from one body to
another is highly dependent on actual contact area and surface asperities which result in current
constriction.28 Furthermore, semiconductor contacts generally involve an energy barrier at the
interface29 and SiC contacts are sensitive to many factors.30 Our previous work has shown that
electrical contacts to SiCw in these composites are sensitive to both area-based current
constriction and interfacial Schottky energy barriers.4 Based on this reasoning, it is plausible that
a SiCw-percolated network could exist with point-like contacts that are sufficient for transferring
mechanical forces but provide for minimal charge transfer at the physical contact points such that

11
tunneling is still a relevant process. Therefore we justify application of a tunneling-based
interpretation to percolated Al2O3-SiCw composites.
Figure 2 shows that for the percolated samples, the resistivity is higher along the hot-
pressing direction for all compositions. This result is consistent with previous work on similar
composites5,8,10 and has been explained by the preferential orienting of whiskers during
pressing.11,31 If interwhisker tunneling controls charge transport, as suggested by Figure 3, it
follows that the resistance from intrawhisker transport is negligible. The implication is that
having preferred whisker orientation in a particular direction results in decreased sample
resistivity in that direction due to (1) a smaller whisker-whisker tunneling distances10 and/or (2)
an increased density of whisker-whisker tunneling interfaces or interfacial area along that general
direction. Both (1) and (2) can reasonably be expected to coincide with smaller measured values
of the average SiC-SiC distance and increased connectivity along that direction.
Unlike measurements for (1) and (2) above, estimating the average SiC-SiC distance (di)
strictly along the two directions of interest in this axisymmetric microstructure is straightforward
and described in the Experimental section. Table II shows that the average inter-SiC distance is
1.62 times longer and the dc resistivity is 3.01±0.11 times larger in the hot-pressing direction,
relative to the perpendicular direction. This suggests that the average whisker-whisker tunneling
distance may be longer along the former direction. The di distances calculated from this simple
method are useful for correlation to the relative differences between conductivities in different
directions, as done in Table II, but not for estimating the actual tunneling distances in operation.
This is because SiCw-SiCw tunneling transport across a small distance along a direction that
deviates slightly from the electrical measurement direction is more likely than tunneling across a
large distance in the exact measurement direction. This concept is illustrated in the inset of

12
Figure 3 which shows two different paths for tunneling current between whiskers A and D. The
tunneling vectors along path ABCD only have components aligned with the applied electric field
but may be preferred to the direct path AD (which is fully aligned with the field) because of the
smaller total distance over which tunneling must occur.
Maxwell-Wagner Interfacial Polarization
Figure 4a shows frequency dispersions of the dielectric constant εr′ measured parallel to
the hot-pressing direction for varying whisker content. Figure 4b shows the corresponding
dielectric loss, -εr″. For 0-5.8 vol% samples, the low-frequency εr′ dispersion shifts upward with
SiCw content and is flat up until 0.1-1 MHz. From there up until ~1 GHz, the samples containing
SiCw have a dielectric constant which decreases with increasing frequency which is suggestive of
a dielectric relaxation related to SiCw-based polarization. The imaginary part -εr″ confirms the
presence of these relaxations.
For 3.5 and 5.8 vol% samples, the -εr″ function peaks broadly between 50-120 MHz and
7-45 MHz, respectively. The absence of a peak in the 0 vol% dispersion confirms the whisker
involvement in the relaxation. We attribute this relaxation to Maxwell-Wagner interfacial space-
charge polarization at SiC-Al2O3 interfaces occurring as a result of interwhisker (SiCw-Al 2O3-
SiCw) capacitive-coupling interactions. The higher frequency of the 3.5 vol% peak compared to
the 5.8 vol% peak might be related to the average distances between disconnected whiskers or
whisker clusters in the composite microstructure. Larger distances are expected in 3.5 vol%
samples and would require higher frequencies for signal transmission via SiCw-Al 2O3-SiCw
capacitive-coupling. Such capacitor structures would have an impedance to signal transmission
that is directly proportional to the inter-SiCw distance and inversely proportional to the frequency.
To maintain a given level of impedance, an increase in distance could be compensated for by an
13
increase in frequency. A similar result of the loss peak shifting to lower frequency with an
increase in the content of conductive filler is available in the literature.32
The frequency f p =(2πτ)-1 of the peaks in the -εr″ function might also be interpreted in
terms of Equation 4, but it should be noted that this equation is derived from a parallel-slab
structure.16 Considering phases 1 and 2 to be the SiCw and mostly-Al2O3 matrix, respectively, the
variables can be roughly estimated as σ2≈10-12 S/cm, ε2≈10, σ1≥10-3 S/cm, and 200 < ε1 < 600.¥2
Inserting these estimates into Equation 4 reveals that the σ2V1 term in the denominator is
irrelevant due to the huge contrast between σ2 and σ1. The contrast between ε2 and ε1 is not as
great and therefore the ε2V1 term in the numerator should not be ignored and might account for
the observed increase in τ with increased filler content. If one were to ignore the contribution
from this ε2V1 term, then τ would appear to be independent of V1 and V2 and this would
contradict experimental results. Using inputs of ε1=200, σ1=10-3 S/cm, and V1 =0.035-0.058
results in values of τ = 18 ns and f p = 9 MHz which have fair (order-of-magnitude) agreement
with the experimental results.
The Maxwell-Wagner interpretation gains additional support from the distinct change in
dispersion behavior that occurs between 5.8 and 7.7 vol%, i.e. the percolation threshold.
Percolated samples show -εr″ increasing with decreasing frequency in Figure 4b. This tailing-off
behavior is consistent with what is expected from a large dc-conductivity increase in the
Maxwell-Wagner theory.15-16
Figures 5a and 5b show the frequency dispersions of εr′ and -εr″ from measurements
conducted in different directions relative to the hot-pressing direction. The specific compositions
¥ The bounds on εεεε1 follow from rough estimates with the series rule of mixture (ROM) equation. Estimates of εεεε1 based on other mixing-rule equations20 (e.g. Maxwell-Sphere, parallel ROM, Lichtenecker logarithmic) resulted in unreasonable values (e.g. εεεε1 < 0 and εεεε1 >106).

14
(5.8, 7.7, 24.0 vol%) were selected to highlight the orientation effect of representative
unpercolated, barely percolated, and well-percolated samples. Generally, εr′ and -εr″ are
significantly greater when the electric field is applied perpendicular to the hot-pressing direction.
This is consistent with previous studies8-9 and complements them by extending the result with
smooth continuity into the GHz range.
In Figure 5a, the substantial difference between the unpercolated 5.8 vol% εr′ dispersions
from different measurement orientations is again interpreted in terms of the average distance
between disconnected whiskers or whisker clusters along the measurement direction. As
previously noted, this distance is expected to be longer along the hot-pressing direction
compared to the perpendicular direction. As a result, measurements in the latter (perpendicular)
direction show increased values of εr′ due to increased capacitive coupling between more
closely-spaced disconnected whiskers. Similar reasoning can explain the orientation-based
differences observed for the other compositions (7.7 and 24.0 vol%) in Figure 5a. However, the
presence of percolated networks in these samples suggests that the SiCw-SiCw tunneling
interfaces between “connected” SiCw would be the main source of capacitance in this case.
In Figure 5b, significant orientation-based differences between -εr″ dispersions of the 7.7
and 24.0 vol% samples are maintained for all frequencies. For f < 1 MHz, these differences are
fully attributed to the σdc term in Equation 5 and the reduced conductivity in the hot-pressing
direction. The noise in the low-frequency data of the 5.8 vol% sample suggests that the route for
the loss current is relatively unstable compared to the 7.7 and 24.0 vol% samples with percolated
pathways due to having the requirement of capacitive coupling across longer distances. As
shown in Equations 7-8, the loss -εr″ may be linked through Z′ to the sample conductivity and the
associated current passing through it.
15
Figures 6a-b show Cole-Cole plots of the complex dielectric constant εr* at different
scales for an additional perspective on the dielectric phenomena. Figure 6a shows that frequency-
implicit plots do not appear to be revealing when the data is plotted at larger scales to include
more of the low-frequency data from percolated samples, e.g. for εr′ and -εr″ on the scale of 1000.
Figure 6b focuses on the data from non-percolated samples measured in different directions and
shows depressed semicircles for these samples. At this scale, the noise at the low-frequency
extreme of the Agilent analyzer becomes more apparent but does not obscure the presence of the
semicircles. These semicircles relate to the Maxwell-Wagner interfacial relaxations. The
depressed shapes of these semicircles indicate distributions in the Maxwell-Wagner relaxation
time. On the left-hand side of Figure 6b, there is also evidence of damped resonances which are
discussed in the next section.
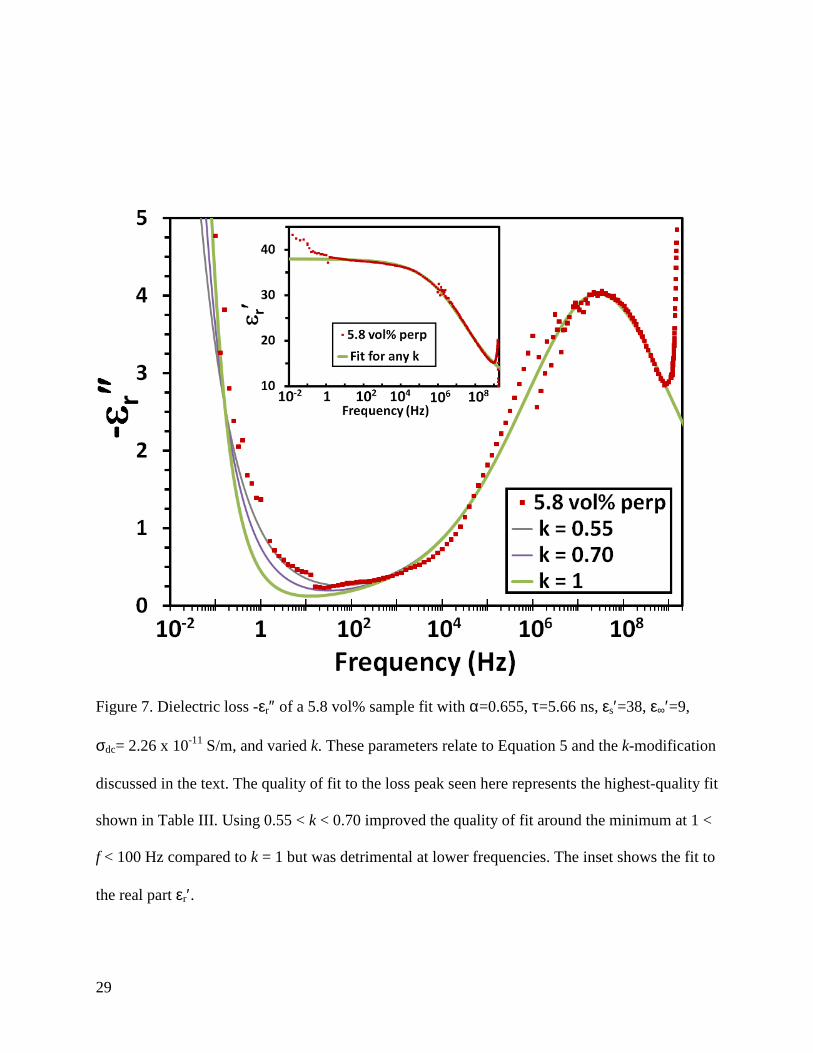
Concurrent curve fitting of Bode plots of εr′ and -εr″ and Cole-Cole plots of εr* was
performed with the modified Maxwell-Wagner equation (Equation 5) for each composition-
orientation combination below the percolation threshold. These fits used the related σdc values
from Figures 2-3. It was not appropriate to use a “β” exponent in the style of Davidson-Cole33 or
Havriliak-Negami34 because much of the high-frequency data is obscured by the superimposed
resonance. The best fitting to Equation 5 was achieved for the 5.8 vol% composition for
measurements conducted perpendicular to the hot-pressing direction. The fit to the loss function
for such a sample is shown in Figure 7. The quality of fits to εr′ and εr* were similar. The
presence of the conductivity tail provides strong evidence for the Maxwell-Wagner interpretation.
This tail was less prominent in the other non-percolated composition-orientation combinations
due to their reduced conductivities. Modifying the dc-conductivity term of Equation 5 with an
empirical exponent k and units-consistency factor k0 such that it becomes jk0σdc/ωkε0 provided a
16
marginal improvement to the fitting of some of the conductivity tails, as shown by the example
of Figure 7. The dc-conductivity term was similarly modified by van Beek.35 Values for k and
other parameters of the fits are listed in Table III.
During fitting, it was often necessary to compromise goodness of fit in each of the plots
to achieve adequate fitting in all three presentations of the data. The results of the best
compromises are presented in Table III. The tabulated values for εs support the interpretations of
Figure 4a and 5a discussed earlier. Values for ε∞′ ranged from 9 to 11 and seem to coincide with
εr′ values for the unfilled matrix. Values of τ appear to depend on composition in a manner
consistent with the previous discussion on the frequency of the -εr″ peak. The orientation-based
difference in τ values was determined to be significant for the 5.8 vol% but not the 3.5 vol%
composition by changing the τ value and observing the effect on the quality of fit. The reason for
this orientation dependence, and its absence for the 3.5 vol% composition, is unclear. Equation 4
does not account for orientation. Calculations indicate that increasing the aspect ratio of fillers
whose long axes are aligned with the electric field causes a shift in the loss peak to lower
frequencies or higher values of τ.36-37 Changing the microstructure in such a way is not
straightforwardly equivalent to changing the relative orientation of the applied electric field such
that fillers with fixed aspect ratios become more aligned with said field, i.e. the situation of the
present paper.
In Table III, values for α seem to increase with SiCw content and to be larger when
measuring parallel to the hot-pressing direction, thus indicating increased non-ideality and a
broader distribution of relaxation times for these conditions. These results are interpreted in
terms of variation in at least one important aspect of the polarization process, such as the SiC-
Al 2O3-SiC interaction distance. The dependence of α on orientation might be explained by an
17
increased variability in the inter-SiC distances along the hot-pressing direction, as shown by
Table II for the 14.5 vol% composition. Similarly, from stereology one expects to observe more
variation in the SiC volume fraction when viewing the axisymmetric microstructure along the
hot-pressing direction compared to the perpendicular direction.38 In Table III, the dependence of
α on composition might be explained by SiC clustering. Increased clustering might be associated
with increased variability in SiC-Al2O3-SiC interaction distances and the 5.8 vol% composition
is likely to contain non-percolated SiC clusters at a higher density and larger average size
compared to the 3.5 vol% composition because it is closer to the percolation threshold.
Alternatively, one might interpret α in terms of the distributions of SiCw lengths, radii, and
orientations.13 However, the relation of these three inter-related distributions to α is not
straightforward.
High-Frequency Resonance
Figures 8a and 8b are Bode plots of εr′ and -εr″ scaled to highlight the high-frequency
resonance observed in the composites between 1.4-1.7 GHz. The resonance appears to be
damped39 and is attributed to the β-SiC whiskers because it grows in prominence and shifts to
lower frequency as SiCw content increases. Figure 9 shows Bode plots of εr′ from similarly
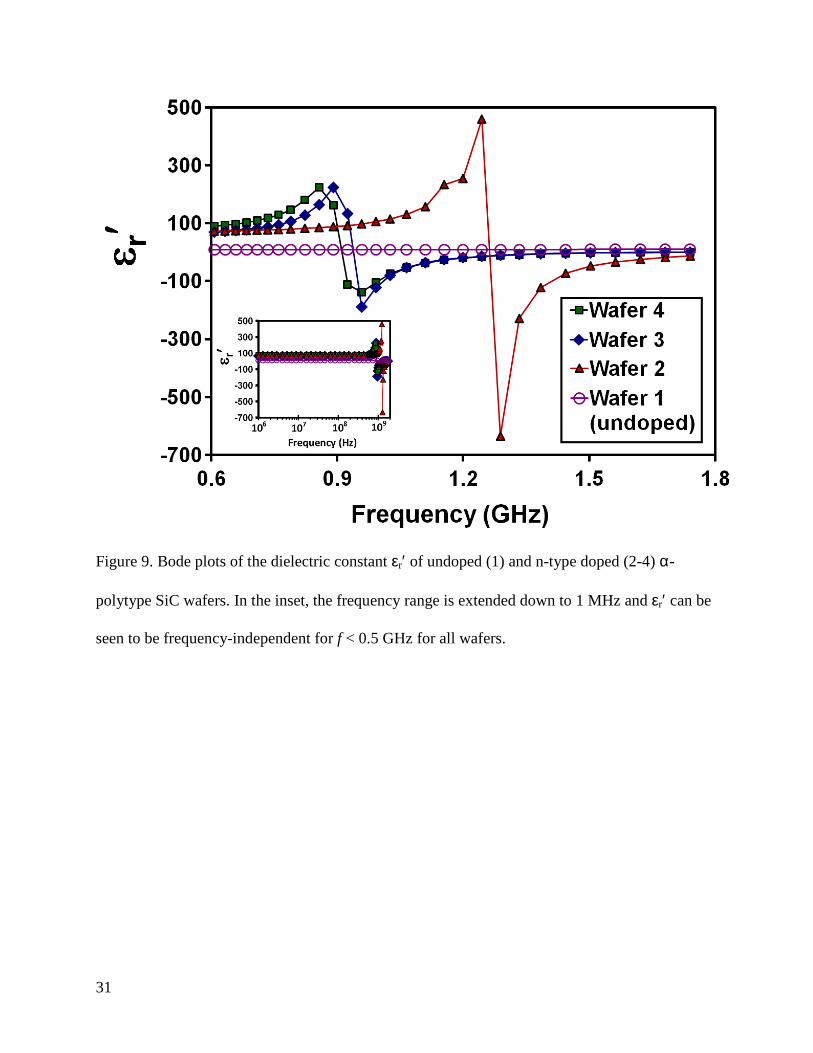
measured α-polytype SiC wafers. In the inset, the frequency range is extended down to 1 MHz.
The dispersion for the nominally-pure undoped Wafer 1 is entirely flat (εr′ ~9.5) and does not
exhibit a resonance. Wafers 2-4 are n-type doped and show resonances at nearby frequencies of
~900 MHz and ~1.3 GHz and have otherwise-flat dispersions at lower frequencies where 60 < εr′
< 80. These results suggest that the resonance in Figure 8a-b relates to impurities in the SiCw and
is not an artifact of the impedance analyzer. Although resonance artifacts are known to occur at
18
the high-frequency extremes of impedance analyzers, there is considerable evidence that these
resonances are genuine properties of the measured materials.
Application Perspective
In Figure 10a, the dielectric loss -εr″ at the application-relevant frequency of 915 MHz is
plotted as function of whisker content. From 0 – 5.8 vol%, the main source of this loss is the -εr″
peak of the Maxwell-Wagner interfacial polarization and so it increases slowly with SiCw content.
Due to percolation and the accompanying growth of the dc-conductivity tail, this loss increases
much more rapidly for samples having ≥7.7 vol% SiCw. After percolation, the trend is still fairly
linear but the 24.0 and 28.2 vol% data points are not included on the trend lines since they reflect
additional contributions from the broad damped resonance peaks which appear to be significant
for these compositions in Figure 8b.
In Figure 10a, it is also apparent that the loss at 915 MHz is significantly higher when the
electric field is applied perpendicular instead of parallel to the hot-pressing direction. One might
guess that this orientation-based difference could be accounted for by the increased dc-
conductivity of the perpendicular direction (shown in Figures 2-3) since the loss of percolated
samples appears to be controlled by the conductivity term in Equation 5. To this effect, Figure
10b plots the dielectric loss at 915 MHz as a function of bulk dc-conductivity. For both
orientations, this loss increases with dc-conductivity, but the substantial separation between the
two trend lines remains. Therefore the above explanation seems to be consistent but not
sufficient because the data points from the two measurement directions cannot be fitted by a
single line. Some portion of the additional difference might be accounted for by a buried loss
peak described by the Cole-Cole term in Equation 5 that is concealed by the dc-conductivity tail.
In Figure 5b, such a buried loss peak might also explain the increase of the orientation-based
19
difference observed at higher frequencies for the 7.7 and 24.0 vol% dispersions. Indeed, it is
apparent in Figure 6b that the loss peak is larger for the perpendicular direction and calculations
revealed that it is 2.76 and 2.47 times larger for the 3.5 and 5.8 vol% compositions, respectively.
These values are agreeable with the approximate factor-of-two difference apparent in Figure 10b.
The inset of Figure 10b shows experimental dielectric loss data from a 7.7 vol% sample
after subtracting out the dc-conductivity term of Equation 5 with the k-modification discussed in
the text. The applied field was perpendicular to the hot-pressing direction. Using 0.72 ≤ k ≤ 0.83
recovered a broad -εr″ peak suggestive of the Cole-Cole term in Equation 5. The low-bound of
0.72 is close to the high-bound of 0.70 reported in Table III for fits of 5.8 vol% data. This
suggests continuity in the material system. Using more ideal values of 0.93 ≤ k ≤ 0.99 recovered
a similar peak for the more conductive 24.0 vol% composition. Using k = 1 failed to recover a
Cole-Cole peak for all attempts. It is not surprising that k ≠ 1 seems to be required to recover
these high-frequency Cole-Cole loss peaks because Figure 7 and results of others36 show that the
use of k =1 is more suitable for fitting low-frequency data.
Final Notes
In Figure 2, as whisker content increases on the insulating side of the percolation curve,
resistivity increases for conduction parallel to the HPD and decreases for conduction
perpendicular to the HPD. We speculate that this might relate to competition or interactions
between interwhisker conductivity and conductivity through the sintering additives along the
grain boundaries of the axisymmetric11,31 microstructure. However, a more detailed study should
be conducted to test this hypothesis.
In Figures 4a and 5a, low-frequency truncations of spectra for percolated samples were
performed due to the onset of extensive noise in the data followed by a transition to negative

20
values of εr′. In these figures, the low-frequency plateaus in εr′ seen for percolated samples
suggest dielectric relaxation in the 1 kHz – 1 MHz range, e.g. at ~100 kHz for 28.2 vol%.
However, these features of the εr′ dispersions are not accompanied by peaks in the -εr″ function.
This apparent absence of a relaxation in the complex permittivity plane could be attributed to the
occurrence of long-range conductivity through the bulk of these samples.40 Also, the height of
the εr′ plateaus were strongly dependent on the electrode material (based on results with
conductive Ag paint electrodes not shown here) and seemed to be correlated with the low-
frequency (electrode) semicircle4 in corresponding Z* Nyquist plots. It is plausible that
interfacial relaxations occurred at the electrodes and the corresponding -εr″ peaks were concealed
by the superimposed σdc-tails of the higher-frequency Maxwell-Wagner relaxations associated
with the bulk.
Summary
A new batch of Al2O3-SiCw composites was hot-pressed and the percolation of the SiCw
occurred between 5.8 and 7.7 vol% loadings and had a dramatic effect on the electrical response.
Non-percolated samples were characterized by a Maxwell-Wagner interfacial polarization with a
loss peak, a distribution of relaxation times, and a dc-conductivity tail which was more
prominent for samples nearer to the percolation threshold. Percolated samples had a much higher
dc conductivity which seemed to be controlled by the fluctuation induced tunneling mechanism
and showed a Maxwell-Wagner dc-conductivity tail which concealed the related dielectric loss
peak via superposition. Permittivity data for non-percolated samples were fit with a Maxwell-
Wagner equation modified with a Cole-Cole exponent.
The electrical results were related to the microstructure with an interpretation based on
the average distance between SiC inclusions along the measured conductivity directions.

21
Stereological measurements on the 15 vol% composition showed that this distance was longer
along the hot-pressing direction (the microstructure symmetry axis) compared to the
perpendicular direction. Electrical measurements conducted along the hot-pressing direction
generally revealed smaller values of frequency-dependent dielectric constant, loss, and dc-
conductivity. It therefore seems reasonable to conclude that the average distances between the
SiCw for tunneling and/or high-frequency capacitive coupling are longer in the hot-pressing
direction.
Notably, a damped resonance was observed between 1.4 - 1.7 GHz in the complex
permittivity. It is attributed to impurities in the SiCw based on observations of its dependence on
SiCw content and observations of similar resonances in doped SiC wafers. The commercial
application of these composite materials in microwave heating is likely influenced by both the
Maxwell-Wagner and resonance processes.
Acknowledgements
The support of Advanced Composite Materials LLC was critical to this undertaking. They
provided powder-processing equipment and assistance, performed hot-pressing and carbon
analyses, and supplied raw materials. We are particularly thankful for the support of Dr. Tom
Quantrille, Bill Rogers, and Lew Short. The use of the Agilent 4291B in Dr. John Schultz’s lab
at Georgia Tech Research Institute and assistance with machining from Justin Brandt are also
appreciated.
22
Tables Table I. Compositions of Al2O3-SiCw Composites by SiCw Volume Percent and Related Data
Target (vol%) 0 2.5 5.0 7.5 10.0 12.5 15.0 17.5 20.0 25.0 30.0 Extra SiCw
(vol%) 0 0.25 0.25 0.25 0.25 0.25 0.25 0.25 0.25 0.75 0.5 Measurement (vol% = 100p) 1.09 3.52 5.81 7.68 9.96 12.2 14.5 17.0 19.1 24.0 28.2 Error (vol%) 0.04 0.04 10-7 0.07 0.04 0.1 0.1 0.2 0.1 0.4 0.2
Corrected (vol%) 0.00 2.44 4.73 6.60
Hot-Pressing Temperature
(°C) 1525 1550 1600 1625 1625 1625 1650 1650 1675 1700 1750 Sample Density (% theoretical) 100 100 100 100 100 100 100 100 100 99.8 99.1
Table II. Stereology Results and Comparison to DC Conductivity for 14.5 vol% SiCw Composition€3
Test Line Orientation
Ni (µµµµm-1)
di (µµµµm)
∆∆∆∆di (µµµµm)
∆∆∆∆di/di σσσσdc
(103 S/m) ∆∆∆∆σσσσdc
(103 S/m) parallel 0.3160 3.29 0.80 24% 5.932 0.1975
perpendicular 0.4994 2.03 0.25 12% 17.85 0.0495 Table III. Parameters for Fitting Non-Percolated Sample Data to the Modified Maxwell-Wagner Equation§4 SiCw vol% Orientation ττττ (ns) εεεεs′′′′ εεεε∞∞∞∞′′′′ αααα k
3.5 parallel 2.31 17.5-18.2 11.0-10.3 0.60-0.67 0.40-0.70 3.5 perpendicular 2.12 25.6 9.5-10.3 0.565-0.542 N/U 5.8 parallel 9.36 23.5-23.6 10.0-10.1 0.695 N/U 5.8 perpendicular 5.66 38.0 9.0 0.655 0.55-0.70
€ The given orientation is relative to the hot-pressing direction and ∆ indicates a standard deviation on an average. § The given orientation is the direction of the applied electric field relative to the hot-pressing direction and “N/U” means that the k parameter discussed in the text was not useful for improving the quality of fit.

23
Figures
Figure 1. Scanning electron micrographs of the planes parallel (a) and perpendicular (b) to the
hot-pressing direction for an Al2O3-SiCw sample containing 14.5 vol% SiCw. The white arrow in
(a) points along the hot-pressing direction. The microstructure is viewed along the hot-pressing
direction in (b). The accelerating voltage was 16 kV.
24
Figure 2. Percolation curves of the estimated bulk dc resistivity of the Al2O3-SiCw composites
measured parallel and perpendicular to the hot-pressing direction. The labeled directions describe
the orientation of the applied electric field relative to the hot-pressing direction. The inset
contains a classic log-log plot of σdc vs. (p-pc) for data from percolated samples and was used to
determine the conductivity exponent t.
25
Figure 3. Logarithmic plot of σdc vs. p-1/3 after Connor et al.22 The given directions describe the
orientation of the applied electric field relative to the hot-pressing direction. The circled points
are from 7.7 vol% samples and are not included in the fit due to inseparability of the electrode
impedance, as explained in the text. The inset relates to the discussion of interwhisker tunneling.

26
Figure 4. The dependence of the frequency dispersion of the relative dielectric constant εr′ (a)
and the dielectric loss -εr″ (b) on whisker content in Al2O3-SiCw composites. The electric field
was applied parallel to the hot-pressing direction.

27
Figure 5. The dependence of the frequency dispersion of the dielectric constant εr′ (a) and the
dielectric loss -εr″ (b) on the direction of the applied electric field in Al2O3-SiCw composites.
Three compositions were chosen to represent non-percolated (5.8%), barely percolated (7.7%),
and well-percolated (24.0%) samples. The field direction was parallel to the hot-pressing
direction unless marked “perp”. This designation indicates the field was applied perpendicular to
the hot-pressing direction.

28
Figure 6. Frequency-implicit Cole-Cole plots of the complex dielectric constant εr* for Al 2O3-
SiCw samples of different composition on scales relevant to the percolated samples (a) and non-
percolated samples (b). The electric field was applied in the hot-pressing direction unless marked
with “perp”. This designation relates to an applied field in the perpendicular direction.
29
Figure 7. Dielectric loss -εr″ of a 5.8 vol% sample fit with α=0.655, τ=5.66 ns, εs′=38, ε∞′=9,
σdc= 2.26 x 10⁻¹¹ S/m, and varied k. These parameters relate to Equation 5 and the k-modification
discussed in the text. The quality of fit to the loss peak seen here represents the highest-quality fit
shown in Table III. Using 0.55 < k < 0.70 improved the quality of fit around the minimum at 1 <
f < 100 Hz compared to k = 1 but was detrimental at lower frequencies. The inset shows the fit to
the real part εr′.

30
Figure 8. Bode plots showing the dependence of the real (a) and imaginary (b) parts of εr* on
SiCw content in Al2O3-SiCw composites. A damped resonance is apparent.
31
Figure 9. Bode plots of the dielectric constant εr′ of undoped (1) and n-type doped (2-4) α-
polytype SiC wafers. In the inset, the frequency range is extended down to 1 MHz and εr′ can be
seen to be frequency-independent for f < 0.5 GHz for all wafers.

32
Figure 10. The dielectric loss -εr″at 915 MHz as a function of SiCw content (a) and dc
conductivity (b) of Al2O3-SiCw composites. The given directions describe the orientation of the
applied electric field relative to the hot-pressing direction. In part (a), changes in slope occurred
between 5.8 – 7.7 vol% due to the percolation-induced increase in the prominence of the
Maxwell-Wagner dc-conductivity tail. In part (b), the dependence of this loss on σdc is apparent
but does not fully account for the dependence on orientation. The inset shows the result of
subtracting out the dc-conductivity tail from the loss spectrum of a 7.7 vol% sample with the k-
modification of Equation 5 discussed in the text.
33
References
1Advanced Composite Materials LLC website, pp. www.acm-usa.com viewed 5/10/09. 2T. E. Quantrille, "Ceramic Composites for Microwave Grilling and Speed Cooking." in 42nd
Annual Microwave Symposium. International Microwave Power Institute, New Orleans, LA, 2008.
3T. E. Quantrille, "Novel Composite Structures for Microwave Heating and Cooking." in 41st Annual Microwave Symposium. International Microwave Power Institute, Vancouver, BC, 2007.
4B. D. Bertram and R. A. Gerhardt, "Room Temperature Properties of Electrical Contacts to Alumina Composites Containing Silicon Carbide Whiskers," J. Appl. Phys., 105 074902 (2008).
5D. S. Mebane and R. A. Gerhardt, "Orientation Dependence of Resistivity in Anisotropic Ceramic Composites," Ceram. Trans., 150 265-72 (2004).
6D. S. Mebane and R. A. Gerhardt, "Interpreting Impedance Response of Silicon Carbide Whisker/Alumina Composites through Microstructural Simulation," J. Am. Ceram. Soc., 89[2] 538-43 (2006).
7R. A. Gerhardt and R. Ruh, "Electrical Properties of SiC Reinforced Mullite Composites." in Extended Abstracts of the Electronics Division, 92nd Annual Meeting of the American Ceramic Society. Edited by K. M. Nair. American Ceramic Society, Dallas, TX, 1990.
8R. A. Gerhardt and R. Ruh, "Volume Fraction and Whisker Orientation Dependence of the Electrical Properties of SiC-Whisker-Reinforced Mullite Composites," J. Am. Ceram. Soc., 84[10] 2328-34 (2001).
9R. Ruh and H. M. Chizever, "Permittivity and Permeability of Mullite-SiC-Whisker and Spinel-SiC-Whisker Composites," J. Am. Ceram. Soc., 81[4] 1069-70 (1998).
10C. A. Wang, Y. Huang, Y. Li, Z. T. Zhang, Z. P. Xie, and J. B. Li, "Resistivity controlled by SiC whisker orientation in Si3N4 matrix composites," J. Mater. Sci. Lett., 17[10] 829-31 (1998).
11M. S. Sandlin, E. J. Lee, and K. J. Bowman, "Simple Geometric Model for Assessing Whisker Orientation in Axisymmetrical SiC-Whisker-Reinforced Composites," J. Am. Ceram. Soc., 75[6] 1522-28 (1992).
12J. W. Park, A. J. Pedraza, and W. R. Allen, "The interface between sputter-deposited gold thin films and ion-bombarded sapphire substrates," Applied Surface Science, 103[1] 39-48 (1996).
13D. S. Mebane, A. M. Gokhale, and R. A. Gerhardt, "Trivariate, stereological length-radius-orientation unfolding derived and applied to alumina-silicon carbide whisker composites," J. Am. Ceram. Soc., 89[2] 620-26 (2006).
14K. S. Cole and R. H. Cole, "Dispersion and Absorption in Dielectrics - I. Alternating Current Characteristics," J. Chem. Phys., 9[4] 341-51 (1941).
15A. C. Metaxas and R. J. Meredith, "Industrial Microwave Heating." Peter Peregrinus Ltd. on behalf of the Institution of Electrical Engineers: London, UK, (1983).
16A. R. von Hippel, "Dielectrics and Waves." Wiley: New York, (1954).
34
17J. Runyan, R. A. Gerhardt, and R. Ruh, "Electrical Properties of Boron Nitride Matrix Composites: II, Dielectric Relaxations in BN-SiC Composites," J. Am. Ceram. Soc., 84[7] 1497-503 (2001).
18C. J. Capozzi, Z. Li, R. J. Samuels, and R. A. Gerhardt, "Impedance Spectroscopy and Optical Characterization of Polymethyl Methacrylate/Indium Tin Oxide Nanocomposites with Three-Dimensional Voronoi Microstructures," J. Appl. Phys., 104[11] (2008).
19J. Runyan, R. A. Gerhardt, and R. Ruh, "Electrical Properties of Boron Nitride Matrix Composites: I, Analysis of McLachlan Equation and Modeling of the Conductivity of BN-B4C and BN-SiC Composites," J. Am. Ceram. Soc., 84[7] 1490-96 (2001).
20M. Taya, "Electronic Composites." Cambridge University Press: Cambridge, (2005). 21P. Sheng, E. K. Sichel, and J. I. Gittleman, "Fluctuation-Induced Tunneling Conduction in
Carbon-Polyvinylchloride Composites," Phys. Rev. Lett., 40[18] 1197-200 (1978). 22M. T. Connor, S. Roy, T. A. Ezquerra, and F. J. Baltá Calleja, "Broadband ac conductivity of
conductor-polymer composites," Phys. Rev. B, 57[4] 2286 (1998). 23I. Balberg, D. Azulay, D. Toker, and O. Millo, "Percolation and Tunneling in Composite
Materials," Int. J. Mod. Phys. B, 18[15] 2091-121 (2004). 24E. A. Holm and M. J. Cima, "Two-Dimensional Whisker Percolation in Ceramic-Matrix
Ceramic-Whisker Composites," J. Am. Ceram. Soc., 72[2] 303-05 (1989). 25A. R. de Arellano-Lopez, A. Dominguez-Rodriguez, and J. L. Routbort, "Microstructural
Constraints for Creep in SiC-Whisker-Reinforced Al2O3," Acta Mater., 46[18] 6361-73 (1998).
26A. R. de Arellano-Lopez, J. J. Melendez-Martinez, A. Dominguez-Rodriguez, and J. L. Routbort, "Creep of Al2O3 Containing a Small Volume Fraction of SiC-Whiskers," Scripta Mater., 42[10] 987-91 (2000).
27G. C. Quan, K. T. Conlon, and D. S. Wilkinson, "Investigation of Anelastic Creep Recovery in SiC Whisker-Reinforced Alumina Composites," J. Am. Ceram. Soc., 88[11] 3104-09 (2005).
28P. G. Slade, "Electrical Contacts: Principles and Applications." Marcel Dekker, Inc.: New York, NY, (1999).
29B. G. Streetman and S. Banerjee, "Solid State Electronic Devices," 5th ed. Prentice Hall, Inc.: Upper Saddle River, NJ, (2000).
30L. M. Porter and R. F. Davis, "A Critical Review of Ohmic and Rectifying Contacts for Silicon Carbide," Mater. Sci. Eng. B, 34[2-3] 83-105 (1995).
31H. J. Park, H. E. Kim, and D. Y. Kim, "Evaluation of Whisker Alignment in Axisymmetrical SiCw-Reinforced Al2O3 Composite Materials," J. Am. Ceram. Soc., 77[11] 2828-32 (1994).
32G. M. Tsangaris, N. Kouloumbi, and S. Kyvelidis, "Interfacial Relaxation Phenomena in Particulate Composites of Epoxy Resin with Copper or Iron Particles," Mater. Chem. Phys., 44[3] 245-50 (1996).
33D. W. Davidson and R. H. Cole, "Dielectric Relaxation in Glycerol, Propylene Glycol, and n-Propanol," J. Chem. Phys., 19[12] 1484-90 (1951).
34S. Havriliak and S. Negami, "A Complex Plane Representation of Dielectric and Mechanical Relaxation Processes in Some Polymers," Polymer, 8[4] 161-& (1967).
35L. K. H. van Beek, "Dielectric Behaviour of Heterogeneous Systems," Prog. Dielectrics, 7 69 (1967).

35
36B. V. Hamon, "Maxwell-Wagner Loss and Absorption Currents in Dielectrics," Aust. J. Phys., 6 304 (1953).
37R. W. Sillars, "The Properties of a Dielectric Containing Semiconducting Particles of Various Shapes," J. Inst. Elect. Engrs., 80 378-94 (1937).
38Private communication with Dr. Arun Gokhale. Atlanta, GA, 2009. 39A. K. Jonscher, "Dielectric Relaxation in Solids." Chelsea Dielectrics Press Ltd: London,
(1983). 40R. Gerhardt, "Impedance and Dielectric Spectroscopy Revisited: Distinguishing Localized
Relaxation from Long-Range Conductivity," J. Phys. Chem. Solids, 55[12] 1491-506 (1994).