freeway well feasibility study report
TRANSCRIPT
PREPARED BY
Freeway Well Feasibility Study Report
PREPARED FOR
City of Santa Rosa
FINAL REPORT | SEPTEMBER 2021
FINAL REPORT | SEPTEMBER 2021
Freeway Well Feasibility Study Report
Prepared for
City of Santa Rosa
Project No. 405-12-18-69
09-08-21
Project Manager: Jim Connell, PE Date
09-08-21
QA/QC Review: Elizabeth Drayer, PE Date

O-C-405-12-18-69-WP-R-FS
i City of Santa Rosa Freeway Well Feasibility Study Report
September 2021
Table of Contents
EXECUTIVE SUMMARY .................................................................................................................. ES-1
Freeway Well Background ................................................................................................................. ES-1
Remedial Action Alternatives ............................................................................................................ ES-2
Summary and Recommendations ..................................................................................................... ES-3
Introduction .................................................................................................................. 1-1
1.1 Background .................................................................................................................................... 1-1
1.2 Remedial Investigation Report ...................................................................................................... 1-3
1.3 Feasibility Study Objectives ........................................................................................................... 1-3
1.4 Grant Task Cross-Reference .......................................................................................................... 1-4
1.5 Disclosure Statement .................................................................................................................... 1-5
Groundwater Contamination ......................................................................................... 1-1
2.1 Project Area Description ................................................................................................................ 1-1
2.2 Nature and Extent of Constituents of Concern ............................................................................. 1-1
2.3 Contaminant Properties and Transport ........................................................................................ 1-4
2.3.1 Contaminants ....................................................................................................................... 1-4
2.3.2 Properties and Transport of TCE .......................................................................................... 1-4
2.4 References ..................................................................................................................................... 1-6
Remedial Action Alternatives......................................................................................... 1-1
3.1 Remedial Action Objectives ........................................................................................................... 1-1
3.2 Freeway Well Retrofit/Replacement Alternatives ........................................................................ 1-1
3.3 Groundwater Treatment Alternatives ........................................................................................... 1-2
3.3.1 Treatment Objectives .......................................................................................................... 1-2
3.3.2 Treatment Technologies ...................................................................................................... 1-2
3.3.3 Treatment Alternatives ........................................................................................................ 1-3
3.3.3.1 Manganese Oxide-Coated Media Filtration - Manganese Removal .......................... 1-3
3.3.3.1.1 Process Description........................................................................................... 1-3
3.3.3.1.2 Design and Operational Considerations ........................................................... 1-3
3.3.3.1.3 Conceptual Design ............................................................................................ 1-5
3.3.3.2 Packed Tower Air Stripping – TCE Removal ............................................................... 1-6
3.3.3.2.1 Process Description........................................................................................... 1-6
3.3.3.2.2 Design and Operational Considerations ........................................................... 1-7
3.3.3.2.3 Conceptual Design ............................................................................................ 1-8
3.3.3.3 Granular Activated Carbon – TCE Removal .............................................................. 1-10
3.3.3.3.1 Process Description......................................................................................... 1-10
3.3.3.3.2 Design and Operational Considerations ......................................................... 1-13
3.3.3.3.3 Conceptual Design .......................................................................................... 1-15
3.3.4 Operation as Emergency Well ........................................................................................... 1-19
O-C-405-12-18-69-WP-R-FS
ii City of Santa Rosa Freeway Well Feasibility Study Report
September 2021
Table of Contents
3.4 Estimated Project Cost ................................................................................................................ 1-19
3.4.1 Conceptual Opinion of Probable Project Cost ................................................................... 1-19
3.4.2 Annual O&M Cost .............................................................................................................. 1-20
3.4.3 Life Cycle Cost .................................................................................................................... 1-22
3.4.4 Cost-Benefit Analysis ......................................................................................................... 1-22
3.5 Possible Project Schedule ............................................................................................................ 1-22
3.6 References ................................................................................................................................... 1-23
Recommended Alternative ............................................................................................ 1-1
4.1 Recommended Alternative............................................................................................................ 1-1
4.1.1 Discussion of Alternatives .................................................................................................... 1-1
4.1.2 Possible Project Schedule .................................................................................................... 1-1
LIST OF TABLES
Table 1-1. Grant Requirements and Cross-Reference to Report Chapters and Sections .................... 1-4
Table 2-1. Historical Freeway Well Water Quality, 1987-1995 ........................................................... 1-2
Table 2-2. Freeway Well Discrete Depth Sampling Water Quality, 2013 ............................................ 1-3
Table 2-3. VOCs in Groundwater, 2020 ............................................................................................... 1-3
Table 2-4. Physical Properties of Organic Contaminants in the Freeway Well ................................... 1-5
Table 3-1. Manganese Treatment System Preliminary Design Criteria .............................................. 1-5
Table 3-2. Packed Tower Air Stripping System Preliminary Design Criteria ........................................ 1-9
Table 3-3. GAC System Preliminary Design Criteria .......................................................................... 1-15
Table 3-4. Capital and Project Costs .................................................................................................. 1-20
Table 3-5. Annual Operations and Maintenance Costs ..................................................................... 1-21
Table 3-6. Life Cycle Costs ................................................................................................................. 1-22
LIST OF FIGURES
Figure 1-1. Freeway Well Location ...................................................................................................... 1-2
Figure 3-1. Mn Filter + Air Stripping Process Flow Diagram .............................................................. 1-11
Figure 3-2. Mn Filter + Air Stripping Site Layout ............................................................................... 1-12
Figure 3-3. Mn Filter + GAC Process Flow Diagram ........................................................................... 1-17
Figure 3-4. Mn Filter + GAC Site Layout ............................................................................................ 1-18
O-C-405-12-18-69-WP-R-FS
iii City of Santa Rosa Freeway Well Feasibility Study Report
September 2021
Table of Contents
LIST OF APPENDICES
Appendix A. Cost Estimates – AST
Appendix A. Cost Estimates – GAC
LIST OF ACRONYMS AND ABBREVIATIONS
µg/L Micrograms Per Liter ES-1/1-1
AACE Association for the Advancement of Cost Engineering 3-18
AF Acre-foot 3-20
BAAQMD Bay Area Air Quality Management District 3-4
C Celsius 2-5
CGA California Groundwater Association 3-2
City City of Santa Rosa ES-1/1-1
CR Continuous Regeneration 3-15
DCA Dichloroethane 2-2
DCE Dichloroethylene 2-3
DDW Division of Drinking Water 2-1
DNAPL Dense Nonaqueous Phase Liquid 2-5
EBCT Empty Bed Contact Time 3-9
EPI Estimation Program Interface 2-5
ft Feet 3-5
GAC Granular Activated Carbon ES-2/1-1
gpm Gallons Per Minute 1-1
H Horsepower 3-5
IR Intermittent Regeneration 3-15
lbs Pounds 3-5
MCL Maximum Contaminant Level ES-1/1-1
mg/L Milligram Per Liter 2-5
OPPC Opinion of Probable Project Cost 3-18
PAC Powdered Activated Carbon 3-9
Sonoma Water Sonoma County Water Agency 2-5
TCA Trichloroethane 2-2
TCE Trichloroethylene ES-1/1-1
TDS Total Dissolved Solids 2-3
USEPA U.S. Environmental Protection Agency 2-4
UV Ultraviolet 3-2
VOCs Volatile Organic Compounds ES-1/1-1
O-C-405-12-18-69-WP-R-FS
ES-1 City of Santa Rosa Freeway Well Feasibility Study Report
September 2021
Executive Summary
The City of Santa Rosa (City) has a currently inactive municipal water supply well known as the Freeway Well. This well was installed in 1957 and is 16-inch in diameter and 817 feet deep. The well is capable of producing up to 2,000 gallons per minute (gpm) of water and was historically operated at 800 gpm on a continuous basis. In 1987, volatile organic compounds (VOCs) were detected in the routine sampling of groundwater from the well. The level of trichloroethylene (TCE) in the groundwater exceeded the maximum contaminant level (MCL) allowed in drinking water of 5 micrograms per liter (µg/L) and use of the well for potable water production was discontinued.
The City is interested in evaluating the feasibility of modifying the existing Freeway Well, constructing a new replacement well, or treating the groundwater to restore the lost potable water production capacity. The City retained West Yost to provide hydrogeologic and engineering services to characterize the geology and vertical distribution of contaminants in the aquifer and to develop and evaluate alternatives to restore or replace potable water production from the well.
The City applied for and received a grant from the State Water Resources Control Board Proposition 1 Grant Program to examine the area around the Freeway Well to more fully characterize the groundwater contamination problem, better understand the lithology and deep aquifer hydrology, and provide additional groundwater sampling and data analysis to develop alternatives for groundwater cleanup and/or groundwater protection.
To better inform how the City might achieve its goals for the Freeway Well site, a Feasibility Study was completed, including the following four overarching tasks:
Identification, description and evaluation of treatment technologies and alternatives for VOC removal from the Freeway Well, if feasible;
A cost-benefit analysis of the economic feasibility of project alternatives. Costs will include conceptual cost estimates of capital costs (design, construction, start-up) and annual operation, monitoring, residuals management, and maintenance costs, including materials and operating consumables (e.g., electricity). Benefits will include estimates of financial and economic benefits because of the ability to bring the Freeway Well back on-line;
Ranking of project alternatives based on defined project objectives, including the cost-benefit analysis; and
Recommended alternative and rationale for selection, if feasible.
Additional detail is provided in Chapter 1 of this report.
FREEWAY WELL BACKGROUND
The Freeway Well is on the eastern margin of the Santa Rosa Plain in alluvium derived from the Mayacamas Mountains. The well is constructed in alternating layers of fine-grained materials including clay and sandy clay; and coarse-grained aquifer materials, including clayey sand and sand. A lithologic log of a boring completed at the Freeway Well site in 2020 shows three zones of coarse-grained aquifer materials in the screened interval of the Freeway Well at 150 to 180, 270 to 300, and 480 to 510 feet below ground surface.
Executive Summary
O-C-405-12-18-69-WP-R-FS
ES-2 City of Santa Rosa Freeway Well Feasibility Study Report
September 2021
Pump testing shows that the estimated aquifer hydraulic parameters of the Freeway Well are consistent with the hydrogeology of the area and indicative of a relatively low permeability aquifer with semiconfined to confined storage characteristics. During pump testing of Freeway well, 20 feet of drawdown was recorded in the Santa Rosa High School observation well located 1,600 feet northeast of the Freeway Well and 14 feet of drawdown was recorded in the Tesconi observation well located 2,400 feet to the west of the Freeway Well. The estimated radial extent of drawdown was approximately 7,300 feet. Pumping in the Freeway Well reverses the gradient and the direction of groundwater flow west of the site and steepened the gradient to the east.
In October 2013, the City conducted sampling of the groundwater at discrete depths within the Freeway Well to determine the vertical distribution of the groundwater contamination. Water samples were collected at depths ranging between 100 and 600 feet. For some of the constituents present in the groundwater, the concentrations are slightly lower at the upper and lower depths, but for all constituents, the concentrations do not appear to vary significantly over the varying depths.
Groundwater samples were collected in September and October 2020 from monitoring wells installed at different depths near the Freeway Well and from the Freeway Well for water quality analysis. Table 2-3 summarizes the recent results for the VOC analysis. The VOC concentrations in shallow and deep regions tended to be lower than in the middle region of the aquifer. Based on the 2020 sampling, the TCE concentration in the groundwater in the Freeway Well is still above the MCL.
Additional background on the Freeway Well is provided in Chapter 2 of this report.
REMEDIAL ACTION ALTERNATIVES
The remedial action alternatives included:
• Abandonment of the Freeway Well
• Well retrofit and/or replacement
• Groundwater treatment alternatives
Abandonment of the Freeway Well would include blocking off contaminated zones to prevent migration of contaminants. Modifying the existing well is not considered feasible as the existing well has a gravel pack that extends almost the full depth of the well. It is not possible to block off the contaminated zones as water can flow vertically through the gravel pack. Replacing the well, while feasible, would not be expected to significantly improve the water quality, and groundwater treatment would still be needed. Additionally, it is likely to be less productive than the existing well due to observed lower yield of the deeper water-bearing zones.
Groundwater treatment alternatives included oxidation/manganese oxide-coated media filtration for manganese removal, followed by air stripping or granular activated carbon (GAC) for TCE removal. Several other treatment alternatives to remove organic constituents were briefly examined and discarded from further evaluation after a literature review indicated air stripping and GAC were considered Best Available Technologies for TCE removal.

Executive Summary
O-C-405-12-18-69-WP-R-FS
ES-3 City of Santa Rosa Freeway Well Feasibility Study Report
September 2021
Both the air stripping and GAC alternatives were evaluated to estimate capital and operational costs and possible treatment system footprint on the existing Freeway Well property. The estimated project cost for the two treatment alternatives range between $4 million and $5 million. However, due to the size and configuration of the existing well site, it would be infeasible to construct all the needed treatment facilities and equipment on the existing well site property.
The well retrofit and treatment alternatives are described in more detail in Chapter 3.
SUMMARY AND RECOMMENDATIONS
A new well, constructed on the Freeway Well site and screened to avoid the higher levels of contamination in the existing Freeway Well, would likely still require wellhead treatment for VOCs and manganese removal and be less productive than the existing well. The treatment facilities needed to remove TCE and manganese to meet regulatory levels for drinking water cannot feasibly fit within the existing Freeway Well parcel. Furthermore, it would be more cost effective to construct a new well at a different site that would not require treatment for contaminant removal.
Utilizing the existing Freeway Well would require wellhead treatment for VOCs and manganese removal, which cannot feasibly fit within the site. Furthermore, due to the time needed to disinfect and verify adequate disinfection of the well and treatment facilities after a long-term shut down, Freeway well could not effectively serve as an emergency well. Instead, the well would need to be utilized as a production well, but it would first need to undergo an extensive State permitting process to shift from standby status to production status. While permitting is not an insurmountable obstacle, operating the existing Freeway Well could cause further migration of contaminants from the upper zone into the lower zone of the aquifer. Therefore, the recommended project is to properly abandon the Freeway Well to prevent further migration of contaminants from upper aquifer zones into lower aquifer zones.
After permitting and financing are obtained, abandonment of the Freeway Well can be accomplished fairly quickly, likely in less than 12 months. This takes into account the time needed for preparation of bid documents, bid solicitation, bid selection, award negotiation and execution, and project execution.
O-C-405-12-18-69-WP-R-FS
1-1 City of Santa Rosa Freeway Well Feasibility Study Report
September 2021
CHAPTER 1 Introduction
1.1 BACKGROUND
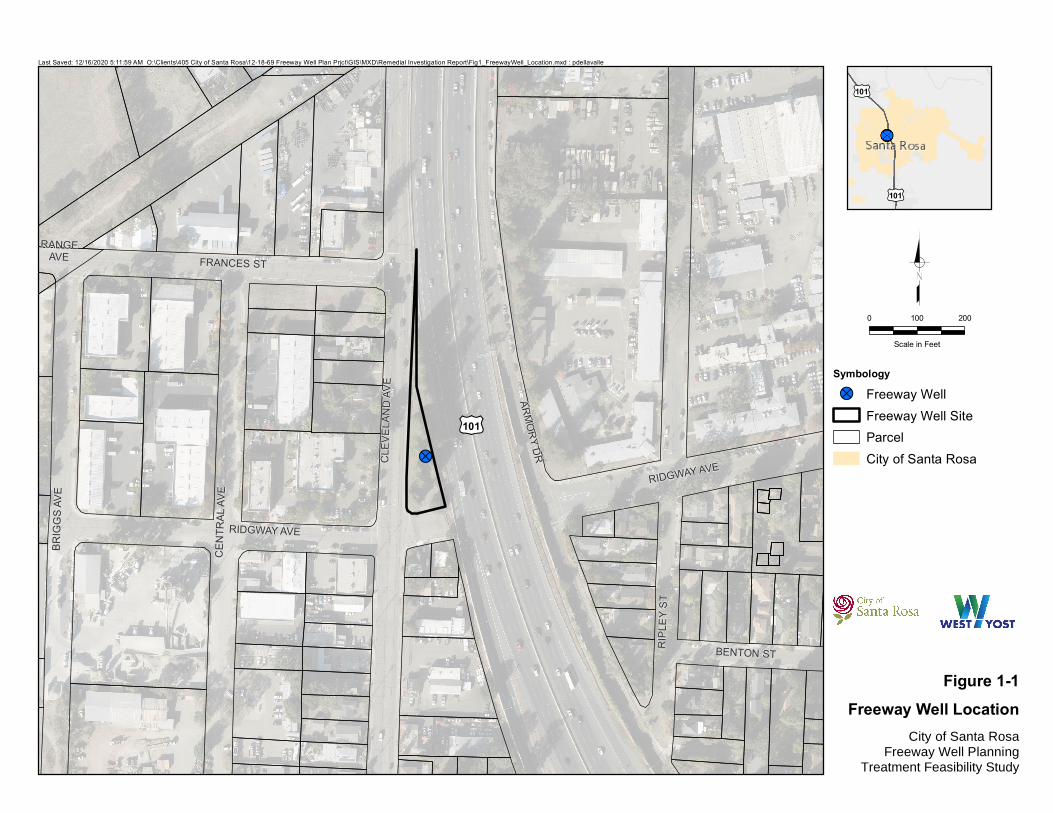
The City of Santa Rosa (City) has a currently inactive municipal water supply well known as the Freeway Well. The location of the well is shown in Figure 1-1. This well was installed in 1957 and is 16-inch in diameter and 817 feet deep. The well is capable of producing up to 2,000 gallons per minute (gpm) of water and was historically operated at 800 gpm on a continuous basis. In 1987, volatile organic compounds (VOCs) were detected in the routine sampling of groundwater from the well. The level of trichloroethylene (TCE) in the groundwater exceeded the maximum contaminant level (MCL) allowed in drinking water of 5 micrograms per liter (µg/L) and use of the well for potable water production was discontinued.
The City pursued an evaluation of the feasibility of modifying the existing Freeway Well, constructing a new replacement well, or treating the groundwater to restore the lost potable water production capacity. The City retained West Yost to provide hydrogeologic and engineering services to characterize the geology and vertical distribution of contaminants in the aquifer and to develop and evaluate alternatives to restore or replace potable water production from the well.
The City applied for and received a grant from the State Water Resources Control Board Proposition 1 Grant Program to examine the area around the Freeway Well to more fully characterize the groundwater contamination problem, better understand the lithology and deep aquifer hydrology, and provide additional groundwater sampling and data analysis to develop alternatives for groundwater cleanup and/or groundwater protection.
The City’s Scope of Work in the grant agreement includes the following tasks:
Task 1. Project Management
Task 2. General Compliance Requirements/Project Effectiveness and Performance
Task 3. Permitting and Environmental Compliance
Task 4. Technical Advisory Committee
Task 5. Stakeholder Advisory Group
Task 6. Remedial Investigation Workplan
Task 7. Remedial Investigation Report
Task 8. Feasibility Study Report
Task 9. Public Outreach
The Freeway Well Remedial Investigation was completed in February 2021, in accordance with the grant requirements. The findings documented in the Remedial Investigation Report are summarized in Section 1.2 below.
This Feasibility Study Report fulfills the grant requirements for Task 8 Feasibility Study Report.
0 200100
Scale in Feet
Last Saved: 12/16/2020 5:11:59 AM O:\Clients\405 City of Santa Rosa\12-18-69 Freeway Well Plan Prjct\GIS\MXD\Remedial Investigation Report\Fig1_FreewayWell_Location.mxd : pdellavalle
Symbology!? Freeway Well
Freeway Well SiteParcelCity of Santa Rosa
£¤101
£¤101
!?
£¤101
ARMORY DR
RANGEAVE
RIDGWAY AVE
BENTON ST
FRANCES ST
CLEV
ELAN
D AVE
RIPL
EY S
T
RIDGWAY AVE
CENT
RAL A
VE
BRIG
GS AV
E
Treatment Feasibility StudyFreeway Well Planning
City of Santa Rosa
Freeway Well Location Figure 1-1

Chapter 1 Introduction
O-C-405-12-18-69-WP-R-FS
1-3 City of Santa Rosa Freeway Well Feasibility Study Report
September 2021
1.2 REMEDIAL INVESTIGATION REPORT
In February 2021, the City completed the Freeway Well Remedial Investigation Report (West Yost, February 2021). To complete the Remedial Investigation Report, records research, site investigations, monitoring well construction, and aquifer testing were completed. The data obtained through the extensive research and investigations were analyzed and the following conclusions were stated in the Remedial Investigation Report:
The records research did not uncover any releases or potentially responsible parties to the contamination of Freeway Well that had not been previously identified.
The records research and aquifer testing indicated that a replacement well drilled near the Freeway Well would be expected to have lower concentrations of VOCs as are found in the Freeway Well, if the replacement well were screened at different levels as the Freeway Well.
The monitoring well construction and aquifer testing confirmed that the Freeway Well remains contaminated at the same approximate concentrations as had been noted during previous sampling events in prior years.
The construction of the Freeway Well, with a gravel pack extending through several of the semi-confined aquifers, is almost certainly contributing to cross-contamination of the deeper aquifers.
Modifying the Freeway Well to block off contaminated zones is not considered feasible.
Wellhead treatment could be feasible and would be explored and discussed in a Feasibility Study report that would be completed after the Remedial investigation Report had been approved by the State.
Based on the findings indicated above, the Remedial Investigation Report documented the following recommended actions for the City’s consideration:
Explore less contaminated areas as potential sites to construct a replacement well.
Properly abandon and seal the Freeway Well to prevent it from remaining as a conduit between the upper and lower aquifers to protect groundwater quality, even if it is determined that wellhead treatment is feasible.
Explore the option of constructing a new well on the Freeway Well site that would be screened only at the lower aquifer with the upper aquifer sealed off.
1.3 FEASIBILITY STUDY OBJECTIVES
As indicated above, the Freeway Well had historically produced approximately 800 gpm of municipal water supply for the residents of the City. Assuming this well could be returned to active status as a municipal well, and operated 50 percent of the time, the Freeway Well would produce approximately 645 acre-feet of water per year.
The loss of the Freeway Well impacted the City’s potable water supply portfolio. For many years the City has been interested in the possibility of restoring production of potable water at the site and protecting the aquifer from further degradation. To accomplish these goals, the City needed to develop and evaluate technical information. Therefore, the objective of this Feasibility Study is to characterize the geology and
Chapter 1 Introduction
O-C-405-12-18-69-WP-R-FS
1-4 City of Santa Rosa Freeway Well Feasibility Study Report
September 2021
aquifer conditions and understand the likely sources and vertical distribution of contaminants. This information will be used to evaluate the feasibility of alternative water production and treatment options.
To better inform how the City might achieve its goals for the Freeway Well site, a Feasibility Study was completed, including the following four overarching tasks:
Identification, description and evaluation of treatment technologies and alternatives for VOC removal from the Freeway Well, if feasible;
A cost-benefit analysis of the economic feasibility of project alternatives. Costs will include conceptual cost estimates of capital costs (design, construction, start-up) and annual operation, monitoring, residuals management, and maintenance costs, including materials and operating consumables (e.g., electricity). Benefits will include estimates of financial and economic benefits because of the ability to bring the Freeway Well back on-line;
Evaluation of project alternatives based on defined project objectives, including the cost-benefit analysis; and
Recommended alternative and rationale for selection, if feasible.
1.4 GRANT TASK CROSS-REFERENCE
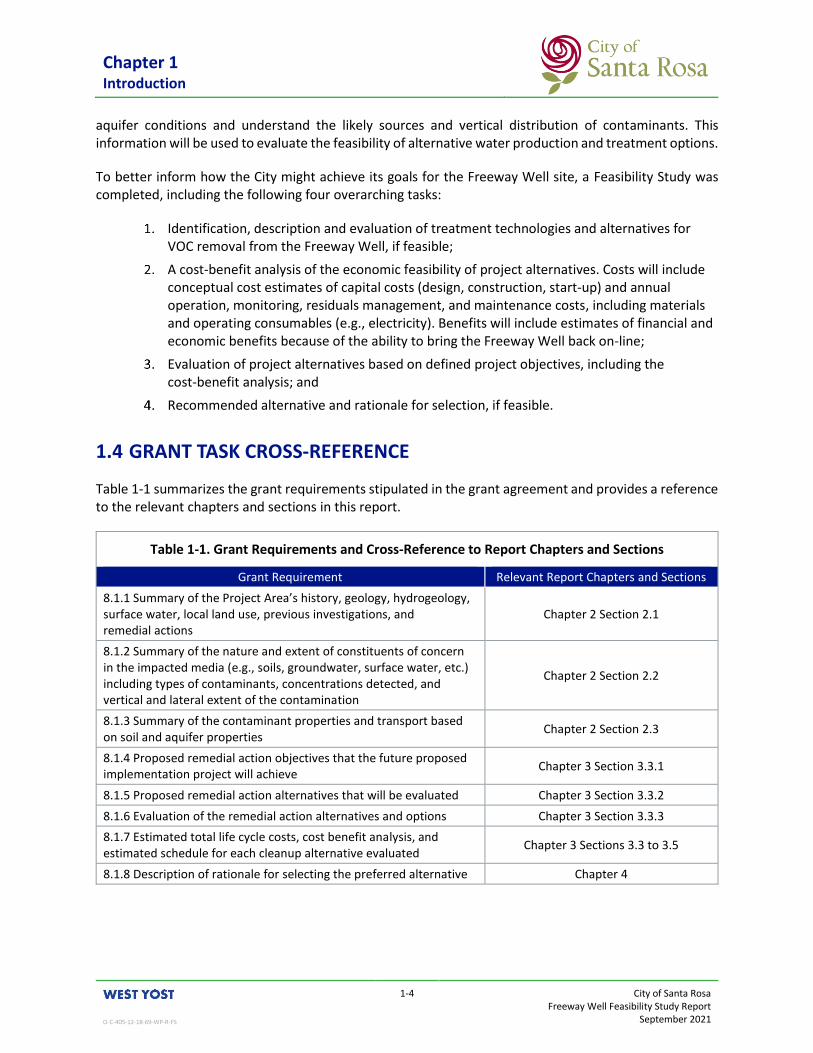
Table 1-1 summarizes the grant requirements stipulated in the grant agreement and provides a reference to the relevant chapters and sections in this report.
Table 1-1. Grant Requirements and Cross-Reference to Report Chapters and Sections
Grant Requirement Relevant Report Chapters and Sections
8.1.1 Summary of the Project Area’s history, geology, hydrogeology, surface water, local land use, previous investigations, and remedial actions
Chapter 2 Section 2.1
8.1.2 Summary of the nature and extent of constituents of concern in the impacted media (e.g., soils, groundwater, surface water, etc.) including types of contaminants, concentrations detected, and vertical and lateral extent of the contamination
Chapter 2 Section 2.2
8.1.3 Summary of the contaminant properties and transport based on soil and aquifer properties
Chapter 2 Section 2.3
8.1.4 Proposed remedial action objectives that the future proposed implementation project will achieve
Chapter 3 Section 3.3.1
8.1.5 Proposed remedial action alternatives that will be evaluated Chapter 3 Section 3.3.2
8.1.6 Evaluation of the remedial action alternatives and options Chapter 3 Section 3.3.3
8.1.7 Estimated total life cycle costs, cost benefit analysis, and estimated schedule for each cleanup alternative evaluated
Chapter 3 Sections 3.3 to 3.5
8.1.8 Description of rationale for selecting the preferred alternative Chapter 4
Chapter 1 Introduction
O-C-405-12-18-69-WP-R-FS
1-5 City of Santa Rosa Freeway Well Feasibility Study Report
September 2021
1.5 DISCLOSURE STATEMENT
Funding for this project has been provided in part through an agreement with the State Water Resources Control Board using funds from Proposition 1. The contents of this document do not necessarily reflect the views and policies of the foregoing, nor does mention of trade names or commercial products constitute endorsement or recommendation for use.

O-C-405-12-18-69-WP-R-FS
1-1 City of Santa Rosa Freeway Well Feasibility Study Report
September 2021
CHAPTER 2 Groundwater Contamination
2.1 PROJECT AREA DESCRIPTION
The City previously had an active, municipal water supply well, known as the Freeway Well. The well is located on a northerly elongated triangular parcel wedged between Cleveland Avenue and Highway 101, north of College Avenue at Ridgway Avenue. The parcel includes a stand of redwood trees, the well building, a storage building (which formerly housed the emergency backup generator for the well), below grade utility vaults, and a small parking area. The property is fenced with a vehicle access gate along the southern property boundary on Ridgway Avenue. Land use in the vicinity includes a mix of light industrial use centered around existing and former railroads and surrounding residential properties.
The Freeway Well, drilled and constructed in 1957, is a 16-inch diameter, 817-foot deep well reportedly capable of producing up to 2,000 gpm.
In March of 1987, the City conducted routine sampling of the Freeway Well and the analytical results revealed the presence of TCE at a concentration above the allowable MCL. TCE is a known carcinogen, and one of several compounds known as volatile chlorinated hydrocarbons or organic compounds, also called VOCs.
The State of California, Division of Drinking Water (DDW) ordered the City to discontinue use of the Freeway Well for potable supply, and to physically disconnect the well from the City’s distribution system.
The Freeway Well is on the eastern margin of the Santa Rosa Plain in alluvium derived from the Mayacamas Mountains. The well is constructed in alternating layers of fine-grained materials including clay and sandy clay; and coarse-grained aquifer materials, including clayey sand and sand. A lithologic log of a boring completed at the Freeway Well site in 2020 shows three zones of coarse-grained aquifer materials in the screened interval of the Freeway Well at 150 to 180, 270 to 300, and 480 to 510 feet below ground surface.
Pump testing shows that the estimated aquifer hydraulic parameters of the Freeway Well are consistent with the hydrogeology of the area and indicative of a relatively low permeability aquifer with semiconfined to confined storage characteristics. Pumping in the Freeway Well caused 20 feet of drawdown in the Santa Rosa High School observation well located 1,600 feet northeast of the Freeway Well and 14 feet of drawdown in Tesconi observation well located 2,400 feet to the west of the Freeway Well. The estimated radial extent of drawdown was approximately 7,300 feet. Pumping in the Freeway Well reverses the gradient and the direction of groundwater flow west of the site and steepened the gradient to the east.
2.2 NATURE AND EXTENT OF CONSTITUENTS OF CONCERN
In March 1987, TCE at a concentration above the MCL for drinking water was found in the groundwater from the Freeway Well during routine groundwater sampling. Confirmation sampling of the groundwater and analyses for VOCs were conducted over the years since the detection of VOCs in the Freeway Well. Table 2-1 below summarizes the concentrations of the constituents with levels above their associated detection limits for reporting. The California drinking water MCLs for these constituents are also listed in Table 2-1. As shown, the TCE concentrations in the Freeway Well continued to be above the associated MCL.

Chapter 2 Groundwater Contamination
O-C-405-12-18-69-WP-R-FS
1-2 City of Santa Rosa Freeway Well Feasibility Study Report
September 2021
Table 2-1. Historical Freeway Well Water Quality, 1987-1995
Constituents Units Concentration Sample Date MCL(a) (Effective Date)
Initial Sampling
Trichloroethylene (TCE) μg/L 8.0 3/24/1987 5 (5/1989)
Confirmation Sampling
TCE μg/L
8.3 6/11/1987
5 (5/1989) 25.0 10/13/1987
2.2 8/11/1989
9.1 5/24/1995
1,1-Dichloroethane (1,1-DCA)
μg/L 1.2 5/25/1989 5 (6/24/1990)
1,1-Dichloroethene (1,1-DCE) μg/L
1.1 6/11/1987
6 (2/25/1989) 2.6 10/13/1987
1.2 8/11/1989
4.3 5/24/1995
1,1,1-Trichloroethane (1,1,1-TCA)
μg/L
1.6 6/11/1987
200 (2/25/1989) 5.0 10/13/1987
2.0 8/11/1989
0.69 5/24/1995
1,1,2-Trichloro-2,2,1-Trifluoroethane (Freon 113)
μg/L 7.3 6/11/1987 1,200 (6/24/1990)
Trichlorofluoromethane (Freon 11)
μg/L 14.0 5/25/1989 150 (6/24/1990)
(a) Maximum contaminant levels and effective dates for drinking water in the State of California.
In October 2013, the City conducted sampling of the groundwater at discrete depths within the Freeway Well to determine the vertical distribution of the groundwater contamination. Water samples were collected at depths ranging between 100 and 600 feet. Table 2-2 lists the sampling depths and associated water quality data. For some of the constituents present in the groundwater, the concentrations are slightly lower at the upper and lower depths, but for all constituents, the concentrations do not appear to vary significantly over the varying depths.

Chapter 2 Groundwater Contamination
O-C-405-12-18-69-WP-R-FS
1-3 City of Santa Rosa Freeway Well Feasibility Study Report
September 2021
Table 2-2. Freeway Well Discrete Depth Sampling Water Quality(a), 2013
Depth, feet
VOCs, μg/L Chloride,
mg/L
Total Dissolved
Solids, mg/L TCE(b) 1,1-DCE Freon 113 Toluene
118 18 3.1 12 ND(b) 14.4 290
178 17 3.0 12 ND(b) 13.9 260
278 22 4.1 16 0.67 13.8 280
343 22 3.9 16 0.79 13.9 280
414 24 4.2 17 0.81 13.6 280
458 24 4.2 16 0.90 13.6 290
498 20 3.6 13 0.87 14.2 280
590 19 3.4 11 1.0 13.7 280
(a) Sampling conducted on October 4, 2013.
(b) Not detected. For toluene, the detection limit for reporting is ≥0.50 μg/L.
mg/L = Milligrams per Liter
Groundwater samples were collected in September and October 2020 from the monitoring wells installed at different depths at the Freeway Well site and from the Freeway Well for water quality analysis. Table 2-3 summarizes the recent results for the VOC analysis. The VOC concentrations in shallow and deep regions tended to be lower than in the middle region of the aquifer. As shown, based on the 2020 sampling, the TCE concentration in the groundwater in the Freeway Well is still above the MCL.
Table 2-3. VOCs in Groundwater, 2020
Monitoring Wells Freeway Well
Depth Shallow,
μg/L Middle,
μg/L Deep, μg/L
Sample Date
Concentration, μg/L
Sample Date
t-Butyl Alcohol (TBA) ND(a) ND(a) 7.7 9/4/2020
ND(a)
9/24/2020
ND(a) ND(a) ND(a) 10/8/2020
Chloroform 0.53 1.1 0.52 9/4/2020
ND(a) ND(a) ND(a) ND(a) 10/8/2020
1,1-Dichloroethylene (DCE)
1.1 1.2 ND(a) 9/4/2020 3.4
1.1 2.9 0.71 10/8/2020
Freon 113 4.1 3.4 0.86 9/4/2020
7.2 3.4 9.4 2.1 10/8/2020
4-Isopropyl Toluene ND(a) ND(a) 0.69 9/4/2020
ND(a) ND(a) ND(a) ND(a) 10/8/2020
TCE 4.3 9.4 ND(a) 9/4/2020
21 4.6 14 ND(a) 10/8/2020
(a) Not detected. For TBA, the detection limit for reporting is ≥5.0 μg/L. For chloroform, 1,1-DCE, 4-Isopropyl Toluene, and TCE, the detection limit for reporting is ≥0.50 μg/L.
Chapter 2 Groundwater Contamination
O-C-405-12-18-69-WP-R-FS
1-4 City of Santa Rosa Freeway Well Feasibility Study Report
September 2021
The lateral extent of VOCs in the groundwater around the Freeway Well can be inferred from investigations of sites in the vicinity as described in Section 2.2.4.1 of Chapter 2 and further discussed in Chapter 4 of the Freeway Well Remedial Investigation Report. The contaminants present in the Freeway Well and the Shallow, Middle, and Deep Monitoring Wells appear to have originated at three properties 1,000 feet west of the Site associated with West Coast Metals, a former auto dismantler that operated from 1967 to 1986. The West Coast Metals release is under investigation by Union Pacific Railroad, the property owner, with regulatory oversight by the NCRWQCB (R1-2014-0021). TCE, 1,1-DCE and Freon 113 are significant constituents of the West Coast Metals plume. These are also the primary constituents detected in the Freeway Well and the Shallow, Middle, and Deep Monitoring Wells. Isoconcentration maps of the West Coast Metals contaminant plumes (Figures 7 through 12, Appendix X of the Freeway Well Remedial Investigation Report) show the plume extending to the west and away from the Freeway well. It is important to note however, that the Freeway Well operated from 1957 to 1987 and the investigation of the West Coast Metals site did not begin until 1988 after operation of the Freeway Well had stopped. The Freeway Well Remedial Investigation demonstrated that pumping from the Freeway Well changes the groundwater flow gradient causing flow from the area of the West Coast Metals operations eastward towards the Freeway Well. Therefore, it can be expected that while the Freeway Well was operational, the West Coast Metals plume was pulled eastward and impacted groundwater and aquifer materials exist between the Freeway Well and the West Coast Metals properties.
2.3 CONTAMINANT PROPERTIES AND TRANSPORT
2.3.1 Contaminants
As of September 24, 2021, the groundwater in the Freeway Well is contaminated with three VOCs: TCE, dichloroethylene (DCE), and Freon 113. TCE and Freon 113 are both common cleaning and degreasing solvents and DCE is a breakdown product of TCE. TCE is present at concentrations greater than the MCL of 5 µg/L. Both DCE and Freon 113 are present in concentrations much less than their respective MCLs.
TCE is one of the most widely made and used chlorinated solvents. It has been manufactured in the United States since the 1920s primarily for use as a solvent for metal degreasing, but also as a refrigerant and as a dry-cleaning fluid. TCE is a VOC that poses a human health hazard to the central nervous system, kidney, liver, immune system, reproductive system, and to the developing fetus. TCE is also characterized by U.S. Environmental Protection Agency (USEPA) as carcinogenic to humans by all routes of exposure (i.e., by inhalation, ingestion, and dermal exposure).
Freon 113 is a chlorofluorocarbon used as a solvent for cleaning metal parts and electronics. It is a solvent for oils, grease, and soldering flux. It has high chemical stability, low toxicity, and no flammability which makes it desirable for cleaning by hand.
2.3.2 Properties and Transport of TCE
TCE is denser than water and has a low absolute solubility in groundwater (see Table 2-4). Therefore, when free phase TCE is spilled, it will move downward through an aquifer as a dense nonaqueous phase liquid (DNAPL) until it accumulates in pools on top of low permeability layers. DNAPL pools can act as long-lasting source areas of TCE contamination. TCE is moderately soluble in water (1000 mg/L at 20˚ Celsius (C)) but the solubility is orders of magnitude greater than the 5 µg/L MCL. As groundwater moves through these source areas, TCE partitions into an aqueous phase and is spread through the aquifer by advection and dispersion (Russell, Matthews, and Sewell, 1992).
Chapter 2 Groundwater Contamination
O-C-405-12-18-69-WP-R-FS
1-5 City of Santa Rosa Freeway Well Feasibility Study Report
September 2021
TCE can destroy the structure of clayey minerals, making them more permeable to dissolved contaminants. TCE is not readily degraded in groundwater, although some TCE may naturally degrade under anaerobic conditions. However, TCE may degrade into compounds that are toxic and more difficult to degrade than TCE, such as DCE and vinyl chloride (SWRCB, 2009).
The Henry’s Law constant for TCE is 0.00892 atm-m3/mo at 20˚C which is high enough, when combined with its low solubility in water and high vapor pressure, for efficient transfer of TCE to the atmosphere. The evaporation half-life of TCE in water is on the order of 20 minutes at room temperature in both static and stirred vessels (Dilling, 1975; Dilling et al., 1975).
Releases of TCE and other VOCs from the West Coast Metals site have affected groundwater in the vicinity of the Freeway well. Investigation of the West Coast Metals sites has documented the presence of VOCs in soil and groundwater at and to the west of the former auto dismantling operation as shown by isoconcentration maps of the West Coast Metals contaminant plumes (Figures 7 through 12, Appendix X of the Freeway Well Remedial Investigation Report). However, the investigation did not explore the soil and groundwater conditions east of the facility. Other than the data from the Freeway Well site, there are no data between West Coast Metals and the Freeway Well. This data gap is likely because investigation of the West Coast Metals site did not begin until 1988 after operation of the Freeway Well had stopped. Because pumping from the Freeway Well changed the groundwater flow gradient causing flow from the area of the West Coast Metals operations eastward towards the Freeway Well, it can be expected that while the Freeway Well was operational, the West Coast Metals plume was pulled eastward. The former flow regime may have resulted in undocumented impacts to groundwater and aquifer materials between the Freeway Well and the West Coast Metals properties.
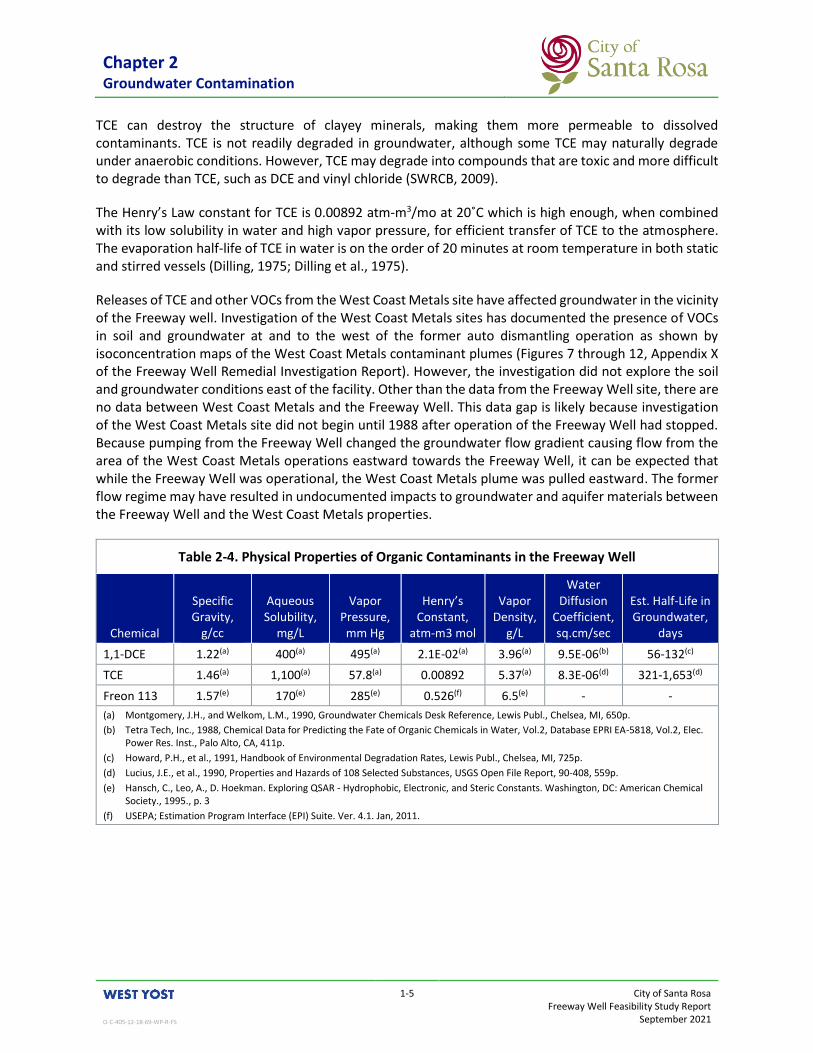
Table 2-4. Physical Properties of Organic Contaminants in the Freeway Well
Chemical
Specific Gravity,
g/cc
Aqueous Solubility,
mg/L
Vapor Pressure, mm Hg
Henry’s Constant,
atm-m3 mol
Vapor Density,
g/L
Water Diffusion
Coefficient, sq.cm/sec
Est. Half-Life in Groundwater,
days
1,1-DCE 1.22(a) 400(a) 495(a) 2.1E-02(a) 3.96(a) 9.5E-06(b) 56-132(c)
TCE 1.46(a) 1,100(a) 57.8(a) 0.00892 5.37(a) 8.3E-06(d) 321-1,653(d)
Freon 113 1.57(e) 170(e) 285(e) 0.526(f) 6.5(e) - -
(a) Montgomery, J.H., and Welkom, L.M., 1990, Groundwater Chemicals Desk Reference, Lewis Publ., Chelsea, MI, 650p.
(b) Tetra Tech, Inc., 1988, Chemical Data for Predicting the Fate of Organic Chemicals in Water, Vol.2, Database EPRI EA-5818, Vol.2, Elec. Power Res. Inst., Palo Alto, CA, 411p.
(c) Howard, P.H., et al., 1991, Handbook of Environmental Degradation Rates, Lewis Publ., Chelsea, MI, 725p.
(d) Lucius, J.E., et al., 1990, Properties and Hazards of 108 Selected Substances, USGS Open File Report, 90-408, 559p.
(e) Hansch, C., Leo, A., D. Hoekman. Exploring QSAR - Hydrophobic, Electronic, and Steric Constants. Washington, DC: American Chemical Society., 1995., p. 3
(f) USEPA; Estimation Program Interface (EPI) Suite. Ver. 4.1. Jan, 2011.
Chapter 2 Groundwater Contamination
O-C-405-12-18-69-WP-R-FS
1-6 City of Santa Rosa Freeway Well Feasibility Study Report
September 2021
2.4 REFERENCESDilling, W.L. 1975. Interphase Transfer Processes. II. Evaporation Rates of Chloromethanes, Ethanes, Ethylenes,
Propanes and Propylenes from Dilute Aqueous Solutions, Comparisons with Theoretical Predictions. Environ. Sci. Tech. 11:405-409.
Dilling, W.L., N.B. Tefertiller and G.J. Kollos. 1975. Evaporation Rates and Reactivities of Methylene Chloride, Chloroform, 1,1,1-Trichloroethane, Trichloroethylene, Tetrachloroethylene and Other Chlorinated Compounds in Dilute Aqueous Solutions. Environ. Sci. Tech. 9:833-838.
Russell, H.H., Matthews, J.E., and Sewell, G.W. 1992. TCE Removal from Contaminated Soil and Groundwater. EPA Groundwater Issue 540/S-92/002.
State Water Resources Control Board. 2009. Groundwater Information Sheet TCE.
O-C-405-12-18-69-WP-R-FS
1-1 City of Santa Rosa Freeway Well Feasibility Study Report
September 2021
CHAPTER 3 Remedial Action Alternatives
The purpose of this chapter is to describe the evaluation of remedial action alternatives to protect groundwater and to allow for the Freeway Well to be returned service. A retrofit of the existing Freeway Well and a replacement of the Freeway Well are briefly discussed; however, due to the construction of the Freeway Well, a retrofit of the existing well is not considered feasible. Furthermore, a replacement of the well at the existing site is considered likely to result in a well with similar issues to the existing Freeway Well. Therefore, this chapter focuses on groundwater treatment alternatives to potentially allow for the Freeway Well to be returned to service.
3.1 REMEDIAL ACTION OBJECTIVES
Before the City became a customer of the Sonoma County Water Agency (Sonoma Water) in 1959, groundwater production from the aquifers beneath the City served as the City’s primary water supply. Even with the current Sonoma Water supply, the City regularly uses groundwater to help meet peak summer demands. The City also needs emergency supply for public health and safety if the Sonoma Water supply were to be interrupted. Under current normal operations, groundwater makes up approximately 5 to 10 percent of the City’s annual supply. If production of potable water from the Freeway Well can be reestablished without inducing the spread of contamination currently present in the upper water bearing zones, access to an aquifer that has served as an important and unusually productive source of drinking water can be reestablished.
The purpose of the proposed remedial actions discussed in this report is to protect and/or determine the feasibility of reestablishing the Freeway Well as a source of potable water supply serving the City. In reviewing remedial action alternatives, the City has evaluated the feasibility of the following:
• Abandoning and properly destroying the existing Freeway Well to protect groundwater resources for future use;
• Installing a new well which only taps into the lower water bearing zones; and
• Pumping and treating contaminated groundwater from the Freeway Well to potable water standards.
3.2 FREEWAY WELL RETROFIT/REPLACEMENT ALTERNATIVES
The Freeway Well Remedial Investigation Report concluded that modifying the existing Freeway Well to block off contaminated zones is not considered feasible. The Freeway Well is constructed with nearly continuous perforations and a gravel pack extending from 38 feet below surface to the bottom of the well at 800 feet. As such, water can flow vertically through the gravel pack around any seal or packer that could be placed in the well.
Furthermore, VOCs detected in the deepest of the newly installed on-site monitoring wells at 510 feet below the surface indicate that contaminants have penetrated deep into the aquifer. Therefore, the screened sections above this level would have to be excluded, including the most productive zone in the well. As described in the Remedial Investigation Report, flow velocity testing conducted in 2020 demonstrated that 99 percent of the water produced from the well enters between 107 and 280 feet below ground surface; no measurable flow was detected below 300 feet. Therefore, placing a pump deep in the well below a packer set at 580 feet below surface (in the first blank section below the VOC detection at 510 feet) would significantly reduce the efficiency and yield of the well.
Chapter 3 Remedial Action Alternatives
O-C-405-12-18-69-WP-R-FS
1-2 City of Santa Rosa Freeway Well Feasibility Study Report
September 2021
Proper abandonment of the well was recommended in the Remedial Investigation Report to eliminate the conduit for transport of contaminants from the upper zones into the lower zones. The recommended approach is to fill the well from bottom to top with a sand cement slurry1 and blast perforate the blank casing from 107 to 400 feet below surface. The work should be done under permit from the Sonoma County Department of Health Services and in accordance to Section 25B-7 of the Sonoma County Municipal Code and Article 299 of the California Groundwater Association (CGA) Standard Practices.
While it may be feasible to construct a new well at the existing site that taps into the lower water bearing zones and does not create a conduit between the upper water bearing zones and the lower water bearing zones, the yield of the lower water bearing zones is unknown. As indicated in the Remedial Investigation Report, very little flow was documented from the lower zones during the aquifer test, and the new well can be expected to be less productive than the existing well. Additionally, given the likely presence of a long-term secondary source of TCE in the aquifer and the depth within the aquifer to which VOCs are present, the new well can be expected eventually produce TCE at concentrations exceeding the MCL and require treatment.
3.3 GROUNDWATER TREATMENT ALTERNATIVES
The treatment objectives, technologies, and alternatives evaluated are discussed below.
3.3.1 Treatment Objectives
For the development of the treatment alternatives and associated costs, the objectives of the treatment process are to:
• Reduce TCE concentrations in the groundwater from 25 µg/L to below the MCL of 5 µg/L
• Reduce manganese concentrations from 600 µg/L to below the secondary MCL of 50 µg/L
• Provide continuous treatment of groundwater for potable use at a flow rate of 700 to 1,000 gpm
It should be noted that the groundwater quality constituents listed in Chapter 2 were measured in the existing Freeway Well during the aquifer test and likely represents a higher degree of contamination than would be found in the lower water bearing zones.
3.3.2 Treatment Technologies
The USEPA maintains a Drinking Water Treatability Database that identifies treatment processes, based on literature review, that have been tested for reducing concentrations of common contaminants in source waters.
1 A sand cement slurry such as an “11 sack mix”, which is made up of 94 lbs. of Portland Type I/II or II/V cement to a maximum of 188 lbs sand, and maximum 7 gallons of water.
Chapter 3 Remedial Action Alternatives
O-C-405-12-18-69-WP-R-FS
1-3 City of Santa Rosa Freeway Well Feasibility Study Report
September 2021
The treatment processes identified from the USEPA literature review as effective in removing or reducing TCE in water, along with removal rates from the cited studies, are listed below:
• Air stripping with packed tower (60 to 100 percent removal)
• Adsorption with activated carbon (75 to 99 percent removal)
• Membrane separation (81 to 98 percent removal)
• Advanced oxidation with ozone and hydrogen peroxide (> 90 percent reduction)
• Advanced oxidation with ultraviolet (UV) light and titanium dioxide (90 percent reduction)
Packed tower air stripping and activated carbon adsorption were noted by USEPA as the best available technologies for TCE removal (USEPA, 2009). The cited studies that tested membranes for TCE removal showed widely differing results – one study showed 81 to 98 percent removal while another study showed 0 to 3 percent removal. Although the advanced oxidation processes were found to be effective in TCE reduction, the required dosages and/or contact times were higher and longer than the typical ranges for drinking water treatment.
Manganese oxide-coated media filtration is commonly used for manganese removal in drinking water treatment.
3.3.3 Treatment Alternatives
Based on the literature review discussed above regarding available treatment technologies, West Yost evaluated both packed tower air stripping and activated carbon adsorption contactors as viable treatment alternatives for TCE removal. Both alternatives assume use of manganese dioxide-coated media filtration for manganese removal upstream of the TCE removal treatment process so that the manganese does not precipitate and foul the media used in the TCE removal system.
3.3.3.1 Manganese Oxide-Coated Media Filtration - Manganese Removal
The process description, design and operational considerations, design criteria, and conceptual site layout for manganese removal treatment are discussed below.
3.3.3.1.1 Process Description
Filtration using a manganese oxide-coated media, such as manganese greensand, has historically been use for manganese removal. The media is chemically treated to form a manganese oxide coating on the media. When water with manganese passes through the media bed, the soluble manganese is adsorbed onto the media’s oxide surface. An oxidant can be added to oxidize the soluble manganese to manganese oxide continuously prior to filtration or intermittently after filtration and adsorption of the soluble manganese onto the media. The manganese oxide is then removed by backwashing the filter. The oxidant is also used to regenerate the media’s adsorption/oxidation capacity.
3.3.3.1.2 Design and Operational Considerations
Design and operational considerations include media, media regeneration, and backwashing, as discussed below.
Chapter 3 Remedial Action Alternatives
O-C-405-12-18-69-WP-R-FS
1-4 City of Santa Rosa Freeway Well Feasibility Study Report
September 2021
3.3.3.1.2.1 Manganese Oxide-Coated Media
There are a number of proprietary manganese oxide-coated media on market. The different proprietary media have different removal efficiencies, loading rates, and backwashing requirements (AWWA, 2015). Along with design considerations, the availability and cost should be considered when selecting the media.
3.3.3.1.2.2 Continuous or Intermittent Regeneration
Operational options for manganese removal with manganese oxide-coated media filter include continuous regeneration (CR) and intermittent regeneration (IR).
In the CR process, an oxidant or combination of oxidants is applied continuously to the raw water ahead of the filter. The manganese will precipitate to manganese oxide and be removed by the media. If the oxidant is underfed, the oxidizing capacity of the media will complete the oxidation of the manganese. If the oxidant is underfed for an extended period, the oxidative capacity of the media will be exhausted, and manganese could pass into the treated water. Therefore, it is important for the media to be regenerated at all times. As long as adequate oxidant is applied, the media will remain continually regenerated. The media will require periodic backwash to remove the precipitates.
In the IR process, the raw water is applied to the filter and oxidation of the manganese occurs directly on the media using the oxidative capacity of the media. After treating a certain volume of water (with a certain concentration of manganese), the oxidative capacity of the media will be consumed, and media will require regeneration. Before regeneration, the media should be backwashed to remove the precipitates. Then a dilute oxidant solution should be applied downflow to the media bed. The filter will require rinsing until the excess oxidant is gone. The excess oxidant can be recycled and used for the next regeneration.
The CR process is used when iron removal is also needed and is predominant. The IR process is normally used when manganese removal is required with lesser quantities of iron present in the raw water. Based on the most recent Freeway Well water quality data (from November 2020), the iron concentration is below the iron MCL and iron removal is not required. Therefore, the IR process is recommended. A dilute potassium permanganate solution can be used to regenerate the filter media.
3.3.3.1.2.3 Backwashing
The filter will require periodic backwashing to remove the manganese precipitate that accumulates in the filter over time. The filter should be backwashed before media regeneration (after the filter has treated a certain volume of water) or when the differential pressure across the filter exceeds a setpoint level. The backwash will include a surface wash step using raw water, and a surface wash pump will be needed to boost the pressure of the raw water for delivery through the filter surface wash system.
It is assumed that the filter will be a multi-cell filter, and that one cell will be backwashed at a time with the filtered water produced from the other cells in the filter. A backwash tank is often needed to store the spent washwater for metered discharge into the sewer; however, with the facility’s proximity to a major sewer trunk line, it is assumed that the spent backwash water can be discharged directly into the sewer and no backwash storage tank is needed.
Chapter 3 Remedial Action Alternatives
O-C-405-12-18-69-WP-R-FS
1-5 City of Santa Rosa Freeway Well Feasibility Study Report
September 2021
3.3.3.1.3 Conceptual Design
The manganese treatment system would include the following equipment and facilities:
• Pressure filter with manganese greensand
• Surface wash pump
• Potassium permanganate batching and feed system
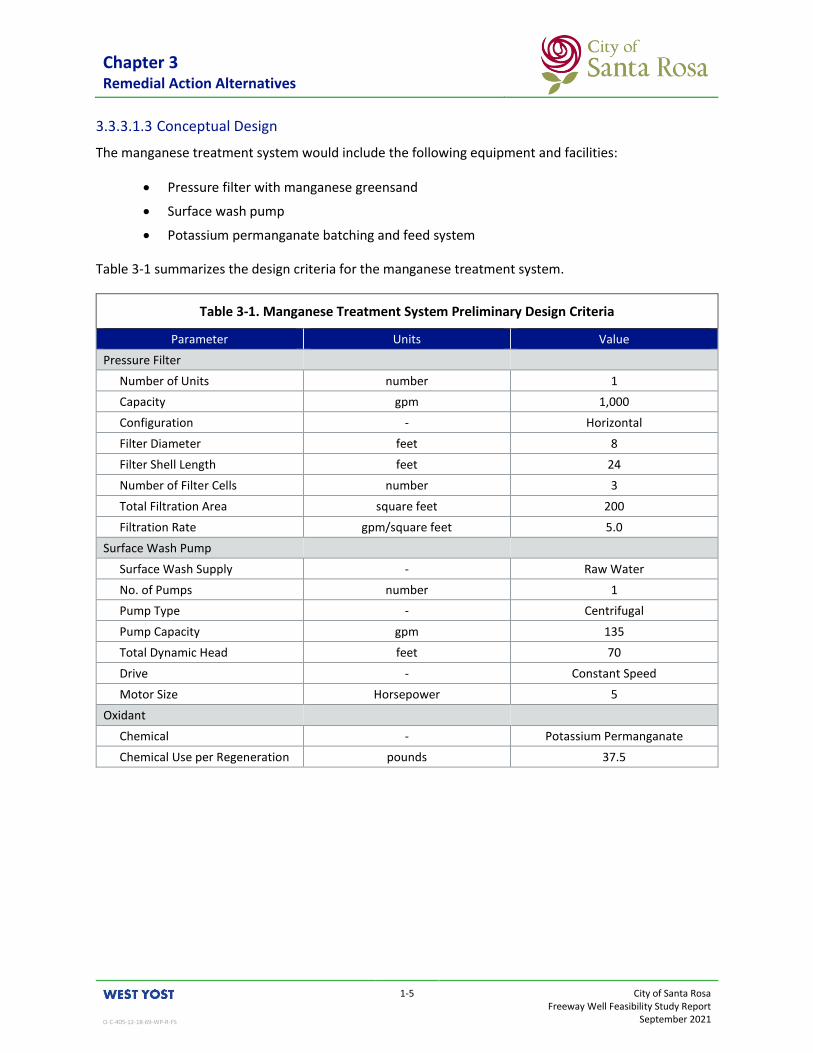
Table 3-1 summarizes the design criteria for the manganese treatment system.
Table 3-1. Manganese Treatment System Preliminary Design Criteria
Parameter Units Value
Pressure Filter
Number of Units number 1
Capacity gpm 1,000
Configuration - Horizontal
Filter Diameter feet 8
Filter Shell Length feet 24
Number of Filter Cells number 3
Total Filtration Area square feet 200
Filtration Rate gpm/square feet 5.0
Surface Wash Pump
Surface Wash Supply - Raw Water
No. of Pumps number 1
Pump Type - Centrifugal
Pump Capacity gpm 135
Total Dynamic Head feet 70
Drive - Constant Speed
Motor Size Horsepower 5
Oxidant
Chemical - Potassium Permanganate
Chemical Use per Regeneration pounds 37.5
Chapter 3 Remedial Action Alternatives
O-C-405-12-18-69-WP-R-FS
1-6 City of Santa Rosa Freeway Well Feasibility Study Report
September 2021
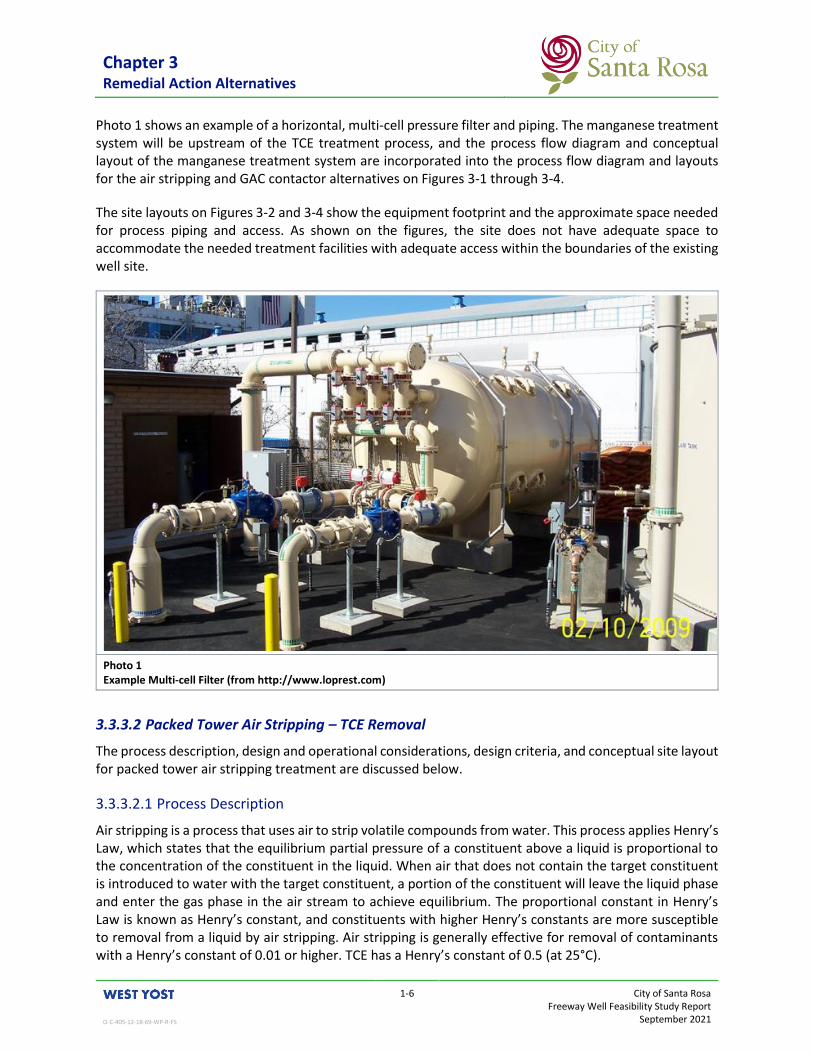
Photo 1 shows an example of a horizontal, multi-cell pressure filter and piping. The manganese treatment system will be upstream of the TCE treatment process, and the process flow diagram and conceptual layout of the manganese treatment system are incorporated into the process flow diagram and layouts for the air stripping and GAC contactor alternatives on Figures 3-1 through 3-4.
The site layouts on Figures 3-2 and 3-4 show the equipment footprint and the approximate space needed for process piping and access. As shown on the figures, the site does not have adequate space to accommodate the needed treatment facilities with adequate access within the boundaries of the existing well site.
Photo 1 Example Multi-cell Filter (from http://www.loprest.com)
3.3.3.2 Packed Tower Air Stripping – TCE Removal
The process description, design and operational considerations, design criteria, and conceptual site layout for packed tower air stripping treatment are discussed below.
3.3.3.2.1 Process Description
Air stripping is a process that uses air to strip volatile compounds from water. This process applies Henry’s Law, which states that the equilibrium partial pressure of a constituent above a liquid is proportional to the concentration of the constituent in the liquid. When air that does not contain the target constituent is introduced to water with the target constituent, a portion of the constituent will leave the liquid phase and enter the gas phase in the air stream to achieve equilibrium. The proportional constant in Henry’s Law is known as Henry’s constant, and constituents with higher Henry’s constants are more susceptible to removal from a liquid by air stripping. Air stripping is generally effective for removal of contaminants with a Henry’s constant of 0.01 or higher. TCE has a Henry’s constant of 0.5 (at 25°C).
Chapter 3 Remedial Action Alternatives
O-C-405-12-18-69-WP-R-FS
1-7 City of Santa Rosa Freeway Well Feasibility Study Report
September 2021
There are a wide variety of gas transfer systems used in water treatment. One of the more efficient methods for removal of volatile contaminants from water is packed tower air stripping. Packed tower air stripping involves pumping the contaminated water to the top of a tower containing packed material. The water is evenly distributed over the packed material and flows down through the material. Air is blown up through the tower, contacting the water and stripping the volatile contaminant from the water. The packing material is designed to provide increased surface area for mass transfer to occur. The treated water collects in a sump at the bottom of the tower. The air with the stripped contaminant exits into the atmosphere through the top of the tower.
3.3.3.2.2 Design and Operational Considerations
Design and operational considerations include liquid loading rate, air-to-water ratio, packing material type and depth, water temperature, discharge air quality, pump replacement and addition, and packing media cleaning and replacement, as discussed below.
3.3.3.2.2.1 Liquid Loading Rate
The liquid loading rate is the flow rate over a unit area of the packing bed. For a fixed operating flow rate, the liquid loading rate is set by varying the diameter of the packed tower. The liquid loading rate affects the removal efficiency. For a given compound, applying a lower liquid loading rate increases the removal efficiency of that compound, but it requires reducing the tower capacity or increasing the tower diameter. The selection of the liquid loading rate should consider the volatility of the compound. For more volatile compounds, higher liquid loading rates can be used. For TCE, which is relatively volatile, loading rates of 20 to 30 gpm per square foot (gpm/sf) have been used to achieve greater than 90 percent removal.
3.3.3.2.2.2 Air-to-Water Ratio
The air-to-water ratio affects the removal efficiency of the packed tower system. Increasing the ratio of air to water increases the removal efficiency of the system, but it also increases the size of the blower needed for a given tower capacity, as well as the operating cost to run the blower. As with the liquid loading rate, the volatility of the compound should be considered when setting the air-to-water ratio. Less volatile compounds are more difficult to strip and require high air-to-water ratios to achieve high removal efficiencies. For TCE, air-to-water ratios ranging between 20 to 1 and 30 to 1 have been used to achieve greater than 90 percent removal.
3.3.3.2.2.3 Packing Material Type and Depth
Packing material is available in different shapes, sizes, and materials of construction. The size and shape of the packing material affect the packing factor, and thereby the headloss across the system, as well as the overall rate of mass transfer. Larger packing has a lower packing factor and lower rate of mass transfer per unit volume; but it costs less on a unit volume basis and results in lower headloss, which allows for higher application rates and smaller tower diameter for a given flow rate. Conversely, smaller packing has a higher packing factor and higher mass transfer rate, thereby requiring shorter depths of packing to achieve a target removal efficiency at a given flow rate. The required removal efficiency will impact the packing size and shape selection. The ratio of the tower diameter to the packing size must also be considered to avoid poor water distribution from wall effects.
The cost, weight, and durability of the material under operating conditions will influence the selection of the material of construction. For most water treatment applications, plastic packing is desirable due to its low cost, lightness, and durability.

Chapter 3 Remedial Action Alternatives
O-C-405-12-18-69-WP-R-FS
1-8 City of Santa Rosa Freeway Well Feasibility Study Report
September 2021
The depth of the packing material affects the removal efficiency of the system. Increasing the packing depth increases the contact time between the water and air, and therefore, increases the removal efficiency. Increasing the packing depth also increases the height of the packed tower and the capital cost of the system. As noted above, the packing material size and shape will also impact the packing depth. For TCE removal, packing depths between 15 and 25 feet have been used to achieve greater than 90 percent removal.
3.3.3.2.2.4 Water Temperature
Although water temperature will not be a controlled parameter, the water temperature impacts the efficiency of the packed tower air stripping system and should be considered in the design of the system. Temperature affects the volatility of a compound; compounds are less volatile and more difficult to remove by air stripping at lower temperatures. The system should be designed for the coldest water temperature under normal conditions.
3.3.3.2.2.5 Air Discharge
The contaminant removed by the air stripping process will be present in the air discharged from the system and will enter the atmosphere. The VOC concentrations in the groundwater are relatively low, and it is expected that treatment of the discharged air will not be needed. If the air stripping alternative proceeds into design, the concentrations of the organic compounds in the air exiting the tower should be estimated and compared with the Bay Area Air Quality Management District’s (BAAQMD) air emission limits to confirm that air treatment is not needed.
3.3.3.2.2.6 Pump Replacement and Addition
The air stripping process operates at atmospheric pressure. The water is pumped to the top of the tower, gravity flows down through the packing material, and is collected in the sump at the base of the tower. The packed tower air stripping system will require replacement of the Freeway Well pump with a pump that is sized for the lower head to pump to the top of the air stripping tower. A second set of pumps would be needed to deliver the treated water from the sump into the water distribution system.
3.3.3.2.2.7 Packing Media Cleaning and Replacement
The packing material will require periodic chemical cleaning to remove fouling. The cleaning frequency will depend on the water quality. High hardness, iron, and manganese will expedite fouling. The blower discharge pressure is monitored for indication of packing fouling. When fouling is identified, it can be cleaned in place by isolating the tower and recirculating an acid solution in a closed loop for several hours. The spent cleaning solution will require neutralization, typically with caustic soda, prior to disposal. If packing material is not regularly cleaned, it may become too fouled to clean and would require replacement. If the packing material is properly maintained, it should last at least 10 to 15 years.
3.3.3.2.3 Conceptual Design
A packed tower air stripping system to treat the groundwater from the Freeway Well would include the following equipment and facilities:
• Packed aeration tower
• Blower
• Treated water pumps
Chapter 3 Remedial Action Alternatives
O-C-405-12-18-69-WP-R-FS
1-9 City of Santa Rosa Freeway Well Feasibility Study Report
September 2021
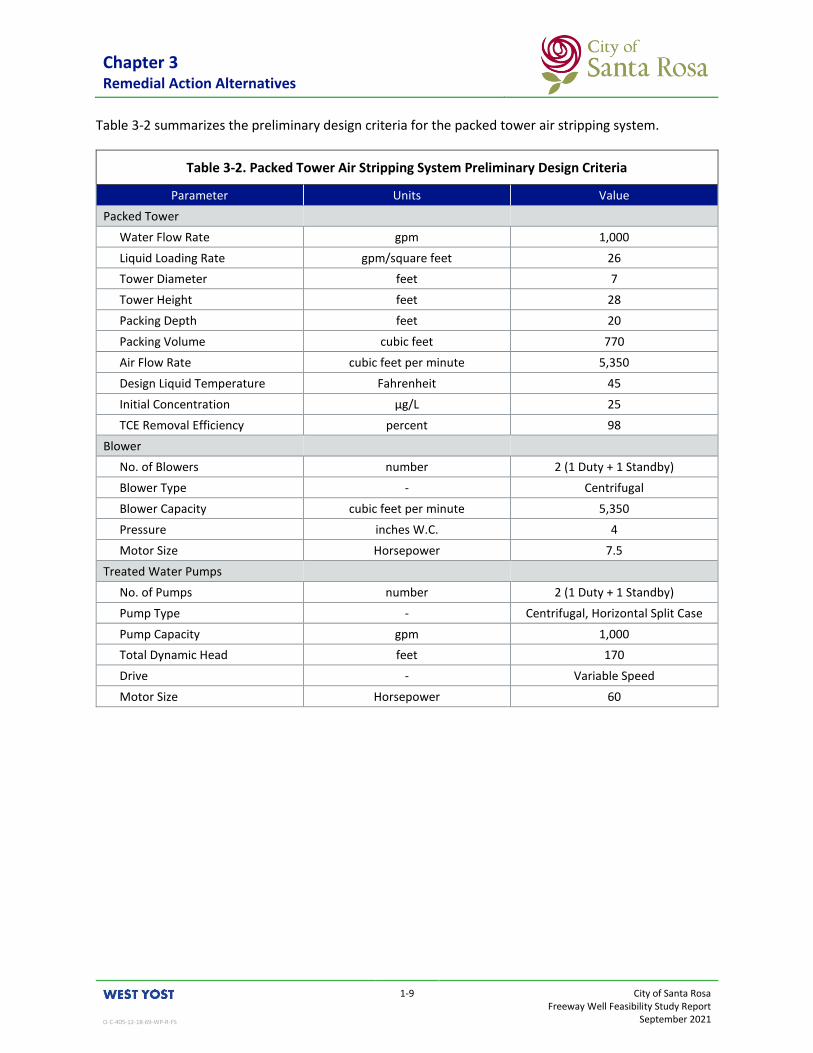
Table 3-2 summarizes the preliminary design criteria for the packed tower air stripping system.
Table 3-2. Packed Tower Air Stripping System Preliminary Design Criteria
Parameter Units Value
Packed Tower
Water Flow Rate gpm 1,000
Liquid Loading Rate gpm/square feet 26
Tower Diameter feet 7
Tower Height feet 28
Packing Depth feet 20
Packing Volume cubic feet 770
Air Flow Rate cubic feet per minute 5,350
Design Liquid Temperature Fahrenheit 45
Initial Concentration μg/L 25
TCE Removal Efficiency percent 98
Blower
No. of Blowers number 2 (1 Duty + 1 Standby)
Blower Type - Centrifugal
Blower Capacity cubic feet per minute 5,350
Pressure inches W.C. 4
Motor Size Horsepower 7.5
Treated Water Pumps
No. of Pumps number 2 (1 Duty + 1 Standby)
Pump Type - Centrifugal, Horizontal Split Case
Pump Capacity gpm 1,000
Total Dynamic Head feet 170
Drive - Variable Speed
Motor Size Horsepower 60

Chapter 3 Remedial Action Alternatives
O-C-405-12-18-69-WP-R-FS
1-10 City of Santa Rosa Freeway Well Feasibility Study Report
September 2021
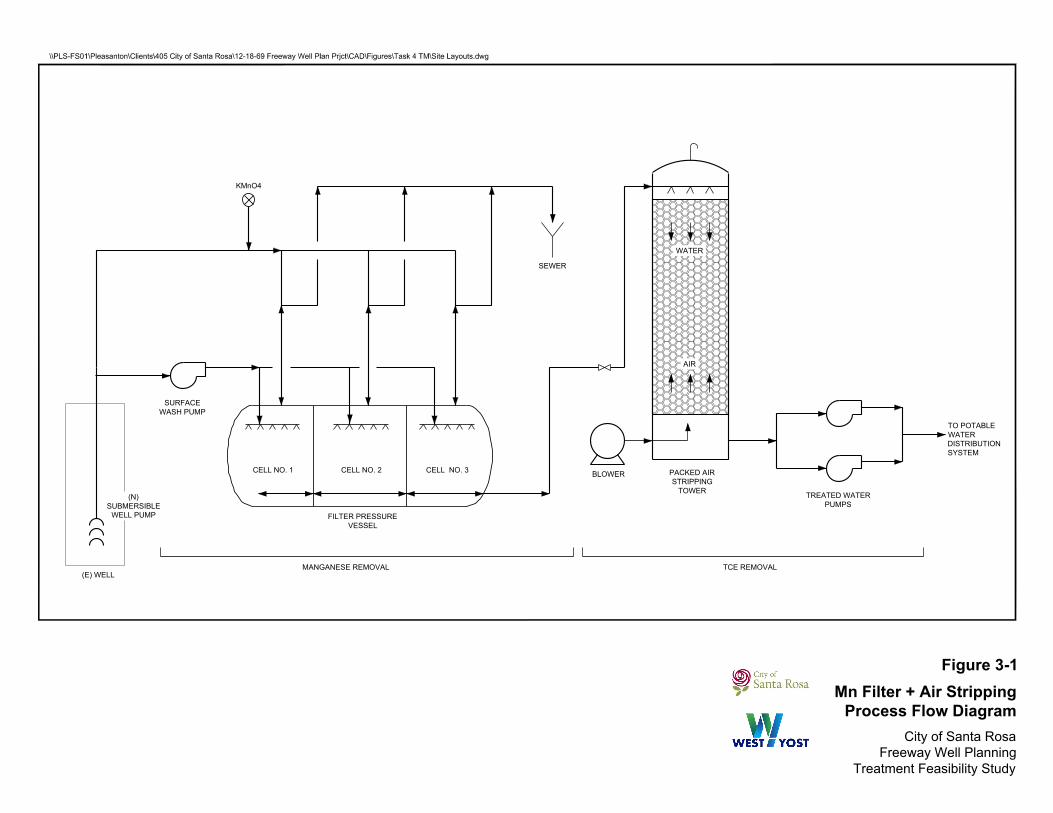
Photo 2 shows an example of a packed tower aeration treatment facility. Figure 3-1 and Figure 3-2 show a process flow diagram and a conceptual site layout of a packed tower aeration treatment facility, respectively. The site layout shows the equipment footprint and the approximate space needed for process piping and access. As noted above and shown on the figure, the existing Freeway Well parcel does not have adequate space to accommodate the needed treatment facilities.
Photo 2 Example Packed Tower Aeration Treatment Facility (from https://www.h2ktech.com)
3.3.3.3 Granular Activated Carbon – TCE Removal
The process description, design and operational considerations, design criteria, and conceptual site layout for granular activated carbon contactor treatment are discussed below.
3.3.3.3.1 Process Description
Adsorption is the mass transport of substances (adsorbate) in a fluid onto the surface of a solid (adsorbent) that the fluid comes in contact with. The adsorbate becomes bound to the surface of the adsorbent, primarily through physical forces.
A commonly used adsorbent in water treatment is activated carbon, which is carbon material heated at high temperatures to increase its surface area for adsorption. Carbonaceous material typically used to manufacture activated carbon include coal, coconut husk, wood, and peat. The type of raw material and the activation temperature influence the surface area, average pore size, abrasion resistance, and other physical properties of the activated carbon product.
(E) WELL
(N)
SUBMERSIBLE
WELL PUMP
PACKED AIR
STRIPPING
TOWER
BLOWER
TO POTABLE
WATER
DISTRIBUTION
SYSTEM
TREATED WATER
PUMPS
WATER
AIR
FILTER PRESSURE
VESSEL
SURFACE
WASH PUMP
SEWER
KMnO4
MANGANESE REMOVAL TCE REMOVAL
CELL NO. 1 CELL NO. 2 CELL NO. 3
\\PLS-FS01\Pleasanton\Clients\405 City of Santa Rosa\12-18-69 Freeway Well Plan Prjct\CAD\Figures\Task 4 TM\Site Layouts.dwg
City of Santa Rosa
Freeway Well Planning
Treatment Feasibility Study
Mn Filter + Air Stripping
Process Flow Diagram
Figure 3-1

\\P
LS
-F
S0
1\P
le
asa
nto
n\C
lie
nts\4
05
C
ity o
f S
an
ta
R
osa
\1
2-1
8-6
9 F
re
ew
ay W
ell P
la
n P
rjct\C
AD
\F
ig
ure
s\T
ask 4
T
M\S
ite
L
ayo
uts_
V2.dw
g
City of Santa Rosa
Freeway Well Planning
Treatment Feasibility Study
Mn Filter + Air Stripping
Site Layout
Figure 3-2
Notes:
1. Estimated envelope of space needed for new
treatment facilities that includes a driveway and
assumed 10-foot setback for access and
maintenance. The proposed treatment facilities
cannot feasibly fit within the existing Freeway
Well parcel.
N
(E) PUMP BUILDING
MANGANESE
FILTER
CHEMICAL
BUILDING
AIR STRIPPING
TOWER AND
EQUIPMENT
(E) FREEWAY
WELL PARCEL
SEE
NOTE 1

Chapter 3 Remedial Action Alternatives
O-C-405-12-18-69-WP-R-FS
1-13 City of Santa Rosa Freeway Well Feasibility Study Report
September 2021
Activated carbon is available in granular form (granular activated carbon, GAC) or powdered form (powdered activated carbon, PAC). The granular form is typically used where long-term, continuous treatment is needed. The contaminant is removed by passing the source water through a bed of GAC. The powdered form is commonly used when the need for treatment is intermittent (e.g., seasonal). The PAC is added to the source water and subsequently removed by sedimentation and/or filtration. GAC would be most suitable for providing continuous treatment for TCE reduction at the Freeway Well.
3.3.3.3.2 Design and Operational Considerations
Design and operational considerations for GAC contactor design includes contactor vessel and well pump replacement, GAC media, empty bed contact time, hydraulic loading rate, contactor configuration and carbon change-out, as discussed below.
3.3.3.3.2.1 Contactor Vessel and Well Pump Replacement
The GAC contactor can be configured in pressure vessel or a gravity-flow, open bed. Pressure vessels are recommended for this application to avoid breaking head and requiring re-pumping of the groundwater. Pressure vessels would allow pumping the groundwater through the treatment system, directly into the water distribution system. However, installation of GAC contactors will introduce additional headloss and require replacement of the Freeway Well pump. The replacement pump would be sized to overcome the additional headloss from the GAC contactors to pump the water into the distribution system.
3.3.3.3.2.2 GAC Media
GAC media produced from different raw materials at different activation temperatures will have different properties. Parameters used to characterize GAC include iodine number (indication of pore volume available), molasses number (indication of degree of adsorption of larger molecules), hardness/abrasion number (indication of resistance to wear), ash content (reduces efficiency and overall activity of the activated carbon), and apparent density (indication of the quality of the activated carbon). Other size-related parameters include particle size distribution and mesh size, which affects hydraulic performance and kinetics. Finer mesh sizes may result in higher pressure, but the higher rates of reaction promoted by the finer mesh sizes may enable use of a shallower bed. When selecting and specifying the GAC media for optimal TCE removal and GAC performance, the GAC properties and size parameters will need to be considered.
3.3.3.3.2.3 Empty Bed Contact Time (EBCT)
A certain amount of contact time between the GAC media and source water is needed for the adsorption of the TCE contaminant onto the GAC media. The contact time provided is determined by dividing the GAC bed volume by the flow rate through the volume; this parameter is referred to as the empty bed contact time (EBCT), as it does not account for the space occupied by the carbon media. The optimal EBCT for TCE removal is impacted by the initial TCE concentration in the source water, the adsorption potential of the media, and the presence of competing contaminants in the source water. One study reported an optimal EBCT for TCE removal of 9 minutes from a source water with an initial concentration of 25 μg/L (Ahmed & Hand, 2015). An EBCT of 10 minutes was assumed for sizing the facility and estimating costs.

Chapter 3 Remedial Action Alternatives
O-C-405-12-18-69-WP-R-FS
1-14 City of Santa Rosa Freeway Well Feasibility Study Report
September 2021
3.3.3.3.2.4 Hydraulic Loading Rate
The hydraulic loading rate is determined by dividing the filter bed area by the flow rate through the filter. Low hydraulic loading rates can cause channeling. High hydraulic loading rates can result in abrasion of the GAC media in addition to high headloss across the filter. The contactor should be designed to provide a hydraulic loading rate between 4 and 9 gpm/sf at the normal operating flow rate for proper operation.
3.3.3.3.2.5 Contactor Configuration and Carbon Change-Out
To maximize carbon use, the GAC system should be configured with at least two contactors operated in series. The source water would flow into the first or “lead” contactor, and the treated water from the lead contactor would flow into the second or “lag” contactor. The media in the lead contactor would have three zones: exhausted GAC in the top layer; a mass transfer zone in the middle layer; and unspent GAC in the bottom layer. The media in the lag contactor would be unspent. The mass transfer zone in the lead contactor will continue to migrate down the media bed as the volume of exhausted GAC increases until all the GAC media in the lead contactor is expended (as determined by TCE breakthrough). This configuration allows full saturation of the carbon in the lead contactor prior to carbon replacement.
Treatment of water could continue through the lag contactor, while the lead contactor is taken offline for carbon change-out. The lag contactor can then be operated as the lead contactor when the vessel with the fresh carbon is brought back online for operation as the lag contactor. This would require manifold piping and valving to allow switching lead/lag contactor configuration. Sample ports should be provided at the inlet and outlet of each vessel and along the side of each vessel at intermediate bed depths to allow tracking the migration of the mass transfer zone for scheduling carbon replacement.
3.3.3.3.2.6 Backwashing
After new carbon is loaded into a vessel, the carbon should be soaked (for 24 hours) to wet the carbon and then backwashed (for about 60 minutes) prior to placing the contactor in service. Backwash rates will depend on the carbon type but are typically between 5 and 10 gpm/sf.
Maintenance backwashes are typically not needed, but a maintenance wash should be performed if the differential pressure across the contactor increases to more than 50 percent of its clean bed headloss (e.g., from solids accumulation on the carbon bed). Backwashing re-stratifies the carbon media and should be minimized after the initial wash to avoid disrupting the mass transfer zone and reducing the carbon life.
It is assumed that the water for the initial backwash and any maintenance backwash can be supplied from the water distribution system and a washwater supply tank is not needed. A washwater pump station is assumed to be needed to boost the pressure of the washwater supply for backwash. Since the booster pump is needed only periodically for occasional backwashes, it is assumed that only one booster pump will be installed with no inline redundancy. A backwash tank is often needed to store the spent washwater for metered discharge into the sewer; however, with the facility’s proximity to a major sewer trunk line, it is assumed a backwash tank would not be required for this facility.
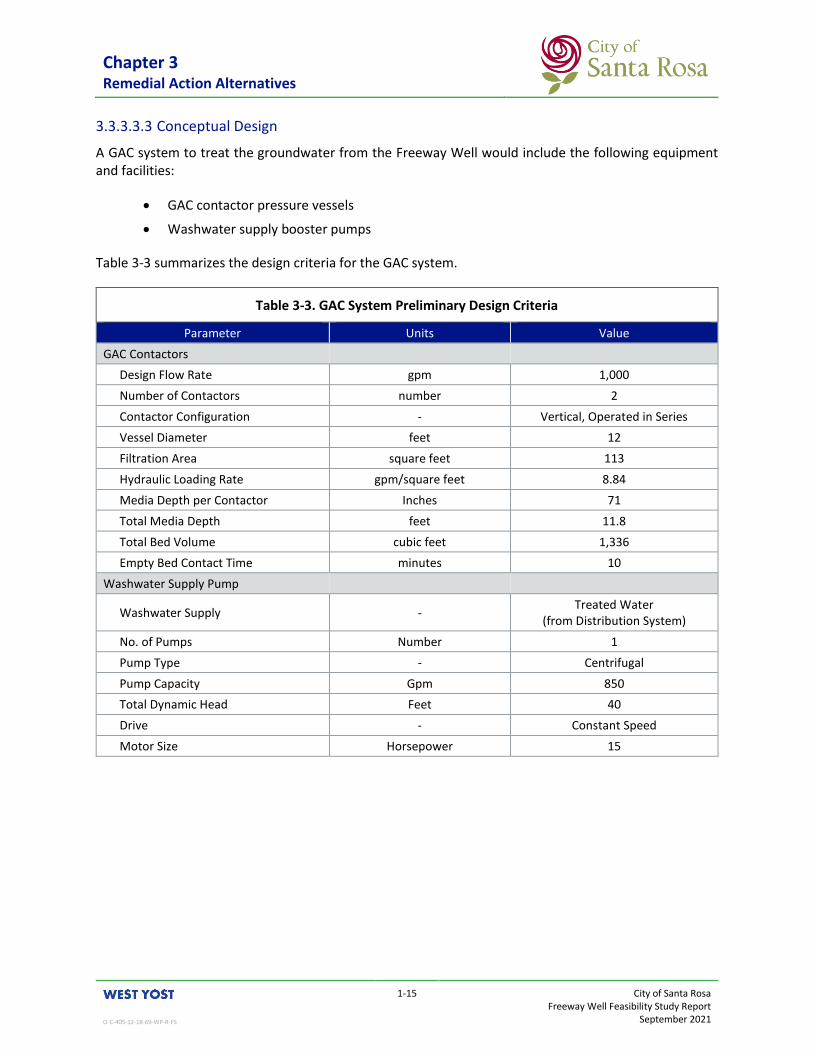
Chapter 3 Remedial Action Alternatives
O-C-405-12-18-69-WP-R-FS
1-15 City of Santa Rosa Freeway Well Feasibility Study Report
September 2021
3.3.3.3.3 Conceptual Design
A GAC system to treat the groundwater from the Freeway Well would include the following equipment and facilities:
• GAC contactor pressure vessels
• Washwater supply booster pumps
Table 3-3 summarizes the design criteria for the GAC system.
Table 3-3. GAC System Preliminary Design Criteria
Parameter Units Value
GAC Contactors
Design Flow Rate gpm 1,000
Number of Contactors number 2
Contactor Configuration - Vertical, Operated in Series
Vessel Diameter feet 12
Filtration Area square feet 113
Hydraulic Loading Rate gpm/square feet 8.84
Media Depth per Contactor Inches 71
Total Media Depth feet 11.8
Total Bed Volume cubic feet 1,336
Empty Bed Contact Time minutes 10
Washwater Supply Pump
Washwater Supply - Treated Water
(from Distribution System)
No. of Pumps Number 1
Pump Type - Centrifugal
Pump Capacity Gpm 850
Total Dynamic Head Feet 40
Drive - Constant Speed
Motor Size Horsepower 15
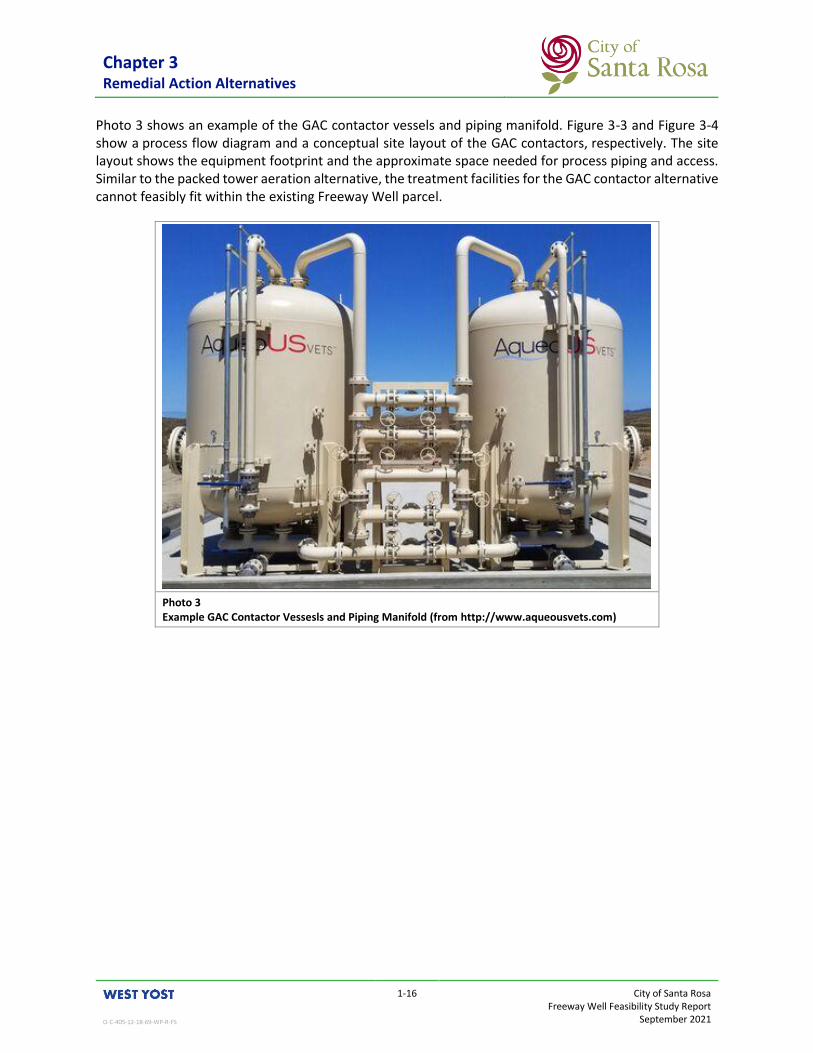
Chapter 3 Remedial Action Alternatives
O-C-405-12-18-69-WP-R-FS
1-16 City of Santa Rosa Freeway Well Feasibility Study Report
September 2021
Photo 3 shows an example of the GAC contactor vessels and piping manifold. Figure 3-3 and Figure 3-4 show a process flow diagram and a conceptual site layout of the GAC contactors, respectively. The site layout shows the equipment footprint and the approximate space needed for process piping and access. Similar to the packed tower aeration alternative, the treatment facilities for the GAC contactor alternative cannot feasibly fit within the existing Freeway Well parcel.
Photo 3 Example GAC Contactor Vessesls and Piping Manifold (from http://www.aqueousvets.com)

(E) WELL
CELL NO. 1 CELL NO. 2 CELL NO. 3
FILTER PRESSURE
VESSEL
SURFACE
WASH PUMP
SEWER
KMnO4
MANGANESE REMOVAL
GAC NO. 1
BACKWASH WATER
SUPPLY FROM WATER
DISTRIBUTION SYSTEM
WASHWATER SUPPLY
BOOSTER PUMP
TO POTABLE WATER
DISTRIBUTION SYSTEM
GAC NO. 2
TCE REMOVAL
(N)
SUBMERSIBLE
WELL PUMP
\\PLS-FS01\Pleasanton\Clients\405 City of Santa Rosa\12-18-69 Freeway Well Plan Prjct\CAD\Figures\Task 4 TM\Site Layouts.dwg
City of Santa Rosa
Freeway Well Planning
Treatment Feasibility Study
Mn Filter + GAC
Process Flow Diagram
Figure 3-3
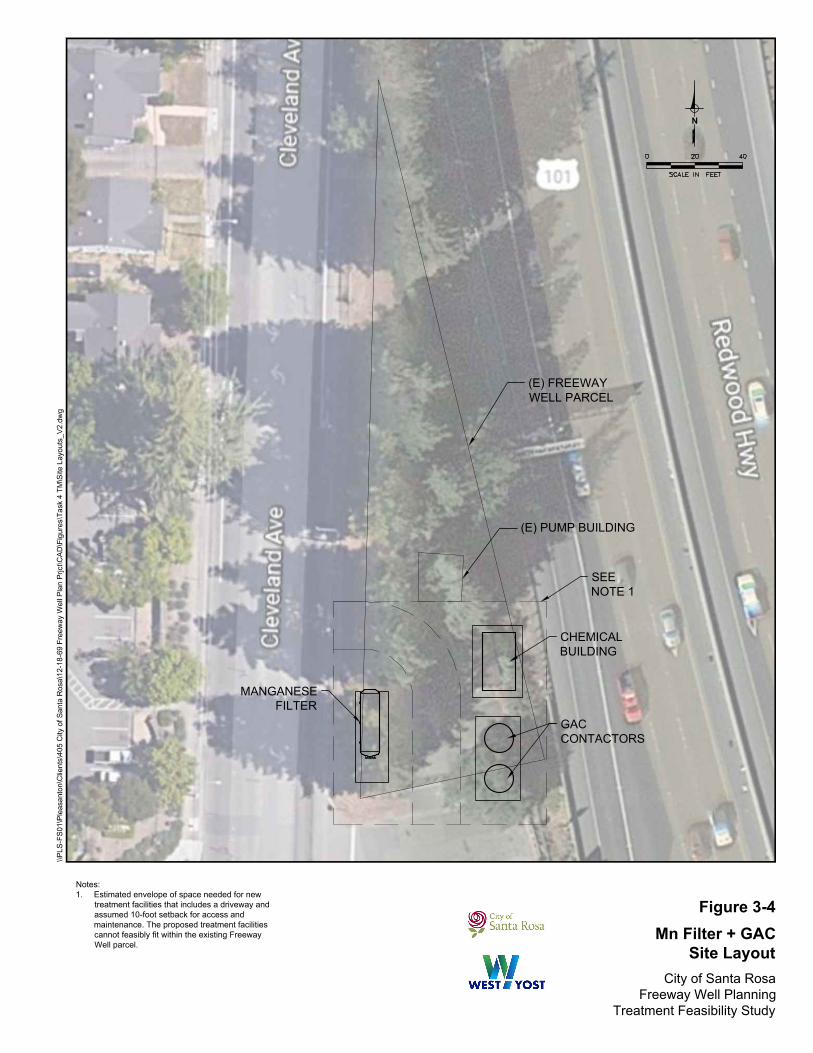
\\P
LS
-F
S0
1\P
le
asa
nto
n\C
lie
nts\4
05
C
ity o
f S
an
ta
R
osa
\1
2-1
8-6
9 F
re
ew
ay W
ell P
la
n P
rjct\C
AD
\F
ig
ure
s\T
ask 4
T
M\S
ite
L
ayo
uts_
V2.dw
g
City of Santa Rosa
Freeway Well Planning
Treatment Feasibility Study
Mn Filter + GAC
Site Layout
Figure 3-4
N
(E) PUMP BUILDING
CHEMICAL
BUILDING
(E) FREEWAY
WELL PARCEL
MANGANESE
FILTER
GAC
CONTACTORS
Notes:
1. Estimated envelope of space needed for new
treatment facilities that includes a driveway and
assumed 10-foot setback for access and
maintenance. The proposed treatment facilities
cannot feasibly fit within the existing Freeway
Well parcel.
SEE
NOTE 1
Chapter 3 Remedial Action Alternatives
O-C-405-12-18-69-WP-R-FS
1-19 City of Santa Rosa Freeway Well Feasibility Study Report
September 2021
3.3.4 Operation as Emergency Well
With the addition of the treatment facilities, it would not be practical to operate the Freeway Well as an emergency well for potable water supply due to the time needed to bring the well facilities online. After a long shut down period, the treatment facilities would have to be disinfected before they can be brought into service for potable water production.
For the manganese filters, disinfection involves soaking the filter in highly chlorinated water for at least 12 hours, and then running the filter to waste or backwashing process to thoroughly remove the highly chlorinated water. The packed tower for air stripping would undergo a similar process; but rather than soaking, the highly chlorinated water would be recirculated through the packing media in the tower. Chlorine solution cannot be used for disinfection of the GAC filters as it will damage or “use up” the GAC media. Disinfection of the GAC would have to be performed with a high pH solution that is recirculated through the media in the vessels, and then neutralized for disposal.
After completion of the disinfection procedure, bacteriological samples must be collected from the facilities and tested for the presence of total coliform bacteria. The test method requires 22 to 24 hours of incubation. The facilities can be placed in service only if none of the samples show the presence of total coliform bacteria.
The disinfection process could take one to two days. The verification process would require at least another day. The emergency situation could be over in the two to three days that would be needed to prepare the well facilities for service. Therefore, operation of the Freeway Well, if reinstated, would have to be as a production well and not an emergency well.
3.4 ESTIMATED PROJECT COST
To prepare a cost-benefit analysis, life cycle costs were first developed using estimated project cost and annual operation and maintenance costs.
3.4.1 Conceptual Opinion of Probable Project Cost
The Association for the Advancement of Cost Engineering (AACE) International publishes guidelines for classes of cost estimates and their expected accuracy ranges. Based on these guidelines, the preliminary opinion of probable project cost (OPPC) summarized below is a Class 5 Estimate. Class 5 estimates are based on limited information and are generally prepared for strategic planning purposes, assessment of initial viability, evaluation of alternate schemes, and project screening. Typical accuracy ranges for Class 5 estimates are (-)20 to (-)50 percent on the low side and (+)30 to (+)50 percent on the high side.
West Yost estimates the cost to properly abandon a well to be approximately $100,000. This estimate includes well abandonment/demolition, inspection of work, and brief report of the work completed. The estimate does not include project costs, such as administration, engineering, procurement, and management. The total cost of well abandonment could be two to three times higher when project costs are added. Additionally, this cost does not include demolition of other existing facilities at the Freeway Well site, such as the existing buildings.

Chapter 3 Remedial Action Alternatives
O-C-405-12-18-69-WP-R-FS
1-20 City of Santa Rosa Freeway Well Feasibility Study Report
September 2021
The OPPCs for the treatment alternatives were developed using budgetary quotes from vendors and cost data from similar projects. The cost estimate summarized in Table 3-4 below applies the following contingencies and markups:
• 9.25 percent sales taxes on materials (applicable in Santa Rosa, California)
• 30 percent indirect project cost (general conditions, contractor overhead and profit, bonds, insurance, mobilization and demobilization)
• 40 percent for conceptual-level estimating contingency
• 10 percent for construction contingency
• 30 percent for project costs (planning, permitting, design, construction management, engineering services during construction, and administrative and legal costs)
Table 3-4. Capital and Project Costs
Element Mn Filter + Air Stripping Tower Mn Filter + GAC Contactor
Site Work and Yard Piping 87,500 112,300
Treatment System 1,124,600 1,249,600
Electrical and Instrumentation 316,000 356,000
Subtotal Project Costs 1,528,100 1,717,900
Taxes on Materials (9.25%) 64,400 73,700
Subtotal 1,592,500 1,791,600
GC, OH&P, Mob/Demob (30%) 477,800 537,500
Subtotal 2,070,300 2,329,100
Estimating Contingency (40%) 828,200 931,700
Subtotal 2,898,500 3,260,800
Construction Contingency (10%) 289,900 326,100
Total Construction Cost 3,188,400 3,586,900
Project Costs (30%) 956,600 1,076,100
Total Project Cost 4,145,000 4,663,000
It should be noted that these costs only include construction of the treatment facilities. They do not include land acquisition and associated work that are needed, as the existing well site cannot support the proposed treatment facilities.
3.4.2 Annual O&M Cost
Estimates of annual O&M costs were developed for the treatment alternatives and are summarized in Table 3-5. The annual O&M costs were developed applying the following assumptions:
• Treatment unit operation 50 percent of the year (during higher water demand periods from Spring to Fall)
• 2 hours a day for routine operations and maintenance of the facility

Chapter 3 Remedial Action Alternatives
O-C-405-12-18-69-WP-R-FS
1-21 City of Santa Rosa Freeway Well Feasibility Study Report
September 2021
• Energy use is based on additional lift/head introduced by treatment system (it does not include energy use for pumping from groundwater well into the distribution system)
• Annual maintenance materials cost estimated at 3 percent of equipment cost
• Manganese greensand regeneration every two days; chemical use of 37.5 lbs of potassium permanganate per regeneration; 4 labor hours per regeneration
• Monthly chemical cleaning of the packed air stripping tower; 8 labor hours per clean
• Air stripping tower packing media replacement once every ten years
• GAC media usage rate of 0.0953 lbs of GAC per 1,000 gallons treated; 8 labor hours per media changeout
The O&M cost estimates apply the following unit cost assumptions:
• $100/hour for labor (including benefits)
• $0.27/kWh energy rate
• $2.68/lb of potassium permanganate
• $25,000 for packing media replacement
• $40,000 for GAC media changeout of one vessel
The labor, chemical use, and chemical disposal costs are estimated to be greater for the air stripping tower alternative due to the additional labor and chemicals needed for monthly chemical cleaning of the packing material. The energy cost is also higher for the air stripping tower alternative, since it introduces greater head and also requires operation of a blower. The media replacement cost is significantly higher for the GAC contactor alternative. The GAC media requires regular replacement when the media adsorptive capacity is exhausted. The GAC media in the lead vessel will be replaced at a time when there is breakthrough from the lead vessel. The media replacement in one GAC vessel is estimated to be needed two to three times a year.
Table 3-5. Annual Operations and Maintenance Costs
Element Mn Filter + Air Stripping Mn Filter + GAC Contactor
Annual Labor 77,600 73,700
Annual Energy Use 31,800 19,600
Annual Chemical Use and Disposal 10,400 9,200
Annual Maintenance Materials 10,600 13,500
Annual Media Replacement 2,500 49,900
Total Annual O&M Cost 132,900 165,900

Chapter 3 Remedial Action Alternatives
O-C-405-12-18-69-WP-R-FS
1-22 City of Santa Rosa Freeway Well Feasibility Study Report
September 2021
3.4.3 Life Cycle Cost
Table 3-6 provides a summary of the life cycle cost of the two treatment alternatives. The life cycle costs are based on a discount rate of 4 percent and a cost period of 20 years.
Table 3-6. Life Cycle Costs
Element Mn Filter + Air Stripping Mn Filter + GAC Contactor
Total Project Cost 4,145,000 4,663,000
Present Value of Total Annual O&M Cost 1,806,200 2,254,700
Total Life Cycle Cost 5,951,200 6,917,700
Based on a discount rate of 4 percent, a cost period of 20 years, and 183 days of operation at 1,000 gpm, the cost per acre-foot (AF) for treatment is $541/AF and $629/AF for the air stripping and GAC contactor alternatives, respectively.
3.4.4 Cost-Benefit Analysis
Groundwater production from a new well at a different site that will not require treatment for contaminant removal would be more cost effective than treating groundwater from the Freeway Well. Based on cost data from a recent well installation project, the cost of installing and equipping a new well (not including land acquisition) could be 25- to 50-percent less than the cost of producing and treating groundwater from the Freeway Well.
Non-cost factors, such as the risk of further contaminating the aquifer, the infeasibility of obtaining decent production yield from a well screened at just the lower levels, and the lack of adequate space on the existing well site for the needed treatment facilities, override the economic factors and make treatment of the Freeway Well infeasible.
3.5 POSSIBLE PROJECT SCHEDULE
Abandonment of the Freeway Well can be accomplished in approximately 12 months after permitting and financing are obtained. This takes into account preparation of bid documents, bid solicitation, bid selection, award negotiation and execution, and project execution.
Both treatment alternatives evaluated above would require approximately the same time to implement. Once financing and permitting are complete, design would be expected to take 9 to 12 months and construction would take approximately 12 months, possibly 18 months considering long lead time items such as the treatment vessels, electrical panels, and control panels. This does not include the time required to solicit bids for design and bids for construction, bid award periods, contract negotiations, and contract execution.
Chapter 3 Remedial Action Alternatives
O-C-405-12-18-69-WP-R-FS
1-23 City of Santa Rosa Freeway Well Feasibility Study Report
September 2021
3.6 REFERENCES Dr. Zeyad Ahmed, PE and Dr. David W. Hand, BCEEM. 2015. The Effect of Volatile Organic Compounds on GAC
Adsorbers. http://www.sawea.org/pdf/2015/Techincal_Program_19/Zeyad_%20Ahmed.pdf
John Civardi, Mark Tompeck. AWWA. 2015. Iron and Manganese Removal Handbook, Second Edition.
United States Environmental Protection Agency (USEPA). 2009. Drinking Water Treatability Database: Trichloroethylene. https://iaspub.epa.gov/tdb/pages/contaminant/contaminantOverview.do
O-C-405-12-18-69-WP-R-FS
1-1 City of Santa Rosa Freeway Well Feasibility Study Report
September 2021
CHAPTER 4 Recommended Alternative
4.1 RECOMMENDED ALTERNATIVE
The following remedial action alternatives to protect and/or reestablish the Freeway Well as a source of potable water supply were evaluated and are discussed in the sections below:
• Abandoning and properly destroying the existing Freeway Well to protect groundwater resources for future use;
• Installing a new well which taps only into the lower water bearing zones; and
• Pumping and treating contaminated groundwater from the Freeway Well to potable water standards.
4.1.1 Discussion of Alternatives
Abandonment of the existing Freeway Well would entail filling the well from bottom to top with a sand cement slurry (described in Chapter 3) and blast perforating the blank casing from 107 to 400 feet below surface. Proper abandonment of the well would eliminate the conduit for transport of contaminant between the aquifer zones and is recommended.
A new well could be constructed on the Freeway Well site and screened to avoid the higher levels of contamination in the existing Freeway Well, but would likely still require wellhead treatment for VOCs and manganese, though a lower VOC concentration would be expected. Furthermore, the new well would only draw from the lower aquifer zones, which had low yield during the 2020 aquifer flow tests. The new well would likely be less productive than the existing well. Therefore, the construction of a new well on the Freeway Well site is not considered to be a viable alternative. It would be more cost effective to construct a new production well at a different site that would not require treatment for contaminant removal.
While the groundwater pumped from the Freeway Well could theoretically be treated to potable water quality, the treatment facilities needed to remove TCE and manganese to meet regulatory levels for drinking water cannot feasibly fit within the existing Freeway Well parcel.
Additionally, the Freeway Well could not be operated as an emergency well due to the time needed for the disinfection and verification processes before the well and treatment facilities can be placed into service.
In order to use Freeway Well as a production well with wellhead treatment, it would first need to undergo an extensive State permitting process to shift from standby status to production status. While permitting is not an insurmountable obstacle, operating the existing Freeway Well could cause further migration of contaminants from the upper zone into the lower zone of the aquifer.
It is the City’s opinion that the more critical concern is protection of the groundwater resource. Therefore, the recommended project is to properly abandon the Freeway Well to prevent further migration of contaminants from upper aquifer zones into lower aquifer zones.
4.1.2 Possible Project Schedule
Following completion of permitting and financing, bid documents for abandonment of the Freeway well can be prepared within two months. The bid and award period is anticipated to require four months, and project execution is anticipated to require one to two months.
Cost Estimates - AST
Appendix A
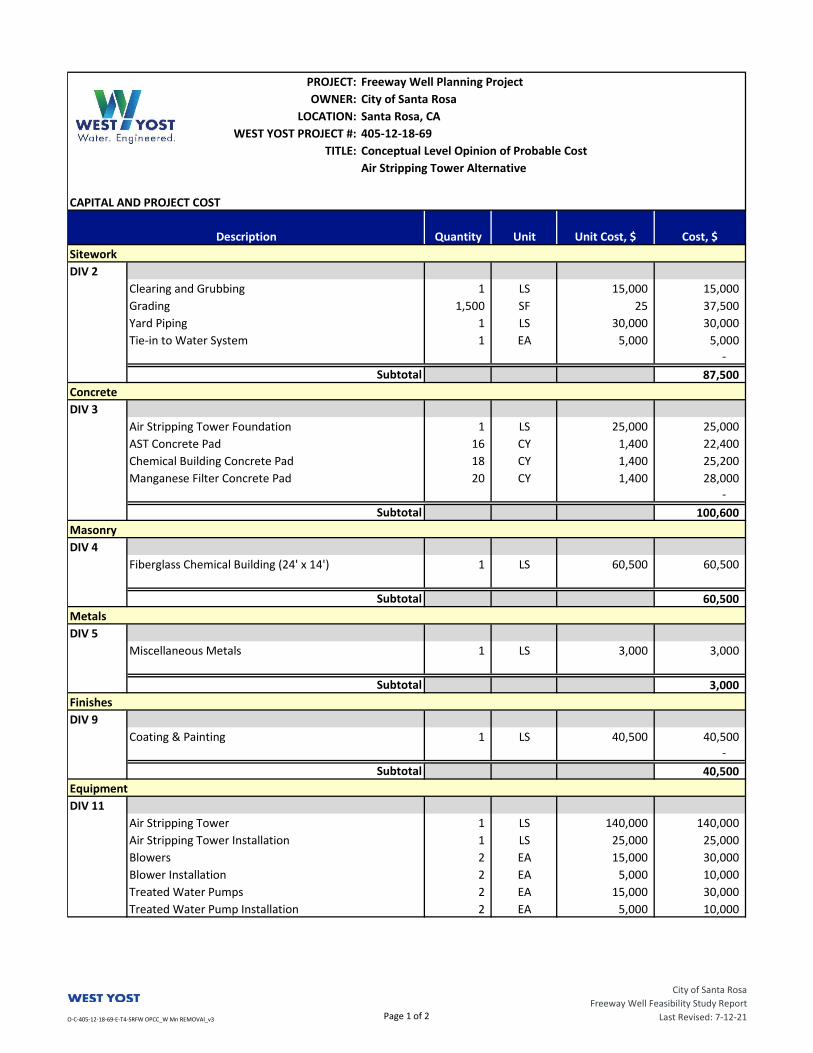
PROJECT: Freeway Well Planning Project
OWNER: City of Santa Rosa
LOCATION: Santa Rosa, CA
WEST YOST PROJECT #: 405-12-18-69
TITLE: Conceptual Level Opinion of Probable Cost
Air Stripping Tower Alternative
CAPITAL AND PROJECT COST
Sitework
DIV 2
Clearing and Grubbing 1 LS 15,000 15,000
Grading 1,500 SF 25 37,500
Yard Piping 1 LS 30,000 30,000
Tie-in to Water System 1 EA 5,000 5,000 -
87,500
Concrete
DIV 3
Air Stripping Tower Foundation 1 LS 25,000 25,000
AST Concrete Pad 16 CY 1,400 22,400
Chemical Building Concrete Pad 18 CY 1,400 25,200
Manganese Filter Concrete Pad 20 CY 1,400 28,000 -
100,600
Masonry
DIV 4
Fiberglass Chemical Building (24' x 14') 1 LS 60,500 60,500
60,500
Metals
DIV 5
Miscellaneous Metals 1 LS 3,000 3,000
3,000
Finishes
DIV 9
Coating & Painting 1 LS 40,500 40,500 -
40,500
Equipment
DIV 11
Air Stripping Tower 1 LS 140,000 140,000
Air Stripping Tower Installation 1 LS 25,000 25,000
Blowers 2 EA 15,000 30,000
Blower Installation 2 EA 5,000 10,000
Treated Water Pumps 2 EA 15,000 30,000
Treated Water Pump Installation 2 EA 5,000 10,000
Description Quantity Unit Unit Cost, $ Cost, $
Subtotal
Subtotal
Subtotal
Subtotal
Subtotal
O-C-405-12-18-69-E-T4-SRFW OPCC_W Mn REMOVAl_v3 Page 1 of 2
City of Santa Rosa
Freeway Well Feasibility Study Report
Last Revised: 7-12-21
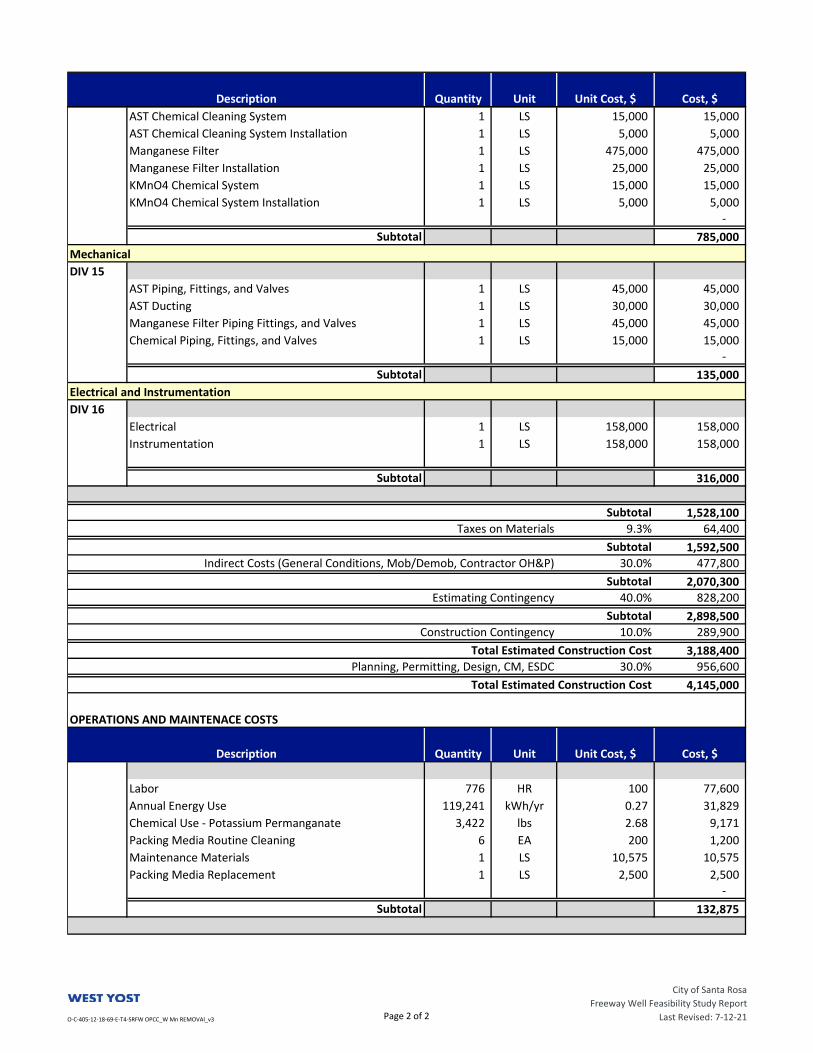
Description Quantity Unit Unit Cost, $ Cost, $
AST Chemical Cleaning System 1 LS 15,000 15,000
AST Chemical Cleaning System Installation 1 LS 5,000 5,000
Manganese Filter 1 LS 475,000 475,000
Manganese Filter Installation 1 LS 25,000 25,000
KMnO4 Chemical System 1 LS 15,000 15,000
KMnO4 Chemical System Installation 1 LS 5,000 5,000 -
785,000
Mechanical
DIV 15
AST Piping, Fittings, and Valves 1 LS 45,000 45,000
AST Ducting 1 LS 30,000 30,000
Manganese Filter Piping Fittings, and Valves 1 LS 45,000 45,000
Chemical Piping, Fittings, and Valves 1 LS 15,000 15,000 -
135,000
Electrical and Instrumentation
DIV 16
Electrical 1 LS 158,000 158,000
Instrumentation 1 LS 158,000 158,000
316,000
1,528,100 9.3% 64,400
1,592,500 30.0% 477,800
2,070,300 40.0% 828,200
2,898,500 10.0% 289,900
3,188,400 30.0% 956,600
4,145,000
OPERATIONS AND MAINTENACE COSTS
Labor 776 HR 100 77,600
Annual Energy Use 119,241 kWh/yr 0.27 31,829
Chemical Use - Potassium Permanganate 3,422 lbs 2.68 9,171
Packing Media Routine Cleaning 6 EA 200 1,200
Maintenance Materials 1 LS 10,575 10,575
Packing Media Replacement 1 LS 2,500 2,500
-
132,875
Indirect Costs (General Conditions, Mob/Demob, Contractor OH&P)
Subtotal
Subtotal
Subtotal
Subtotal
Taxes on Materials
Subtotal
Cost, $
Subtotal
Estimating Contingency
Subtotal
Construction Contingency
Total Estimated Construction Cost
Planning, Permitting, Design, CM, ESDC
Subtotal
Total Estimated Construction Cost
Description Quantity Unit Unit Cost, $
O-C-405-12-18-69-E-T4-SRFW OPCC_W Mn REMOVAl_v3 Page 2 of 2
City of Santa Rosa
Freeway Well Feasibility Study Report
Last Revised: 7-12-21

Cost Estimates - GAC
Appendix B

PROJECT: Freeway Well Planning Project
OWNER: City of Santa Rosa
LOCATION: Santa Rosa, CA
WEST YOST PROJECT #: 405-12-18-69
TITLE: Conceptual Level Opinion of Probable Cost
GAC Contactor Alternative
CAPITAL AND PROJECT COST
Sitework
DIV 2
Clearing and Grubbing 1 LS 15,000 15,000
Grading 1,690 SF 25 42,250
Yard Piping 1 LS 45,000 45,000
Tie-in to Water System 2 EA 5,000 10,000 -
112,250
Concrete
DIV 3
GAC Concrete Pad 21 CY 1,400 29,400
Chemical Building Concrete Pad 18 CY 1,400 25,200
Manganese Filter Concrete Pad 20 CY 1,400 28,000 -
82,600
Masonry
DIV 4
Fiberglass Chemical Building (24' x 14') 1 LS 60,500 60,500 -
60,500
Metals
DIV 5
Miscellaneous Metals 1 LS 3,000 3,000 -
3,000
Finishes
DIV 9
Coating & Painting 1 LS 49,000 49,000 -
49,000
Equipment
DIV 11
GAC Vessels 2 EA 198,000 396,000
GAC Vessel Installation 2 EA 12,000 24,000
Washwater Supply Pump 1 EA 12,000 12,000
Washwater Supply Pump Installation 1 EA 5,000 5,000
Manganese Filter 1 LS 475,000 475,000
Manganese Filter Installation 1 LS 25,000 25,000
Cost, $
Subtotal
Subtotal
Subtotal
Subtotal
Subtotal
Description Quantity Unit Unit Cost, $
O-C-405-12-18-69-E-T4-SRFW OPCC_W Mn REMOVAl_v3 Page 1 of 2
City of Santa Rosa
Freeway Well Feasibility Study Report
Last Revised: 7-12-21
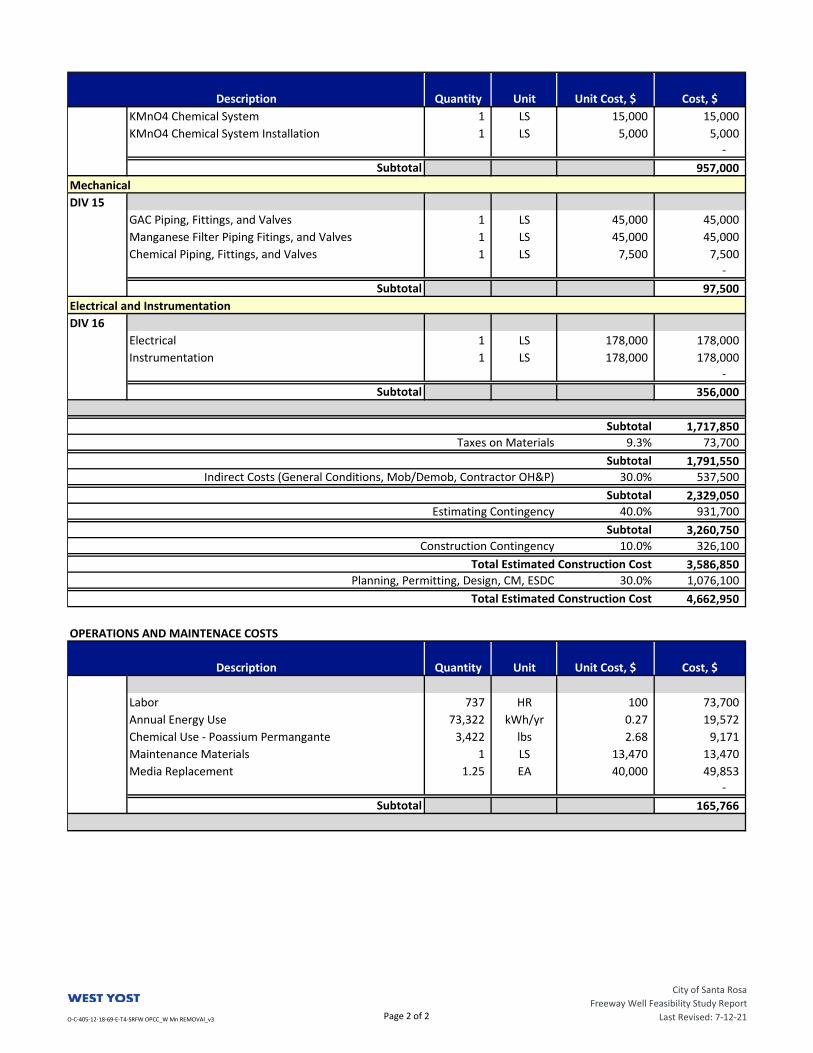
Cost, $Description Quantity Unit Unit Cost, $
KMnO4 Chemical System 1 LS 15,000 15,000
KMnO4 Chemical System Installation 1 LS 5,000 5,000 -
957,000
Mechanical
DIV 15
GAC Piping, Fittings, and Valves 1 LS 45,000 45,000
Manganese Filter Piping Fitings, and Valves 1 LS 45,000 45,000
Chemical Piping, Fittings, and Valves 1 LS 7,500 7,500 -
97,500
Electrical and Instrumentation
DIV 16
Electrical 1 LS 178,000 178,000
Instrumentation 1 LS 178,000 178,000 -
356,000
1,717,850 9.3% 73,700
1,791,550 30.0% 537,500
2,329,050 40.0% 931,700
3,260,750 10.0% 326,100
3,586,850 30.0% 1,076,100
4,662,950
OPERATIONS AND MAINTENACE COSTS
Labor 737 HR 100 73,700
Annual Energy Use 73,322 kWh/yr 0.27 19,572
Chemical Use - Poassium Permangante 3,422 lbs 2.68 9,171
Maintenance Materials 1 LS 13,470 13,470
Media Replacement 1.25 EA 40,000 49,853 -
165,766 Subtotal
Total Estimated Construction Cost
Description Quantity Unit Unit Cost, $ Cost, $
Subtotal
Estimating Contingency
Subtotal
Construction Contingency
Total Estimated Construction Cost
Planning, Permitting, Design, CM, ESDC
Indirect Costs (General Conditions, Mob/Demob, Contractor OH&P)
Subtotal
Subtotal
Subtotal
Subtotal
Taxes on Materials
Subtotal
O-C-405-12-18-69-E-T4-SRFW OPCC_W Mn REMOVAl_v3 Page 2 of 2
City of Santa Rosa
Freeway Well Feasibility Study Report
Last Revised: 7-12-21
Concord Phoenix
1001 Galaxy Way, Suite 310 Concord CA 95420 925-949-5800
4505 E Chandler Boulevard, Suite 230 Phoenix AZ 85048 602-337-6110
Davis Pleasanton
2020 Research Park Drive, Suite 100 Davis CA 95618 530-756-5905
6800 Koll Center Parkway, Suite 150 Pleasanton CA 94566 925-426-2580
Eugene Sacramento
1650 W 11th Avenue, Suite 1-A Eugene OR 97402 541-431-1280
8950 Cal Center Drive, Bldg. 1, Suite 363 Sacramento CA 95826 916-306-2250
Lake Forest San Diego
23692 Birtcher Drive Lake Forest CA 92630 949-420-3030
11939 Rancho Bernardo Road, Suite 100 San Diego CA 92128 858-505-0075
Lake Oswego Santa Rosa
5 Centerpointe Drive, Suite 130 Lake Oswego OR 97035 503-451-4500
2235 Mercury Way, Suite 105 Santa Rosa CA 95407 707-543-8506
Oceanside
804 Pier View Way, Suite 100 Oceanside CA 92054 760-795-0365