framework for interactive m illion -n eu ron s im u lation · framework for interactive m illion -n...
TRANSCRIPT

Hereld et al. Interactive Million-Neuron Simulation
Framework for Interactive Million-Neuron Simulation
Running title: Interactive Million Neuron Simulation
Mark Hereld,1,2 Rick L. Stevens,1,2 Wim van Drongelen,2,3
and Hyong C. Lee3
1Mathematics and Computer Science Division, Argonne National Laboratory, Argonne, IL
2Computation Institute, The University of Chicago, Chicago, IL
3Department of Pediatrics, The University of Chicago, Chicago, IL
Contact Information:
Mark Hereld
Argonne National Laboratory,
9700 S. Cass Ave., Argonne, IL 60637-1470.
Tel: (630) 252 4170
Fax: (630) 252 4786
E-mail: [email protected]
Presented during the international conference “An Overview of Epilepsy Research: What, Where,
When and Why,” organized by the Center for Integrative Neuroscience and Neuroengineering Research
(CINNR), May 19–20, 2006, in Chicago.
8/14/2006 1/28
Hereld et al. Interactive Million-Neuron Simulation
Abstract
Large simulations have become increasingly complex in many fields, tending to incorporate scale-
dependent modeling and algorithms and wide-ranging physical influences. This scale of simulation
sophistication has not yet been matched in neuroscience. In this paper we describe a framework aimed at
enabling natural interaction with complex simulations: their configuration, initial conditions, monitoring,
and analysis. The architecture is built on three cornerstone components: active probes, adaptive data
capture, and visual interface. The resulting synthesis will enable interactive exploration of live
simulations running on supercomputing platforms.
Keywords:
Computer simulation, Realistic modeling, Parallel computation, Neocortex, Epilepsy.
8/14/2006 2/28

Hereld et al. Interactive Million-Neuron Simulation
A Introduction
Brain electrical activity is generated by an immense network of billions of neurons. Because of the
brain’s complexity, brain electrical activity has been studied either at the microscopic level, ranging from
ion channels and single cells to small networks of cells, or at macroscopic level, in clinical measurement
such as electroencephalogram. Between these two extremes lie complex interactions between
interconnected populations of cells, interactions that are opaque to current experimental techniques.
Detailed understanding of brain function and dysfunction will require multiscale simulations to span these
modeled domains: (1) employing different data models, communication patterns, and algorithms as
appropriate to each layer of the simulation, (2) adaptively deploying corresponding simulation threads,
and (3) matching results obtained at these different scales.
Also, as the components of these simulations are developed within the computational neuroscience
community, the need for a framework for testing performance scaling and verification of integrated multi-
scale models will become critical for several reasons: (1) understanding simulation performance scaling is
prerequisite to knowing what scientific questions are practical to pursue, (2) understanding performance is
critical to simulation planning activities and resource allocation, and, (3) increasingly complex
simulations demand sophisticated parameter configuration management.
We describe a framework for interactive simulation and exploration of multiscale models. The
framework includes components to enable interactive simulation management, real-time simulation state
visualization and steering, and final result visualization. Because there are no standard methods for
probing, visualizing, and manipulating large simulations across scales, this model will be of interest to the
broader simulation community.
We organize the paper into two main sections. In the first section we describe the proposed
architecture and the three key components of its framework: leaky bucket stream archiving, active probes,
and image-based modeling and configuration. In the second section we describe several processes
8/14/2006 3/28

Hereld et al. Interactive Million-Neuron Simulation
enabled by the framework: model overlay visualization, interactive playback, and live performance
modeling.
B Related Work
Large simulations have become increasingly complex in many fields, tending to incorporate scale-
dependent modeling and algorithms and wide-ranging physical influences (Calder et al. 2002). This scale
of simulation sophistication has not yet been matched in neuroscience.
In simulations of biological neural networks, parallel computing has expanded the scale and
complexity of feasible systems (e.g., Migliore et al. 2006). Support for modeling realistic neurons and
networks on such platforms has been codified in domain-specific scripting environments such as
pGENESIS (Goddard and Hood 1997; Bower and Beeman 1998; pGENESIS 2005). Still, the largest
simulations in terms of cell count have been achieved with simplified models of the integrate-and-fire sort
– the latest of which appears to be a test at the 100 billion cell mark carried out on a 27-node Beowulf
cluster over 50 days (Izhikevich 2005). The Blue Brain Project targets simulation of a neocortical column
comprising some 10,000 cells on IBM’s Blue Gene/L computer platform (Blue Brain 2005).
Interactive high-performance computing has been actively pursued in several contexts. Successful
experiments in visualization of simulations with interactive user input and computational steering have a
long history (Canfield et al. 1996; Diachin et al. 1996; Matlab (Mathworks 2005) has attracted research
into parallel scientific computing (Kepner 2004; Choy and Edleman 2005) because it is flexible, fluid,
and familiar. Nonetheless, high-performance computing continues to lean heavily—indeed, almost
exclusively—on batch scheduling for job execution.
Simulations of large complex neurons have led to visualizations of the 3D physical models (Leigh et
al. 1993), demonstrating the translation of simulation configuration to model visualization. High-
performance visualization tools for more general parallel visualization applications have become
available (ParaView 2005) but have not been applied to biological neural network simulations.
8/14/2006 4/28

Hereld et al. Interactive Million-Neuron Simulation
High-quality performance characterization tools are available for parallel platforms (Mohr et al. 1994;
Tau 2005), but none enable interactive exploration of potentially live simulations.
Our own research in these areas includes the following.
Neocortex model and simulation – We have conducted preliminary work (Hereld et al. 2004) to
develop a first-generation detailed and scalable model of neocortex (Van Drongelen et al. 2002, 2004a,
2004b, 2005). This model is based on details of neocortical histology; that is, the neural elements are
arranged according to horizontal layers and vertical columns (see, e.g., Nieuwenhuys 1994; Mountcastle,
1997; DeFelipe et al. 2002). We represented neocortical cell types by multicompartmental models, in
which different parts of the cell are modeled by cylindrical compartments; the size and arrangement of the
compartments are constrained by the morphology of real neurons. Six major cell types are included in the
current model: superficial pyramidal, deep pyramidal, chandelier, and three types of basket cells. The
basket cells are further divided into several subtypes, each governed by somewhat different internal state
parameters. The basic equation governing the behavior of the compartments is a discrete implementation
of the cable equation with modified Hodgkin and Huxley-type ion channels. The neurons are placed in a
3D grid and connected to each other by using connectivity rules derived from connections in the
mammalian cortex (e.g., Nieuwenhuys 1994; Feldmeyer and Sakmann 2000; Hellwig 2000; Krimer and
Goldman-Rakic 2001). Simulation time is stepped uniformly and synchronously. Spikes are represented
as events that communicate an instantaneous change at the input of a synapse, with weight and delays
programmed into each connection.
The computational model has been implemented in parallel GENESIS (Bower and Beeman 1998) to
facilitate a high degree of detail, large-scale simulations and multiple parameter searches. A scalable
version of the model runs on the Jazz computing cluster at Argonne National Laboratory, where we
performed >10 years of single-processor simulation within a two-year period. Details of how the model is
constructed and preliminary results obtained with our approach have been published (Van Drongelen et
al. 2002, 2004a, 2004b, 2005). More recently we have run our simulation on the Blue Gene/L machine at
8/14/2006 5/28

Hereld et al. Interactive Million-Neuron Simulation
Argonne National Laboratory, testing the model’s performance characteristics on 32 to 512 nodes (Hereld
et al. 2005).
The resulting model of the neocortex is being studied as a platform for understanding the onset of
epileptiform activity in children. The goal of the research program is to understand epileptic activity in
the neocortex well enough to provide clues about its cause and possible cures. At present the model can
generate spontaneous and evoked activity at the compartmental, cellular, and network scales. The
compartmental and cellular activity consists of complete knowledge of the local membrane potential and
current. The extracellular activity was obtained as a weighted sum of currents generated by the model
neurons (Nunez 1981). Exciting recent results demonstrated that weakly coupled networks can sustain
bursting activity in neural populations (Van Drongelen et al. 2005); a surprising counterintuitive result
has also been found in real cortical networks (Pumain et al. 1985; Feng and Durand 2004, 2005; van
Drongelen et al., 2005). While our preliminary studies demonstrate the feasibility of modeling
extracellular local field potentials, no model currrently can connect local field potentials across multiple
scales to cellular and molecular parameters systematically. Further development is needed of a multiscale
neural model associated with adequate parameter evaluation tools.
Scalable simulation code – Although we continue to use this code to develop our neocortex model,
the implementation does not scale beyond about 100,000 cells. For this reason, and anticipating the
fundamentally different needs of future simulations, we began to develop a simulation code, called pNeo,
that can be optimized for much larger runs (Hereld et al., 2004). The new code has been tested on up to
250 nodes of the Argonne Jazz cluster in simulations of over 100,000 cells (Hereld et al., 2005). It has
also been run on 512 nodes of the Argonne Blue Gene/L machine in simulations of over twice that size.
Recent results from these experiments show near-linear speedup to P = 256 processors for fixed problem
small enough to run on a few processors (Fig. 1). Memory limitations constrain problem size at low P.
For the current code, larger problems will continue to exhibit good speedup on the available 512 nodes.
Interactive visualization – For visualizing, interacting with, and navigating through the large, complex,
multidimensional datasets to be created by this project, we have developed high-resolution, high-
8/14/2006 6/28

Hereld et al. Interactive Million-Neuron Simulation
performance display systems, built using arrays of commodity projectors and driven by clusters of
commodity computers (Hereld et al. 2000). These systems present tens of millions of pixels to groups of
interacting research collaborators. In addition to the hardware technologies, this effort has resulted in a
substantial application development toolkit.
To test the experience of interacting with dense visualizations of complex systems, we have
begun experiments on the ActiveMural, our room-sized high-resolution display system (Fig. 2). These
experiments are based on a dense diagram of a metabolic pathway model. The application spatially codes
the image area with clickable resources: supplementary data on proteins and reactions in local databases,
browser launching with encapsulated queries to large public databases, and 3D viewing application
launching for structure analysis.
C Architecture and Three Core Components
Increasingly sophisticated simulations will require complex configuration and initialization. And with
this complexity comes uncertainty. Already, large simulations are generating huge datasets requiring
analysis and interpretation. Often, most of the data generated during a simulation must be discarded
because of lack of storage space, bandwidth, or both. Simulations on expensive computational resources
must therefore be configured in advance, with potentially risky choices of what to save and what to
discard. Additionally, planning simulation sequences requires a priori knowledge of the performance
properties in order to avoid wasting precious resources on runs that are destined to fail because of
limitations of memory, disk space, or job time.
Our own neocortex simulations have pressed on all of these issues. We are developing a framework
that is designed to obviate these problems and that represents what we believe to be a vision of the future
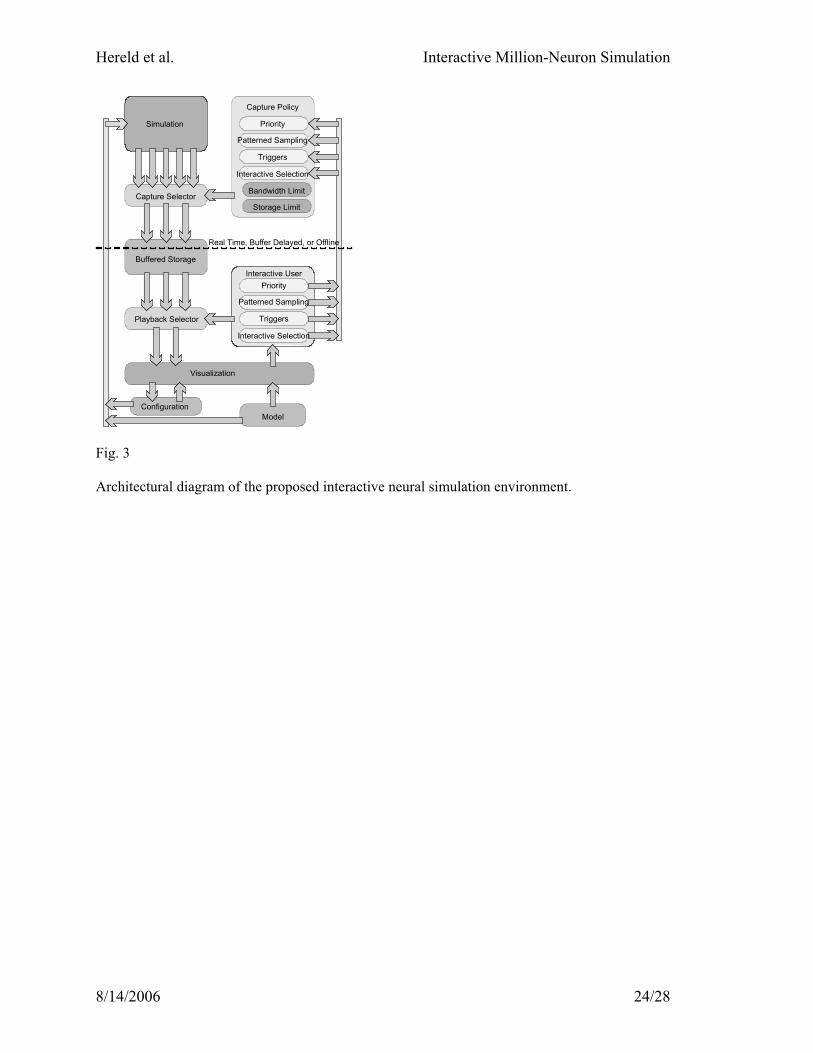
of large scale complex multiscale simulations. Figure 3 shows a schematic of the key features of our
framework. In it the simulation is represented in the upper left corner, running on a supercomputing
platform. The simulation is configured in the usual way, with little or no modification to existing coding
strategies—represented here by a block of configuration information that can be rolled in at the start of
8/14/2006 7/28

Hereld et al. Interactive Million-Neuron Simulation
the simulation. The collection of data and performance information from the simulation is managed by a
system that we call active probes. These probes provide the means for expressing what data is to be
captured for storage or monitoring. The data and performance capture policy controls which streams are
allowed to escape the execution cocoon of the simulation. Some elements of this capture policy can be
adjusted in time (or real time) through changes in the priority, patterned sampling, trigger, and
interactive selection mechanisms. The user views the simulation data streams using a playback metaphor,
which considers probe streams in the same way that a multitrack audio system deals with audio streams.
Visualization of the progress of the simulation is presented in images generated from the model and
configuration information. These same visual representations provide the canvas on which simulation
configuration information and active probe selection and activation are managed.
The interfaces to the simulation and to the user are separated by a line that captures the different
possible relationships between them: real time, buffer delayed, or offline. If the simulation is running on a
platform that supports interactive job execution, then the user will be able to work directly with the
simulation through the interface. In some cases, job execution might not be quite interactive—
architectures that introduce significant latency and Grid applications that entrain a changing collection of
computational resources are possible candidates; in such cases, the data stored in the buffer can be
worked with as it becomes available. In other cases, typical in supercomputing applications, batch
execution may force the data to be stored and viewed after the job has completed and the data has been
staged off the machine. Our design enables real-time interactive computing but does not require it.
C.1 Late Commitment and the Leaky Bucket
Large simulations notoriously generate more data than can be efficiently stored, and so researchers
are typically forced to select in advance the data that they anticipate will have the most scientific value.
Testing the behavior of a simulation to understand what computed quantities are most interesting often
requires multiple complete simulations. These issues have led us to consider a model that allows the user
to defer commitment to a particular subset of data until the last moment and that favors rapid exploration
8/14/2006 8/28
Hereld et al. Interactive Million-Neuron Simulation
of the simulation behavior in aid of intuition building. This “leaky bucket” model for adaptively
regulating data archiving is illustrated in Fig. 4.
At any time, a set of explicit selection criteria are in effect, and the user chooses these interactively as
the simulation proceeds. Data created by the simulation is tagged and timestamped so that later re-
evaluation in light of changed selection criteria can be used to discard less interesting data as storage
limits are reached. By this means an adaptive system of prioritization, responsive to the user’s evolving
understanding of the simulation results, can drive the continuous balancing of data needs against available
storage space.
C.2 Active Probes
Our idea of active probes captures the notion that monitoring signals from a simulation should be as
simple as attaching a sensor to a physical object. These probes then generate streams of data representing
the quantities under observation. We want this interface to the simulation to include several kinds of
measurement, of which the following are typical examples:
! Single state variable: the action potential of a particular cell
! Class of object variables: the action potential of each basket cell
! Filtered: the mean value of action potential of superficial pyramidal cells over a patch area
! Triggered: the action potential of a particular cell whenever another cell fires
! Performance measure: allocated memory
Because we think of these implementations in a physical way analogous to an oscilloscope probe, and
because the framework lets us interact with a visualization of the model, we enable natural modes of
interacting with the simulation.
The central question in the implementation of active probes is, How can we provide access to the
variables instantiated in all sorts of ways (static, scoped, register, intermediate) to the capture selector in a
way that requires communication only of selected quantities? A second question is, Where do we best
implement filters, combinations, and trigger tests without introducing unnecessary computation or
8/14/2006 9/28

Hereld et al. Interactive Million-Neuron Simulation
communication? Note that because we want to enable interactive selection of active probes their
activation must be made at run time.
Two approaches to implementing active probes look promising. The first leverages the symbol table
created by the compiler to gain access to variable names and memory locations. Additionally, a few
function calls would be introduced into the code to synchronize the efforts of the capture selector with the
simulation loop.
The second approach is built around manual instrumentation of the simulation code, with macros to
identify values that might be probed and a few functions that implement the interface between the
simulation and the capture selector. Automated instrumentation techniques have been developed
elsewhere (e.g., Mohr et al. 1994) and could be leveraged later. These macros would express the
circumstances of each type of variable that must be handled (intermediate variables, indexed quantities,
filtered quantities, triggers) and manage registration of symbols and generation of the activation flag list
at compile time. A schematic of the process is outlined in Table 1.
In both cases additional function calls would be required in the simulation to support the processing
of active probe data, mainly through the inclusion of processCaptureSelector() in the simulation
loop and the inclusion of initActiveProbes() at the outset of the simulation. Filters and triggers
would be implemented in the processing of the posted quantities depending on the conditions set by the
data and performance capture policy. In this way the application programmer would not be burdened with
definition, instantiation, and instrumentation of a wide range of possible filtering techniques. Instead,
these would be instantiated and managed in the shared code contained in the capture selector and
controlled by the capture policy unit (see Fig. 3).
Whereas the symbol table approach involves less modification to the code, it can meaningfully
expose only quantities that are held in variables that persist to the end of the time step. The macro
instrumentation approach enables a wider range of values for export, at the expense of more invasive
embellishments to the code. The final implementation will likely combine features from both approaches.
8/14/2006 10/28
Hereld et al. Interactive Million-Neuron Simulation
C.3 Image-based Modeling and Simulation Setup
Images, as opposed to algorithms, can often represent complex features in a straightforward and
intuitive way. Visual representation of the simulation model can provide the substrate on which at least
two distinct and complementary activities can take place:
! the user interactively selects and assigns configuration state information, and
! the user reviews displayed configuration state – population densities, scalar parameter fields,
spike activity fields.
Each rendered representation would be automatically generated from the model and current
configuration. Some of these visualizations would be straightforward to compute, as would be the case for
the overall map of cell placement in two or three dimensions. Hierarchically organized groupings of
subnetworks would also yield to simple techniques, so long as the interconnections were not labyrinthine.
Wiring diagram layout, however, is in general a difficult problem. We can rely initially on well-studied
methods such as force-directed layout algorithms (Tutte 1963; Fruchterman and Reingold 1991).
With cell types, connection types, and spatial layout available in graphical form, one can create richly
differentiated and expressive selection sets. We envision a wide variety of powerful configuration
methods to become possible with this toolset. The following are examples of these interactively driven
parametric configuration techniques:
! Graphical programming of probability density function can be expressed as a function of radius
or a 2D density map painted by the user or can be extracted from an image.
! Similar techniques can be applied for specifying variation of other quantities across spatial or
temporal dimensions.
! Parameter groups can be set over a region of interest selected by using the cursor lasso.
! Parameter groups can be copied from one region and pasted to another.
! Smooth variations can be computed and assigned for transition regions.
8/14/2006 11/28

Hereld et al. Interactive Million-Neuron Simulation
In order to implement these methods, a large number of techniques developed for word processing,
page layout, photographic image manipulation, and illustration can be borrowed.
Because complex configuration state can be expressed fluidly and quickly with this interface, and
because it will be possible in some cases to interact with a running simulation, a new capability becomes
possible: on-the-fly reconfiguration of the simulation. This capability will significantly enhance our
ability to quickly sort through the relationship between the model (and its configuration) and the behavior
of the simulation. Not a substitute for detailed parameter searches, this approach instead enables a rapid
skimming of possibilities and intuition building—an excellent tool for exploration. Likewise, this
capability can be employed during performance characterization and application performance modeling
by enabling rapid testing of dependencies and quick measurements of effects.
D Consequences of This Approach to Interactive Simulation
This framework, which couples visualization of simulation streams and performance streams from a
system of active probes to representations of the system model, creates an environment for fluid, flexible,
and natural interaction with complex and sophisticated simulations. It provides a natural mechanism for
integrated performance modeling, configuration, and reconfiguration of the simulation and the potential
for monitoring and steering the simulation.
A number of capabilities will be enabled, capabilities not currently available but likely to become
increasingly attractive with complex multiscale simulations: rapid configuration and testing to support
strategic planning and management of flocks of simulation sets; real time, buffer-delayed, or offline
interactive modalities; and sophisticated data-capture management based on priority, patterns, triggers,
real time steering, and resource limits.
D.1 Model Overlay Visualization
To facilitate interactive manipulation and interpretation of the state of the simulation, we envision an
environment based on visual representation of the simulation model, decorated with live data showing
8/14/2006 12/28

Hereld et al. Interactive Million-Neuron Simulation
animations of the active probe values. Simulations are often best understood with visual representations
of the model at different scales. Consequently we are motivated to create symbolic visualizations of
many aspects of the simulation: internal cell model parameterization, wiring schematic with
interconnection probability distributions, overall cell layout, and regional maps to capture interacting
subnetworks.
These representations will be derived automatically from the simulation configuration files, which in
our current code already express most of the necessary characteristics. This direct relationship between
configuration files and visual representation is critical to enabling interactive control and monitoring of
the simulation. It is also critical to streamlining the development process by leveraging the existing syntax
of our simulation configuration (based originally on the GENESIS neural simulation environment).
Specifically, we plan to organize configuration and the generated visual representations around three
descriptive layers:
! Individual cell models will be organized by cell type. Parameters governing the evolution of the
internal state will be configured and monitored. These can be varied by cell, by cell type, or by
parametric rules (e.g., spatial gradients, random variation).
! Subnetworks will be laid out in space and wired according to parametric rules.
! Groups of subnetworks will be laid out in space and interconnected according to parametric rules.
An example is shown in Fig. 5. The scenario depicted in this mockup illustrates several aspects of the
proposed interface: a deep pyramidal cell class has been selected (solid line circle), and instances are
shown as filled dots – a popup presents the opportunity to modify cell class parameters; a region of
interest has been selected (black dashed annulus). Note that the ROI intersects several processors; active
probes (numbered pointers) have been placed to capture mean action potential in the annulus and action
potential of a single cell. This example illustrates a few of the basic notions to be explored in the project
as they might apply to simple selections of small numbers of cells or connections.
8/14/2006 13/28

Hereld et al. Interactive Million-Neuron Simulation
D.2 Multitrack Playback Metaphor
As with interactive visual configuration, the visual representation of the simulation model provides a
canvas on which the user specifies, selects, manipulates, activates, and deactivates active probe sets. The
deployment of the probes affect the flow of data from a live simulation as well as the data presented to the
user at run time or during offline review and analysis. Several key aspects of the architecture enable new
and useful ways to manage the capture of useful data from large complex simulations.
First, data from the simulation is stored to disk with the understanding that some or all of it may be
overwritten as the user refines the priorities interactively. The only a priori constraints are bandwidth to
disk and total available disk, defining how much data can be exported from the simulation. In contrast,
with the conventional approach, the bandwidth and space limits force choices that are made at the outset
of the simulation and remain fixed until the simulation ends.
Second, active probes enable rapid and interactive modification of the data selected for review and
storage. This feature enables live tuning of the priorities as the behavior of the simulation is actively
studied.
Third, with the ability to rapidly reconfigure the simulation, it is easy to configure the simulation to
multiplex data from several probe sets onto the limited bandwidth channel. Several variables can be
sampled at lower time resolution, for example alternating at each simulation time step.
Fourth, trigger conditions can be added to the probe set selection criteria. In this way, once identified
and codified by a trigger condition, interesting features of the simulation can be captured without storing
less interesting prelude and postlude data. And because the architecture buffers the data, the triggers can
be quite sophisticated and involve look-ahead evaluation.
The proposed architecture therefore encourages an interesting new strategy. The user begins by
streaming as much data as possible to disk, subject only to the same constraints suffered by the
conventional approach. As the simulation proceeds, the user can adjust priorities and probe set depending
on the results from the simulation. Over time, the optimal data collection scheme (probes sets, switching
8/14/2006 14/28

Hereld et al. Interactive Million-Neuron Simulation
patterns, priorities) is impressed on the interface to the simulation. The earlier “misguided” or naïve
priorities haven’t cost anything—less important data will be overwritten by more important data.
D.3 Live Performance Modeling
The proposed framework also enables a mode of performance characterization that complements
available tools. In particular, it will encourage rapid and intuitive hypothesis-driven exploration of the
performance properties of the simulation by enabling interactive and selective study of performance
metrics to capture critical behavior and resource usage patterns. This feature contrasts with the traditional
approach of instrumenting code to log every quantity that one might find useful, running the simulation,
sifting through the resulting logs (sometimes with the aid of visualizations), reinstrumenting the code to
catch additional performance data, and iterating until the performance model emerges.
Generally, the primary goal of these explorations is to extract a model for the performance scaling
relating execution cycles, processor count, memory requirements, network bandwidth, and I/O bandwidth
to problem size and configuration. The features of the present framework will largely suffice to support
live performance modeling.
E Concluding Remarks
Despite the current knowledge of cortical structure and functions, the relationship between neural
activities across scales in the nervous system is poorly understood. This lack of understanding is largely
due to current experimental techniques in neuroscience, which are limited to detailed, small-scale
electrophysiological recordings from small groups of neuron or to averaging measurements of very large
networks, lacking the required detail. The implication of this limitation is that no current experimental
technique can adequately correlate the behavior at the two extremes.
We have described a framework for interactive simulation that combines an adaptive scheme for
archiving simulation data streams, a flexible and natural data selection architecture that is based on the
metaphor of the probe, and incorporation of visual techniques into both configuration and monitoring
8/14/2006 15/28

Hereld et al. Interactive Million-Neuron Simulation
processes. We have argued that applying such a framework to complex simulations running on
supercomputers will enable a fundamentally different and better platform for exploration.
Taming complex configuration, management, and understanding of multiscale simulations by
packaging the complexity in interactive visual form creates a more accessible interface to the inner
workings of the system under study and to the scientific results, while it enhances the exploratory nature
of the scientific process. Clearly the framework described in this paper could extend beyond research in
neuroscience, to any field that engages high-performance computing to explore complex systems through
simulation: nanoscience, civil engineering, climatology, hydrology, systems biology, and more.
Acknowledgments
This work was supported by the U.S. Department of Energy under Contract W-31-109-Eng-38. We
thank Drs. M. H. Kohrman, J.-M. Ramirez, and V. L. Towle for discussion and useful comments. We
thank the Falk Foundation and the Linn Family for support.
F References
Blue Brain Project. 2005. http://bluebrainproject.epfl.ch/Blue%20Brain%20Project.htm.
Bower JM, Beeman D. 1998. The book of GENESIS. New York: Springer-Verlag.
Butera RJ, Rinzel J, Smith JC. 1999. Models of respiratory rhythm generation in the pre-
Botzinger complex, I: bursting pacemaker neurons. J Neurophysiol 82:382–397.
Calder AC, Fryxell B, Plewa T, Rosner R, Dursi LJ, Weirs VG, Dupont T, Robey HF, Kane JO,
Remington BA, Drake RP, Dimonte G, Zingale M, Timmes FX, Olson K, Ricker P, MacNeice P,
Tufo HM. 2002. On validating an astrophysical simulation code. ApJS 143
8/14/2006 16/28

Hereld et al. Interactive Million-Neuron Simulation
Canfield T, Diachin D, Freitag L, Heath D, Herzog J, Michels W. 1996. Interactive
computational models of particle dynamics using virtual reality. In: Proceedings of the
symposium on virtual reality in manufacturing research and education; Chicago. p. 80–88.
Choy R, Edelman A. 2005. Parallel MATLAB: doing it right. In: Proceedings of the IEEE;
February.
DeFelipe J, Alonso-Nanclares L, Arellano JI. 2002. Microstructure of the neocortex:
comparative aspects. J Neurocytol 31:299–316.
Diachin D, Freitag L, Heath D, Herzog J, Michels W, Plassmann P. 1996. Interactive simulation
and analysis of emission reduction systems for commercial boilers. In: Proceedings of the SCS
'96 multiconference; April; p. 352–357.
Elsen FP, Ramirez JM. 1998. Calcium currents of rhythmic neurons recorded in the isolated
respiratory network of neonatal mice. J Neurosci 18:10652–1062.
Feldmeyer D, Sakmann B. 2000. Synaptic efficacy and reliability of excitatory connections
between principal neurons of the input (layer 4) and output (layer 5) of the neocortex. J Physiol
525:31–39.
Feng Z, Durand DM. 2004. Suppression of excitatory synaptic transmission can facilitate low-
calcium epileptiform activity in the hippocampus in vivo. Brain Res 1030:57–65.
Feng Z, Durand DM. 2005. Propagation of low-calcium non-synaptic induced epileptiform
activity to the contralateral hippocampus in vivo. Brain Res 1005:25–35.
8/14/2006 17/28
Hereld et al. Interactive Million-Neuron Simulation
Fruchterman T, Reingold E. 1991. Graph drawing by force-directed placement. Softw – Pract
Exp 21(11):1129–1164.
Goddard NH, Hood G. 1997. Parallel GENESIS for large scale modeling. In: Computational
neuroscience: trends in research 1997. New York: Plenum. p. 911–917.
Hellwig B. 2000. A quantitative analysis of the local connectivity between pyramidal neurons in
layer 2/3 of the rat visual cortex. Biol Cybern 82:111–121.
Hereld M, Judson, IR, Stevens RL. 2000. Tutorial: introduction to building projection-based tiled
display systems. IEEE Computer Graphics and Applications 20(4):22–28.
Hereld M, Stevens RL, Van Drongelen W, Lee HC. 2004. Developing a petascale neural
simulation. Invited presentation Joint Meeting of 5th International Conference on
Bioelectromagnetism and 5th International Symposium on Noninvasive Functional Source
Imaging within the Human Brain and Heart (BEM&NFSI), Minneapolis, Minnesota, May 2005.
IEEE Catalog No: 04CH37558C, ISBN: 0-7803-8440-7: 3999–4002.
Hereld M, Stevens R, Teller J, van Drongelen W, Lee H. 2005. Large neural simulations on large
parallel computers. Invited paper at Joint meeting of 5th international conference on
bioelectromagnetism and 5th international symposium on noninvasive functional source imaging
within the human brain and heart (BEM&NFSI); May; Minneapolis (MN).
Izhikevich EM. 2005. Unpublished. http://vesicle.nsi.edu/users/izhikevich/interest,
Kepner J. 2004. MatlabMPI. J. Parallel Distrib. Comput. 64, 8 (Aug. 2004), 997-1005.
8/14/2006 18/28

Hereld et al. Interactive Million-Neuron Simulation
Koch H, Van Drongelen W, Marcuccilli CJ, Ramirez J.-M. 2003. Are slow oscillations in
somatosensory cortex of mice in vitro dependent on the persistent sodium current? Society for
NeuroscienceWashington, DC.Society for Neuroscience. Abstract 411.18.
Krimer LS, Goldman-Rakic PS. 2001. Prefrontal microcircuits: membrane properties and
excitatory input of local, medium and wide arbor interneurons. J Neurosci 21:3788–3796.
Leigh J, De Schutter DE, Lee M, Bhalla US, Bower JM, DeFanti TA. 1993. Realistic modeling
of brain structures with remote interaction between simulations of an inferior olivary neuron and
a cerebellar Purkinge cell. In: Proceedings of the SCS simulations multiconference; March;
Arlington (VA).
Mathworks.2005. http://www.mathworks.com/.
Migliore M, Cannia C, Lytton WW, Markram H, Hines ML, Parallel network simulations with
NEURON. J Comput Neurosci May 26.
Mohr B, Brown D, Malony A. 1994. TAU: a portable parallel program analysis environment for
pC++. In: Proceedings of CONPAR 94 - VAPP VI, University of Linz, Austria, LNCS 854;
Sept.; p. 29–40.
Mountcastle VB. 1997. The columnar organization of the neocortex. Brain 120:701–722.
Nieuwenhuys R. 1994. The neocortex. an overview of its evolutionary development, structural
organization and synaptology. Anat Embryol 190:307–337.
Nunez PL. 1981. Electric fields of the brain: the neurophysics of EEG. Oxford: Oxford
University Press.
8/14/2006 19/28

Hereld et al. Interactive Million-Neuron Simulation
ParaView. 2005. http://www.paraview.org.
pGENESIS. 2005. http://www.genesis-sim.org.
Pumain R, Menini C, Heinemann U, Louvel J, Silva-Barrat C. 1985. Chemical synaptic
transmission is not necessary for epileptic seizures to persist in the baboon Papio papio. Exp
Neurol 89:250–258.
Tau.2005. http://www.cs.uoregon.edu/research/tau/home.php.
Tutte, WT. 1963. How to draw a graph. Proceedings London Mathematical Society 13(3):743–
768.
Van Drongelen W, Hereld M, Lee HC, Papka ME, Stevens RL. 2002. Simulation of neocortical
activity. Epilepsia 43, Suppl. 7:149.
Van Drongelen W, Lee HC, Hereld M, Jones D, Cohoon M, Elsen F, Papka ME, Stevens RL.
2004a. Simulation of neocortical epileptiform activity using parallel computing.
Neurocomputing 58–60:1203–1209.
Van Drongelen W, Lee HC, Koch H, Elsen F, Carroll MS, Hereld M, Stevens RL. 2004b.
Interaction between cellular voltage-sensitive conductance and network parameters in a model of
neocortex can generate epileptiform bursting. Invited presentation; IEEE Catalog 04CH37558C:
4003–4005a.
Van Drongelen W, Koch H, Marcuccilli CJ, Viemari J, Tryba AK, Loweth JA, Ramirez J.-M.,
Elsen F. 2004c. Persistent sodium current plays a critical role in the generation of slow
8/14/2006 20/28

Hereld et al. Interactive Million-Neuron Simulation
oscillations in in vitro neocortex brain slices of mice and humans. 2004 Society for Neuroscience
annual meeting.
Van Drongelen W, Lee HC, Koch, Hereld M, H, Elsen F, Chen Z, Stevens RL. 2005a. Emergent
epileptiform activity in neural networks with weak excitatory synapses. IEEE Trans. Neur Sys &
Rehab13:236–241.
Zador A, Koch C, Brown TH. 1990. Biophysical model of a Hebbian synapse. Proc Natl Acad
Sci U S A. 87:6718–6722.
8/14/2006 21/28

Hereld et al. Interactive Million-Neuron Simulation
Fig. 1
Scaling study of our development code, pNeo, running on Blue Gene. The size of the simulation is held
fixed while the number of processors allocated is changed. The top panel shows speedup as a function of
number of processors. Beyond 256 processors the communication time begins to dominate the total
execution time, resulting in less than linear speedup. We expect that simulations involving more cells
would enjoy linear speedup on larger allocations of processors. The bottom panel shows required memory
per processor scales with number of processors. Again we see that for hundreds of processors the problem
shows signs of mismatch to the available resources.
8/14/2006 22/28

Hereld et al. Interactive Million-Neuron Simulation
Fig. 2
Initial experiment in large-format high-resolution interactive visualization – in this case a visualization of
metabolic pathway diagrams. The diagram at native resolution is larger than the 12 million pixel
ActiveMural, physically 16 feet wide by 8 feet tall.
8/14/2006 23/28
Hereld et al. Interactive Million-Neuron Simulation
Simulation
Capture Selector
Buffered Storage
Playback Selector
Bandwidth Limit
Storage Limit
Real Time, Buffer Delayed, or Offline
Interactive User Priority
Patterned Sampling
Triggers
Interactive Selection
Visualization
Configuration Model
Capture Policy
Priority
Patterned Sampling
Triggers
Interactive Selection
Fig. 3
Architectural diagram of the proposed interactive neural simulation environment.
8/14/2006 24/28

Hereld et al. Interactive Million-Neuron Simulation
archive
"Ci#$%$&C$'$C $($
$$$$$$$"Cj#$)$&C
$'$C $($$
C $*$"current explicit criteria #$$
C $*$"current implicit criteria #$
Fig. 4
Illustration of leaky bucket streaming data storage model. The box represents total available disk space.
High and low water marks (indicated as dashed lines) determine behavior of the fill and empty
processes that regulate data archiving.
8/14/2006 25/28

Hereld et al. Interactive Million-Neuron Simulation
D
R
I
S
I
D C
Ba
S
Ba
float cell_dx=10e-6 // x-spacing float cell_dy=10e-6 // y-spacing float cells_ox={nodes_ox} // x-org float cells_oy={nodes_oy} // y-org float D_PYR_OX={cells_ox} // x-coord float D_PYR_OY={cells_oy} // y-coord float D_PYR_DX={cell_dx} // cell sep float D_DEPTH=550e-6 float D_PYR_NX={cells_nx}float D_PYR_NY={cells_ny}
1. Im – ROI.Sum 2. Vm – Cell.Soma 3. Spike times
Active Probe List 1
2
1
2
3
Deep Pyramidal Cell Parameters
Fig. 5
Mockup of possible visual depiction of the neocortex model employed as markup space for simulation
configuration, active probe deployment, and signal monitoring. The schematic on the left show the wiring
diagram for excitatory and inhibitory connections. The middle panel indicates a 2D layout of cells in a
patch of the model with an annular region of interest, including rectangular a grid denoting which
processor in the cluster computes which portion of the patch. Recorded or real-time traces of probed
quantities are at the bottom right.
8/14/2006 26/28

Hereld et al. Interactive Million-Neuron Simulation
Table 1. Simple MACRO Instrumentation Example
The macro PROBE_2D PROBENAME ARRAYNAME I J
Would be inserted into
the code to expose
intermediate results:
v(i,j) = someThing;
PROBE_2D ActionPotential v i j
v(i,j) = someThingElse;
And would expand to: v(i,j) = someThing;
if (__AP__FLAGS[__AP__ActionPotential]) {
postCapture(__AP__ActionPotential,v(i,j));
}
v(i,j) = someThingElse;
It would ensure creation
of the flag array and add
symbols
boolean __AP__FLAGS[]
#define __AP__ActionPotential = __APX_INDEX
#define __APX_INDEX += 1
8/14/2006 27/28

Hereld et al. Interactive Million-Neuron Simulation
The submitted manuscript has been created by the University of Chicago as Operator of Argonne
National Laboratory ("Argonne") under Contract No. W-31-109-ENG-38 with the U.S. Department of
Energy. The U.S. Government retains for itself, and others acting on its behalf, a paid-up, nonexclusive,
irrevocable worldwide license in said article to reproduce, prepare derivative works, distribute copies to
the public, and perform publicly and display publicly, by or on behalf of the Government.
8/14/2006 28/28