framework for assessing sustainability levels in …
TRANSCRIPT

Intermediary report - January 2003
FRAMEWORK FOR ASSESSING SUSTAINABILITY LEVELS IN BELGIAN AGRICULTURAL SYSTEMS - SAFE
CP-28
UCL - KUL

The appendixes to this report are available at : http://www.belspo.be (FEDRA) Published in 2003 by the Belgian Public Planning Service Science Policy Rue de la Science 8 - Wetenschapsstraat B-1000 Brussels Belgium Tel : 32/2/238.34.11 – Fax 32/2/230.59.12 http://www.belspo.be (FEDRA) Contact person : Mrs Aurore Delis ([email protected]) Tel : 02/238.37.61 Neither the Belgian Federal Science Policy Office nor any person acting on behalf of the Belgian Federal Science Policy Office is responsible for the use which might be made of the following information. The authors of each contribution are responsible for the content of their contribution and the translation. No part of this publication may be reproduced, stored in a retrieval system, or transmitted in any form or by any means, electronic, mechanical, photocopying, recording, or otherwise, without indicating the reference.
This research project is realised within the framework of the Scientific support plan for a
sustainable development policy (SPSD II)
Part I “Sustainable production and consumption patterns”

Annual Scientific Report 2002-SAFE04/02/2003
1
OSTC PROJECT CP 04
FRAMEWORK FOR ASSESSING SUSTAINABILITY LEVELS INBELGIAN AGRICULTURAL SYSTEMS - SAFE
ANNUAL REPORT 2002
SCIENTIFIC REPORT
CONTENT
I Introduction 2
I.1 Context and summary 2
I.2 Objectives 2
I.3 Expected outcomes 3
II Detailed description of the scientific methodology 4
II.1 Hierarchical framework for SAFE 4
II.2 Experiment 7
II.3 Development and evaluation of indicators 8
II.4 Monitoring ecosystems 11
II.5 Monitoring energy 11
II.6 Monitoring economics 12
II.7 Data management 12
II.8 Dissemination of results 12
III Intermediary results 13
III.1 Experiment 13
III.2 Farming system 13
III.3 Water and soil quality 16
III.4 Biodiversity 18
IV Perspectives 19
IV.1 Farming system 19
IV.2 Water and soil quality 19
IV.3 Biodiversity 20
IV.4 Socio-economics 20
V Annexes 21
V.1 References 21
V.2 Annex I : Selected Sites 24
V.3 Annex II : Selected Parcels 28
V.4 Annex III : Economic and energetic Evaluation of Farming Systems: A review 30
V.3 Annex IV : List of proposed principles, criteria and indicators for measurement 43
4-12-2002

Annual Scientific Report 2002-SAFE04/02/2003
2
I INTRODUCTION
I.1 Context and summary
The project is a collaboration between Prof. Hermy and Prof. Muys (Laboratory of Forest, Natureand Landscape Research, KULeuven), Prof. Vanclooster and Prof. Bielders (Department ofEnvironmental Sciences and Land Use Planning, UCL), Prof. Mathijs (Agricultural andEnvironmental Economics Unit, KULeuven) and Prof. Peeters (Laboratory of grassland Ecology,UCL).
The sustainability of farming systems is currently under debate. There is indeed a strong concernthat the intensification of agriculture has long term consequences for soil and water quality, forglobal climate and for biodiversity. As a consequence, sustainability should thus be regarded in thefuture as an emergent property of agricultural systems.
At international level, several organisations are analysing and testing sets of agri-environmentalindicators: Elisa project (EU, Wascher, 2000), OECD Environmental Indicators for Agriculture(OECD, 2000), …
This project suggests a holistic approach to deal with sustainability in agriculture by definition ofan analytical framework which integrates all factors influencing and influenced by agriculture. Theproposed analytical framework is not intended to find a common solution for sustainability inBelgian agriculture, but to suggest a management tool for the identification, development andevaluation of locally more appropriate agricultural techniques. At a first stage, a literature reviewof existing methods (criteria and indicators) will be made and a first set of indicators tested on thefield. Existing methods will be compared to identify effectiveness, deficiencies and similarities,from which to build forward.
I.2 Objectives
The analysis of sustainability will be mainly based on the multiple functions performed byagriculture within the ecosystem/landscape where it is practiced, such as food production, soil,water, landscape and biodiversity conservation functions. Existing and new indicators will be usedfor the analysis. They will be measured, calculated and/or extrapolated at three scales: field, farmand ecosystem/landscape. This will help understanding the interactions between the differentscales of indicators, as well as their geographic distribution. The field scale gives the opportunityto compare different management techniques. We are interested in conventional andalternative/innovative techniques, such as mechanical weed treatment, minimum labour andreduction of pesticide applications in the field margins. The farm level is the critical unit forpractical implementation of different management techniques. Finally, the ecosystem/landscape isthe dimension able to reflect both agricultural and ecological multifunctionality. Considerations onbiodiversity and landscape conservation will be of special importance at this level given that theother two scales are too small to adequately reflect them.
Annual Scientific Report 2002-SAFE04/02/2003
3
Four test sites, defined at the ecosystem/landscape level, will be monitored during the project.Several parcels will be comprised in a single test site, including conventional and alternativesituations. The sustainability evaluation will be of comparative character, either (a) spatial(simultaneous analysis of several parcels within a test site, a reference will be chosen for each site)or (b) temporal (analysis of the same system over time).
The most important step for the final definition of the analytical framework will be the choice of atechnique to combine all the measured indicators in order to obtain a global sustainableperformance of the different agricultural practices studied. Three different techniques will beresearched during the project: qualitative, quantitative and graphic.
I.3 Expected outcomes
The resulting analytical framework will provide a scientifically sound tool for decision making inagriculture, incorporating sustainability concerns. Therefore, it will enable the enhancement ofenvironmental quality in the long term, ensuring at the same time the continuity of agriculture notonly as a productive activity but also as a provider of environmental goods and services. Thiscoherent resulting analytic framework will accomplish the preconditions for the development ofpolicy objectives and measures to support sustainable agriculture at local/regional level.

Annual Scientific Report 2002-SAFE04/02/2003
4
II DETAILED DESCRIPTION OF THE SCIENTIFICMETHODOLOGY
II.1 Hierarchical framework for SAFE
The first year was important for the development of the general framework.
II.1.1 Sustainable agriculture
Sustainable agriculture can be defined as agriculture that conserves the resources of the earth,water, plants and animals, does not degrade the environment, is economically viable and sociallyacceptable (Hinrichsen, 1997).
Where the emphasis used to be on yield increasing technologies, the idea of ecological and socialsustainability next to economics gradually appeared in agricultural practices.
In the ‘sustainable agriculture idea’, an agricultural system is considered as an ecosystem. TheConference on Biological Diversity (1992) defined this as a “dynamic complex of plant, animaland micro-organism communities and their non-living environment interacting as a functionalunit”. Within this agro-ecosystem, biological diversity should be maintained or enhanced. Thisincludes diversity within species, between species and ecosystems (CBD, 1992).
The objective of the hierarchical framework is evaluating sustainability in agriculture by selectionof principles, criteria and indicators. The indicators will be selected to measure the sustainabilitylevel of a particular system.
II.1.2 Hierarchical framework structure
In Figure II-1, definitions and examples of each component of the hierarchical framework areprovided. Figure II-1: Hierarchical Framework Structure (Adapted from: Lammerts van Bueren & Blom,1997).
II.1.3 Selection of principles
The multifunctional character of the agro-ecosystems concerns three pillars: economic,environmental and social pillars. Diverse functions performed by the agro-ecosystem areassociated (Table II-1). The following list is not hierarchical, the three pillars are equallyimportant. Table II-1: Agro-ecosystem pillars and functions Table II-2: List of Pillars, Functions, Principles
and Criteria
Principles are associated to these functions (Table II-2 ).

Annual Scientific Report 2002-SAFE04/02/2003
5
To emphasise long-term ecological sustainability, the system must (Altieri, 1995):
- Reduce energy and other resource use
- Employ production methods that restore homeostatic mechanisms conducive tocommunity stability, optimise the rate of turnover and recycling of matter and nutrients,maximise the multiple-use capacity of the landscape, and ensure an efficient energy flow
- Encourage local production of food items adapted to the natural and socio-economicsetting
- Reduce costs and increase the efficiency and economic viability of small and medium-sized farms, thereby promoting a diverse, potentially resilient agricultural system
A principle must be formulated as a wish to strive for.
II.1.4 Selection of criteria
A criterion is the resulting state or aspect of the agro-ecosystem when the principle related to it, isrespected. Criteria are specific objectives, more concrete than principles, and therefore easier toassess and to link indicators to.
The selection of criteria is based on the knowledge of the system of study. They will not bedefined on a case study basis but taking into account the broader conditions of the area where theframework is to be applied (Table II-2).
The formulation of a criterion must allow a verdict (Yes/No) on the compliance with the criterionin an actual situation.
II.1.5 Selection of indicators
There are several conditions an indicator should fulfil (Doran & Parkin, 1994; Archard & Martin,2002; Dumanski & Pieri, 2000):
• They should be measurable in time and space• They should reflect changes over a recognisable time period• They should reflect spatial changes• They should be analytically sound• They should be understandable by both policy makers and farmers• They should be feasible to obtain or to develop• They should be a function of independent variables• They should be applicable to different scale levels
An extensive list of indicators is presented in Annex IV : List of proposed principles, criteria andindicators for measurement.

Annual Scientific Report 2002-SAFE04/02/2003
6
II.1.6 Spatial and temporal scale
II.1.6.1 SPATIAL SCALE
The SAFE project concentrates on the parcel/farm/landscape levels:(a) Field. This scale gives the opportunity to compare different management techniques;
(b) Farm. It is the critical level for practical implementation of different management techniques;
(c) Ecosystem/landscape. It is the dimension that best reflects both agricultural and ecologicalmultifunctionality. Considerations on biodiversity and landscape conservation will be of specialimportance at this level.
TEMPORAL SCALE
Although we are aware that some principles will be ideally formulated differently in short and longterm, the SAFE project analyses the present situation.
II.1.6.2 SCALE DEPENDENCY
Goal and Principles are to be formulated so that they become scale independent. The same kind offormulation is desirable for Criteria.
Scale dependency appears only at the Indicator level.
II.1.7 Applications of the hierarchical framework
After a first evaluation of the agricultural systems (parcel, farm and landscape) in 2002 by theindicators set, we will improve the system.
The goal is to obtain a maximum of valid information with a minimum data collection. Thisinformation must give recommendations of actions in order to reach a higher level ofsustainability, compromise between the different functions performed by the agro-ecosystems andthe unique state of the farm (pedology, climatology, sociology and economics).
The analysis must enlighten decision makers and attract farmers. It must provide information forinvestments and must allow to find a compromise between profitability and environmentalconstraints.

Annual Scientific Report 2002-SAFE04/02/2003
7
II.2 Experiment
II.2.1 Selection and monitoring of test sites (all teams)
Four farms and their surroundings are selected as test sites. The selection is based on the followingcriteria.
- Geographic position (different regions in Belgium)- Social aspect ; co-operation and enthusiasm for the project of the farmer.- Use of alternative or innovative practices.- Representativeness of the farm within the regionIt should be taken into account that criteria: alternative practices or co-operativeness of the farmerlead into an error for representativeness.
II.2.2 Description of agricultural production systems
The basic components of an agroecosystem which will enhance sustainability include (Altieri,1995):
- Vegetative cover as an effective soil and water-conserving measure, met through the useof no-tillage practices, mulch farming, and use of cover crops.
- Regular supply of organic matter (manure, compost) and promotion of soil biotic activity- Nutrient recycling mechanisms through the use of crop rotations, crop/livestock mixed
systems, intercropping systems based on legumes, etc- Pest regulation ensured through enhanced activity of biological control agents achieved
through biodiversity manipulations and by introducing and /or conserving enemies.- Enhanced biological pest control through crop diversification- Increased multiple use capacity of the landscape- Sustained crop production without use of environmentally degrading chemical inputs.
The objective of the description is to have a global view of the farming system, which indicates:
- Yield per ha and Production /LU (meat, milk…)- State of equilibrium between crop production and animal breeding activities- Use of input (fertiliser, pesticide, drug, energy, capital, land)- Use of technique for increasing the efficiency of input use: crop rotation, tillage features…- Marketing system .
Agriculture production features are needed for calculating and deriving indicators related toproductive function of agro-ecosystems.
For data collection, farmers received a logbook. In this logbook they are asked to fill ininformation about crop and land management. This winter a logbook for animal activities will begiven to the farmers to obtain additional data. For the economic and social aspects they will get aquestionnaire. Once during the project period, there will be a survey on the impact of agricultureon the neighbourhood.

Annual Scientific Report 2002-SAFE04/02/2003
8
For the landscape level, we will use data from INS (National Statistical Institute), and CEA(Centre for Agricultural Economics).
II.3 Development and evaluation of indicators
II.3.1 Farming system
A literature review has been carried out for selecting suitable indicators: Diagnostic SOLAGRO(Pointereau et al., 1999), ECOBILAN (Rossier, 1999), Multi-objectif parameter (Vereijken, 1997),PAEXA, ECOFARM (Van Bol, 2000), PROP’EAU-SABLE (Lambert et al., 2002), EdeN (Couvreur, en cours), European CAPER Project (1999), SAFE 1 (Van Bol et al., 1998), OECD(2001), ELISA (EU concerted Action Project on Environmental Indicators for SustainableAgriculture) and the Washer’s technical report (2000)...
For some subjects, the literature review is running its course.
II.3.2 Water and soil quality
Simply said, sustainable agriculture means that agricultural production systems should be managedin such a way that future generations will still be able to feed the world population with nutritiousand healthy food. Where the emphasis used to be on fertiliser research in order to reach this goal, itshifted gradually towards the sustainable agriculture idea. This means that agricultural productionshould be maintained but also that the soil quality should be maintained. Closely related to soilquality there is groundwater quality.
Soil quality was defined by the Soil Science Society of America (USDAhttp://soils.usda.gov/sqi/sqiinfo.html) as the capacity of a specific soil to function within natural ormanaged ecosystem boundaries to sustain plant and animal production, maintain or enhance waterquality and support human health and habitation.
There are several methods mentioned in literature to evaluate soil quality. The first is to define asoil quality index as proposed by Doran and Parking (1994) and Parr et al. (1992). The soil qualityindex of Parr et al.(1992) is a function of several soil properties, potential productivity,environmental factors, health, erodibility, biological diversity, food quality and managementinputs. The soil quality index of Doran and Parking (1994) is a function of food and fibreproduction, erosivity, ground water quality, surface water quality, air quality and food quality.
These soil quality indexes demand an enormous amount of data, which is not always available.Therefore minimum data sets were proposed, which contain the most important data to determinesoil Quality, that should be measured always. The minimum data set of Doran and Parking (1994)and Archard and Martin (2002) are given in Table II-3. Table II-3. Minimum data sets proposedby Doran and Parkin, and Archard and MartinThere is still no consensus about the minimum data set, what can also be seen in this table. Thequestion is if it is possible to establish such a minimum data set, because soil conditions are highlyvariable within and between regions. This implies that a minimum data set can give perfect resultsfor one region, but bad results for an other region, where other factors are more important, forinstance salinity or erosion.

Annual Scientific Report 2002-SAFE04/02/2003
9
Looking at these minimum data sets, it can be noticed that the indicators mentioned give only anindication of the soil quality at a certain time. Most indicators do not take temporal variation intoaccount, which is important when studying sustainability: The indicators evaluating sustainabilityshould give an impression about the future, reflect changes so that a good evaluation ofsustainability can be made. The indicators as mentioned in table 3 will be referred to as timeinvariant indicators. The indicator types mentioned below will be referred to as time variantindicators. These indicators can be:
- Risk assessments: These indicators give a risk of a non-sustainable property that can occur in aspecific kind of management or landscape, for instance leaching risk or erosion risk.
- Trends: These indicators can be based on time invariant indicators but they should reflectchanges in time. They will give information on the magnitude of change and the velocity ofchange. Also a stability index should be incorporated, to define optimal situations.
- Balances: These indicators do not only show the in- and outputs, but also the efficiency, forinstance water balance, nutrient balance.
In this project, different types of indicators will be evaluated.
II.3.3 Biodiversity
Several indicators have been proposed to measure or evaluate biodiversity. However, a consensuson one or more indicators is probably utopian, because biodiversity as a whole is far too vast andcomplex to summarise easily. Nevertheless, several general conditions that biodiversity indicatorsshould meet are proposed by different authors. Niëmela (2001) gives a compilation of mostoccurring conditions (Table II-4.) Table II-4. Biodiversity indicator conditions (Niëmela, 2001)
In some cases, one specific indicator, often an indicator species (e.g. Chase et al. 2000), is used toevaluate the condition of the environment or an aspect of that. However, when it comes toevaluation of general biodiversity on ecosystem level, researchers tend to promote the use of setsof indicators (e.g. multi-taxa indicator sets, Van Dijck ET al., 1999).
II.3.3.1 Indicator subset
A large amount of biodiversity indicators was identified using literature, scientific databases andinternet. Those and new indicators were included in an extensive indicator list. From this list anindicator subset was selected for further development within the project. They are presented in theframework; biodiversity indicators are covered by principles 8 to 10. Because indicators will betested, evaluated and compared during the project, the subset contains several analogous indicatorsfor the same topic. Further selection will refine and compact the framework into a final indicatorset.
II.3.4 Socio-economics
II.3.4.1 Indicator subset
The ALME team monitors indicators for different principles: (1) Economic well-being of localcommunities function of the ecosystem shall be maintained, (2) Production of Food and Rawmaterials function of the ecosystem shall be maintained, (3) Social well-being of local

Annual Scientific Report 2002-SAFE04/02/2003
10
communities function of the ecosystem shall be maintained, (4) Welfare of livestock shall bemaintained, (5) Aesthetic information function of the ecosystem shall be maintained, and (6)Recreation function of the ecosystem shall be maintained. A literature review has been carried outto identify and select suitable indicators that best reflect these principles. The indicators arepresented in the framework.
II.3.4.2 Monitoring indicators
The economic indicators values will be obtained by analysing the bookkeeping data.Bookkeepings of the last 3 years were collected and compared with average Belgian values (fromthe Centre of Agricultural Economics) to get an idea of the financial situation of each farm. Aninterview with the farmers will give additional information about economic indicators. Thisquestionnaire will also give information about the social pillars: the quality of life of the farmerand his family, the welfare of livestock. An enquiry in the local village will give more informationabout the image of agriculture.
To combine financial returns and environmental impacts, Hill (2001) developed a sustainabilityindicator at farm level, based on macro-economic sustainability indicators. The farm levelindicator of sustainability is summarised as:
ENVA = NVA – Dep. KN – Deg. KN – X + Y
where ENVA is environmentally adjusted net value added, NVA the net value added, Dep. KN andDeg. KN are depreciation allowances for the depletion and degradation of on-farm natural capital,X represents the sum of all negative environmental externalities, including the depletion anddegradation of off-farm natural capital, and Y represents the sum of all positive environmentalexternalities including non-market ecosystems service flows. For the internalisation ofexternalities, the results of the 3 other teams will be used. To assign economic values to theexternalities, measured by the other teams, different methods can be applied, for example:
1. Pretty et al. (2000) estimated the costs of erosion as the off-site costs that arise whensoil carried off farms by water or wind blocks ditches and roads, damages propertyand induces traffic accidents.
2. Bailey et al. (1999) estimated the economic value of earthworms as the difference incost between ploughing and minimal tillage practices, assuming that the differenceequates to the value of the soil structuring service provided by earthworms. In orderto calculate the economic value of nitrate lost from the agricultural system, it wasassumed that all the residue in the soil is leached from the system. The environmentaldamage cost incurred as a result of this leaching was taken to be equal to the costs oftreating the pollution. In the case of ground water this equates to the cost of removalof nitrates from the water when it is abstracted for drinking water.
3. Pesticides can affect workers engaged in their manufacture, transport and disposal,operators who apply them in the field, and the general public. Both acute and chroniceffects of pesticides warrant concern. The acute toxicity of most pesticides is welldocumented but information on chronic human illnesses resulting from pesticideexposure, including cancer, is weak and therefore it is almost impossible to calculatethe costs of chronic effects of pesticide use (Pimentel and Acquay, 1992, Pretty et al.,2000). So the costs of pesticide use can be calculated as the costs for the farmer(doctor and medical costs) and the general health system (Pretty et al., 2000).

Annual Scientific Report 2002-SAFE04/02/2003
11
4. Agricultural landscapes are the visible outcomes from the interaction betweenagriculture, natural resources and the environment, and encompass amenity, culturaland other societal values. Considering agricultural landscape as a public good, itseconomic value should be analysed as such. A possible approach is based onsurrogate markets, allowing to estimate the use value. One of the most important usevalues of the agricultural landscape is the recreational value. This can be defined asthe value people attach to the use of agricultural landscape for recreational activities,such as enjoying the silence and beauty by staying, walking, cycling and drivingthrough the countryside. An appropriate method to estimate the value of recreationalsites is the travel cost method because most of the rural tourists have to travel to enjoythe landscape (Vanslembrouck, 2002).
A logbook, kept by the farmers and the bookkeeping data will give the information to calculate theenergetic indicator values. Other information is collected in literature. For this energetic analysisall inputs and outputs of each system (parcel, farm) are defined.
II.4 Monitoring ecosystems
The first monitoring will take place before the first field campaign to characterize the startingsituation. Maps are created for spatial presentation of the situation, but we must wait till April orJune 2003 (for economic indicators) to have the result for the campain 2002.
II.5 Monitoring energy
Energy analysis provides a good supplement to economic valuation in order to identifyexternalities because energy use may also be considered as an environmental issue (Bailey et al.,1999). Energy performance of the different practices will be monitored in order to calculate theefficiency in the use of resources. The energy analysis will follow a life cycle assessment (LCA)approach. Life cycle assessment is a method to compile a total inventory, to evaluate and to assessall relevant environmental impacts (Haas et al., 2001). For the energy analysis an input/outputbalance model of the system will be made and the results will be expressed per ha of land, per tondry matter of foodstuff produced and per monetary value (Euro). This model analyses the energytransfers between the different agroecosystem components. The methodology can be applied to thefarm, considered as hierarchically organised in the following way: individual fields; individualcrops, animal breeding and whole farm (Tellarini and Caporali, 2000).
To analyse ecosystems Odum (1996) introduced the term “emergy”. Emergy is defined as theenergy of one type, i.e., solar energy, required to produce a certain good or flow. The emergy-accounting unit is solar emjoules, this unit results from the fact that every joule on earth could becarried back to the sun. The factor between the usual energy unit joules and solar emjoules is thetransformity value (Lagerberg, 2000). The environmental resource fraction that is used inagriculture without being priced or accounted for commercial purposes is in an emergy analysiscalled ‘emternality’ and its dimension is defined by the measurement of nonmarket environmentalinputs into economic processes. Emternalities are evaluated in emergy and monetary terms, theformer being a quantitative tool for valuing natural ecosystems interacting with economic systems.Emergy accounting allows evaluation of all work done or needed to produce agricultural outputs.All incoming flows (nonmarket inputs such as sun, wind, land as well as market inputs like seeds,pesticides and fuels) that contribute to agricultural products, including the final products (e.g.

Annual Scientific Report 2002-SAFE04/02/2003
12
crops or livestock), can therefore be evaluated in emjoules. The emergy analysis can be comparedwith and forms a valuable addition to an economic cost benefit analysis (Maradan et al., 2000).
The energetic analyses will be carried out at parcel and farm level. A report containing a literaturereview has been produced.
II.6 Monitoring economics
For the internalisation of external costs, a cost benefit analysis (CBA) will be used. Developmentsin modern agriculture include heavy reliance on chemical fertilisers, pesticides and herbicides, thedestruction of wildlife habitats, environmental pollution and risks to human health (Rigby et al.,2001). The costs of using the environment in this way are called externalities, because they areside effects of the economic activity and their costs are not part of the prices paid by producers orconsumers. CBA applies monetary values to all costs and benefits resulting from an action to beundertaken (Bailey et al., 1999; Park et al., 1999). Measurements of agricultural productivity asyield and direct economic profit for the farmer will be performed. The output from agriculture isconventionally measured in financial terms. Farm income, or profit, on arable farms for example,is a function of yield, crop price, area payments, and the costs directly influenced by managementvariables such as input choices and levels of fertiliser and pesticide use and cultivation practices.Conventional farm accounts are, therefore, the main criteria for measuring the financial viability ofagricultural systems (Bailey et al., 1999).
The economic analyses will be carried out at parcel and farm level. A report containing a literaturereview has been produced (see annex III).
II.7 Data management
The database management is supervised by GERU. In the first project year a project-website hasbeen created (http://www.geru.ucl.ac.be/recherche/projets/Safe/publications/index.htm) as well asa project folder for distribution. On this website a general description of the project is given,information about the project partners and information about the members of the users committee.In the future it will be possible to give more background information about the work of the teams.
An FTP-server is linked to the web-page and makes it possible for the project partners to transferand store data. All general data, as maps, information about the farms, and field information isstored on the FTP-server and can be accessed by all project partners.
For the GERU part, the data will be geo-referenced, using GPS (global positioning system). Theycan be linked to the maps available in ArcView 3.2.
II.8 Dissemination of results
Two Users’committee meetings took place in the first year. The first, on 21st May 2002, aimed atthe presentation of the project. Before the second one, on 17th October 2002, a document had beendistributed, which facilitated discussion during the meeting.

Annual Scientific Report 2002-SAFE04/02/2003
13
III INTERMEDIARY RESULTS
III.1 Experiment
The selection does not aim to be representative of the Belgian agriculture. The farms selected aremore innovative and efficient than the average. Table III-1: Farm features
Three farms are mixed, they associate milk and crop production (Table III-1), the last one isspecialised in crop production: wheat, sugar beet, chicory, meadow grass for seed production, flax,set-aside. ( annex II: aerial view of cultivated parcel..)
The alternative practices, are the following:
- Organic farming has a positive impact on the environment, except for the risk of winter nitrate.There could be difficulties for marketing, there could be an increased annual variability ofincome and this system may restrict animal welfare (forbid drugs).
- Agri-environmental measures. They consist in agreement with society for enhancing theimpact of farming practices on the environment.
- Mechanical weeding has a positive impact on wild flora diversity, water and soil quality.
- No tillage. When successfully applied, this system may reduce energy consumption, controlerosion, and respect life cycle of soil invertebrates. However, it often increases pesticide use.A good crop rotation is essential.
Clear agreements are signed by the farmers and the scientists to carry out the project on selectedsites. Economic compensations are given to farmers for time allowed to the research, samplingnamely.
III.1.1.1 Parcel selection
The measurements and monitoring of most indicators take place on all farm parcels of the foursites. But because of the time and energy consumed for some indicators, a selection of parcels wasmade for each farm. Selection was made in co-operation (GERU and ILWB team). Themeasurements and monitoring program took place on 33 selected fields of the 4 selected farms. Cf.annex III: selected parcel.
First of all the fields were selected on the basis of soil types (soil map). The fields with anacceptable homogeneity of soil type were selected to make fieldwork activities easier.
The second criterion was the crop type. Maize and grassland were chosen as the most importantcrop types on the four farms. Although these crops were not available on the arable farm; for thisfarm, selection was made on land use history.
III.2 Farming system
A first selection of indicators is presented below. If necessary, indicators from the literature areadapted to Belgian pedo-climatic and socio-economic conditions.
Annual Scientific Report 2002-SAFE04/02/2003
14
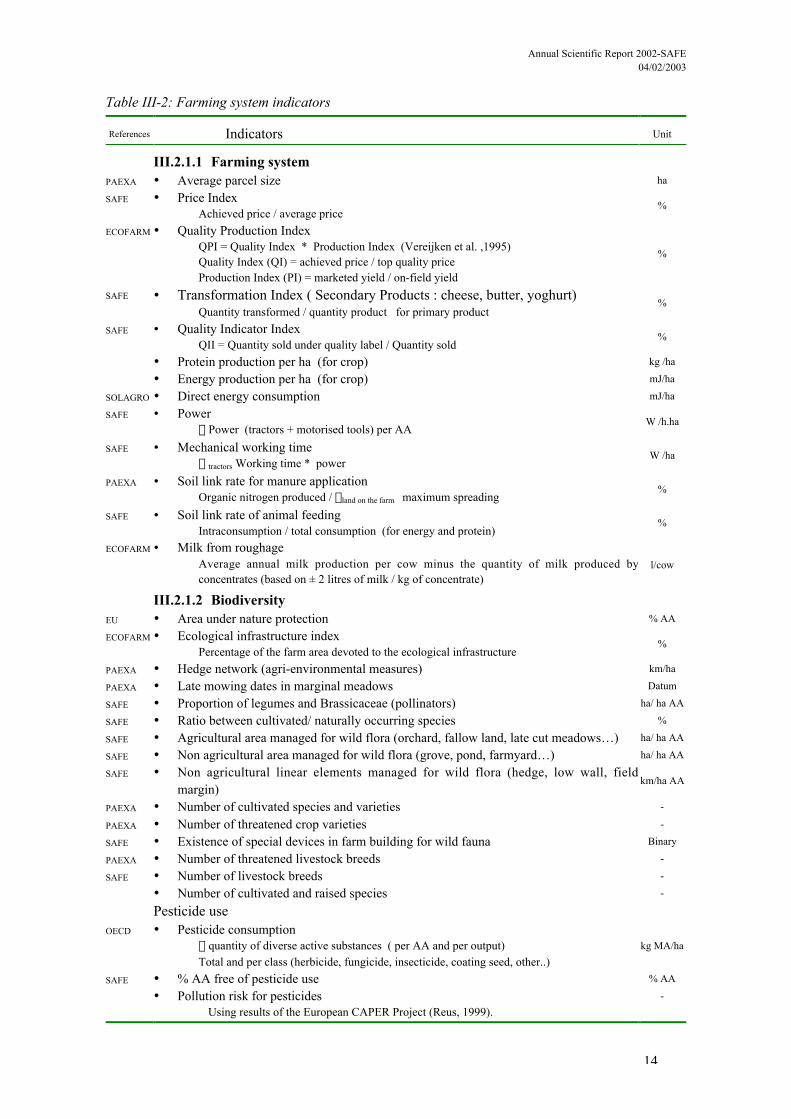
Table III-2: Farming system indicators
References Indicators Unit
III.2.1.1 Farming systemPAEXA • Average parcel size ha
SAFE • Price IndexAchieved price / average price
%
ECOFARM • Quality Production IndexQPI = Quality Index * Production Index (Vereijken et al. ,1995)Quality Index (QI) = achieved price / top quality priceProduction Index (PI) = marketed yield / on-field yield
%
SAFE • Transformation Index ( Secondary Products : cheese, butter, yoghurt)Quantity transformed / quantity product for primary product
%
SAFE • Quality Indicator IndexQII = Quantity sold under quality label / Quantity sold
%
• Protein production per ha (for crop) kg /ha
• Energy production per ha (for crop) mJ/ha
SOLAGRO • Direct energy consumption mJ/ha
SAFE • PowerS Power (tractors + motorised tools) per AA
W /h.ha
SAFE • Mechanical working timeS tractors Working time * power
W /ha
PAEXA • Soil link rate for manure applicationOrganic nitrogen produced / Sland on the farm maximum spreading
%
SAFE • Soil link rate of animal feedingIntraconsumption / total consumption (for energy and protein)
%
ECOFARM • Milk from roughageAverage annual milk production per cow minus the quantity of milk produced byconcentrates (based on ± 2 litres of milk / kg of concentrate)
l/cow
III.2.1.2 BiodiversityEU • Area under nature protection % AA
ECOFARM • Ecological infrastructure indexPercentage of the farm area devoted to the ecological infrastructure
%
PAEXA • Hedge network (agri-environmental measures) km/ha
PAEXA • Late mowing dates in marginal meadows Datum
SAFE • Proportion of legumes and Brassicaceae (pollinators) ha/ ha AA
SAFE • Ratio between cultivated/ naturally occurring species %
SAFE • Agricultural area managed for wild flora (orchard, fallow land, late cut meadows…) ha/ ha AA
SAFE • Non agricultural area managed for wild flora (grove, pond, farmyard…) ha/ ha AA
SAFE • Non agricultural linear elements managed for wild flora (hedge, low wall, fieldmargin)
km/ha AA
PAEXA • Number of cultivated species and varieties -
PAEXA • Number of threatened crop varieties -
SAFE • Existence of special devices in farm building for wild fauna Binary
PAEXA • Number of threatened livestock breeds -
SAFE • Number of livestock breeds -
• Number of cultivated and raised species -
Pesticide useOECD • Pesticide consumption
S quantity of diverse active substances ( per AA and per output)Total and per class (herbicide, fungicide, insecticide, coating seed, other..)
kg MA/ha
SAFE • % AA free of pesticide use % AA
• Pollution risk for pesticides -
Using results of the European CAPER Project (Reus, 1999).

Annual Scientific Report 2002-SAFE04/02/2003
15
The methodology uses a risk ratio approach, i.e. the ratio between exposure (theconcentration in an environmental compartment: surface water, groundwater, air or soil)and toxicity for relevant organisms. Concentrations are determined by calculations,which take into account differences in environmental conditions and applications factors.
For groundwater and surface water: SyPEP, System for predicting the EnvironmentalImpact of Pesticides : L. Pussemier, CERVA Belgium
For air : IPEST, Pesticide environmental impact indicator: van der Werf &Bockstaller, INRA France
For soil: SYNOPS_2, Gutsche & Rossberg, BBA, Germany
III.2.1.3 FertilisationEU • Organic and inorganic fertiliser consumption
Nitrogen, phosphorus and potassium consumption ( per ha and per kg output)U/ha and
U/kg
ECOFARM • Nitrogen annual balance (input-output) kg N/Year
ECOFARM • Phosphorus annual balance (input-output) kg P/Year
ECOFARM • Potassium annual balance (input-output) kg K/Year
III.2.1.4 Crop managementSAFE • Crop varieties adapted for local condition Binary
SAFE • Sowing densitySowed quantity / average advise quantity (function of datum)
%
SAFE • Adequate input use in relation with yield target Binary
Realistic yield target (achievable every second year) Binary
PAEXA • Good fertilisation practicesResults of a list of questions, response binary, % for relevant point and surface
%
PAEXA • Good crop protection practicesResults of a list of questions, response binary, % for relevant point and surface
%
Safe • Crop rotation indexCrop rotations influence plant production by affecting soil fertility and survival plantpathogens, physical properties of soils, soil erosion, soil microbiology, and prevalence ofnematodes, insects, weeds, earthworms and phytotoxins (Sumner, 1982)Inspired by Viaux (1999), the rotation index takes into account the preceding crop, thetime interval between two croppings of a plant on the same parcel. It quantifies the risksand advantages concerning :
- Crop protection
- Nitrogen management
- Weed control - Alternation of crops with different root systems
-
SAFE • Legumes cover %
• Minimum tillage techniques Binary
III.2.1.5 Breeding management• Consumption index -
PAEXA • LU/ fodder area LU /ha
• Disease indexS disease / animal . year (caesarean = 1 disease)
%
OECD • Use of anti helminthic products for cattle Binary
Soil and water• Water consumption for milk production
Quantity water consumption (breeding + washing)/ Quantity milk productionl Water / l
Milk
SAFE • Soil potentially exported at harvest (indirect measurements) kg /ha
SAFE • Anti-erosion practices indexTakes into account of tillage orientation, tillage techniques, crop index for erosion risk,parcel size, ..
-
PAEXA • River length protected %
SAFE • Existence of a device for avoiding river pollution by animals Binary
SAFE • Existence of anti-erosion techniquess Binary
PAEXA • Storage capacity (Slurry) Month
Annual Scientific Report 2002-SAFE04/02/2003
16
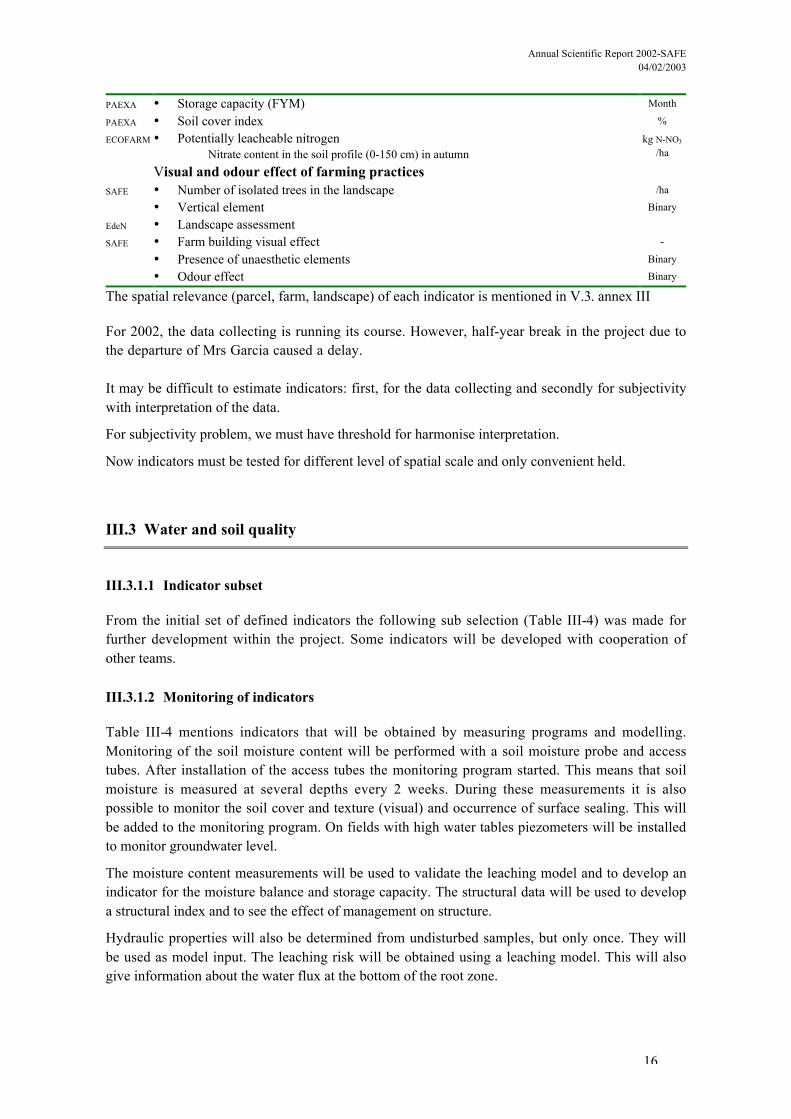
PAEXA • Storage capacity (FYM) Month
PAEXA • Soil cover index %
ECOFARM • Potentially leacheable nitrogenNitrate content in the soil profile (0-150 cm) in autumn
kg N-NO3
/ha
Visual and odour effect of farming practicesSAFE • Number of isolated trees in the landscape /ha
• Vertical element Binary
EdeN • Landscape assessmentSAFE • Farm building visual effect -
• Presence of unaesthetic elements Binary
• Odour effect Binary
The spatial relevance (parcel, farm, landscape) of each indicator is mentioned in V.3. annex III
For 2002, the data collecting is running its course. However, half-year break in the project due tothe departure of Mrs Garcia caused a delay. Table III-3 Example of provisional results (ex: SARTfarm).It may be difficult to estimate indicators: first, for the data collecting and secondly for subjectivitywith interpretation of the data.
For subjectivity problem, we must have threshold for harmonise interpretation.
Now indicators must be tested for different level of spatial scale and only convenient held.
III.3 Water and soil quality
III.3.1.1 Indicator subset
From the initial set of defined indicators the following sub selection (Table III-4) was made forfurther development within the project. Some indicators will be developed with cooperation ofother teams. Table III-4. Indicators for further development.
III.3.1.2 Monitoring of indicators
Table III-4 mentions indicators that will be obtained by measuring programs and modelling.Monitoring of the soil moisture content will be performed with a soil moisture probe and accesstubes. After installation of the access tubes the monitoring program started. This means that soilmoisture is measured at several depths every 2 weeks. During these measurements it is alsopossible to monitor the soil cover and texture (visual) and occurrence of surface sealing. This willbe added to the monitoring program. On fields with high water tables piezometers will be installedto monitor groundwater level.
The moisture content measurements will be used to validate the leaching model and to develop anindicator for the moisture balance and storage capacity. The structural data will be used to developa structural index and to see the effect of management on structure.
Hydraulic properties will also be determined from undisturbed samples, but only once. They willbe used as model input. The leaching risk will be obtained using a leaching model. This will alsogive information about the water flux at the bottom of the root zone.
Annual Scientific Report 2002-SAFE04/02/2003
17
Erosion risk will also be developed as an indicator, using an erosion model and when necessaryadditional field measurements. Another important erosion type can be tillage erosion and harvesterosion. Tillage erosion can be modelled in some models, and when possible it will also be takeninto account. Harvest erosion, that can be enormous with root crops and moist conditions duringharvest, can also be taken into account but using data from the farmers.
Together with ECOP the nutrient balance will be established and nutrient concentrations in thesoils will be measured. A complete nitrate profile will be measured as validation/calibration for theleaching model. Other soil characteristics as texture, structure, CEC, organic matter content will bemeasured and subsequently indicators for these characteristics will be developed. Managementinformation will be obtained with a farmer’s log.
For a more detailed monitoring scheme we refer to the administrative report.
III.3.1.3 Preliminary results
Soil samples are being processed for determination of hydraulic properties. These hydraulicproperties will be used as model input. The measurements are not complete and therefore can notbe represented in this report. Although, the measurements give also other information, for exampleporosity. Porosity is also mentioned as an indicator and the percentage of larger pores givesinformation about the possibility of rapid water movement through the soil. The porosity and thepercentage of pores larger than 50µm for some fields in Ternat, are presented in Figure III-1.Figure III-1. Percentage of small pores (<50µm) and Percentage of larger pores (>50µm)In Figure III-1 soil 6 and soil 9 are dry loamy soils and the other 2 fields are humid loamy soils.The land use on field 6 and 40 are permanent grassland. Field 9 is in use as temporary grasslandand field 22 is a piece of fallow/nature land. A, B and C are the defined horizons.
The monitoring of the soil moisture content gives information on the soil moisture profiles. Somesoil moisture profiles of the farm in Ternat, are presented in Figure III-2. Figure III-2 gives for 2soil types and 3 management types the measured soil moisture profile on 3 different days. It mustbe noted that the probe is not calibrated for the presented soil types, but that will be done in thenear future. These graps give only an indication of the profile at the moment.Figure III-2. Soil moisture profiles measured in Ternat.The results presented here are preliminary results, because measurements are still in progress.However they give an indication about the presented soil properties.

Annual Scientific Report 2002-SAFE04/02/2003
18
III.4 Biodiversity
III.4.1.1 Monitoring of the indicators
The indicator values mentioned in the framework will be obtained by measuring programs, aminor part by modelling.
The biodiversity indicators can roughly be divided into four main categories: vascular flora,butterflies, earthworms and landscape elements. For all categories, data collection will bedifferent.
Most of the indicators dealing with flora are calculated from vegetation surveys. Therefore in thefour sites detailed surveys of occurring plant species and their respective coverage were made.This was done both on the parcels and on the parcel margins. Most of the farm parcels, and somereference parcels outside the farm area, were visited during the period June-July 2002. In August2002, some additional surveys were done, other parcels were surveyed a second time. A total of 91parcels and 570 margins were investigated. Details per site are given in Table III-5.Table III-5: Details of parcels and margins per siteAn inventory of butterflies was made using a census transect method. Per site a transect wasdivided into sections. Butterfly species and numbers were counted per section. We encounteredmethodological problems because of the low number of butterflies. To obtain interpretable results,numbers should be higher, or replications (transect visits) should be increased to a practicallyinfeasible number.
Earthworm surveys were done in October-November 2002 because earthworm activity is highestin this period. The method consists of a formaldehyde treatment of 6 quadrats per parcel, followedby handsorting of a soil sample per quadrat. Species were determined in the laboratory andbiomass per species was calculated. The data set consist of a total of 145 subsamples(formaldehyde and soil samples).
Indicators concerning landscape elements are calculated indirectly from geographic data.Therefore digital ‘landscape structure maps’ were made, based on all available (digital) maps (e.g.topographic maps, orthofoto maps, land use maps, …) containing useful information. Thelandscape structure maps can be used to derive indicators concerning point, line and/or polygonelements and measures like isolation and connectivity.
Preliminary results
All fieldwork data are imported in a MS Access database for further analysis. Geographic data,like the landscape structure maps, are stored in a geographical database (ArcView). A connectionbetween the two databases was established, to be able to perform spatial analysis on relational data(Figure III-3). Figure III-3 Example of the connection between relational (species diversity) and geographical (landscape structure map) data. Height of blue bars represent relative plant species diversity.
Because measurements only finished very recently, only few results of the analysis can be shownat this time. Based on the floristic surveys, species lists were built per parcel and per margin.Descriptive statistic measures were calculated, like ‘mean floristic diversity’ per parcel and perborder. Results are shown graphically in Figure III-4. All other data are still being processed.Results are expected in the coming months. Figure III-4 Mean floristic diversity per parcel includingmargins (a) and per margin (b) for the four sites.
As stated before, butterfly numbers were too low to be interpretable. Figure III-5 shows meanbutterfly numbers per section counted on 5 transect visits in the period May-June 2002. Figure III-5 Mean butterfly number per section counted on 5 transect visits in Peer.

Annual Scientific Report 2002-SAFE04/02/2003
19
IV PERSPECTIVES
IV.1 Farming system
The data collection and the testing of indicators will be continued in 2003. For 2 regions,additional farms will be studied in order to get more information on regional reference values inconventional agriculture.
Activities of the second year of research:
- Indicators:
o When feasible, norms will be defined (threshold value that allow the ecosystem toperform the different functions). The values can locally vary.
o Information about the reaction time of indicators will be collected.
o For each selected indicator information will be collected on difficulty, precision,replicability, time and cost.
o Landscape level, collecting data
- Response evaluation:
o The difference between the norm and the value of each indicator will be estimatedand interpreted within a future multifunctional analysis.
o First exploration for interpretation approaches defined in the project: qualitative,quantitative and graphic techniques.
IV.2 Water and soil quality
The farms were selected on alternative management practices. With the set-up of our experimentswe expect to find good indicators that reflect not only the effect of soil properties but also theeffect of management. A good indicator should reflect both natural conditions and managementinfluence.
On the first farm (FAUV) it should be possible to see changes occur. Although, the most importantcrop is grassland, it should be possible to see some changes during the project because the shift toorganic farming is rather recent. Pesticides and chemical fertilisers are not used, which will first ofall lead to less leaching of pesticides and nutrients. Organic fertilisers are used, which can stillresult in leaching of nutrients, but the leaching risk will probably be much lower than underconventional tillage. The use of only organic fertilisers will also increase soil properties as CEC,structure aggregates and result in better infiltration, diminishing surface water runoff. Althoughploughing of temporary grassland and arable land will speed up the SOM turnover, high levels ofSOM are expected on this farm.
On the second farm (SART), we expect to find also high SOM contents with more favourable soilconditions due to 15 years of using cover crops in winter and minimal tillage. The effect ofdifferent crops and their subsequent pesticide use should be reflected in different soil properties.

Annual Scientific Report 2002-SAFE04/02/2003
20
Due to the high SOM content and the improved structure, erosion risk should be less than atcomparative soils without minimum tillage and cover crops.
The farm with mechanical weeding (TERN) will show the effect of breaking the topsoil severaltimes. It is expected that this will influence the structure of the topsoil. Turnover of SOM isexpected to be higher in the top layer due to tearing the surface layer. This technique will haveeffect on the leaching risk, due to less pesticide use.
The last farm (PEER) can, to some extent, be used as a reference farm. The problem here is that itis situated on an other soil type than the other farms. But it also gives the effect of soil type onsustainability. Leaching will be a large problem on this sandy soil, with high groundwater levels.
IV.3 Biodiversity
Within the setup of our research we expect to find biodiversity indicators that reflect not only theeffect of abiotic conditions but also agricultural practices.
Earthworms are expected to be not only indicators for (soil) biodiversity, but also soil propertiesand agricultural practices, like tillage, pesticide use … and this on a small (parcel) scale level.
Floristic indicators will reflect abiotic conditions like soil and hydrologic properties, but alsoagricultural characteristics like land use, herbicide use, intensity, rotation, … Scale level for floradiversity varies from parcel to ecosystem level.
Landscape indicators will reflect landscape structure, which is together with the habitat patchcharacteristics one of the main driving forces for ecosystem biodiversity. Configuration of theparcels, barriers, corridors, … determine colonisation possibilities for most plant and animalspecies. Habitat patch characteristics – the ‘quality’ of the parcels – measured with the otherindicators determine the survival and/or extinction chance for plant and animal species. Theinteraction between extinction and colonisation will determine the sustainability of the ecosystembiodiversity.
We will have to re-evaluate the feasibility of butterfly indicators. Because of methodologicalproblems (numbers too low), it might be considered to select another taxon for next year’smonitoring programme.
IV.4 Socio-economics
An interview, that will give additional information about the economic and energetic indicatorsand the necessary information for the social indicators will be held at each farm inJanuary/February 2003 because the farmers have more time during the winter. This interview willbe repeated at the beginning of 2004. The bookkeepings of 2002 will be available at the beginningof 2003. These bookkeeping data, the information from the questionnaire, the logbook and theresults from the other teams will be used to obtain the socio-economic and energetic indicatorsvalues for 2002. Results of the energetic/emergy analysis will be compared with the economiccost/benefit analysis.

Annual Scientific Report 2002-SAFE04/02/2003
21
V ANNEXES
V.1 References
Altieri, M.A., 1995. Agroecology, the science of sustainable agriculture.Ed. Westview Press.
Arshad, M.A. and S. Martin, 2002. Identifying critical limits for soil quality indicators in agro-ecosystems. Agriculture, ecosystems and environment 88: 153-160.
Bailey, A. P.; Rehman, T.; Park, J.; Keatinge, J. H. D & Tranter, R.B., 1999. Towards a method for theeconomic evaluation of environmental indicators for UK integrated arable farming systems. Agriculture,Ecosystems and Environment 72: 145-148.
CBD, Convention on Biological Diversity, 1992. Convention Text. Article 2: Use of terms.
Reus, J.; Leenderste, P.; Bockstaller, C.; Fomsgaard, I.; Gutsche, V.; Lewis, K.; Nilsson, CC.; Pussemier, L.;Trevisan, M.; van der Werf, H.; Alfarroba, F.; Blümel, S.; Isart, J.; McGrath, D.; Seppälä, T., 1999.Comparing environmental risk indicators for pesticides. Results of the European CAPER Project. Centre foragriculture and environment. Utrecht, july1999.
Chase, M.K.; Kristan, W.B.; Lynam, A.J.; Price, M.V.; Rotenberry, J.T., 2000. Single species as indicatorsof species richness and composition in California coastal sage scrub birds and small mammals. ConservationBiology 14: 474 – 487.
Couvreur, J.-M.; Maljean J.-F.; Rensonnet, M.; Colomb, P. et Peeters, A. en impression. EdeN, uneméthode d’evaluation et de développement de la nature et du paysage à l’échelle locale. Laboratoired’Ecologie des Prairies – GIREA. Université Catholique de Louvain, Faculté de sciences agronomique,Louvain-La-Neuve.
de Groot, R.S.; Wilson, M.A.; and Boumans, R.M.J., 2002. A typology for the classification description andvaluation of ecosystem functions, goods and services. Accepted for publication in Ecological Economics(May 2002)
Doran and Parking, 1994. Defining and assessing soil quality. In: Defining soil quality for a sustainableenvironment, SSSA Special publication number 35, Madison, Wisconsin, USA.
Haas, G.; Wetterich, F. & Köpke, U., 2001. Comparing intensive, extensified and organic grassland farmingin southern Germany by process life cycle assessment. Agriculture, Ecosystems and Environment 83: 43-53.
Health and Safety Executive, 1998. Pesticide users and their health: results of HSE’s 1996/7 feasibilitystudy, http://www.open.gov.uk/hse/hsehome.htm.
Hill, G.W.; 2001. Measuring farm-level sustainability: An integrated environmental and economicaccounting approach. Paper presented at the Agricultural Economics Society Annual Conference, HarperAdams University College.
Hinrichsen, D.; 1997. Cómo ganar la carrera de la alimentación. Population Reports, Serie M, No. 13.Baltimore, Johns Hopkins School of Public Health, Population Information Program, diciembre de 1997.http://www.jhuccp.org/prs/sm13/sm13chap3.stm#tophttp://odin.dep.no/ld/engelsk/multifunctionality/index-b-n-a.htmlhttp://www.biodiv.org/convention/articles.asp?lg=0&a=cbd-02

Annual Scientific Report 2002-SAFE04/02/2003
22
Lagerberg, C., 2000. Using the best of the best, some thougts on the integration of environmental assessmenttools. Advances in energy studies: exploring supplies, constraints and strategies. Ulgiati, S.; Brown, M.T.;Giampietro, R.A.; Herendeen R.A.& Mayumi, K. (eds.), Porto Venere, p. 591-596.
Lambert, R.; Van Bol, V.; Maljean, J.F.; Peeters, A., 2002. « PROP’EAU-SABLE ». Recherche-action envue de la préparation et de la mise en œuvre du plan d’action de la zone des sables bruxelliens en applicationde la directive européenne CEE/91/676 (nitrates) - Rapport final d’activités mars 1997- mars 2002,Ministère de la Région Wallonne, DGRNE. UCL, Laboratoire d’Ecologie des Prairies. 107p.
Lammerts van Bueren & Blom, 1997. Hierarchical framework for the formulation of sustainable forestManagement Standards. Principles, Criteria and Indicators. Tropenbos, The Netherlands, 82pp
Larson, W.E. and F.J. Pierce, 1991 Conservation and enhancement of soil quality. In: Evaluation forsustainable land management in the developing world vol 2. ISBRAM proc 12(2). Int. Board for soilresources and management. Bangkok, Thailand
Maradan, D.; Pillet, G.& Niederhäuser-Zingg, N.; 2000. Appraising externalities of the Swiss agriculture, acomprehensive view”. Advances in energy studies, exploring supplies, constraints and strategies, Ulgiati, S.;Brown, M.T.; Giampietro, M.; Herendeen, R.A. & Mayumi, K. (eds.), Porto Venere , p. 501-512.
Niëmela, J. (2001) To what extent biodiversity of forests can really be measured? In: Life cycle assessmenton forestry and forest products, European Commission.
Norwegian Ministry of Agriculture, 2000. WTO and Multifunctionality.
Odum, H.T., 1996. Environmental Accounting, John Wiley and Sons, New York, 370 p.
OCDE, 2001. Indicateurs environnementaux pour l’agriculture, Méthodes et résultats. Volume 3, 439 p.
Park, J.; Bailey, A.; Yates, C.; Keatinge, J.H.D.; Rehman, T. & Tranter, R.B., 1999. Do integrated arablefarming systems provide a more sustainable form of agricultural production in the UK. Farm Management10: 379-391.
Peeters, A. and Van Bol, V. 2000. ECOFARM: A research/development method for the implementation ofsustainable agriculture. Methods and tools of extension for mountain farms. 41-56. FAO/CIHEAM,Interregional Cooperative Research and Development Network for Pastures and Fodder Crops. Edited byAlain Peeters.
Pointereau, P.; Bochu, J.L.; Doublet, S.; Meiffren, I.; Dimkic, C.; Schumaker, W.; Backhausen, J.;Mayrhofer, P.; 1999. Le diagnostic agri-environnemental pour une agriculture respectueuse del’environnement. Trois méthodes passées à la loupe. Travaux et Innovations. Société Agricole et Ruraled’Edition et de communication, Paris, France.
Pannell, D.J. and Glenn, N.A. 2000. Framework for the economic evaluation and selection of sustainabilityindicators in agriculture. Ecological Economics 33: 135-149
Pimentel, D. & Acquay, H., 1992. Environmental and economic costs of pesticide use. Bioscience 42 (10):750-761.
Pretty, J.N.; Brett, C.; Gee, D.; Hine, R.E.; Mason, C.F.; Morison, J.I.L.; Raven, H.; Rayment, M.D. & vander Bijl, G., 2000. An assessment of the total external costs of UK agriculture. Agricultural Systems 65: 113-136.
Rigby, D. & Caceres, D., 2001. Organic farming and the sustainability of agricultural systems. AgriculturalSystems 68: 21-40.

Annual Scientific Report 2002-SAFE04/02/2003
23
Rossier, D. 1999. L’écobilan, outil de gestion écologique de l’exploitation agricole. Revue suisse Agric. 31(4) : 179
Sumner 1982
Tellarnini, V. & Caporali, F., 2000. An input/output methodology to evaluate farms as sustainableagroecosystems: an application of indicators to farms in central Italy. Agriculture, Ecosystems andEnvironment 77: 111-123.
Van Bol, V. 2000. Azote et agriculture durable, approche systémique en fermes pilotes. Thèse de doctorat.UCL, Laboratoire d’Ecologie des prairies, Louvain-La-Neuve. 153 p.
Van Bol et al., 1998. Indicateurs et normes économiques, sociologiques et agronomiques des systèmes deproduction agricole durable. SAFE “Sustainable Aspects of farming and Environment”. Rapport final. UCL,Laboratoire d’écologie des prairies, CLO/GENT, AGRO/UCL, FSA/UCL, FUL, 1998, 80p .
Van der Werf, H.M.G. and Petit, J. 2002. Evaluation of the environnemental impact of agriculture at thefarm level: a comparaison and analysis of twelve indicator-based methods. Agriculture Ecosystems &Environnement, 93(3)
Van Dyck, H.; Gysels, J.; Maes, D., 1999. Multi-soortenmonitoring. Naar een efficiënt gebruik van soortenin het Vlaams natuurbehoud. Landschap 4: 265-271
Vanslembrouck, I., 2002. Economic assessment of landscape amenities provision by farmers. PhD thesis,University of Gent.
Verijken, P.; 1997. A methodical way of prototyping integrated and ecological arable farming systems(I/EAFS) in interaction with pilot farms. European Journal of agronomy 7: 235-250.
Wascher, D.W. (ed.). Agri-environmental indicators for sustainable agriculture in Europe. –Tilburg:European Centre for Nature Conservation, 2000. – (ECNC Technical report series)
WCDE – World Commission on Development and Environment 1987. Our Common Future. OxfordUniversity Press; Oxford, UK
www.caece.edu.ar/investigacion/documentos/BIOPAMP2.DOC