frame report 2019/20 budget - province of manitoba
TRANSCRIPT

FRAME REPORT 2019/20 BUDGET

FRAME REPORT 2019/20 BUDGET
Manitoba Education Schools' Finance Branch Robert Fletcher Building
511-1181 Portage Avenue Winnipeg, Manitoba, CANADA
R3G 0T3 Tel.: 204-945-6910
April 2020
Ce document existe également en français
This document is available on the Internet in both PDF and Excel formats at: HUhttp://www.edu.gov.mb.ca/k12/finance/frame_report/ U


UTABLE OF CONTENTS PROVINCIAL CONTRIBUTION TO PUBLIC EDUCATION i
FORWARD AND INTRODUCTION ii
EXPENSE DEFINITIONS iii
0BGLOSSARY OF TERMS iv
EXPLANATORY NOTES vi
1BHISTORICAL STATISTICS AND RECONCILIATION OF EXPENSES
Public Schools in Manitoba Enrolment 1968-2018 (graph) ............................................................................. 1 Operating Fund Expenses Current and Constant Dollars 1998/99-2019/20 (graph) ...................................... 2 By Division - Reconciliation of Expenses ......................................................................................................... 3 Operating Fund Expense per Pupil 2018/19, 2019/20 ..................................................................................... 4 Operating Fund Expense per Pupil 2019/20 (graph) ...................................................................................... 5
2BPUPIL STATISTICS
FRAME Student Statistics - September 30, 2019 ............................................................................................ 6 Enrolments - Headcount, FRAME and Eligible – actual and estimates at September 30 ............................... 8 FRAME Pupil/Teacher Ratios - September 30, 2019 ...................................................................................... 9
OPERATING FUND ANALYSIS
Total Expense by Function and Object .......................................................................................................... 10 Expense by Object (graph) ............................................................................................................................ 11 Total Expense by 2nd Level Object ............................................................................................................... 12 Expense by Function (graph) ......................................................................................................................... 14 By Division - Analysis of Expense by Function .............................................................................................. 15 By Division - Analysis of Expense by Program .............................................................................................. 18 By Division - Analysis of Transportation Expenses ....................................................................................... 34 By Division - Analysis of Operations and Maintenance
Expenses for School Buildings ................................................................................................. 36 By Division - Analysis of Information Technology Expenses ......................................................................... 37 Revenue by Source (graph) ........................................................................................................................... 39 By Division - Summary of Operating Fund Revenue ..................................................................................... 40 By Division - Analysis of Operating Fund Revenue ....................................................................................... 41
3BTRANSFERS TO CAPITAL FUND .................................................................................................................. 44
4BASSESSMENTS AND LEVIES
By Division - Portioned Assessment - Other and Education Support Levy ................................................... 45 By Division - Special Levy Mill Rates (graph) ................................................................................................ 46 By Division - Total Portioned Assessment, Special Levy and Mill Rates ...................................................... 47 By Division - Net Special Levy ....................................................................................................................... 48 By Division - Assessment per Resident Pupil (graph) ................................................................................... 49 By Division - Local Taxation and Assessment per Resident Pupil ................................................................ 50
6BUAPPENDIX
By Division - Funding of Schools Program Detail .......................................................................................... 51 By Division - Administration Expenses .......................................................................................................... 56 By Division - Full Time Equivalent Personnel Employed ............................................................................... 58 By Division - Direct Support to Pupils ............................................................................................................ 59 By Division - Statistical Summary .................................................................................................................. 60


PROVINCIAL CONTRIBUTION TO PUBLIC EDUCATION
2019/2020 ($ millions)
Total Expenditure Provincial Provincial
on Public Education Contribution Contribution as %
1 FRAME Operating Fund $2,505.5 $1,472.5 58.8%
2 School division capital (net transfers to capital fund) 21.1 - -
3 Provincial Capital Grant Funding and Other 119.3 119.3 100.0%
4 Manitoba Education Property Tax Credit (1)
n/a 138.5 100.0%
5 Farmland School Tax Rebate n/a 45.7 100.0%
6 School Tax Assistance for Tenants and Homeowners (55+) n/a 0.9 100.0%
7 Teachers' Retirement Allowances Fund 314.8 314.8 100.0%
Adjusted Total $2,960.7 $2,091.7 70.7%
(1) The portion of the Education Property Tax Credit (EPTC) delivered through the income tax system. Total EPTC is
$349.6 million. See page 41 for more information.
Source:
1 FRAME 2019/2020 Budget, page 3 and 41
2 FRAME 2019/2020 Budget, page 44
3 2019/2020 Funding Announcement, February 2019
4 Manitoba 2019 Estimates of Expenditure for the fiscal year ending March 31, 2020
5 Manitoba 2019 Estimates of Expenditure for the fiscal year ending March 31, 2020
6 Manitoba 2019 Estimates of Expenditure for the fiscal year ending March 31, 2020
7 Department of Finance
The total cost of public education in Manitoba includes direct expenditures for the operation of schools (e.g. educator and
administrator salaries, teaching supplies, pupil transportation, utilities, building maintenance) and capital expenditures for
school building construction and major building repairs and renovations. Also included are provincial expenditures for
pensions for retired teachers and the provincial education tax credit programs for homeowners, tenants and farmers which
results in reduced property tax bills. The total provincial contribution to public education accounts for 70.7% of the total of
these expenditures.
i

ii
FORWARD The Financial Reporting and Accounting in Manitoba Education system, more commonly known as FRAME, provides school divisions with a standardized method of accounting and financial reporting. This, in turn, provides province-wide data which can be used by school division management, Manitoba Education and Training, or interested third parties. The analysis contained in this report is based upon financial and statistical information submitted by school divisions. While verification procedures have resulted in some correcting adjustments to the data, the Schools' Finance Branch of Manitoba Education cannot guarantee complete accuracy. INTRODUCTION FRAME uses a multidimensional accounting coded structure, which allows Expenses to be reported by three main funds: Operating, Capital and Special Purpose. Within the Operating Fund, Expenses are further sub-divided into nine Functions, which cover everything from Regular Instruction to Operations and Maintenance. Inside individual functions, Expenses can be analysed by either Program or Object. Programs refer to the different sub-sets of programs offered within a function, for example the English Language section of Regular Instruction. Objects refer to those items that make up a program such as Salaries or Employee Benefits. This same structure is used in the design of the summaries included in this report. Only the Operating Fund is presented in this Report, as school divisions are not required to submit budgets for the Capital and Special Purpose Funds. For more information, refer to the definitions of expenses by function, the glossary of other terms used in this report and the additional explanatory notes that follow.

iii
EXPENSE DEFINITIONS
Operating Fund – consists of the nine functions defined below: Function 100 - Regular Instruction - Consists of costs related directly to the K–12 classroom, e.g. teachers, educational assistants, textbooks, related supplies, services, and equipment such as desks, chairs, tables, audio-visual equipment and computers. Includes costs related to Gifted students, International Baccalaureate, Advanced Placement, university offered and correspondence courses, and enrichment activities that are generalized in nature. Also includes school-based administration costs including principals, vice-principals, and support staff. Summer school costs are also included. Function 200 - Student Support Services - Consists of costs specifically related to students who have exceptional learning needs, as well as counselling and guidance and resource costs for all students. Students with exceptional learning needs are students who have physical, cognitive, sensory or emotional/behavioural disabilities. Costs include special education and resource teachers, special needs educational assistants, counsellors, clinicians, and related and appropriate services (e.g. occupational therapists), supplies, textbooks, materials, equipment, and software. Special education coordinators or student services administrators and clerical staff are also included. Function 300 - Adult Learning Centres - Consists of costs related to Adult Learning Centres (ALC) owned and operated by school divisions, including “hybrid” facilities that serve both adults and regular K–12 students. ALC's offer adult centred programs in which adult education principles and practices are applied to curriculum and program delivery. Does not include costs associated with adults in the regular classroom. Also, does not include costs associated with ALC's that are governed by their own board of directors. Function 400 - Community Education and Services - Consists of costs related to providing services (such as community use of facilities and gym rentals) and non-credit courses to community groups and individuals. Includes pre-kindergarten education. Function 500 - Divisional Administration - Consists of costs related to the administration of the school division including the board of trustees and the superintendent’s and secretary-treasurer’s departments. Function 600 - Instructional and Other Support Services - Consists of costs related to support services for students, teaching staff, and the educational process, such as libraries/media centres, professional development, and curriculum consulting and development. Function 700 - Transportation - Consists of all costs, including supervisory and clerical personnel, related to the transportation of pupils. Does not include the purchase of school buses over $20,000 per unit as they are recorded in the Capital Fund. Function 800 - Operations and Maintenance - Consists of all costs, including supervisory and clerical personnel, related to the upkeep, maintenance, and minor repair of all school division buildings and grounds. Includes utilities, taxes, insurance, and supplies. Does not include capital costs. Function 900 - Fiscal - Consists of short-term loan interest, bank charges, bad debt expenses and the Health and Post Secondary Education Tax Levy. Note: Capital costs are not included in Operating Fund functions. See definition of Capital Fund in the Glossary of Terms (page iv).

iv
GLOSSARY OF TERMS Capital Fund - consists of all transactions related to tangible capital assets, including debenture debt and amortization. The Capital Fund is no longer included in this Report as school divisions are no longer required to prepare Capital budgets. CPI – consumer price index as determined by Statistics Canada. The CPI is a measure of the average percentage change over time in the cost of a fixed basket of goods and services purchased by Canadian consumers. Dual Track – Refers to schools in which more than one language program (English, Français, French Immersion or Other Bilingual) is offered, and where none of the programs alone comprise 90% or more of the total Regular Instruction enrolment. Includes cost of Regular Instruction for all students in these schools. Education Support Levy (ESL) – the provincial levy collected on commercial property for education funding purposes. The Education Support Levy, combined with funds from general revenues, comprises total provincial funding to public schools. 5BExpense Classifications UObject U - (what was purchased) - a service or commodity obtained as the result of a specific expense (e.g. salaries, supplies). UFunction U - (why an object was purchased) - describes very broadly the services provided by school divisions. UProgram U - each function is comprised of a number of programs which relate the principal operations to the broad functions. FTE - full time equivalent means pupils are counted on the basis of time attending school (i.e. kindergarten students are counted as one half and adults are counted according to percentage of time attending). Information Technology Equipment – Expenses, including rentals and leases, for computer hardware, operating system software and software bundled with the computer, and computer related peripherals such as printers, scanners, CD ROM writers/players, monitors, modems, routers, Local and Wide Area Network components. Also includes equipment that is part of a one or two-way multi-site video delivery system such as TV, VCR, microwave transmitter, satellite receiver, switching controls and video/audio equipment. Does not include purchase of IT equipment over $5,000 per unit; network infrastructure over $25,000; computer hardware, servers and peripherals over $5,000 + computer software over $10,000 as these are recorded in the Capital Fund. Information Technology Salaries - salaries of all personnel who are responsible for the coordination, installation, and maintenance and repair of computers and computer systems and data, video and/or multi-media networks such as computer technicians, programmers and network administrators. Also includes personnel whose main function is to train other personnel (not students) in the use of computers and computer software. Information Technology Services - services not provided by division personnel respecting the installation and maintenance of computers, computer systems, and data, video and/or multi-media networks, including contracts and maintenance agreements, as well as software licences, upgrades and annual charges not related to educational software. Also includes dedicated line charges and long distance charges related to the electronic transfer of data and educational programming (e.g. distance education), and Internet access charges. K–12 - kindergarten to grade 12 Mill Rate – the rate of taxation applied per $1,000 of portioned assessment. For example, on a Residential 1 property assessed at $100,000 with a mill rate of 20 mills, the amount of tax payable would be:
$100,000 1,000 x 45% (portioned assessment rate) x 20 mills = $900. N–12 - nursery to grade 12 Portioned Assessment - the percentage of total assessed market value that is subject to taxation. The Province sets the portion percentages for different property classes through the Municipal Assessment Act

v
regulations. For example, a Residential 1 property has a portioned assessment for taxation purposes of 45% of its market value assessment. School Generated Funds – moneys collected from all fund-raising activities of a school. The money is raised by the school, or under the auspices of the school, through extra curricular activities for the sole use of that school. Single Track - Refers to schools in which 90% or more of Regular Instruction students are enrolled in one language program (English, Français, French Immersion or Other Bilingual). Other language programs may be offered, but students enrolled in those programs comprise, in total, less than 10% of the total enrolment. Includes cost of Regular Instruction for all students in these schools. Special Levy – an amount of tax levied on a calendar year basis by school divisions on all assessed, taxable property, including farmland, within each school division's boundaries. Special Purpose Fund - consists of School Generated funds and controlled charitable foundations. The Special Purpose Fund is not included in this Report as school divisions are not required to prepare a budget for this fund. Total KM (Log Book) - UallU kilometres travelled by buses. The figures are taken from the Daily Inspection Logs for school buses and therefore include kilometres for regular transportation to and from school in the morning, at lunch time and after school, transportation to other schools, transportation to other facilities for school sponsored activities, and transportation for field trips, etc. Total KM (Routes) - all kilometres travelled by buses on regular bus routes. Includes only kilometres related to transportation starting from the bus garage in the morning to the school and back to the bus garage after school (i.e. field trips, lunch hour transportation, etc. are not included). Loaded KM - all kilometres travelled by buses on regular bus routes while loaded with students. Includes only kilometres related to transportation on regular routes (see description of regular bus routes above) starting from when the first student is picked up until the last student is dropped off.

vi
EXPLANATORY NOTES 1. Education Support Levy (ESL) mill rates for 2018 and 2019 are as Follows:
Other (mainly Commercial) Property 9.77 mills (2018)
Other (mainly Commercial) Property 9.77 mills (2019)
2. Estimated September 30, 2019 FRAME student statistics are used for 2019/20. 3. Analysis of Expense by Function (Pages 15-17) utilizes the following FRAME student statistics in
the per pupil analysis:
Regular Instruction Accumulated enrolment for all programs in Regular Instruction
Student Support Services Accumulated K-12 enrolment Divisional Administration Accumulated K-12 enrolment
Instructional and Other Support Services Accumulated K-12 enrolment
Transportation of Pupils Accumulated K-12 enrolment
Operations and Maintenance Accumulated K-12 enrolment
Fiscal Accumulated K-12 enrolment
4. Analysis of Expense by Program (Pages 18-34) Utilizes the following FRAME student statistics in
the per pupil analysis:
Regular Instruction:
Administration Accumulated enrolment for all programs in Regular Instruction
Senior Years Technology Education Enrolment in Senior Years Technology Education
Single Track Schools:
English Language Regular Instruction enrolment in English
Language Schools
Français Regular Instruction enrolment in Français Schools
French Immersion Regular Instruction enrolment in French
Immersion Schools
Dual Track Schools Regular Instruction enrolment in schools with more than one language program

vii
Student Support Services:
Administration/Co-ordination
Clinical and Related Services Accumulated K-12 enrolment
Regular Placement
Resource Services
Counselling and Guidance
Divisional Administration:
Board of Trustees
Instructional Management and Administration
Business and Administrative Services Accumulated K-12 enrolment
Management Information Services
Instructional and Other Support Services:
Curriculum Consulting and Development Administration
Curriculum Consulting and Development
Library / Media Centre Accumulated K-12 enrolment
Professional and Staff Development Other
5. Operating fund Transfers to Other School Divisions, Organizations and Individuals have been
deleted in Functions 100 to 700 in order to provide more accurate total and per pupil costs for the various programs. However, recharges in Function 700 have been included to correctly represent transportation costs by program.
6. The Senior Years Technology Education enrolment for those divisions included in the Red River
Technical Vocational Area (Border Land, DSFM, Garden Valley, Red River Valley and Western) includes the students from both the home division and the sending divisions.
7. Expenses and enrolment In Adult Learning Centres (Function 300) and Community Education
and Services (Function 400) are excluded from all calculations of K-12 per pupil costs in this report.
8. N/A stands for "not available". 9. Percentages on pages 15 to 33 and pages 37 and 38 are based on “Expenses Net of Transfers”
from page 3. Percentages may not add to 100% due to rounding. 10. DSFM stands for "division scolaire franco-manitobaine". 11. Effective with the 2008/09 budget, school divisions are no longer required to prepare a capital fund
budget. The only capital transactions in the report are the net transfers to (from) capital fund on

viii
page 45. 12. Effective with the 2009/10 budget, a Full Time Equivalent Personnel Employed appendix page is
provided to disclose school division personnel by salary objects as defined in the FRAME manual. 13. Also effective with the 2009/10 budget, an analytical appendix page, Direct Support to Pupils, is
provided to better disclose program costs only, as a subset of total cost per pupil.
14. Effective with the 2010/11 budget, Special Placement students are no longer reported separately. They are now included in Regular Instruction Enrolment.
15. Effective with the 2014/15 Budget, the Full Time Equivalent Personnel Employed appendix page
excludes personnel in Function 300 (Adult Learning Centres) and Function 400 (Community Education and Services) to better align staffing with K-12 education costs.

YEAR
ENROLMENT
(1) N - 12 headcount enrolment. Whiteshell excluded.(2) 2018 estimate of headcount enrolment not available.
170.0
175.0
180.0
185.0
190.0
195.0
200.0
205.0
210.0
215.0
220.0
225.0
230.0
235.0
240.0
245.0
250.0
19
68
19
69
19
70
19
71
19
72
19
73
19
74
19
75
19
76
19
77
19
78
19
79
19
80
19
81
19
82
19
83
19
84
19
85
19
86
19
87
19
88
19
89
19
90
19
91
19
92
19
93
19
94
19
95
19
96
19
97
19
98
19
99
20
00
20
01
20
02
20
03
20
04
20
05
20
06
20
07
20
08
20
09
20
10
20
11
20
12
20
13
20
14
20
15
20
16
20
17
20
18
Th
ou
sa
nd
s
MANITOBA PUBLIC SCHOOLS ENROLMENT (1)
1968 - 2018 (2)
-1
-

- 2 -
1,000
1,050
1,100
1,150
1,200
1,250
1,300
1,350
1,400
1,450
1,500
1,550
1,600
1,650
1,700
1,750
1,800
1,850
1,900
1,950
2,000
2,050
2,100
2,150
2,200
2,250
2,300
2,350
2,400
2,450
06/07 07/08 08/09 09/10 10/11 11/12 12/13 13/14 14/15 15/16 16/17 17/18 18/19 19/20
$M
illi
on
s
YEAR
OPERATING FUND EXPENSES 2006/07-2019/20 (1)
CURRENT AND CONSTANT (2) DOLLARS
CURRENT CONSTANT
(1) Whiteshell and Manitoba Institute of Trades and Technology (MITT) are excluded.(2) Deflated using the Manitoba CPI - all items (2002=100). 2019/20 uses forecasted CPI.
Budget

- 3 -
RECONCILIATION OF EXPENSES
OPERATING FUND 2019/2020 BUDGET
DIVISION / DISTRICT
BEAUTIFUL PLAINS 20,899,011 (79,800) 20,819,211 (25,330) 20,793,881
BORDER LAND 35,314,379 (459,150) 34,855,229 (674,943) 34,180,286
BRANDON 105,795,100 (103,500) 105,691,600 (346,600) 105,345,000
DSFM 96,846,491 (1,342,574) 95,503,917 (1,935,970) 93,567,947
EVERGREEN 21,110,015 (89,000) 21,021,015 (78,400) 20,942,615
FLIN FLON 14,913,300 14,913,300 (107,940) 14,805,360
FORT LA BOSSE 18,820,355 (83,250) 18,737,105 (285,520) 18,451,585
FRONTIER 141,769,566 (5,351,771) 136,417,795 (4,208,050) 132,209,745
GARDEN VALLEY 51,484,500 (474,000) 51,010,500 (91,500) 50,919,000
HANOVER 91,526,000 (2,435,800) 89,090,200 (142,400) 88,947,800
INTERLAKE 38,241,000 (468,500) 37,772,500 (300,000) 37,472,500
KELSEY 20,559,662 (20,500) 20,539,162 (648,075) 19,891,087
LAKESHORE 16,456,224 (75,700) 16,380,524 (549,000) 15,831,524
LORD SELKIRK 58,750,940 (182,000) 58,568,940 (783,690) 57,785,250
LOUIS RIEL 193,361,505 (961,000) 192,400,505 (2,647,734) 189,752,771
MOUNTAIN VIEW 41,379,438 (6,600) 41,372,838 (100,209) 41,272,629
MYSTERY LAKE 41,960,427 (10,300) 41,950,127 (50,886) 41,899,241
PARK WEST 28,945,161 (155,000) 28,790,161 (310,077) 28,480,084
PEMBINA TRAILS 177,327,936 (2,046,000) 175,281,936 (670,268) 174,611,668
PINE CREEK 15,445,569 (35,084) 15,410,485 (14,790) 15,395,695
PORTAGE LA PRAIRIE 39,971,492 (52,000) 39,919,492 (59,500) 39,859,992
PRAIRIE ROSE 31,543,405 (289,100) 31,254,305 (311,754) 30,942,551
PRAIRIE SPIRIT 28,681,572 (102,600) 28,578,972 (28,393) 28,550,579
RED RIVER VALLEY 32,172,303 (508,184) 31,664,119 (58,518) 31,605,601
RIVER EAST TRANSCONA 194,120,323 (58,800) 194,061,523 (572,788) 193,488,735
ROLLING RIVER 24,565,930 (396,000) 24,169,930 (32,275) 24,137,655
SEINE RIVER 54,576,000 (456,400) 54,119,600 (435,529) 53,684,071
SEVEN OAKS 149,441,150 (1,242,450) 148,198,700 (3,998,909) 144,199,791
SOUTHWEST HORIZON 23,661,900 (279,000) 23,382,900 (159,600) 23,223,300
ST. JAMES-ASSINIBOIA 109,485,763 (458,000) 109,027,763 (980,756) 108,047,007
SUNRISE 65,974,801 (814,000) 65,160,801 (1,349,074) 63,811,727
SWAN VALLEY 21,339,840 (62,600) 21,277,240 (63,985) 21,213,255
TURTLE MOUNTAIN 13,891,446 (26,000) 13,865,446 (212,346) 13,653,100
TURTLE RIVER 11,538,712 (163,688) 11,375,024 (24,879) 11,350,145
WESTERN 21,469,206 (177,050) 21,292,156 (473,168) 20,818,988
WINNIPEG 415,356,100 (2,505,150) 412,850,950 (10,026,700) 402,824,250
PROVINCE 2,468,696,522 (21,970,551) 2,446,725,971 (32,759,556) 2,413,966,415 WHITESHELL 3,630,643 (17,896) 3,612,747 (191,000) 3,421,747
MITT 33,211,408 33,211,408 (13,376,112) 19,835,296
(1) Total operating expenses as reported on the Schedule of Revenues and Expenses in each school division's budget.
(2) Operating fund transfers are payments to other school divisions, organizations and individuals. These are removed to provide more accurate
per pupil costs.
(3) As reported on pages 10 and 13 (on a provincial basis).
(4) Expenses for Adult Learning Centres and Community Education and Services (Functions 300 and 400).
(5) As reported on page 4.
LESS
OPERATING FUND
TRANSFERS (2)
EXPENSES NET OF
TRANSFERS (3)
LESS
NON K-12
EDUCATION &
SERVICES (4)
TOTAL EXPENSES
FOR PER PUPIL
COSTS (5)
TOTAL
EXPENSES (1)

- 4 -
2018/2019 BUDGET 2019/2020 BUDGET
DIVISION / DISTRICT EXPENSES (1)
PER PUPIL EXPENSES (1)
PER PUPIL
BEAUTIFUL PLAINS 20,330,482 11,273 20,793,881 11,543
BORDER LAND 34,148,587 16,028 34,180,286 15,983
BRANDON 103,749,900 12,072 105,345,000 12,146
DSFM 91,415,155 15,788 93,567,947 16,194
EVERGREEN 20,701,807 15,346 20,942,615 14,938
FLIN FLON 14,763,971 15,996 14,805,360 15,759
FORT LA BOSSE 18,413,242 13,209 18,451,585 12,836
FRONTIER 130,156,756 21,215 132,209,745 21,460
GARDEN VALLEY 50,237,300 11,518 50,919,000 11,722
HANOVER 87,089,800 11,074 88,947,800 11,200
INTERLAKE 37,266,620 13,283 37,472,500 13,316
KELSEY 20,180,285 13,849 19,891,087 13,937
LAKESHORE 16,415,122 15,784 15,831,524 16,726
LORD SELKIRK 57,640,123 15,265 57,785,250 15,227
LOUIS RIEL 185,014,568 12,430 189,752,771 12,714
MOUNTAIN VIEW 40,923,091 14,417 41,272,629 13,726
MYSTERY LAKE 42,666,917 14,003 41,899,241 14,023
PARK WEST 28,567,416 14,598 28,480,084 14,194
PEMBINA TRAILS 169,251,624 12,527 174,611,668 12,594
PINE CREEK 15,262,793 15,112 15,395,695 14,628
PORTAGE LA PRAIRIE 38,850,998 11,966 39,859,992 11,947
PRAIRIE ROSE 30,714,026 13,569 30,942,551 13,866
PRAIRIE SPIRIT 28,493,736 13,882 28,550,579 14,087
RED RIVER VALLEY 31,086,178 14,330 31,605,601 14,154
RIVER EAST TRANSCONA 190,309,709 11,788 193,488,735 11,881
ROLLING RIVER 24,074,930 14,141 24,137,655 14,046
SEINE RIVER 52,682,176 12,352 53,684,071 12,378
SEVEN OAKS 141,822,090 12,625 144,199,791 12,572
SOUTHWEST HORIZON 23,142,828 15,296 23,223,300 15,451
ST. JAMES-ASSINIBOIA 107,407,529 12,861 108,047,007 12,927
SUNRISE 63,714,740 14,617 63,811,727 14,356
SWAN VALLEY 21,227,467 15,098 21,213,255 15,411
TURTLE MOUNTAIN 13,531,828 14,252 13,653,100 13,729
TURTLE RIVER 11,264,076 16,219 11,350,145 16,226
WESTERN 20,263,607 11,270 20,818,988 11,163
WINNIPEG 396,080,650 13,091 402,824,250 13,353
PROVINCE 2,378,862,127 13,284 2,413,966,415 13,374 WHITESHELL 3,399,982 20,238 3,421,747 20,428
MITT 19,101,156 13,942 19,835,296 14,128
OPERATING FUND EXPENSE PER PUPIL
(1) Operating fund transfers (i.e. payments to other school divisions, organizations and individuals) are excluded to provide more accurate per
pupil costs. Also excluded are expenditures on educational services not provided to K-12 pupils: Function 300 (Adult Learning Centres) and
Function 400 (Community Education and Services).

- 5 -
BE
AU
TIF
UL
PL
AIN
S
BO
RD
ER
LA
ND
BR
AN
DO
N
DS
FM
EV
ER
GR
EE
N
FL
IN F
LO
N
FO
RT
LA
BO
SS
E
FR
ON
TIE
R
GA
RD
EN
VA
LL
EY
HA
NO
VE
R
INT
ER
LA
KE
KE
LS
EY
LA
KE
SH
OR
E
LO
RD
SE
LK
IRK
LO
UIS
RIE
L
MO
UN
TA
IN V
IEW
MY
ST
ER
Y L
AK
E
PA
RK
WE
ST
PE
MB
INA
TR
AIL
S
PIN
E C
RE
EK
PO
RTA
GE
LA
PR
AIR
IE
PR
AIR
IE R
OS
E
PR
AIR
IE S
PIR
IT
RE
D R
IVE
R V
AL
LE
Y
RIV
ER
EA
ST
TR
AN
SC
ON
A
RO
LL
ING
RIV
ER
SE
INE
RIV
ER
SE
VE
N O
AK
S
SO
UT
HW
ES
T H
OR
IZO
N
ST. J
AM
ES
-AS
SIN
IBO
IA
SU
NR
ISE
SW
AN
VA
LL
EY
TU
RT
LE
MO
UN
TA
IN
TU
RT
LE
RIV
ER
WE
ST
ER
N
WIN
NIP
EG
$0
$1,000
$2,000
$3,000
$4,000
$5,000
$6,000
$7,000
$8,000
$9,000
$10,000
$11,000
$12,000
$13,000
$14,000
$15,000
$16,000
$17,000
$18,000
$19,000
$20,000
$21,000
$22,000
SCHOOL DIVISIONS
2019/20 OPERATING FUNDEXPENSE PER PUPIL

- 6 -
FRAME STUDENT STATISTICS PAGE 1 OF 2
ESTIMATE SEPTEMBER 30, 2019
DIVISION / DISTRICT
BEAUTIFUL PLAINS 1,801.5
BORDER LAND 1,318.7 497.0 136.0
BRANDON 6,429.5 332.5 968.0 476.5
DSFM 5,744.0
EVERGREEN 1,382.0
FLIN FLON 563.0 267.0 109.5
FORT LA BOSSE 1,415.5
FRONTIER 6,103.7
GARDEN VALLEY 4,214.0
HANOVER 7,516.9
INTERLAKE 2,076.5 430.5 307.0
KELSEY 812.7 481.0 133.5
LAKESHORE 932.5
LORD SELKIRK 2,630.5 236.0 487.0 110.0 83.5
LOUIS RIEL 9,495.6 4,609.0 343.0 322.0
MOUNTAIN VIEW 2,171.6 153.0 367.0 86.0 62.0
MYSTERY LAKE 2,464.0 101.0 238.0
PARK WEST 2,006.5
PEMBINA TRAILS 8,153.1 1,279.0 2,593.4 1,839.5
PINE CREEK 1,040.5
PORTAGE LA PRAIRIE 2,455.0 461.5 317.0
PRAIRIE ROSE 1,935.5 129.0 116.0 51.0
PRAIRIE SPIRIT 1,570.7 231.0 119.5 105.5
RED RIVER VALLEY 1,714.5 263.5 73.5 158.5
RIVER EAST TRANSCONA 9,119.0 1,371.5 2,822.5 1,858.5 397.5
ROLLING RIVER 1,711.6
SEINE RIVER 2,172.0 768.5 609.5 787.0
SEVEN OAKS 6,602.5 637.1 2,443.0 1,367.0 227.5
SOUTHWEST HORIZON 1,503.0
ST. JAMES-ASSINIBOIA 5,681.3 1,413.0 704.7 325.0
SUNRISE 2,048.5 1,545.0 770.0 81.5
SWAN VALLEY 983.4 209.0 64.0
TURTLE MOUNTAIN 966.5
TURTLE RIVER 650.5 49.0
WESTERN 829.0 720.5 290.5
WINNIPEG 20,355.0 1,403.0 4,653.5 2,930.0 235.5
PROVINCE 122,826.3 5,744.0 12,644.1 21,124.6 278.0 12,623.5 1,087.5 WHITESHELL 167.5
MITT 124.0
(1) 90% or more of Regular Instruction enrolment is in one language program.
(2) No one language program comprises 90% or more of Regular Instruction enrolment.
OTHER
BILINGUAL
DUAL TRACK (2)
SINGLE TRACK (1)
REGULAR INSTRUCTION
ENGLISH
LANGUAGE FRANÇAIS
FRENCH
IMMERSION
ENGLISH
LANGUAGE FRANÇAIS
FRENCH
IMMERSION

- 7 -
FRAME STUDENT STATISTICS PAGE 2 OF 2
ESTIMATE SEPTEMBER 30, 2019
DIVISION / DISTRICT
BEAUTIFUL PLAINS 1,801.5 1,801.5
BORDER LAND 186.9 2,138.6 2,138.6
BRANDON 467.0 8,673.5 8,673.5
DSFM 34.0 5,778.0 5,778.0
EVERGREEN 20.0 1,402.0 1,402.0
FLIN FLON 939.5 939.5
FORT LA BOSSE 22.0 1,437.5 1,437.5
FRONTIER 57.0 6,160.7 6,160.7
GARDEN VALLEY 130.0 4,344.0 4,344.0
HANOVER 424.6 7,941.5 7,941.5
INTERLAKE 2,814.0 2,814.0
KELSEY 1,427.2 1,427.2
LAKESHORE 14.0 946.5 946.5
LORD SELKIRK 248.0 3,795.0 3,795.0
LOUIS RIEL 155.4 14,925.0 14,925.0
MOUNTAIN VIEW 167.4 3,007.0 3,007.0
MYSTERY LAKE 185.0 2,988.0 2,988.0
PARK WEST 2,006.5 2,006.5
PEMBINA TRAILS 13,865.0 13,865.0
PINE CREEK 12.0 1,052.5 1,052.5
PORTAGE LA PRAIRIE 103.0 3,336.5 3,336.5
PRAIRIE ROSE 2,231.5 2,231.5
PRAIRIE SPIRIT 2,026.7 2,026.7
RED RIVER VALLEY 23.0 2,233.0 2,233.0
RIVER EAST TRANSCONA 716.0 16,285.0 16,285.0
ROLLING RIVER 6.9 1,718.5 1,718.5
SEINE RIVER 4,337.0 4,337.0
SEVEN OAKS 192.5 11,469.6 11,469.6
SOUTHWEST HORIZON 1,503.0 1,503.0
ST. JAMES-ASSINIBOIA 234.0 8,358.0 8,358.0
SUNRISE 4,445.0 4,445.0
SWAN VALLEY 120.1 1,376.5 1,376.5
TURTLE MOUNTAIN 28.0 994.5 994.5
TURTLE RIVER 699.5 699.5
WESTERN 25.0 1,865.0 1,865.0
WINNIPEG 590.5 30,167.5 30,167.5
PROVINCE 4,162.3 180,490.3 180,490.3 WHITESHELL 167.5 167.5
MITT 1,280.0 1,404.0 1,404.0
(1) Special Placement students are not reported separately. They are included in Regular Instruction Enrolment.
As a result, total enrolment in Regular Instruction is equal to Total K-12 F.T.E. enrolment.
TOTALREGULAR INSTRUCTION (1)
SENIOR YEARS
TECHNOLOGY TOTAL
K-12 FTE
ENROLMENT

- 8 -
ENROLMENTS - HEADCOUNT, FRAME AND ELIGIBLE
ACTUAL AND ESTIMATES AS OF SEPTEMBER 30
HEADCOUNT (1)
FRAME (2)
ELIGIBLE (3)
ELIGIBLE (3)
DIVISION / DISTRICT
BEAUTIFUL PLAINS 1,896 1,896 1,801.5 1,812.9 1,783.2
BORDER LAND 2,210 2,210 2,138.6 2,040.3 1,973.3
BRANDON 8,922 8,922 8,673.5 8,525.4 8,405.8
DSFM 5,708 35 5,673 5,778.0 5,391.1 5,319.8
EVERGREEN 1,483 1,483 1,402.0 1,400.4 1,362.8
FLIN FLON 984 984 939.5 903.9 893.9
FORT LA BOSSE 1,482 3 1,479 1,437.5 1,358.5 1,320.8
FRONTIER 6,667 406 6,261 6,160.7 2,133.6 2,200.4
GARDEN VALLEY 4,541 4,541 4,344.0 4,370.8 4,387.5
HANOVER 8,218 8,218 7,941.5 7,878.3 7,787.6
INTERLAKE 2,952 2,952 2,814.0 2,835.8 2,780.8
KELSEY 1,534 1,534 1,427.2 1,468.6 1,493.4
LAKESHORE 1,000 1,000 946.5 938.5 955.0
LORD SELKIRK 3,972 3,972 3,795.0 3,756.1 3,815.3
LOUIS RIEL 15,481 15,481 14,925.0 14,559.4 14,338.7
MOUNTAIN VIEW 3,104 3,104 3,007.0 2,881.5 2,846.2
MYSTERY LAKE 3,095 3,095 2,988.0 2,929.4 2,983.9
PARK WEST 2,076 28 2,048 2,006.5 1,483.7 1,463.6
PEMBINA TRAILS 14,425 14,425 13,865.0 13,661.2 13,192.7
PINE CREEK 1,067 1,067 1,052.5 1,023.5 1,007.2
PORTAGE LA PRAIRIE 3,472 3,472 3,336.5 3,043.2 3,109.4
PRAIRIE ROSE 2,323 2,323 2,231.5 2,226.0 2,184.3
PRAIRIE SPIRIT 2,137 2,137 2,026.7 1,996.3 2,057.8
RED RIVER VALLEY 2,260 2,260 2,233.0 2,180.6 2,097.8
RIVER EAST TRANSCONA 16,672 16,672 16,285.0 15,900.5 15,713.5
ROLLING RIVER 1,755 1,755 1,718.5 1,578.7 1,575.6
SEINE RIVER 4,513 4,513 4,337.0 4,330.3 4,186.1
SEVEN OAKS 11,705 11,705 11,469.6 11,135.8 10,975.2
SOUTHWEST HORIZON 1,557 1,557 1,503.0 1,485.4 1,513.0
ST. JAMES-ASSINIBOIA 8,529 8,529 8,358.0 8,046.5 7,973.3
SUNRISE 4,617 4,617 4,445.0 4,396.4 4,402.0
SWAN VALLEY 1,441 1,441 1,376.5 1,354.5 1,369.5
TURTLE MOUNTAIN 1,031 1,031 994.5 991.5 969.0
TURTLE RIVER 740 740 699.5 708.2 693.8
WESTERN 1,878 1,878 1,865.0 1,779.1 1,700.4
WINNIPEG 33,093 1,734 31,359 30,167.5 29,496.1 29,671.7
PROVINCE 188,540 2,206 186,334 180,490.3 172,002.0 170,504.3 WHITESHELL 204 17 187 167.5 176.5 154.0
MITT 1,404.0
(1) Pupils taught in schools, whether or not they are counted for grant purposes.
(3) Provincially supported pupils (actual September 30, 2018 for 2019/20 and actual September 30, 2017 for 2018/19).
ACTUAL
SEP. 30, 2018
ESTIMATE
SEP. 30, 2019
ACTUAL
SEP. 30, 2018
ACTUAL
SEP. 30, 2017
(2) The total number of pupils enrolled in schools adjusted for full time equivalence (FTE). Full time equivalent means pupils are counted on the
basis of time attending school - eg. Kindergarten as 1/2. This total is the same as reported on page 7.
N-12
ENROLMENT
NURSERY
ENROLMENT
K-12
ENROLMENT
K-12 FTE
ENROLMENT
K-12
ENROLMENT
K-12
ENROLMENT

- 9 -
PUPIL / TEACHER RATIOS
ESTIMATE SEPTEMBER 30, 2019
DIVISION / DISTRICT
BEAUTIFUL PLAINS 16.4 13.8
BORDER LAND 13.8 11.3
BRANDON 17.0 12.8
DSFM 14.8 11.8
EVERGREEN 16.0 12.5
FLIN FLON 15.6 11.7
FORT LA BOSSE 15.3 13.1
FRONTIER 15.2 12.0
GARDEN VALLEY 18.5 14.5
HANOVER 17.9 14.4
INTERLAKE 16.1 12.2
KELSEY 15.4 11.4
LAKESHORE 14.6 11.3
LORD SELKIRK 15.3 11.9
LOUIS RIEL 17.5 13.6
MOUNTAIN VIEW 16.3 13.0
MYSTERY LAKE 15.7 12.4
PARK WEST 14.2 11.7
PEMBINA TRAILS 17.3 13.8
PINE CREEK 14.7 11.9
PORTAGE LA PRAIRIE 16.4 12.8
PRAIRIE ROSE 14.3 11.5
PRAIRIE SPIRIT 15.0 12.4
RED RIVER VALLEY 16.2 12.8
RIVER EAST TRANSCONA 17.7 14.0
ROLLING RIVER 15.5 12.7
SEINE RIVER 17.9 13.7
SEVEN OAKS 17.1 13.9
SOUTHWEST HORIZON 13.9 11.7
ST. JAMES-ASSINIBOIA 17.7 13.5
SUNRISE 16.4 12.6
SWAN VALLEY 15.1 12.3
TURTLE MOUNTAIN 15.7 12.5
TURTLE RIVER 13.0 11.1
WESTERN 16.8 13.9
WINNIPEG 17.6 13.3
PROVINCE 16.8 13.1 WHITESHELL 9.5 8.3
MITT 36.9 29.9
REGULAR
INSTRUCTION (1)
EDUCATOR (2)
FRAME PUPIL / TEACHER RATIOS
(1) Based on object code 330 instructional-teaching personnel and FTE students in Function 100. Included are teachers in physical education,
music, EAL, etc. in addition to regular classroom teachers. School-based administrative personnel and Special Placement classroom
teachers are excluded.
(2) Based on total instructional-teaching (excluding Community Education and Adult Learning Centres) as well as school-based administrative
staff - eg. department heads, coordinators, principals and vice-principals - and K-12 FTE enrolment. Division administrators (Function 500)
are excluded.

OPERATING FUND 2019/2020 BUDGET
EXPENSE BY FUNCTION AND OBJECT
100 REGULAR INSTRUCTION 1,172,387,671 72,857,472 33,665,493 82,443,122 1,361,353,758
200 STUDENT SUPPORT SERVICES 398,053,459 41,139,716 12,060,794 5,327,300 456,581,269
300 ADULT LEARNING CENTRES 7,853,616 531,094 928,805 319,330 27,000(1)
9,659,845
400 COMMUNITY EDUCATION & SERVICES 17,208,986 1,715,584 2,494,597 1,680,544 23,099,711
500 DIVISIONAL ADMINISTRATION 51,794,109 7,316,967 18,129,521 2,426,145 (27,000)(1)
79,639,742
600 INSTRUCTIONAL AND OTHER SUPPORT
SERVICES 55,189,681 5,368,601 15,315,728 8,210,191 84,084,201
700 TRANSPORTATION OF PUPILS 49,364,873 7,935,873 29,147,214 20,287,432 106,735,392
800 OPERATIONS AND MAINTENANCE 124,118,382 21,562,083 110,420,056 27,425,633 283,526,154
900 FISCAL 2,737,415 10,500 39,297,984(2)
42,045,899
TOTALS 1,875,970,777 158,427,390 222,162,208 148,119,697 2,737,415 10,500 39,297,984 2,446,725,971
(1) Reallocation of administration costs associated with Adult Learning Centre operations from Function 500 to Function 300.
(2) Health and Post Secondary Education Tax Levy.
- 10
-
FUNCTION
OBJECT
SALARIES
EMPLOYEE
BENEFITS SERVICES
SUPPLIES AND
MATERIALS
DEBT
SERVICES
BAD DEBT
EXPENSE TRANSFERS TOTALS

- 11
-
#######
SALARIES76.7%
EMPLOYEE BENEFITS6.5%
SERVICES9.1%
SUPPLIES & MATERIALS6.1%
DEBT SERVICES0.1%
TRANSFERS1.6%
2019/20 OPERATING FUNDEXPENSE BY OBJECT

OPERATING FUND 2019/2020 BUDGET PAGE 1 OF 2
EXPENSE BY 2ND LEVEL OBJECT
AS A PERCENTAGE OF TOTAL OPERATING FUND EXPENSES
OBJECT AMOUNT % AMOUNT % AMOUNT % AMOUNT % AMOUNT %
SALARIES
TRUSTEES REMUNERATION 4,141,418
EXECUTIVE, MANAGERIAL, & SUPERVISORY 96,944,256 4.0 7,382,698 0.3 861,680 0.0 839,012 0.0 22,382,870 0.9
INSTRUCTIONAL - TEACHING 987,525,938 40.4 166,549,091 6.8 6,004,207 0.2 8,538,101 0.3
INSTRUCTIONAL - OTHER 25,670,577 1.0 176,169,375 7.2 390,109 0.0 4,055,244 0.2
TECHNICAL, SPECIALIZED AND SERVICE 6,599,515 0.3 1,999,434 0.1 179,857 0.0 2,248,377 0.1 6,667,861 0.3
SECRETARIAL, CLERICAL AND OTHER 42,583,013 1.7 2,998,765 0.1 417,763 0.0 710,123 0.0 15,994,947 0.7
CLINICIAN 42,805,727 1.7 783,129
INFORMATION TECHNOLOGY 13,064,372 0.5 148,369 0.0 35,000 0.0 2,607,013 0.1
TOTAL SALARIES 1,172,387,671 47.9 398,053,459 16.3 7,853,616 0.3 17,208,986 0.7 51,794,109 2.1
EMPLOYEE BENEFITS AND ALLOWANCES 72,857,472 3.0 41,139,716 1.7 531,094 0.0 1,715,584 0.1 7,316,967 0.3
SERVICES
PROFESSIONAL, TECHNICAL & SPECIALIZED 6,160,131 0.3 7,271,346 0.3 57,165 0.0 1,562,599 0.1 4,258,041 0.2
COMMUNICATIONS 3,990,237 0.2 338,695 0.0 66,450 0.0 30,120 0.0 1,237,339 0.1
UTILITY SERVICES 61,751 0.0
TRAVEL AND MEETINGS 2,826,526 0.1 2,448,378 0.1 79,128 0.0 93,456 0.0 2,453,191 0.1
TRANSPORTATION OF PUPILS
TUITION 1,274,267 0.1 987,120 0.0
PRINTING AND BINDING 518,710 0.0 28,275 0.0 5,021 0.0 62,700 0.0 225,293 0.0
INSURANCE AND BOND PREMIUMS 320,217 0.0 20,007 0.0 8,198 0.0 1,675,745 0.1
MAINTENANCE AND REPAIR SERVICES 2,501,292 0.1 77,660 0.0 66,002 0.0 120,880 0.0 215,836 0.0
RENTALS 2,934,590 0.1 253,373 0.0 486,070 0.0 498,230 0.0 372,241 0.0
PROPERTY TAXES 18,803 0.0
ADVERTISING 315,162 0.0 59,130 0.0 24,187 0.0 71,780 0.0 688,642 0.0
DUES AND FEES 899,090 0.0 120,485 0.0 472 0.0 5,155 0.0 3,003,619 0.1
PROFESSIONAL AND STAFF DEVELOPMENT 539,789 0.0 252,160 0.0 39,325 0.0 31,777 0.0 1,449,322 0.1
INFORMATION TECHNOLOGY SERVICES 11,385,482 0.5 204,165 0.0 16,233 0.0 17,900 0.0 2,550,252 0.1
TOTAL SERVICES 33,665,493 1.4 12,060,794 0.5 928,805 0.0 2,494,597 0.1 18,129,521 0.7
SUPPLIES AND EQUIPMENT
SUPPLIES 37,692,444 1.5 3,382,131 0.1 160,223 0.0 1,491,610 0.1 1,218,511 0.0
CURRICULAR AND MEDIA MATERIALS 11,324,780 0.5 785,487 0.0 58,113 0.0 70,453 0.0 113,560 0.0
MINOR EQUIPMENT 12,652,063 0.5 416,515 0.0 41,744 0.0 114,781 0.0 297,890 0.0
INFORMATION TECHNOLOGY EQUIPMENT 20,773,835 0.8 743,167 0.0 59,250 0.0 3,700 0.0 796,184 0.0
TOTAL SUPPLIES AND EQUIPMENT 82,443,122 3.4 5,327,300 0.2 319,330 0.0 1,680,544 0.1 2,426,145 0.1
TRANSFERS
RECHARGE (1)
27,000 (27,000)
TOTAL TRANSFERS 27,000 (27,000)
PROVINCE 1,361,353,758 55.6 456,581,269 18.7 9,659,845 0.4 23,099,711 0.9 79,639,742 3.3
(1) Reallocation of administration costs associated with Adult Learning Centre operations from Function 500 to Function 300.
FUNCTION
- 12 -
REGULAR
INSTRUCTION
STUDENT SUPPORT
SERVICES
ADULT LEARNING
CENTRES
COMMUNITY
EDUCATION
DIVISIONAL
ADMINISTRATION

OPERATING FUND 2019/2020 BUDGET PAGE 2 OF 2
EXPENSE BY 2ND LEVEL OBJECT
AS A PERCENTAGE OF TOTAL OPERATING FUND EXPENSES
FUNCTION
OBJECT AMOUNT % AMOUNT % AMOUNT % AMOUNT % AMOUNT %
SALARIES
TRUSTEES REMUNERATION 4,141,418 0.2
EXECUTIVE, MANAGERIAL, & SUPERVISORY 4,683,792 0.2 3,234,975 0.1 5,246,223 0.2 141,575,506 5.8
INSTRUCTIONAL - TEACHING 27,260,485 1.1 1,195,877,822 48.9
INSTRUCTIONAL - OTHER 16,036,890 0.7 453,737 0.0 222,775,932 9.1
TECHNICAL, SPECIALIZED AND SERVICE 4,443,590 0.2 43,764,880 1.8 116,927,448 4.8 182,830,962 7.5
SECRETARIAL, CLERICAL AND OTHER 2,489,471 0.1 1,911,281 0.1 1,944,711 0.1 69,050,074 2.8
CLINICIAN 43,588,856 1.8
INFORMATION TECHNOLOGY 275,453 0.0 16,130,207 0.7
TOTAL SALARIES 55,189,681 2.3 49,364,873 2.0 124,118,382 5.1 1,875,970,777 76.7
EMPLOYEE BENEFITS AND ALLOWANCES 5,368,601 0.2 7,935,873 0.3 21,562,083 0.9 158,427,390 6.5
SERVICES
PROFESSIONAL, TECHNICAL & SPECIALIZED 2,100,473 0.1 348,020 0.0 6,261,506 0.3 28,019,281 1.1
COMMUNICATIONS 120,843 0.0 362,965 0.0 826,635 0.0 6,973,284 0.3
UTILITY SERVICES 48,579,854 2.0 48,641,605 2.0
TRAVEL AND MEETINGS 1,052,245 0.0 1,547,120 0.1 888,532 0.0 11,388,576 0.5
TRANSPORTATION OF PUPILS 20,400,851 0.8 20,400,851 0.8
TUITION 6,600 0.0 2,267,987 0.1
PRINTING AND BINDING 50,245 0.0 7,785 0.0 10,600 0.0 908,629 0.0
INSURANCE AND BOND PREMIUMS 130,267 0.0 1,342,049 0.1 10,262,937 0.4 13,759,420 0.6
MAINTENANCE AND REPAIR SERVICES 52,870 0.0 3,132,802 0.1 33,221,846 1.4 39,389,188 1.6
RENTALS 206,128 0.0 1,074,208 0.0 3,657,300 0.1 9,482,140 0.4
PROPERTY TAXES 5,765,773 0.2 5,784,576 0.2
ADVERTISING 21,700 0.0 31,550 0.0 83,350 0.0 1,295,501 0.1
DUES AND FEES 220,160 0.0 83,833 0.0 136,582 0.0 4,469,396 0.2
PROFESSIONAL AND STAFF DEVELOPMENT 10,409,181 0.4 288,835 0.0 383,502 0.0 13,393,891 0.5
INFORMATION TECHNOLOGY SERVICES 945,016 0.0 527,196 0.0 341,639 0.0 15,987,883 0.7
TOTAL SERVICES 15,315,728 0.6 29,147,214 1.2 110,420,056 4.5 222,162,208 9.1
SUPPLIES AND EQUIPMENT
SUPPLIES 4,687,505 0.2 19,693,433 0.8 23,532,532 1.0 91,858,389 3.8
CURRICULAR AND MEDIA MATERIALS 2,956,788 0.1 30,750 0.0 258,000 0.0 15,597,931 0.6
MINOR EQUIPMENT 231,617 0.0 436,067 0.0 3,510,185 0.1 17,700,862 0.7
INFORMATION TECHNOLOGY EQUIPMENT 334,281 0.0 127,182 0.0 124,916 0.0 22,962,515 0.9
TOTAL SUPPLIES AND EQUIPMENT 8,210,191 0.3 20,287,432 0.8 27,425,633 1.1 148,119,697 6.1
TRANSFERS
DEBT SERVICES 2,737,415 0.1 2,737,415 0.1
BAD DEBT EXPENSE 10,500 10,500
OTHER GOVERNMENT AUTHORITIES 39,297,984 1.6 39,297,984 1.6
TOTAL TRANSFERS 42,045,899 1.7 42,045,899 1.7
PROVINCE 84,084,201 3.4 106,735,392 4.4 283,526,154 11.6 42,045,899 1.7 2,446,725,971 100.0
- 13 -
INSTRUCTIONAL & OTHER
SUPPORT SERVICES
TRANSPORTATION OF
PUPILS
OPERATIONS AND
MAINTENANCE FISCAL TOTAL

- 14
-
#######
REGULAR INSTRUCTION55.6%
STUDENT SUPPORT SERVICES18.7%
ADULT LEARNING CENTRES0.4%
COMMUNITY EDUCATION0.9%
DIVISIONAL ADMINISTRATION3.3%
INSTRUCTIONAL & PUPIL SUPPORT SERVICES
3.4%
TRANSPORTATION OF PUPILS4.4%
OPERATIONS & MAINTENANCE11.6%
FISCAL1.7%
2019/20 OPERATING FUNDEXPENSE BY FUNCTION

- 15 -
ANALYSIS OF EXPENSE BY FUNCTION PAGE 1 OF 3
OPERATING FUND 2019/2020 BUDGET
DIVISION / DISTRICT AMOUNT % AMOUNT % AMOUNT %
BEAUTIFUL PLAINS 13,030,079 62.6 7,233 2,777,832 13.3 1,542
BORDER LAND 19,936,462 57.2 9,322 5,552,169 15.9 2,596 617,056 1.8
BRANDON 63,156,300 59.8 7,282 22,272,500 21.1 2,568
DSFM 53,264,045 55.8 9,218 11,100,495 11.6 1,921 258,919 0.3
EVERGREEN 10,954,649 52.1 7,814 3,696,190 17.6 2,636
FLIN FLON 7,808,166 52.4 8,311 2,945,214 19.7 3,135 94,000 0.6
FORT LA BOSSE 11,110,015 59.3 7,729 2,431,620 13.0 1,692
FRONTIER 58,096,456 42.6 9,430 21,858,988 16.0 3,548 2,093,907 1.5
GARDEN VALLEY 28,493,800 55.9 6,559 10,258,200 20.1 2,361
HANOVER 54,386,300 61.0 6,848 13,976,900 15.7 1,760
INTERLAKE 21,851,500 57.9 7,765 6,606,000 17.5 2,348
KELSEY 10,728,176 52.2 7,517 4,111,365 20.0 2,881 560,185 2.7
LAKESHORE 8,281,441 50.6 8,750 2,868,250 17.5 3,030 272,000 1.7
LORD SELKIRK 33,647,515 57.4 8,866 10,318,170 17.6 2,719 356,050 0.6
LOUIS RIEL 108,440,666 56.4 7,266 39,143,648 20.3 2,623 567,783 0.3
MOUNTAIN VIEW 23,180,494 56.0 7,709 6,217,667 15.0 2,068
MYSTERY LAKE 23,497,935 56.0 7,864 8,686,638 20.7 2,907
PARK WEST 17,090,702 59.4 8,518 3,764,442 13.1 1,876 116,817 0.4
PEMBINA TRAILS 100,893,142 57.6 7,277 32,137,428 18.3 2,318
PINE CREEK 9,282,340 60.2 8,819 1,859,757 12.1 1,767
PORTAGE LA PRAIRIE 23,856,928 59.8 7,150 7,642,070 19.1 2,290
PRAIRIE ROSE 18,412,040 58.9 8,251 4,312,507 13.8 1,933 279,114 0.9
PRAIRIE SPIRIT 16,663,077 58.3 8,222 3,953,802 13.8 1,951
RED RIVER VALLEY 17,741,336 56.0 7,945 5,605,771 17.7 2,510
RIVER EAST TRANSCONA 112,743,355 58.1 6,923 36,219,508 18.7 2,224
ROLLING RIVER 14,254,790 59.0 8,295 3,253,000 13.5 1,893
SEINE RIVER 30,958,468 57.2 7,138 9,732,100 18.0 2,244
SEVEN OAKS 87,598,433 59.1 7,637 25,171,210 17.0 2,195 2,027,377 1.4
SOUTHWEST HORIZON 13,381,800 57.2 8,903 3,219,550 13.8 2,142
ST. JAMES-ASSINIBOIA 60,428,134 55.4 7,230 24,468,435 22.4 2,928
SUNRISE 34,177,385 52.5 7,689 12,783,148 19.6 2,876 994,120 1.5
SWAN VALLEY 11,715,851 55.1 8,511 3,514,793 16.5 2,553
TURTLE MOUNTAIN 7,675,297 55.4 7,718 2,437,856 17.6 2,451 199,256 1.4
TURTLE RIVER 6,177,931 54.3 8,832 1,825,513 16.0 2,610
WESTERN 13,052,524 61.3 6,999 3,196,869 15.0 1,714 427,461 2.0
WINNIPEG 215,386,226 52.2 7,140 96,661,664 23.4 3,204 795,800 0.2
PROVINCE 1,361,353,758 55.6 7,543 456,581,269 18.7 2,530 9,659,845 0.4 WHITESHELL 2,146,000 59.4 12,812 366,400 10.1 2,187
MITT 6,576,701 19.8 4,684 920,873 2.8 656 2,793,338 8.4
REGULAR INSTRUCTION
STUDENT SUPPORT
SERVICES
ADULT LEARNING
CENTRES
PER
PUPIL
PER
PUPIL

- 16 -
ANALYSIS OF EXPENSE BY FUNCTION PAGE 2 OF 3
OPERATING FUND 2019/2020 BUDGET
DIVISION / DISTRICT AMOUNT % AMOUNT % AMOUNT %
BEAUTIFUL PLAINS 25,330 0.1 651,952 3.1 362 616,061 3.0 342
BORDER LAND 57,887 0.2 1,217,250 3.5 569 929,592 2.7 435
BRANDON 346,600 0.3 3,131,000 3.0 361 3,386,500 3.2 390
DSFM 1,677,051 1.8 3,751,367 3.9 649 3,329,886 3.5 576
EVERGREEN 78,400 0.4 764,390 3.6 545 702,156 3.3 501
FLIN FLON 13,940 0.1 657,913 4.4 700 307,586 2.1 327
FORT LA BOSSE 285,520 1.5 681,050 3.6 474 442,500 2.4 308
FRONTIER 2,114,143 1.5 7,330,911 5.4 1,190 7,603,024 5.6 1,234
GARDEN VALLEY 91,500 0.2 1,568,200 3.1 361 1,769,200 3.5 407
HANOVER 142,400 0.2 2,339,400 2.6 295 2,748,800 3.1 346
INTERLAKE 300,000 0.8 1,294,000 3.4 460 1,088,000 2.9 387
KELSEY 87,890 0.4 877,355 4.3 615 493,193 2.4 346
LAKESHORE 277,000 1.7 588,650 3.6 622 424,800 2.6 449
LORD SELKIRK 427,640 0.7 1,878,010 3.2 495 1,664,220 2.8 439
LOUIS RIEL 2,079,951 1.1 6,359,970 3.3 426 7,443,998 3.9 499
MOUNTAIN VIEW 100,209 0.2 1,359,614 3.3 452 1,535,983 3.7 511
MYSTERY LAKE 50,886 0.1 1,803,612 4.3 604 1,661,869 4.0 556
PARK WEST 193,260 0.7 1,103,342 3.8 550 655,293 2.3 327
PEMBINA TRAILS 670,268 0.4 5,833,190 3.3 421 7,257,472 4.1 523
PINE CREEK 14,790 0.1 550,264 3.6 523 610,322 4.0 580
PORTAGE LA PRAIRIE 59,500 0.1 1,070,120 2.7 321 1,417,820 3.6 425
PRAIRIE ROSE 32,640 0.1 1,090,060 3.5 488 924,403 3.0 414
PRAIRIE SPIRIT 28,393 0.1 898,275 3.1 443 728,650 2.5 360
RED RIVER VALLEY 58,518 0.2 1,139,338 3.6 510 799,733 2.5 358
RIVER EAST TRANSCONA 572,788 0.3 5,036,540 2.6 309 8,817,277 4.5 541
ROLLING RIVER 32,275 0.1 887,385 3.7 516 526,360 2.2 306
SEINE RIVER 435,529 0.8 1,644,600 3.0 379 1,770,332 3.3 408
SEVEN OAKS 1,971,532 1.3 4,143,080 2.8 361 6,022,373 4.1 525
SOUTHWEST HORIZON 159,600 0.7 857,900 3.7 571 516,050 2.2 343
ST. JAMES-ASSINIBOIA 980,756 0.9 3,334,737 3.1 399 4,052,401 3.7 485
SUNRISE 354,954 0.5 2,052,474 3.1 462 1,736,497 2.7 391
SWAN VALLEY 63,985 0.3 771,508 3.6 560 514,787 2.4 374
TURTLE MOUNTAIN 13,090 0.1 478,287 3.4 481 450,620 3.2 453
TURTLE RIVER 24,879 0.2 397,202 3.5 568 246,690 2.2 353
WESTERN 45,707 0.2 753,969 3.5 404 552,127 2.6 296
WINNIPEG 9,230,900 2.2 11,342,827 2.7 376 10,337,626 2.5 343
PROVINCE 23,099,711 0.9 79,639,742 3.3 441 84,084,201 3.4 466 WHITESHELL 191,000 5.3 142,000 3.9 848 134,900 3.7 805
MITT 10,582,774 31.9 6,754,708 20.3 4,811 950,617 2.9 677
COMMUNITY EDUCATION
AND SERVICES
DIVISIONAL
ADMINISTRATION
INSTRUCTIONAL & OTHER
SUPPORT SERVICES
PER
PUPIL
PER
PUPIL

- 17 -
ANALYSIS OF EXPENSE BY FUNCTION PAGE 3 OF 3
OPERATING FUND 2019/2020 BUDGET
DIVISION / DISTRICT AMOUNT % AMOUNT % AMOUNT %
BEAUTIFUL PLAINS 1,343,297 6.5 746 2,009,660 9.7 1,116 365,000 1.8 203
BORDER LAND 2,517,887 7.2 1,177 3,462,199 9.9 1,619 564,727 1.6 264
BRANDON 2,653,300 2.5 306 8,937,300 8.5 1,030 1,808,100 1.7 208
DSFM 9,790,676 10.3 1,694 10,886,129 11.4 1,884 1,445,349 1.5 250
EVERGREEN 1,772,100 8.4 1,264 2,724,630 13.0 1,943 328,500 1.6 234
FLIN FLON 566,441 3.8 603 2,276,720 15.3 2,423 243,320 1.6 259
FORT LA BOSSE 1,421,430 7.6 989 1,978,970 10.6 1,377 386,000 2.1 269
FRONTIER 11,782,580 8.6 1,913 24,272,786 17.8 3,940 1,265,000 0.9 205
GARDEN VALLEY 3,195,100 6.3 736 4,783,500 9.4 1,101 851,000 1.7 196
HANOVER 4,269,400 4.8 538 9,579,300 10.8 1,206 1,647,700 1.8 207
INTERLAKE 2,300,000 6.1 817 3,649,000 9.7 1,297 684,000 1.8 243
KELSEY 652,934 3.2 457 2,668,064 13.0 1,869 360,000 1.8 252
LAKESHORE 1,727,415 10.5 1,825 1,679,580 10.3 1,775 261,388 1.6 276
LORD SELKIRK 2,754,190 4.7 726 6,503,145 11.1 1,714 1,020,000 1.7 269
LOUIS RIEL 4,630,570 2.4 310 20,320,408 10.6 1,362 3,413,511 1.8 229
MOUNTAIN VIEW 2,957,921 7.1 984 5,236,930 12.7 1,742 784,020 1.9 261
MYSTERY LAKE 355,000 0.8 119 5,188,287 12.4 1,736 705,900 1.7 236
PARK WEST 1,944,019 6.8 969 3,411,686 11.9 1,700 510,600 1.8 254
PEMBINA TRAILS 3,656,473 2.1 264 21,733,963 12.4 1,568 3,100,000 1.8 224
PINE CREEK 1,255,022 8.1 1,192 1,580,735 10.3 1,502 257,255 1.7 244
PORTAGE LA PRAIRIE 1,175,308 2.9 352 4,002,746 10.0 1,200 695,000 1.7 208
PRAIRIE ROSE 2,410,918 7.7 1,080 3,184,613 10.2 1,427 608,010 1.9 272
PRAIRIE SPIRIT 2,450,725 8.6 1,209 3,381,050 11.8 1,668 475,000 1.7 234
RED RIVER VALLEY 2,776,190 8.8 1,243 2,898,644 9.2 1,298 644,589 2.0 289
RIVER EAST TRANSCONA 4,864,640 2.5 299 22,398,415 11.5 1,375 3,409,000 1.8 209
ROLLING RIVER 1,799,990 7.4 1,047 2,973,130 12.3 1,730 443,000 1.8 258
SEINE RIVER 3,429,071 6.3 791 5,249,500 9.7 1,210 900,000 1.7 208
SEVEN OAKS 3,934,390 2.7 343 14,649,955 9.9 1,277 2,680,350 1.8 234
SOUTHWEST HORIZON 2,235,600 9.6 1,487 2,576,200 11.0 1,714 436,200 1.9 290
ST. JAMES-ASSINIBOIA 2,284,032 2.1 273 11,600,984 10.6 1,388 1,878,284 1.7 225
SUNRISE 5,200,637 8.0 1,170 6,654,991 10.2 1,497 1,206,595 1.9 271
SWAN VALLEY 1,905,376 9.0 1,384 2,448,940 11.5 1,779 342,000 1.6 248
TURTLE MOUNTAIN 1,247,640 9.0 1,255 1,094,099 7.9 1,100 269,301 1.9 271
TURTLE RIVER 1,232,659 10.8 1,762 1,284,318 11.3 1,836 185,832 1.6 266
WESTERN 896,961 4.2 481 1,978,470 9.3 1,061 388,068 1.8 208
WINNIPEG 7,345,500 1.8 243 54,267,107 13.1 1,799 7,483,300 1.8 248
PROVINCE 106,735,392 4.4 591 283,526,154 11.6 1,571 42,045,899 1.7 233 WHITESHELL 69,700 1.9 416 514,300 14.2 3,070 48,447 1.3 289
MITT 4,021,722 12.1 2,864 610,675 1.8 435
PER
PUPIL
PER
PUPIL
PER
PUPIL
FISCAL
OPERATIONS AND
MAINTENANCE
TRANSPORTATION
OF PUPILS

- 18 -
ANALYSIS OF EXPENSE BY PROGRAM PAGE 1 OF 16
OPERATING FUND 2019/2020 BUDGET
DIVISION / DISTRICT AMOUNT % AMOUNT %
BEAUTIFUL PLAINS 1,483,509 7.1 823
BORDER LAND 2,812,625 8.1 1,315 1,360,033 3.9 7,277
BRANDON 7,522,200 7.1 867 3,871,500 3.7 8,290
DSFM 6,847,729 7.2 1,185 257,076 0.3 7,561
EVERGREEN 1,706,750 8.1 1,217 135,500 0.6 6,775
FLIN FLON 1,239,728 8.3 1,320
FORT LA BOSSE 1,423,410 7.6 990 205,200 1.1 9,327
FRONTIER 7,371,303 5.4 1,197 691,659 0.5 12,134
GARDEN VALLEY 3,214,700 6.3 740 1,226,600 2.4 9,435
HANOVER 6,597,700 7.4 831 3,394,100 3.8 7,994
INTERLAKE 3,199,917 8.5 1,137
KELSEY 1,521,285 7.4 1,066
LAKESHORE 1,104,800 6.7 1,167 140,500 0.9 10,036
LORD SELKIRK 4,926,675 8.4 1,298 1,901,030 3.2 7,665
LOUIS RIEL 14,846,949 7.7 995 1,999,837 1.0 12,869
MOUNTAIN VIEW 3,531,118 8.5 1,174 912,570 2.2 5,451
MYSTERY LAKE 2,800,671 6.7 937 1,145,334 2.7 6,191
PARK WEST 2,248,949 7.8 1,121
PEMBINA TRAILS 13,134,403 7.5 947
PINE CREEK 1,110,987 7.2 1,056 96,500 0.6 8,042
PORTAGE LA PRAIRIE 3,131,558 7.8 939 752,145 1.9 7,302
PRAIRIE ROSE 2,580,614 8.3 1,156
PRAIRIE SPIRIT 2,887,035 10.1 1,425
RED RIVER VALLEY 2,660,995 8.4 1,192 352,880 1.1 15,343
RIVER EAST TRANSCONA 14,029,897 7.2 862 3,973,661 2.0 5,550
ROLLING RIVER 2,052,750 8.5 1,195 136,475 0.6 19,779
SEINE RIVER 4,460,137 8.2 1,028
SEVEN OAKS 11,149,560 7.5 972 1,550,450 1.0 8,054
SOUTHWEST HORIZON 1,536,500 6.6 1,022
ST. JAMES-ASSINIBOIA 8,789,214 8.1 1,052 1,653,605 1.5 7,067
SUNRISE 4,345,463 6.7 978
SWAN VALLEY 1,776,179 8.3 1,290 1,068,134 5.0 8,894
TURTLE MOUNTAIN 826,064 6.0 831 108,613 0.8 3,879
TURTLE RIVER 711,880 6.3 1,018
WESTERN 1,564,772 7.3 839 352,072 1.7 14,083
WINNIPEG 30,377,801 7.4 1,007 6,503,000 1.6 11,013
PROVINCE 181,525,827 7.4 1,006 33,788,474 1.4 8,118 WHITESHELL 227,500 6.3 1,358
MITT 1,538,342 4.6 1,096 4,590,426 13.8 3,586
FUNCTION 100: REGULAR INSTRUCTION
ADMINISTRATION
SENIOR YEARS
TECHNOLOGY EDUCATION
PER
PUPIL
PER
PUPIL

- 19 -
ANALYSIS OF EXPENSE BY PROGRAM PAGE 2 OF 16
OPERATING FUND 2019/2020 BUDGET
FUNCTION 100: REGULAR INSTRUCTION (CONT'D)
DIVISION / DISTRICT AMOUNT % AMOUNT % AMOUNT %
BEAUTIFUL PLAINS 11,546,570 55.5 6,409
BORDER LAND 11,048,310 31.7 8,378
BRANDON 42,451,000 40.2 6,603 1,943,200 1.8 5,844
DSFM 46,159,240 48.3 8,036
EVERGREEN 9,112,399 43.3 6,594
FLIN FLON 4,201,454 28.2 7,463
FORT LA BOSSE 9,481,405 50.6 6,698
FRONTIER 50,033,494 36.7 8,197
GARDEN VALLEY 24,052,500 47.2 5,708
HANOVER 44,394,500 49.8 5,906
INTERLAKE 14,511,276 38.4 6,988
KELSEY 4,719,670 23.0 5,807
LAKESHORE 7,036,141 43.0 7,545
LORD SELKIRK 20,553,855 35.1 7,814 1,543,140 2.6 6,539
LOUIS RIEL 63,144,032 32.8 6,650 25,091,444 13.0 5,444
MOUNTAIN VIEW 15,085,501 36.5 6,947 887,544 2.1 5,801
MYSTERY LAKE 17,152,206 40.9 6,961
PARK WEST 14,841,753 51.6 7,397
PEMBINA TRAILS 54,019,711 30.8 6,626 7,971,599 4.5 6,233
PINE CREEK 8,074,853 52.4 7,761
PORTAGE LA PRAIRIE 16,553,486 41.5 6,743
PRAIRIE ROSE 13,770,601 44.1 7,115 758,916 2.4 5,883
PRAIRIE SPIRIT 10,842,977 37.9 6,903
RED RIVER VALLEY 11,076,365 35.0 6,460 1,973,934 6.2 7,491
RIVER EAST TRANSCONA 59,516,074 30.7 6,527 7,057,399 3.6 5,146
ROLLING RIVER 12,065,565 49.9 7,049
SEINE RIVER 13,566,373 25.1 6,246 4,712,071 8.7 6,132
SEVEN OAKS 46,083,670 31.1 6,980 3,890,764 2.6 6,107
SOUTHWEST HORIZON 11,845,300 50.7 7,881
ST. JAMES-ASSINIBOIA 36,285,280 33.3 6,387 7,712,993 7.1 5,459
SUNRISE 14,333,102 22.0 6,997
SWAN VALLEY 6,932,852 32.6 7,050
TURTLE MOUNTAIN 6,740,620 48.6 6,974
TURTLE RIVER 5,137,694 45.2 7,898 328,357 2.9 6,701
WESTERN 5,385,326 25.3 6,496
WINNIPEG 129,529,225 31.4 6,364 7,756,200 1.9 5,528
PROVINCE 825,125,140 33.7 6,718 46,159,240 1.9 8,036 71,627,561 2.9 5,665 WHITESHELL 1,918,500 53.1 11,454
MITT 447,933 1.3 3,612
(1) 90% or more of Regular Instruction enrolment is in one language.
SINGLE TRACK SCHOOLS (1)
PER
PUPIL
PER
PUPIL
PER
PUPIL
ENGLISH LANGUAGE FRANÇAIS FRENCH IMMERSION

- 20 -
ANALYSIS OF EXPENSE BY PROGRAM PAGE 3 OF 16
OPERATING FUND 2019/2020 BUDGET
DIVISION / DISTRICT AMOUNT %
BEAUTIFUL PLAINS
BORDER LAND 4,715,494 13.5 7,449 633.0 78.5 21.5
BRANDON 7,368,400 7.0 5,101 1,444.5 67.0 33.0
DSFM
EVERGREEN
FLIN FLON 2,366,984 15.9 6,287 376.5 70.9 29.1
FORT LA BOSSE
FRONTIER
GARDEN VALLEY
HANOVER
INTERLAKE 4,140,307 11.0 5,614 737.5 58.4 41.6
KELSEY 4,487,221 21.8 7,302 614.5 78.3 21.7
LAKESHORE
LORD SELKIRK 4,722,815 8.1 6,940 680.5 71.6 16.2 12.3
LOUIS RIEL 3,358,404 1.7 5,050 665.0 51.6 48.4
MOUNTAIN VIEW 2,763,761 6.7 5,367 515.0 71.3 16.7 12.0
MYSTERY LAKE 2,399,724 5.7 7,079 339.0 29.8 70.2
PARK WEST
PEMBINA TRAILS 25,767,429 14.7 5,813 4,432.9 58.5 41.5
PINE CREEK
PORTAGE LA PRAIRIE 3,419,739 8.6 4,393 778.5 59.3 40.7
PRAIRIE ROSE 1,301,909 4.2 7,796 167.0 69.5 30.5
PRAIRIE SPIRIT 2,933,065 10.3 6,432 456.0 50.7 26.2 23.1
RED RIVER VALLEY 1,677,162 5.3 7,229 232.0 31.7 68.3
RIVER EAST TRANSCONA 28,166,324 14.5 5,546 5,078.5 55.6 36.6 7.8
ROLLING RIVER
SEINE RIVER 8,219,887 15.2 5,886 1,396.5 43.6 56.4
SEVEN OAKS 24,923,989 16.8 6,173 4,037.5 60.5 33.9 5.6
SOUTHWEST HORIZON
ST. JAMES-ASSINIBOIA 5,987,042 5.5 5,814 1,029.7 68.4 31.6
SUNRISE 15,498,820 23.8 6,467 2,396.5 64.5 32.1 3.4
SWAN VALLEY 1,938,686 9.1 7,101 273.0 76.6 23.4
TURTLE MOUNTAIN
TURTLE RIVER
WESTERN 5,750,354 27.0 5,688 1,011.0 71.3 28.7
WINNIPEG 41,220,000 10.0 5,272 7,819.0 59.5 37.5 3.0
PROVINCE 203,127,516 8.3 5,785 35,113.6 60.2 0.8 36.0 3.1 WHITESHELL
MITT
(1) No one language program comprises 90% or more of Regular Instruction enrolment.
PER
PUPIL
FUNCTION 100: REGULAR INSTRUCTION (CONT'D)
NO. OF
F.T.E.
PUPILS ENGLISH FRANÇAIS
DUAL TRACK SCHOOLS (1)
% IN DUAL TRACK SCHOOLS
FRENCH
IMMERSION OTHER

- 21 -
ANALYSIS OF EXPENSE BY PROGRAM PAGE 4 OF 16
OPERATING FUND 2019/2020 BUDGET
DIVISION / DISTRICT AMOUNT % AMOUNT % AMOUNT
BEAUTIFUL PLAINS 142,937 0.7 79 196,844 0.9 109 267,358 1.3
BORDER LAND 213,065 0.6 100 867,218 2.5 406
BRANDON 252,900 0.2 29 2,874,200 2.7 331 1,007,500 1.0
DSFM 423,773 0.4 73 1,137,623 1.2 197 1,019,880 1.1
EVERGREEN 236,450 1.1 169 353,540 1.7 252
FLIN FLON 185,663 1.2 198 263,908 1.8 281 164,303 1.1
FORT LA BOSSE 127,060 0.7 88 288,720 1.5 201 189,520 1.0
FRONTIER 1,699,392 1.2 276
GARDEN VALLEY 176,800 0.3 41 1,111,100 2.2 256 1,408,400 2.8
HANOVER 429,600 0.5 54 1,929,800 2.2 243 930,700 1.0
INTERLAKE 167,000 0.4 59 831,560 2.2 296 217,668 0.6
KELSEY 33,485 0.2 23 294,785 1.4 207 888,457 4.3
LAKESHORE 149,250 0.9 158 372,000 2.3 393
LORD SELKIRK 291,930 0.5 77 1,854,165 3.2 489 593,815 1.0
LOUIS RIEL 1,493,834 0.8 100 4,305,748 2.2 288 10,994,120 5.7
MOUNTAIN VIEW 152,829 0.4 51 732,745 1.8 244 105,276 0.3
MYSTERY LAKE 218,039 0.5 73 564,769 1.3 189 2,336,545 5.6
PARK WEST 130,406 0.5 65 423,446 1.5 211
PEMBINA TRAILS 583,136 0.3 42 3,112,496 1.8 224 571,000 0.3
PINE CREEK 148,212 1.0 141 191,776 1.2 182
PORTAGE LA PRAIRIE 179,002 0.4 54 691,112 1.7 207 1,896,245 4.8
PRAIRIE ROSE 155,728 0.5 70 420,840 1.3 189
PRAIRIE SPIRIT 211,700 0.7 104 422,627 1.5 209
RED RIVER VALLEY 246,015 0.8 110 506,109 1.6 227 890,758 2.8
RIVER EAST TRANSCONA 1,041,373 0.5 64 3,218,120 1.7 198 2,496,550 1.3
ROLLING RIVER 206,650 0.9 120 359,125 1.5 209
SEINE RIVER 233,300 0.4 54 742,600 1.4 171
SEVEN OAKS 570,760 0.4 50 2,026,380 1.4 177 675,590 0.5
SOUTHWEST HORIZON 275,600 1.2 183 356,300 1.5 237
ST. JAMES-ASSINIBOIA 606,048 0.6 73 2,819,794 2.6 337 600 0.0
SUNRISE 384,804 0.6 87 1,651,727 2.5 372 831,724 1.3
SWAN VALLEY 173,390 0.8 126 351,142 1.7 255
TURTLE MOUNTAIN 130,683 0.9 131 337,937 2.4 340
TURTLE RIVER 87,389 0.8 125 166,342 1.5 238
WESTERN 151,615 0.7 81 296,847 1.4 159 253,303 1.2
WINNIPEG 772,700 0.2 26 13,296,572 3.2 441 35,548,350 8.6
PROVINCE 10,983,126 0.4 61 51,069,409 2.1 283 63,287,662 2.6 WHITESHELL 28,920 0.8 173 30,000 0.8 179 30,000 1
MITT
FUNCTION 200: STUDENT SUPPORT SERVICES
PER
PUPIL
PER
PUPIL %
ADMINISTRATION /
COORDINATION
CLINICAL AND RELATED
SERVICES
SPECIAL
PLACEMENT

- 22 -
ANALYSIS OF EXPENSE BY PROGRAM PAGE 5 OF 16
OPERATING FUND 2019/2020 BUDGET
DIVISION / DISTRICT AMOUNT % AMOUNT % AMOUNT %
BEAUTIFUL PLAINS 769,251 3.7 427 1,050,274 5.0 583 351,168 1.7 195
BORDER LAND 2,658,336 7.6 1243 1,401,861 4.0 656 411,689 1.2 193
BRANDON 10,809,800 10.2 1246 4,871,600 4.6 562 2,456,500 2.3 283
DSFM 3,827,530 4.0 662 3,005,669 3.1 520 1,686,020 1.8 292
EVERGREEN 1,458,500 6.9 1040 1,071,000 5.1 764 576,700 2.7 411
FLIN FLON 978,950 6.6 1042 927,380 6.2 987 425,010 2.8 452
FORT LA BOSSE 638,150 3.4 444 1,028,550 5.5 716 159,620 0.9 111
FRONTIER 12,172,373 8.9 1976 3,925,434 2.9 637 4,061,789 3.0 659
GARDEN VALLEY 3,278,100 6.4 755 3,055,300 6.0 703 1,228,500 2.4 283
HANOVER 4,319,200 4.8 544 4,756,700 5.3 599 1,610,900 1.8 203
INTERLAKE 2,071,000 5.5 736 2,198,747 5.8 781 1,120,025 3.0 398
KELSEY 857,090 4.2 601 1,422,423 6.9 997 615,125 3.0 431
LAKESHORE 1,410,000 8.6 1490 610,000 3.7 644 327,000 2.0 345
LORD SELKIRK 3,306,515 5.6 871 2,797,885 4.8 737 1,473,860 2.5 388
LOUIS RIEL 10,588,747 5.5 709 8,620,080 4.5 578 3,141,119 1.6 210
MOUNTAIN VIEW 1,855,740 4.5 617 2,045,286 4.9 680 1,325,791 3.2 441
MYSTERY LAKE 2,167,154 5.2 725 2,257,027 5.4 755 1,143,104 2.7 383
PARK WEST 1,228,901 4.3 612 1,494,511 5.2 745 487,178 1.7 243
PEMBINA TRAILS 12,057,028 6.9 870 12,254,504 7.0 884 3,559,264 2.0 257
PINE CREEK 516,123 3.3 490 703,882 4.6 669 299,764 1.9 285
PORTAGE LA PRAIRIE 2,127,281 5.3 638 1,510,170 3.8 453 1,238,260 3.1 371
PRAIRIE ROSE 965,880 3.1 433 2,017,441 6.5 904 752,618 2.4 337
PRAIRIE SPIRIT 1,703,600 6.0 841 1,156,025 4.0 570 459,850 1.6 227
RED RIVER VALLEY 1,506,492 4.8 675 1,602,464 5.1 718 853,933 2.7 382
RIVER EAST TRANSCONA 15,899,983 8.2 976 10,499,482 5.4 645 3,064,000 1.6 188
ROLLING RIVER 923,900 3.8 538 1,212,825 5.0 706 550,500 2.3 320
SEINE RIVER 4,571,000 8.4 1054 2,661,000 4.9 614 1,524,200 2.8 351
SEVEN OAKS 13,447,000 9.1 1172 4,827,130 3.3 421 3,624,350 2.4 316
SOUTHWEST HORIZON 1,576,650 6.7 1049 638,300 2.7 425 372,700 1.6 248
ST. JAMES-ASSINIBOIA 12,036,665 11.0 1440 6,344,141 5.8 759 2,661,187 2.4 318
SUNRISE 5,361,616 8.2 1206 3,464,708 5.3 779 1,088,569 1.7 245
SWAN VALLEY 1,785,148 8.4 1297 861,800 4.1 626 343,313 1.6 249
TURTLE MOUNTAIN 284,480 2.1 286 1,446,242 10.4 1,454 238,514 1.7 240
TURTLE RIVER 987,050 8.7 1411 506,841 4.5 725 77,891 0.7 111
WESTERN 840,819 3.9 451 1,106,389 5.2 593 547,896 2.6 294
WINNIPEG 21,565,400 5.2 715 19,513,842 4.7 647 5,964,800 1.4 198
PROVINCE 162,551,452 6.6 901 118,866,913 4.9 659 49,822,707 2.0 276 WHITESHELL 166,380 4.6 993 55,800 1.5 333 55,300 1.5 330
MITT 390,222 1.2 278 650 0.0 0 530,001 1.6 377
(1) Expenses shown are extra costs associated with special needs students in regular classes, not the total cost of educating
those students.
PER
PUPIL
PER
PUPIL
FUNCTION 200: STUDENT SUPPORT SERVICES (CONT'D)
REGULAR
PLACEMENT (1)
OTHER RESOURCE
SERVICES
COUNSELLING
AND GUIDANCE
PER
PUPIL

- 23 -
ANALYSIS OF EXPENSE BY PROGRAM PAGE 6 OF 16
OPERATING FUND 2019/2020 BUDGET
DIVISION / DISTRICT AMOUNT % AMOUNT %
BEAUTIFUL PLAINS
BORDER LAND 140,800 0.4 476,256 1.4
BRANDON
DSFM 111,569 0.1 147,350 0.2
EVERGREEN
FLIN FLON 22,191 0.1 71,809 0.5
FORT LA BOSSE
FRONTIER 232,565 0.2 1,861,342 1.4
GARDEN VALLEY
HANOVER
INTERLAKE
KELSEY 152,402 0.7 407,783 2.0
LAKESHORE 68,000 0.4 204,000 1.2
LORD SELKIRK 76,200 0.1 279,850 0.5
LOUIS RIEL 567,783 0.3
MOUNTAIN VIEW
MYSTERY LAKE
PARK WEST 116,817 0.4
PEMBINA TRAILS
PINE CREEK
PORTAGE LA PRAIRIE
PRAIRIE ROSE 63,922 0.2 215,192 0.7
PRAIRIE SPIRIT
RED RIVER VALLEY
RIVER EAST TRANSCONA
ROLLING RIVER
SEINE RIVER
SEVEN OAKS 603,588 0.4 1,423,789 1.0
SOUTHWEST HORIZON
ST. JAMES-ASSINIBOIA
SUNRISE 406,644 0.6 587,476 0.9
SWAN VALLEY
TURTLE MOUNTAIN 199,256 1.4
TURTLE RIVER
WESTERN 182,937 0.9 244,524 1.1
WINNIPEG 100,900 0.0 694,900 0.2
PROVINCE 2,161,718 0.1 7,498,127 0.3 WHITESHELL
MITT 905,691 2.7 1,887,647 5.7
ADMINISTRATION
AND OTHER
FUNCTION 300: ADULT LEARNING CENTRES
INSTRUCTION

- 24 -
ANALYSIS OF EXPENSE BY PROGRAM PAGE 7 OF 16
OPERATING FUND 2019/2020 BUDGET
DIVISION / DISTRICT AMOUNT % AMOUNT % AMOUNT % AMOUNT %
BEAUTIFUL PLAINS 25,330 0.1
BORDER LAND 57,887 0.2
BRANDON 155,600 0.1 191,000 0.2
DSFM 1,677,051 1.8
EVERGREEN 78,400 0.4
FLIN FLON 13,940 0.1
FORT LA BOSSE 80,000 0.4 205,520 1.1
FRONTIER 756,322 0.6 1,357,821 1.0
GARDEN VALLEY 91,500 0.2
HANOVER 142,400 0.2
INTERLAKE 137,000 0.4 163,000 0.4
KELSEY 87,890 0.4
LAKESHORE 117,000 0.7 120,000 0.7 40,000 0.2
LORD SELKIRK 191,950 0.3 235,690 0.4
LOUIS RIEL 360,304 0.2 611,836 0.3 1,107,811 0.6
MOUNTAIN VIEW 100,209 0.2
MYSTERY LAKE 50,886 0.1
PARK WEST 193,260 0.7
PEMBINA TRAILS 273,212 0.2 397,056 0.2
PINE CREEK 14,790 0.1
PORTAGE LA PRAIRIE 59,500 0.1
PRAIRIE ROSE 32,640 0.1
PRAIRIE SPIRIT 28,393 0.1
RED RIVER VALLEY 58,518 0.2
RIVER EAST TRANSCONA 361,600 0.2 211,188 0.1
ROLLING RIVER 32,275 0.1
SEINE RIVER 5,000 0.0 430,529 0.8
SEVEN OAKS 632,660 0.4 847,892 0.6 490,980 0.3
SOUTHWEST HORIZON 159,600 0.7
ST. JAMES-ASSINIBOIA 513,782 0.5 363,170 0.3 103,804 0.1
SUNRISE 354,954 0.5
SWAN VALLEY 63,985 0.3
TURTLE MOUNTAIN 13,090 0.1
TURTLE RIVER 24,879 0.2
WESTERN 45,707 0.2
WINNIPEG 3,492,300 0.8 188,000 0.0 5,550,600 1.3
PROVINCE 1,681,636 0.1 4,124,960 0.2 3,724,612 0.2 13,568,503 0.6 WHITESHELL 51,950 1.4 139,050 3.8
MITT 1,871,023 5.6 8,711,751 26.2
FUNCTION 400: COMMUNITY EDUCATION AND SERVICES
CONTINUING
EDUCATION
ENGLISH AS AN
ADDITIONAL LANGUAGE
FOR ADULTS
COMMUNITY SERVICES
& RECREATION
PRE-KINDERGARTEN
EDUCATION

- 25 -
ANALYSIS OF EXPENSE BY PROGRAM PAGE 8 OF 16
OPERATING FUND 2019/2020 BUDGET
DIVISION / DISTRICT AMOUNT % AMOUNT % AMOUNT %
BEAUTIFUL PLAINS 133,050 0.6 74 156,599 0.8 87 349,103 1.7 194
BORDER LAND 175,481 0.5 82 191,749 0.6 90 785,500 2.3 367
BRANDON 350,400 0.3 40 674,100 0.6 78 1,769,900 1.7 204
DSFM 923,919 1.0 160 1,598,340 1.7 277 1,102,600 1.2 191
EVERGREEN 154,190 0.7 110 184,900 0.9 132 368,300 1.8 263
FLIN FLON 112,373 0.8 120 177,162 1.2 189 332,702 2.2 354
FORT LA BOSSE 116,400 0.6 81 173,770 0.9 121 306,740 1.6 213
FRONTIER 1,241,533 0.9 202 2,339,450 1.7 380 3,082,674 2.3 500
GARDEN VALLEY 219,100 0.4 50 392,100 0.8 90 784,700 1.5 181
HANOVER 295,300 0.3 37 597,300 0.7 75 1,340,200 1.5 169
INTERLAKE 169,000 0.4 60 399,500 1.1 142 683,500 1.8 243
KELSEY 124,710 0.6 87 138,920 0.7 97 538,725 2.6 377
LAKESHORE 111,700 0.7 118 136,500 0.8 144 320,450 2.0 339
LORD SELKIRK 300,725 0.5 79 338,240 0.6 89 1,079,035 1.8 284
LOUIS RIEL 481,647 0.3 32 604,159 0.3 40 4,375,495 2.3 293
MOUNTAIN VIEW 227,729 0.6 76 383,906 0.9 128 713,979 1.7 237
MYSTERY LAKE 238,260 0.6 80 509,044 1.2 170 833,635 2.0 279
PARK WEST 147,567 0.5 74 366,850 1.3 183 506,425 1.8 252
PEMBINA TRAILS 473,318 0.3 34 2,148,819 1.2 155 1,639,492 0.9 118
PINE CREEK 119,698 0.8 114 109,258 0.7 104 292,723 1.9 278
PORTAGE LA PRAIRIE 170,670 0.4 51 272,250 0.7 82 541,400 1.4 162
PRAIRIE ROSE 198,000 0.6 89 179,930 0.6 81 652,130 2.1 292
PRAIRIE SPIRIT 183,650 0.6 91 255,700 0.9 126 410,925 1.4 203
RED RIVER VALLEY 174,680 0.6 78 296,157 0.9 133 631,533 2.0 283
RIVER EAST TRANSCONA 477,400 0.2 29 1,224,874 0.6 75 2,381,068 1.2 146
ROLLING RIVER 177,600 0.7 103 176,890 0.7 103 502,195 2.1 292
SEINE RIVER 224,000 0.4 52 469,300 0.9 108 850,500 1.6 196
SEVEN OAKS 420,760 0.3 37 1,277,330 0.9 111 1,859,350 1.3 162
SOUTHWEST HORIZON 152,800 0.7 102 247,200 1.1 164 402,000 1.7 267
ST. JAMES-ASSINIBOIA 408,315 0.4 49 978,690 0.9 117 1,528,435 1.4 183
SUNRISE 281,000 0.4 63 443,115 0.7 100 1,210,004 1.9 272
SWAN VALLEY 193,375 0.9 140 220,026 1.0 160 339,107 1.6 246
TURTLE MOUNTAIN 61,070 0.4 61 143,724 1.0 145 251,693 1.8 253
TURTLE RIVER 97,650 0.9 140 52,192 0.5 75 238,360 2.1 341
WESTERN 136,228 0.6 73 181,751 0.9 97 378,790 1.8 203
WINNIPEG 952,838 0.2 32 3,236,160 0.8 107 6,033,929 1.5 200
PROVINCE 10,426,136 0.4 58 21,275,955 0.9 118 39,417,297 1.6 218 WHITESHELL 48,800 1.4 291 20,490 0.6 122 63,710 1.8 380
MITT 55,470 0.2 40 506,110 1.5 360 4,193,774 12.6 2,987
FUNCTION 500: DIVISIONAL ADMINISTRATION
PER
PUPIL
PER
PUPIL
PER
PUPIL
BOARD OF TRUSTEES
INSTRUCTIONAL MGMT.
AND ADMINISTRATION
BUSINESS AND
ADMIN. SERVICES

- 26 -
ANALYSIS OF EXPENSE BY PROGRAM PAGE 9 OF 16
OPERATING FUND 2019/2020 BUDGET
DIVISION / DISTRICT AMOUNT %
BEAUTIFUL PLAINS 13,200 0.1 7
BORDER LAND 64,520 0.2 30
BRANDON 336,600 0.3 39
DSFM 126,508 0.1 22
EVERGREEN 57,000 0.3 41
FLIN FLON 35,676 0.2 38
FORT LA BOSSE 84,140 0.4 59
FRONTIER 667,254 0.5 108
GARDEN VALLEY 172,300 0.3 40
HANOVER 106,600 0.1 13
INTERLAKE 42,000 0.1 15
KELSEY 75,000 0.4 53
LAKESHORE 20,000 0.1 21
LORD SELKIRK 160,010 0.3 42
LOUIS RIEL 898,669 0.5 60
MOUNTAIN VIEW 34,000 0.1 11
MYSTERY LAKE 222,673 0.5 75
PARK WEST 82,500 0.3 41
PEMBINA TRAILS 1,571,561 0.9 113
PINE CREEK 28,585 0.2 27
PORTAGE LA PRAIRIE 85,800 0.2 26
PRAIRIE ROSE 60,000 0.2 27
PRAIRIE SPIRIT 48,000 0.2 24
RED RIVER VALLEY 36,968 0.1 17
RIVER EAST TRANSCONA 953,198 0.5 59
ROLLING RIVER 30,700 0.1 18
SEINE RIVER 100,800 0.2 23
SEVEN OAKS 585,640 0.4 51
SOUTHWEST HORIZON 55,900 0.2 37
ST. JAMES-ASSINIBOIA 419,297 0.4 50
SUNRISE 118,355 0.2 27
SWAN VALLEY 19,000 0.1 14
TURTLE MOUNTAIN 21,800 0.2 22
TURTLE RIVER 9,000 0.1 13
WESTERN 57,200 0.3 31
WINNIPEG 1,119,900 0.3 37
PROVINCE 8,520,354 0.3 47 WHITESHELL 9,000 0.2 54
MITT 1,999,354 6.0 1,424
PER
PUPIL
MANAGEMENT
INFORMATION SERVICES
FUNCTION 500: (CONT'D)

- 27 -
ANALYSIS OF EXPENSE BY PROGRAM PAGE 10 OF 16
OPERATING FUND 2019/2020 BUDGET
DIVISION / DISTRICT AMOUNT % AMOUNT % AMOUNT %
BEAUTIFUL PLAINS 158,901 0.8 88 275,807 1.3 153
BORDER LAND 305,043 0.9 143
BRANDON 86,000 0.1 10 587,600 0.6 68 994,600 0.9 115
DSFM 193,083 0.2 33 1,766,585 1.8 306 819,457 0.9 142
EVERGREEN 79,900 0.4 57 185,445 0.9 132 266,205 1.3 190
FLIN FLON 167,093 1.1 178
FORT LA BOSSE 90,790 0.5 63 241,970 1.3 168
FRONTIER 2,979,561 2.2 484 1,993,655 1.5 324
GARDEN VALLEY 50,000 0.1 12 251,300 0.5 58 553,200 1.1 127
HANOVER 21,200 0.0 3 531,800 0.6 67 999,200 1.1 126
INTERLAKE 538,356 1.4 191
KELSEY 23,815 0.1 17 69,720 0.3 49 191,065 0.9 134
LAKESHORE 102,000 0.6 108 103,800 0.6 110
LORD SELKIRK 72,605 0.1 19 112,935 0.2 30 640,180 1.1 169
LOUIS RIEL 236,769 0.1 16 1,035,034 0.5 69 4,367,240 2.3 293
MOUNTAIN VIEW 19,557 0.0 7 333,274 0.8 111 543,070 1.3 181
MYSTERY LAKE 618,432 1.5 207 799,037 1.9 267
PARK WEST 47,608 0.2 24 299,060 1.0 149
PEMBINA TRAILS 473,157 0.3 34 752,996 0.4 54 3,699,430 2.1 267
PINE CREEK 434,810 2.8 413
PORTAGE LA PRAIRIE 78,740 0.2 24 107,224 0.3 32 445,325 1.1 133
PRAIRIE ROSE 128,906 0.4 58 324,130 1.0 145
PRAIRIE SPIRIT 88,900 0.3 44 408,825 1.4 202
RED RIVER VALLEY 6,912 0.0 3 149,393 0.5 67 238,596 0.8 107
RIVER EAST TRANSCONA 412,505 0.2 25 750,385 0.4 46 4,897,140 2.5 301
ROLLING RIVER 23,415 0.1 14 119,345 0.5 69 206,700 0.9 120
SEINE RIVER 68,000 0.1 16 621,000 1.1 143 574,750 1.1 133
SEVEN OAKS 85,170 0.1 7 568,160 0.4 50 1,928,773 1.3 168
SOUTHWEST HORIZON 115,400 0.5 77 268,400 1.1 179
ST. JAMES-ASSINIBOIA 41,338 0.0 5 556,134 0.5 67 1,298,382 1.2 155
SUNRISE 72,444 0.1 16 542,795 0.8 122 653,839 1.0 147
SWAN VALLEY 19,066 0.1 14 308,385 1.4 224
TURTLE MOUNTAIN 74,920 0.5 75 225,293 1.6 227
TURTLE RIVER 134,775 1.2 193
WESTERN 239,730 1.1 129
WINNIPEG 688,500 0.2 23 823,300 0.2 27 2,065,500 0.5 68
PROVINCE 2,799,784 0.1 16 14,222,235 0.6 79 32,450,821 1.3 180 WHITESHELL 17,800 0.5 106
MITT 874,917 2.6 623
PER
PUPIL
PER
PUPIL
PER
PUPIL
FUNCTION 600: INSTRUCTIONAL & OTHER SUPPORT SERVICES
CURRICULUM CONSULTING AND
DEVELOPMENT ADMINISTRATION
CURRICULUM CONSULTING
AND DEVELOPMENT
LIBRARY /
MEDIA CENTRE

- 28 -
ANALYSIS OF EXPENSE BY PROGRAM PAGE 11 OF 16
OPERATING FUND 2019/2020 BUDGET
FUNCTION 600: INSTRUCTIONAL & OTHER SUPPORT SERVICES (CONT'D)
DIVISION / DISTRICT AMOUNT % AMOUNT %
BEAUTIFUL PLAINS 171,404 0.8 95 9,949 0.0 6
BORDER LAND 465,192 1.3 218 159,357 0.5 75
BRANDON 1,593,500 1.5 184 124,800 0.1 14
DSFM 394,622 0.4 68 156,139 0.2 27
EVERGREEN 166,906 0.8 119 3,700 0.0 3
FLIN FLON 96,839 0.6 103 43,654 0.3 46
FORT LA BOSSE 108,240 0.6 75 1,500 0.0 1
FRONTIER 834,677 0.6 135 1,795,131 1.3 291
GARDEN VALLEY 630,600 1.2 145 284,100 0.6 65
HANOVER 1,005,500 1.1 127 191,100 0.2 24
INTERLAKE 430,746 1.1 153 118,898 0.3 42
KELSEY 198,593 1.0 139 10,000 0.0 7
LAKESHORE 212,000 1.3 224 7,000 0.0 7
LORD SELKIRK 598,440 1.0 158 240,060 0.4 63
LOUIS RIEL 1,337,557 0.7 90 467,398 0.2 31
MOUNTAIN VIEW 352,849 0.9 117 287,233 0.7 96
MYSTERY LAKE 215,400 0.5 72 29,000 0.1 10
PARK WEST 308,625 1.1 154
PEMBINA TRAILS 1,761,200 1.0 127 570,689 0.3 41
PINE CREEK 166,970 1.1 159 8,542 0.1 8
PORTAGE LA PRAIRIE 392,075 1.0 118 394,456 1.0 118
PRAIRIE ROSE 469,531 1.5 210 1,836 0.0 1
PRAIRIE SPIRIT 216,550 0.8 107 14,375 0.1 7
RED RIVER VALLEY 333,530 1.1 149 71,302 0.2 32
RIVER EAST TRANSCONA 2,347,247 1.2 144 410,000 0.2 25
ROLLING RIVER 156,500 0.6 91 20,400 0.1 12
SEINE RIVER 420,082 0.8 97 86,500 0.2 20
SEVEN OAKS 1,192,240 0.8 104 2,248,030 1.5 196
SOUTHWEST HORIZON 95,350 0.4 63 36,900 0.2 25
ST. JAMES-ASSINIBOIA 1,843,075 1.7 221 313,472 0.3 38
SUNRISE 437,663 0.7 98 29,756 0.0 7
SWAN VALLEY 132,650 0.6 96 54,686 0.3 40
TURTLE MOUNTAIN 132,632 1.0 133 17,775 0.1 18
TURTLE RIVER 31,915 0.3 46 80,000 0.7 114
WESTERN 117,792 0.6 63 194,605 0.9 104
WINNIPEG 3,912,340 0.9 130 2,847,986 0.7 94
PROVINCE 23,281,032 1.0 129 11,330,329 0.5 63 WHITESHELL 45,500 1.3 272 71,600 2.0 427
MITT 75,700 0.2 54
PER
PUPIL
PER
PUPIL
OTHER (1)
PROFESSIONAL AND
STAFF DEVELOPMENT
(1) Includes food services, health services, and other activities related to instructional and other support not included
in previous programs.

- 29 -
ANALYSIS OF EXPENSE BY PROGRAM PAGE 12 OF 16
OPERATING FUND 2019/2020 BUDGET
DIVISION / DISTRICT AMOUNT % AMOUNT % AMOUNT %
BEAUTIFUL PLAINS 88,229 0.4 1,099,568 5.3 15,500 0.1
BORDER LAND 141,671 0.4 2,163,716 6.2
BRANDON 219,100 0.2 2,354,800 2.2
DSFM 276,837 0.3 9,271,812 9.7 238,812 0.3
EVERGREEN 179,100 0.9 1,493,000 7.1
FLIN FLON 375,901 2.5 375 0.0
FORT LA BOSSE 62,230 0.3 1,320,950 7.0 1,500 0.0
FRONTIER 361,582 0.3 7,751,802 5.7 104,095 0.1
GARDEN VALLEY 154,100 0.3 2,719,500 5.3 30,000 0.1
HANOVER 306,900 0.3 3,544,500 4.0 3,700 0.0
INTERLAKE 160,000 0.4 1,998,000 5.3 2,000 0.0
KELSEY 99,835 0.5 482,149 2.3 15,000 0.1
LAKESHORE 97,025 0.6 1,605,890 9.8 4,500 0.0
LORD SELKIRK 204,405 0.3 2,451,785 4.2 5,000 0.0
LOUIS RIEL 383,057 0.2 4,157,684 2.2 10,000 0.0
MOUNTAIN VIEW 250,639 0.6 2,470,626 6.0 10,500 0.0
MYSTERY LAKE 235,000 0.6
PARK WEST 58,455 0.2 1,765,944 6.1 4,500 0.0
PEMBINA TRAILS 194,142 0.1 3,162,331 1.8 100,000 0.1
PINE CREEK 91,075 0.6 1,044,157 6.8
PORTAGE LA PRAIRIE 92,815 0.2 1,033,243 2.6 5,000 0.0
PRAIRIE ROSE 158,570 0.5 2,109,548 6.7
PRAIRIE SPIRIT 119,900 0.4 2,252,825 7.9
RED RIVER VALLEY 155,992 0.5 2,471,010 7.8
RIVER EAST TRANSCONA 389,432 0.2 4,257,000 2.2 30,700 0.0
ROLLING RIVER 56,440 0.2 1,629,550 6.7 11,000 0.0
SEINE RIVER 272,500 0.5 3,103,500 5.7 2,000 0.0
SEVEN OAKS 309,700 0.2 3,045,690 2.1
SOUTHWEST HORIZON 100,000 0.4 2,118,200 9.1 1,000 0.0
ST. JAMES-ASSINIBOIA 145,983 0.1 1,998,280 1.8 5,200 0.0
SUNRISE 460,452 0.7 4,679,185 7.2 8,000 0.0
SWAN VALLEY 126,153 0.6 1,687,299 7.9
TURTLE MOUNTAIN 89,583 0.6 1,103,513 8.0
TURTLE RIVER 32,404 0.3 1,146,350 10.1
WESTERN 50,862 0.2 767,674 3.6 18,000 0.1
WINNIPEG 658,700 0.2 6,253,300 1.5
PROVINCE 6,547,868 0.3 90,890,282 3.7 861,382 0.0 WHITESHELL 15,000 0.4
MITT
FUNCTION 700: TRANSPORTATION OF PUPILS
ADMINISTRATION REGULAR
ALLOWANCES IN LIEU
OF TRANSPORTATION

- 30 -
ANALYSIS OF EXPENSE BY PROGRAM PAGE 13 OF 16
OPERATING FUND 2019/2020 BUDGET
DIVISION / DISTRICT AMOUNT % AMOUNT %
BEAUTIFUL PLAINS 140,000 0.7
BORDER LAND 212,500 0.6
BRANDON 79,400 0.1
DSFM 3,215 0.0
EVERGREEN 100,000 0.5
FLIN FLON 190,165 1.3
FORT LA BOSSE 36,750 0.2
FRONTIER 2,474,602 1.8 1,090,499 0.8
GARDEN VALLEY 291,500 0.6
HANOVER 414,300 0.5
INTERLAKE 140,000 0.4
KELSEY 55,950 0.3
LAKESHORE 20,000 0.1
LORD SELKIRK 93,000 0.2
LOUIS RIEL 79,829 0.0
MOUNTAIN VIEW 226,156 0.5
MYSTERY LAKE 120,000 0.3
PARK WEST 6,000 0.0 109,120 0.4
PEMBINA TRAILS 200,000 0.1
PINE CREEK 119,790 0.8
PORTAGE LA PRAIRIE 44,250 0.1
PRAIRIE ROSE 142,800 0.5
PRAIRIE SPIRIT 78,000 0.3
RED RIVER VALLEY 149,188 0.5
RIVER EAST TRANSCONA 187,508 0.1
ROLLING RIVER 103,000 0.4
SEINE RIVER 51,071 0.1
SEVEN OAKS 579,000 0.4
SOUTHWEST HORIZON 16,400 0.1
ST. JAMES-ASSINIBOIA 134,569 0.1
SUNRISE 53,000 0.1
SWAN VALLEY 91,924 0.4
TURTLE MOUNTAIN 54,544 0.4
TURTLE RIVER 53,905 0.5
WESTERN 60,425 0.3
WINNIPEG 433,500 0.1
PROVINCE 2,480,602 0.1 5,955,258 0.2 WHITESHELL 54,700 1.5
MITT
FUNCTION 700: TRANSPORTATION (CONT'D)
BOARDING OF
STUDENTS
FIELD TRIPS
AND OTHER

- 31 -
ANALYSIS OF EXPENSE BY PROGRAM PAGE 14 OF 16
OPERATING FUND 2019/2020 BUDGET
DIVISION / DISTRICT AMOUNT % AMOUNT % AMOUNT %
BEAUTIFUL PLAINS 78,686 0.4 1,682,195 8.1 150,800 0.7
BORDER LAND 136,425 0.4 2,614,418 7.5 272,900 0.8
BRANDON 442,900 0.4 7,283,500 6.9 732,500 0.7
DSFM 361,057 0.4 8,806,758 9.2 1,020,000 1.1
EVERGREEN 120,680 0.6 2,168,575 10.3 248,000 1.2
FLIN FLON 100,624 0.7 2,034,383 13.6 100,000 0.7
FORT LA BOSSE 84,560 0.5 1,664,520 8.9 69,000 0.4
FRONTIER 975,727 0.7 17,694,075 13.0 2,079,290 1.5
GARDEN VALLEY 130,300 0.3 4,373,200 8.6 101,000 0.2
HANOVER 212,100 0.2 7,848,000 8.8 867,000 1.0
INTERLAKE 161,000 0.4 2,848,000 7.5 350,000 0.9
KELSEY 94,890 0.5 2,330,869 11.3 150,000 0.7
LAKESHORE 75,848 0.5 1,395,450 8.5 140,382 0.9
LORD SELKIRK 133,585 0.2 5,451,405 9.3 555,800 0.9
LOUIS RIEL 679,633 0.4 18,154,735 9.4 431,040 0.2
MOUNTAIN VIEW 180,842 0.4 4,487,504 10.8 259,700 0.6
MYSTERY LAKE 209,239 0.5 4,167,113 9.9 506,000 1.2
PARK WEST 73,225 0.3 3,006,294 10.4 156,017 0.5
PEMBINA TRAILS 1,021,698 0.6 15,765,265 9.0 2,811,200 1.6
PINE CREEK 130,566 0.8 1,221,823 7.9 119,274 0.8
PORTAGE LA PRAIRIE 105,725 0.3 3,495,421 8.8 155,000 0.4
PRAIRIE ROSE 171,643 0.5 2,521,055 8.1 236,314 0.8
PRAIRIE SPIRIT 116,700 0.4 2,741,525 9.6 341,525 1.2
RED RIVER VALLEY 127,586 0.4 2,277,437 7.2 285,742 0.9
RIVER EAST TRANSCONA 972,290 0.5 19,688,725 10.1 662,400 0.3
ROLLING RIVER 64,450 0.3 2,542,100 10.5 110,000 0.5
SEINE RIVER 123,100 0.2 4,257,200 7.9 525,000 1.0
SEVEN OAKS 704,830 0.5 11,997,915 8.1 933,260 0.6
SOUTHWEST HORIZON 88,100 0.4 2,175,100 9.3 160,000 0.7
ST. JAMES-ASSINIBOIA 491,611 0.5 8,754,478 8.0 1,453,613 1.3
SUNRISE 184,986 0.3 5,272,591 8.1 525,060 0.8
SWAN VALLEY 97,686 0.5 1,926,321 9.1 156,197 0.7
TURTLE MOUNTAIN 39,190 0.3 768,208 5.5 136,403 1.0
TURTLE RIVER 33,654 0.3 1,110,205 9.8 50,520 0.4
WESTERN 51,862 0.2 1,689,648 7.9 138,760 0.7
WINNIPEG 1,176,600 0.3 42,621,507 10.3 6,479,300 1.6
PROVINCE 9,953,598 0.4 228,837,518 9.4 23,468,997 1.0 WHITESHELL 28,920 0.8 411,380 11.4 50,000 1.4
MITT 382,621 1.2 3,594,783 10.8
FUNCTION 800: OPERATIONS AND MAINTENANCE
ADMINISTRATION
SCHOOL BUILDINGS
MAINTENANCE REPAIRS

- 32 -
ANALYSIS OF EXPENSE BY PROGRAM PAGE 15 OF 16
OPERATING FUND 2019/2020 BUDGET
DIVISION / DISTRICT AMOUNT % AMOUNT %
BEAUTIFUL PLAINS 63,579 0.3 34,400 0.2
BORDER LAND 330,860 0.9 107,596 0.3
BRANDON 269,400 0.3 209,000 0.2
DSFM 392,314 0.4 306,000 0.3
EVERGREEN 108,875 0.5 78,500 0.4
FLIN FLON 20,282 0.1 21,431 0.1
FORT LA BOSSE 103,890 0.6 57,000 0.3
FRONTIER 3,457,394 2.5 66,300 0.0
GARDEN VALLEY 118,300 0.2 60,700 0.1
HANOVER 201,300 0.2 450,900 0.5
INTERLAKE 181,000 0.5 109,000 0.3
KELSEY 62,305 0.3 30,000 0.1
LAKESHORE 55,200 0.3 12,700 0.1
LORD SELKIRK 160,855 0.3 201,500 0.3
LOUIS RIEL 420,000 0.2 635,000 0.3
MOUNTAIN VIEW 208,634 0.5 100,250 0.2
MYSTERY LAKE 145,175 0.3 160,760 0.4
PARK WEST 79,150 0.3 97,000 0.3
PEMBINA TRAILS 668,691 0.4 1,467,109 0.8
PINE CREEK 59,572 0.4 49,500 0.3
PORTAGE LA PRAIRIE 120,100 0.3 126,500 0.3
PRAIRIE ROSE 150,626 0.5 104,975 0.3
PRAIRIE SPIRIT 122,200 0.4 59,100 0.2
RED RIVER VALLEY 99,570 0.3 108,309 0.3
RIVER EAST TRANSCONA 369,000 0.2 706,000 0.4
ROLLING RIVER 170,580 0.7 86,000 0.4
SEINE RIVER 132,200 0.2 212,000 0.4
SEVEN OAKS 520,960 0.4 492,990 0.3
SOUTHWEST HORIZON 82,900 0.4 70,100 0.3
ST. JAMES-ASSINIBOIA 549,970 0.5 351,312 0.3
SUNRISE 357,354 0.5 315,000 0.5
SWAN VALLEY 156,782 0.7 111,954 0.5
TURTLE MOUNTAIN 124,270 0.9 26,028 0.2
TURTLE RIVER 53,939 0.5 36,000 0.3
WESTERN 51,200 0.2 47,000 0.2
WINNIPEG 2,357,500 0.6 1,632,200 0.4
PROVINCE 12,525,927 0.5 8,740,114 0.4 WHITESHELL 24,000 0.7
MITT 44,318 0.1
FUNCTION 800: (CONT'D)
OTHER BUILDINGS GROUNDS

- 33 -
ANALYSIS OF EXPENSE BY PROGRAM PAGE 16 OF 16
OPERATING FUND 2019/2020 BUDGET
DIVISION / DISTRICT AMOUNT % AMOUNT %
BEAUTIFUL PLAINS 15,000 0.1 350,000 1.7
BORDER LAND 30,000 0.1 534,727 1.5
BRANDON 1,808,100 1.7
DSFM 72,719 0.1 1,372,630 1.4
EVERGREEN 8,500 0.0 320,000 1.5
FLIN FLON 17,500 0.1 225,820 1.5
FORT LA BOSSE 74,000 0.4 312,000 1.7
FRONTIER 15,000 0.0 1,250,000 0.9
GARDEN VALLEY 34,000 0.1 817,000 1.6
HANOVER 226,800 0.3 1,420,900 1.6
INTERLAKE 36,000 0.1 648,000 1.7
KELSEY 10,000 0.0 350,000 1.7
LAKESHORE 5,000 0.0 256,388 1.6
LORD SELKIRK 60,000 0.1 960,000 1.6
LOUIS RIEL 189,700 0.1 3,223,811 1.7
MOUNTAIN VIEW 140,000 0.3 644,020 1.6
MYSTERY LAKE 5,500 0.0 700,400 1.7
PARK WEST 96,600 0.3 414,000 1.4
PEMBINA TRAILS 200,000 0.1 2,900,000 1.7
PINE CREEK 8,000 0.1 249,255 1.6
PORTAGE LA PRAIRIE 35,000 0.1 660,000 1.7
PRAIRIE ROSE 74,400 0.2 533,610 1.7
PRAIRIE SPIRIT 35,000 0.1 440,000 1.5
RED RIVER VALLEY 125,000 0.4 519,589 1.6
RIVER EAST TRANSCONA 59,000 0.0 3,350,000 1.7
ROLLING RIVER 50,000 0.2 393,000 1.6
SEINE RIVER 50,000 0.1 850,000 1.6
SEVEN OAKS 250,000 0.2 2,430,350 1.6
SOUTHWEST HORIZON 66,200 0.3 370,000 1.6
ST. JAMES-ASSINIBOIA 69,696 0.1 1,808,588 1.7
SUNRISE 143,000 0.2 1,063,595 1.6
SWAN VALLEY 5,000 0.0 337,000 1.6
TURTLE MOUNTAIN 56,000 0.4 213,301 1.5
TURTLE RIVER 3,000 0.0 182,832 1.6
WESTERN 30,000 0.1 358,068 1.7
WINNIPEG 452,300 0.1 7,031,000 1.7
PROVINCE 2,747,915 0.1 39,297,984 1.6 WHITESHELL 48,447 1.3
MITT 180,000 0.5 430,675 1.3
FUNCTION 900: FISCAL
DEBT SERVICES
HEALTH AND
POST SECONDARY
EDUCATION TAX LEVY

- 34 -
ANALYSIS OF TRANSPORTATION EXPENSES
OPERATING FUND 2019/2020 BUDGET
DIVISION / DISTRICT AMOUNT
BEAUTIFUL PLAINS 1,099,568 758 1,451 659,344 1.67 426,300 2.58
BORDER LAND 2,163,716 1,620 1,336 1,152,828 1.88 741,768 2.92
BRANDON 2,354,800 3,581 658 845,828 2.78 523,909 4.49
DSFM 9,271,812 4,703 1,971 3,202,920 2.89 1,675,860 5.53
EVERGREEN 1,493,000 960 1,555 750,000 1.99 460,000 3.25
FLIN FLON 375,901 303 1,241 57,846 6.50 37,386 10.05
FORT LA BOSSE 1,320,950 703 1,879 911,605 1.45 586,960 2.25
FRONTIER 7,751,802 5,030 1,541 1,601,000 4.84 1,114,000 6.96
GARDEN VALLEY 2,719,500 2,705 1,005 882,000 3.08 515,000 5.28
HANOVER 3,544,500 5,274 672 1,411,052 2.51 841,297 4.21
INTERLAKE 1,998,000 1,487 1,344 946,641 2.11 529,827 3.77
KELSEY 482,149 400 1,205 155,588 3.10 96,224 5.01
LAKESHORE 1,605,890 718 2,237 948,000 1.69 536,000 3.00
LORD SELKIRK 2,451,785 2,466 994 869,804 2.82 630,540 3.89
LOUIS RIEL 4,157,684 2,615 1,590 864,666 4.81 472,427 8.80
MOUNTAIN VIEW 2,470,626 1,605 1,539 1,289,672 1.92 1,006,363 2.46
MYSTERY LAKE N/A N/A N/A
PARK WEST 1,765,944 771 2,290 1,199,725 1.47 742,960 2.38
PEMBINA TRAILS 3,162,331 2,900 1,090 605,000 5.23 345,000 9.17
PINE CREEK 1,044,157 539 1,937 531,549 1.96 440,743 2.37
PORTAGE LA PRAIRIE 1,033,243 1,138 908 627,072 1.65 404,432 2.55
PRAIRIE ROSE 2,109,548 1,521 1,387 1,138,867 1.85 752,544 2.80
PRAIRIE SPIRIT 2,252,825 1,141 1,974 1,533,000 1.47 900,000 2.50
RED RIVER VALLEY 2,471,010 1,392 1,775 1,223,445 2.02 919,161 2.69
RIVER EAST TRANSCONA 4,257,000 4,075 1,045 1,094,800 3.89 543,150 7.84
ROLLING RIVER 1,629,550 925 1,762 832,150 1.96 527,340 3.09
SEINE RIVER 3,103,500 3,003 1,033 1,423,000 2.18 865,000 3.59
SEVEN OAKS 3,045,690 2,718 1,121 726,516 4.19 552,234 5.52
SOUTHWEST HORIZON 2,118,200 795 2,664 1,091,130 1.94 656,010 3.23
ST. JAMES-ASSINIBOIA 1,998,280 1,757 1,137 452,010 4.42 319,701 6.25
SUNRISE 4,679,185 3,677 1,273 2,193,645 2.13 1,575,735 2.97
SWAN VALLEY 1,687,299 1,270 1,329 785,887 2.15 667,312 2.53
TURTLE MOUNTAIN 1,103,513 510 2,164 621,866 1.77 399,613 2.76
TURTLE RIVER 1,146,350 489 2,344 721,380 1.59 500,489 2.29
WESTERN 767,674 1,175 653 273,000 2.81 164,500 4.67
WINNIPEG 6,253,300 2,333 2,680 920,974 6.79 580,544 10.77
PROVINCE 90,890,282 67,057 1,355 34,543,810 2.63 22,050,329 4.12 WHITESHELL N/A N/A N/A
MITT
REGULAR TRANSPORTATION
(PROGRAM 720)
TRANSPORTED
PUPILS
PER
PUPIL
TOTAL KM.
(ROUTES)
COST
PER KM.
LOADED
KM.
COST
PER KM.
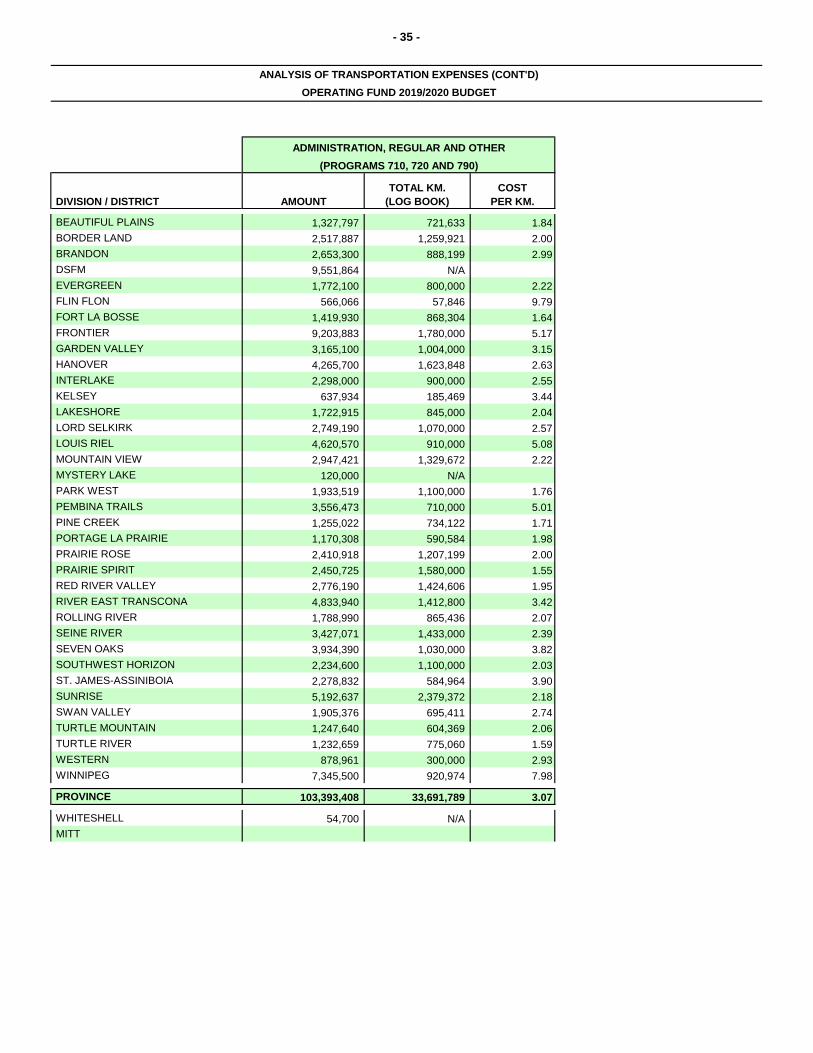
- 35 -
ANALYSIS OF TRANSPORTATION EXPENSES (CONT'D)
OPERATING FUND 2019/2020 BUDGET
DIVISION / DISTRICT AMOUNT
BEAUTIFUL PLAINS 1,327,797 721,633 1.84
BORDER LAND 2,517,887 1,259,921 2.00
BRANDON 2,653,300 888,199 2.99
DSFM 9,551,864 N/A
EVERGREEN 1,772,100 800,000 2.22
FLIN FLON 566,066 57,846 9.79
FORT LA BOSSE 1,419,930 868,304 1.64
FRONTIER 9,203,883 1,780,000 5.17
GARDEN VALLEY 3,165,100 1,004,000 3.15
HANOVER 4,265,700 1,623,848 2.63
INTERLAKE 2,298,000 900,000 2.55
KELSEY 637,934 185,469 3.44
LAKESHORE 1,722,915 845,000 2.04
LORD SELKIRK 2,749,190 1,070,000 2.57
LOUIS RIEL 4,620,570 910,000 5.08
MOUNTAIN VIEW 2,947,421 1,329,672 2.22
MYSTERY LAKE 120,000 N/A
PARK WEST 1,933,519 1,100,000 1.76
PEMBINA TRAILS 3,556,473 710,000 5.01
PINE CREEK 1,255,022 734,122 1.71
PORTAGE LA PRAIRIE 1,170,308 590,584 1.98
PRAIRIE ROSE 2,410,918 1,207,199 2.00
PRAIRIE SPIRIT 2,450,725 1,580,000 1.55
RED RIVER VALLEY 2,776,190 1,424,606 1.95
RIVER EAST TRANSCONA 4,833,940 1,412,800 3.42
ROLLING RIVER 1,788,990 865,436 2.07
SEINE RIVER 3,427,071 1,433,000 2.39
SEVEN OAKS 3,934,390 1,030,000 3.82
SOUTHWEST HORIZON 2,234,600 1,100,000 2.03
ST. JAMES-ASSINIBOIA 2,278,832 584,964 3.90
SUNRISE 5,192,637 2,379,372 2.18
SWAN VALLEY 1,905,376 695,411 2.74
TURTLE MOUNTAIN 1,247,640 604,369 2.06
TURTLE RIVER 1,232,659 775,060 1.59
WESTERN 878,961 300,000 2.93
WINNIPEG 7,345,500 920,974 7.98
PROVINCE 103,393,408 33,691,789 3.07 WHITESHELL 54,700 N/A
MITT
ADMINISTRATION, REGULAR AND OTHER
(PROGRAMS 710, 720 AND 790)
TOTAL KM.
(LOG BOOK)
COST
PER KM.

- 36 -
ANALYSIS OF OPERATIONS AND MAINTENANCE EXPENSES FOR SCHOOL BUILDINGS
OPERATING FUND 2019/2020 BUDGET
DIVISION / DISTRICT AMOUNT AMOUNT
BEAUTIFUL PLAINS 1,682,195 934 6.06 154 150,800 0.54
BORDER LAND 2,614,418 1,223 6.70 183 272,900 0.70
BRANDON 7,283,500 840 6.87 122 732,500 0.69
DSFM 8,806,758 1,524 8.92 171 1,020,000 1.03
EVERGREEN 2,168,575 1,547 7.45 208 248,000 0.85
FLIN FLON 2,034,383 2,165 9.70 223 100,000 0.48
FORT LA BOSSE 1,664,520 1,158 6.35 182 69,000 0.26
FRONTIER 17,694,075 2,872 12.14 237 2,079,290 1.43
GARDEN VALLEY 4,373,200 1,007 6.87 147 101,000 0.16
HANOVER 7,848,000 988 7.39 134 867,000 0.82
INTERLAKE 2,848,000 1,012 6.20 163 350,000 0.76
KELSEY 2,330,869 1,633 6.84 239 150,000 0.44
LAKESHORE 1,395,450 1,474 5.98 246 140,382 0.60
LORD SELKIRK 5,451,405 1,436 7.66 188 555,800 0.78
LOUIS RIEL 18,154,735 1,216 7.83 155 431,040 0.19
MOUNTAIN VIEW 4,487,504 1,492 5.83 256 259,700 0.34
MYSTERY LAKE 4,167,113 1,395 8.91 156 506,000 1.08
PARK WEST 3,006,294 1,498 6.78 221 156,017 0.35
PEMBINA TRAILS 15,765,265 1,137 8.55 133 2,811,200 1.52
PINE CREEK 1,221,823 1,161 5.83 199 119,274 0.57
PORTAGE LA PRAIRIE 3,495,421 1,048 5.76 182 155,000 0.26
PRAIRIE ROSE 2,521,055 1,130 6.54 173 236,314 0.61
PRAIRIE SPIRIT 2,741,525 1,353 5.57 243 341,525 0.69
RED RIVER VALLEY 2,277,437 1,020 6.04 169 285,742 0.76
RIVER EAST TRANSCONA 19,688,725 1,209 8.04 150 662,400 0.27
ROLLING RIVER 2,542,100 1,479 7.90 187 110,000 0.34
SEINE RIVER 4,257,200 982 7.21 136 525,000 0.89
SEVEN OAKS 11,997,915 1,046 8.69 120 933,260 0.68
SOUTHWEST HORIZON 2,175,100 1,447 6.85 211 160,000 0.50
ST. JAMES-ASSINIBOIA 8,754,478 1,047 6.00 175 1,453,613 1.00
SUNRISE 5,272,591 1,186 7.10 167 525,060 0.71
SWAN VALLEY 1,926,321 1,399 6.00 233 156,197 0.49
TURTLE MOUNTAIN 768,208 772 4.21 184 136,403 0.75
TURTLE RIVER 1,110,205 1,587 6.14 258 50,520 0.28
WESTERN 1,689,648 906 7.72 117 138,760 0.63
WINNIPEG 42,621,507 1,413 8.41 168 6,479,300 1.28
PROVINCE 228,837,518 1,268 7.75 164 23,468,997 0.79 WHITESHELL 411,380 2,456 5.63 436 50,000 N/A
MITT 3,594,783 2,560 N/A N/A N/A
(1) Based on area (square footage) of active school buildings as at September 30, 2018. Includes rented and leased space.
(2) Square footage (as per note above) divided by total FTE enrolment (from page 7).
MAINTENANCE
REPAIRS AND
REPLACEMENTS
COST PER
PUPIL
COST PER
SQ. FT. (1)
COST PER
SQ. FT. (1)
SQ. FT. PER
PUPIL (2)

- 37 -
ANALYSIS OF INFORMATION TECHNOLOGY EXPENSES
OPERATING FUND 2019/2020 BUDGET
DIVISION / DISTRICT AMOUNT % AMOUNT % AMOUNT %
BEAUTIFUL PLAINS 145,997 0.7 81 194,135 0.9 108 213,779 1.0 119
BORDER LAND 370,036 1.1 173 361,189 1.0 169 425,674 1.2 199
BRANDON 553,500 0.5 64 583,200 0.6 67 1,000,500 0.9 115
DSFM 569,882 0.6 99 473,807 0.5 82 627,106 0.7 109
EVERGREEN 142,000 0.7 101 181,000 0.9 129 81,500 0.4 58
FLIN FLON 54,247 0.4 58 130,838 0.9 139 51,133 0.3 54
FORT LA BOSSE 121,000 0.6 84 150,910 0.8 105 138,255 0.7 96
FRONTIER 356,864 0.3 58 1,578,027 1.2 256
GARDEN VALLEY 480,000 0.9 110 239,700 0.5 55 657,500 1.3 151
HANOVER 761,700 0.9 96 381,900 0.4 48 1,779,100 2.0 224
INTERLAKE 366,000 1.0 130 152,100 0.4 54 434,490 1.2 154
KELSEY 176,000 0.9 123 21,780 0.1 15 2,500 0.0 2
LAKESHORE 124,000 0.8 131 90,500 0.6 96 150,000 0.9 158
LORD SELKIRK 482,625 0.8 127 474,105 0.8 125 962,500 1.6 254
LOUIS RIEL 970,285 0.5 65 1,068,800 0.6 72 2,049,021 1.1 137
MOUNTAIN VIEW 398,127 1.0 132 444,000 1.1 148 354,099 0.9 118
MYSTERY LAKE 159,875 0.4 54 220,600 0.5 74 152,800 0.4 51
PARK WEST 237,863 0.8 119 278,525 1.0 139 264,060 0.9 132
PEMBINA TRAILS 1,059,004 0.6 76 1,254,150 0.7 90 1,972,000 1.1 142
PINE CREEK 135,685 0.9 129 128,090 0.8 122 127,579 0.8 121
PORTAGE LA PRAIRIE 284,000 0.7 85 182,800 0.5 55 275,300 0.7 83
PRAIRIE ROSE 230,834 0.7 103 185,360 0.6 83 269,517 0.9 121
PRAIRIE SPIRIT 367,475 1.3 181 291,650 1.0 144 174,950 0.6 86
RED RIVER VALLEY 332,470 1.0 149 258,413 0.8 116 187,764 0.6 84
RIVER EAST TRANSCONA 804,000 0.4 49 791,250 0.4 49 1,796,450 0.9 110
ROLLING RIVER 197,900 0.8 115 346,575 1.4 202 222,500 0.9 129
SEINE RIVER 311,000 0.6 72 637,200 1.2 147 626,400 1.2 144
SEVEN OAKS 367,120 0.2 32 615,170 0.4 54 1,348,400 0.9 118
SOUTHWEST HORIZON 180,000 0.8 120 155,000 0.7 103 89,000 0.4 59
ST. JAMES-ASSINIBOIA 704,276 0.6 84 593,287 0.5 71 907,686 0.8 109
SUNRISE 393,238 0.6 88 643,895 1.0 145 255,238 0.4 57
SWAN VALLEY 191,924 0.9 139 233,145 1.1 169 104,400 0.5 76
TURTLE MOUNTAIN 55,730 0.4 56 92,230 0.7 93 141,831 1.0 143
TURTLE RIVER 124,254 1.1 178 86,000 0.8 123 139,825 1.2 200
WESTERN 236,583 1.1 127 85,990 0.4 46 149,650 0.7 80
WINNIPEG 1,042,700 0.3 35 1,673,100 0.4 55 2,833,800 0.7 94
PROVINCE 13,488,194 0.6 75 13,700,394 0.6 76 22,544,334 0.9 125 WHITESHELL 55,000 1.5 328 75,000 2.1 448
MITT 307,800 0.9 219 78,500 0.2 56
(1) Excludes information technology expenses in Function 300 (Adult Learning Centres) and Function 400 (Community Education and Services)
and Management Information Services in Function 500. Total expenses for Management Information Services are included on page 38 and
form part of total Information Technology Expenses.
INFORMATION TECHNOLOGY EXPENSES (1)
SALARIES SERVICES
PER
PUPIL
PER
PUPIL
PER
PUPIL
EQUIPMENT

- 38 -
ANALYSIS OF INFORMATION TECHNOLOGY EXPENSES
OPERATING FUND 2019/2020 BUDGET
DIVISION / DISTRICT AMOUNT % AMOUNT %
BEAUTIFUL PLAINS 13,200 0.1 7 567,111 2.7 315
BORDER LAND 64,520 0.2 30 1,221,419 3.5 571
BRANDON 336,600 0.3 39 2,473,800 2.3 285
DSFM 126,508 0.1 22 1,797,303 1.9 311
EVERGREEN 57,000 0.3 41 461,500 2.2 329
FLIN FLON 35,676 0.2 38 271,894 1.8 289
FORT LA BOSSE 84,140 0.4 59 494,305 2.6 344
FRONTIER 667,254 0.5 108 2,602,145 1.9 422
GARDEN VALLEY 172,300 0.3 40 1,549,500 3.0 357
HANOVER 106,600 0.1 13 3,029,300 3.4 381
INTERLAKE 42,000 0.1 15 994,590 2.6 353
KELSEY 75,000 0.4 53 275,280 1.3 193
LAKESHORE 20,000 0.1 21 384,500 2.3 406
LORD SELKIRK 160,010 0.3 42 2,079,240 3.6 548
LOUIS RIEL 898,669 0.5 60 4,986,775 2.6 334
MOUNTAIN VIEW 34,000 0.1 11 1,230,226 3.0 409
MYSTERY LAKE 222,673 0.5 75 755,948 1.8 253
PARK WEST 82,500 0.3 41 862,948 3.0 430
PEMBINA TRAILS 1,571,561 0.9 113 5,856,715 3.3 422
PINE CREEK 28,585 0.2 27 419,939 2.7 399
PORTAGE LA PRAIRIE 85,800 0.2 26 827,900 2.1 248
PRAIRIE ROSE 60,000 0.2 27 745,711 2.4 334
PRAIRIE SPIRIT 48,000 0.2 24 882,075 3.1 435
RED RIVER VALLEY 36,968 0.1 17 815,615 2.6 365
RIVER EAST TRANSCONA 953,198 0.5 59 4,344,898 2.2 267
ROLLING RIVER 30,700 0.1 18 797,675 3.3 464
SEINE RIVER 100,800 0.2 23 1,675,400 3.1 386
SEVEN OAKS 585,640 0.4 51 2,916,330 2.0 254
SOUTHWEST HORIZON 55,900 0.2 37 479,900 2.1 319
ST. JAMES-ASSINIBOIA 419,297 0.4 50 2,624,546 2.4 314
SUNRISE 118,355 0.2 27 1,410,726 2.2 317
SWAN VALLEY 19,000 0.1 14 548,469 2.6 398
TURTLE MOUNTAIN 21,800 0.2 22 311,591 2.2 313
TURTLE RIVER 9,000 0.1 13 359,079 3.2 513
WESTERN 57,200 0.3 31 529,423 2.5 284
WINNIPEG 1,119,900 0.3 37 6,669,500 1.6 221
PROVINCE 8,520,354 0.3 47 58,253,276 2.4 323 WHITESHELL 9,000 0.2 54 139,000 3.8 830
MITT 1,999,354 6.0 1,424 2,385,654 7.2 1,699
(1) Excludes information technology expenses in Function 300 (Adult Learning Centres) and Function 400 (Community Education and Services).
(2) Total Management Information Services expenses in Function 500 (from page 26).
INFORMATION TECHNOLOGY EXPENSES (1)
TOTAL
PER
PUPIL
PER
PUPIL
MANAGEMENT
INFORMATION SERVICES (2)

- 39
-
PROVINCIAL58.8%
FEDERAL0.2%
MUNICIPAL35.3%
OTHER DIVISIONS0.5%
FIRST NATIONS4.1%
PRIVATE0.8%
OTHER0.2%
2019/20 OPERATING FUNDREVENUE BY SOURCE

- 40 -
SUMMARY OF OPERATING FUND REVENUE: 2019/2020 BUDGET
DIVISION / DISTRICT PROVINCIAL(1)
FEDERAL MUNICIPAL OTHER
BEAUTIFUL PLAINS 63.0 36.4 0.2 0.1 0.4
BORDER LAND 58.7 35.2 1.7 3.5 0.4 0.5
BRANDON 60.3 0.0 38.0 0.4 0.2 0.8 0.3
DSFM 70.4 0.1 27.0 2.3 0.1 0.0
EVERGREEN 58.8 39.9 0.3 0.6 0.4 0.1
FLIN FLON 72.6 23.7 1.7 1.3 0.6
FORT LA BOSSE 51.7 43.5 0.1 4.6 0.1
FRONTIER 34.5 2.3 59.6 3.2 0.3
GARDEN VALLEY 66.5 32.0 0.7 0.0 0.8
HANOVER 68.9 30.4 0.1 0.5 0.2
INTERLAKE 57.1 41.9 0.1 0.5 0.4
KELSEY 83.4 0.1 15.9 0.0 0.1 0.3
LAKESHORE 70.7 1.7 23.9 0.4 1.5 1.5 0.3
LORD SELKIRK 55.5 42.7 0.2 0.7 0.6 0.2
LOUIS RIEL 58.5 39.7 0.3 1.4 0.1
MOUNTAIN VIEW 63.2 0.0 32.2 1.3 1.5 1.3 0.5
MYSTERY LAKE 82.0 16.4 0.3 0.7 0.5 0.1
PARK WEST 45.6 28.4 0.2 25.7 0.0 0.0
PEMBINA TRAILS 49.5 48.1 0.3 1.9 0.1
PINE CREEK 56.8 42.8 0.3 0.1
PORTAGE LA PRAIRIE 57.5 37.6 0.4 4.3 0.0 0.1
PRAIRIE ROSE 53.2 46.2 0.3 0.0 0.3
PRAIRIE SPIRIT 57.6 0.1 40.6 0.1 0.7 0.5 0.3
RED RIVER VALLEY 48.3 0.1 46.5 4.6 0.4 0.1
RIVER EAST TRANSCONA 64.8 34.6 0.1 0.2 0.2
ROLLING RIVER 53.5 0.2 40.6 0.3 5.0 0.1 0.3
SEINE RIVER 67.7 0.0 31.7 0.5 0.1
SEVEN OAKS 66.2 0.7 30.8 0.9 0.5 0.9 0.0
SOUTHWEST HORIZON 49.4 50.0 0.4 0.2
ST. JAMES-ASSINIBOIA 50.7 0.0 46.0 0.5 0.1 1.9 0.7
SUNRISE 55.4 44.0 0.1 0.4 0.1
SWAN VALLEY 67.1 30.0 0.0 0.7 1.2 0.9
TURTLE MOUNTAIN 54.9 44.6 0.3 0.0 0.1
TURTLE RIVER 74.4 24.9 0.6 0.2
WESTERN 64.5 0.1 34.0 0.3 1.1 0.1
WINNIPEG 58.8 0.9 38.6 0.6 0.5 0.4 0.2
PROVINCE 58.8 0.2 35.3 0.5 4.1 0.8 0.2 WHITESHELL 38.9 58.4 0.9 0.4 1.4
MITT 30.2 6.9 6.6 53.4 2.9
(1) The portion shown here is comprised of operating support only. The total provincial contribution to K-12 public school education, which also
includes teachers' retirement allowances, capital support and the education property tax credit, is projected to be 70.7% in 2019/20. See page i
for more information.
% OF OPERATING FUND REVENUES
GOVERNMENTS OTHER
SCHOOL
DIVISIONS
FIRST
NATIONS
PRIVATE
ORG.'S &
INDIVIDUALS
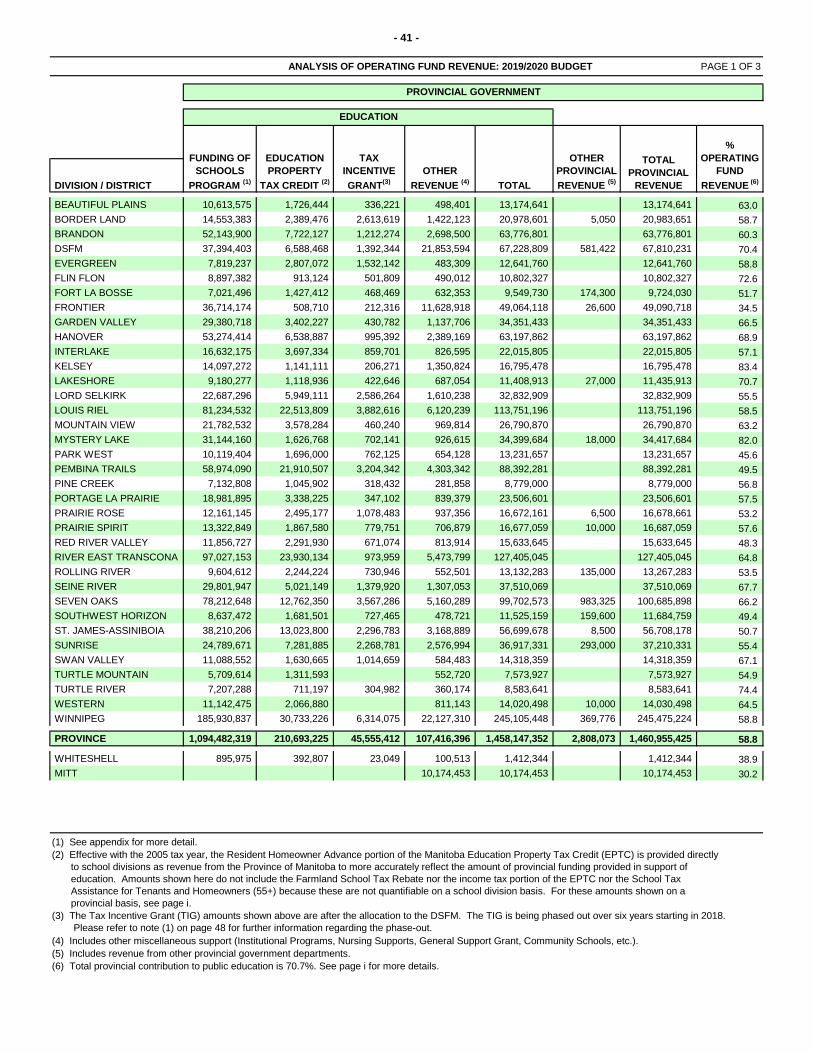
- 41 -
ANALYSIS OF OPERATING FUND REVENUE: 2019/2020 BUDGET PAGE 1 OF 3
DIVISION / DISTRICT TOTAL
BEAUTIFUL PLAINS 10,613,575 1,726,444 336,221 498,401 13,174,641 13,174,641 63.0
BORDER LAND 14,553,383 2,389,476 2,613,619 1,422,123 20,978,601 5,050 20,983,651 58.7
BRANDON 52,143,900 7,722,127 1,212,274 2,698,500 63,776,801 63,776,801 60.3
DSFM 37,394,403 6,588,468 1,392,344 21,853,594 67,228,809 581,422 67,810,231 70.4
EVERGREEN 7,819,237 2,807,072 1,532,142 483,309 12,641,760 12,641,760 58.8
FLIN FLON 8,897,382 913,124 501,809 490,012 10,802,327 10,802,327 72.6
FORT LA BOSSE 7,021,496 1,427,412 468,469 632,353 9,549,730 174,300 9,724,030 51.7
FRONTIER 36,714,174 508,710 212,316 11,628,918 49,064,118 26,600 49,090,718 34.5
GARDEN VALLEY 29,380,718 3,402,227 430,782 1,137,706 34,351,433 34,351,433 66.5
HANOVER 53,274,414 6,538,887 995,392 2,389,169 63,197,862 63,197,862 68.9
INTERLAKE 16,632,175 3,697,334 859,701 826,595 22,015,805 22,015,805 57.1
KELSEY 14,097,272 1,141,111 206,271 1,350,824 16,795,478 16,795,478 83.4
LAKESHORE 9,180,277 1,118,936 422,646 687,054 11,408,913 27,000 11,435,913 70.7
LORD SELKIRK 22,687,296 5,949,111 2,586,264 1,610,238 32,832,909 32,832,909 55.5
LOUIS RIEL 81,234,532 22,513,809 3,882,616 6,120,239 113,751,196 113,751,196 58.5
MOUNTAIN VIEW 21,782,532 3,578,284 460,240 969,814 26,790,870 26,790,870 63.2
MYSTERY LAKE 31,144,160 1,626,768 702,141 926,615 34,399,684 18,000 34,417,684 82.0
PARK WEST 10,119,404 1,696,000 762,125 654,128 13,231,657 13,231,657 45.6
PEMBINA TRAILS 58,974,090 21,910,507 3,204,342 4,303,342 88,392,281 88,392,281 49.5
PINE CREEK 7,132,808 1,045,902 318,432 281,858 8,779,000 8,779,000 56.8
PORTAGE LA PRAIRIE 18,981,895 3,338,225 347,102 839,379 23,506,601 23,506,601 57.5
PRAIRIE ROSE 12,161,145 2,495,177 1,078,483 937,356 16,672,161 6,500 16,678,661 53.2
PRAIRIE SPIRIT 13,322,849 1,867,580 779,751 706,879 16,677,059 10,000 16,687,059 57.6
RED RIVER VALLEY 11,856,727 2,291,930 671,074 813,914 15,633,645 15,633,645 48.3
RIVER EAST TRANSCONA 97,027,153 23,930,134 973,959 5,473,799 127,405,045 127,405,045 64.8
ROLLING RIVER 9,604,612 2,244,224 730,946 552,501 13,132,283 135,000 13,267,283 53.5
SEINE RIVER 29,801,947 5,021,149 1,379,920 1,307,053 37,510,069 37,510,069 67.7
SEVEN OAKS 78,212,648 12,762,350 3,567,286 5,160,289 99,702,573 983,325 100,685,898 66.2
SOUTHWEST HORIZON 8,637,472 1,681,501 727,465 478,721 11,525,159 159,600 11,684,759 49.4
ST. JAMES-ASSINIBOIA 38,210,206 13,023,800 2,296,783 3,168,889 56,699,678 8,500 56,708,178 50.7
SUNRISE 24,789,671 7,281,885 2,268,781 2,576,994 36,917,331 293,000 37,210,331 55.4
SWAN VALLEY 11,088,552 1,630,665 1,014,659 584,483 14,318,359 14,318,359 67.1
TURTLE MOUNTAIN 5,709,614 1,311,593 552,720 7,573,927 7,573,927 54.9
TURTLE RIVER 7,207,288 711,197 304,982 360,174 8,583,641 8,583,641 74.4
WESTERN 11,142,475 2,066,880 811,143 14,020,498 10,000 14,030,498 64.5
WINNIPEG 185,930,837 30,733,226 6,314,075 22,127,310 245,105,448 369,776 245,475,224 58.8
PROVINCE 1,094,482,319 210,693,225 45,555,412 107,416,396 1,458,147,352 2,808,073 1,460,955,425 58.8 WHITESHELL 895,975 392,807 23,049 100,513 1,412,344 1,412,344 38.9
MITT 10,174,453 10,174,453 10,174,453 30.2
(1) See appendix for more detail.
(4) Includes other miscellaneous support (Institutional Programs, Nursing Supports, General Support Grant, Community Schools, etc.).
(5) Includes revenue from other provincial government departments.
(6) Total provincial contribution to public education is 70.7%. See page i for more details.
(3) The Tax Incentive Grant (TIG) amounts shown above are after the allocation to the DSFM. The TIG is being phased out over six years starting in 2018.
Please refer to note (1) on page 48 for further information regarding the phase-out.
(2) Effective with the 2005 tax year, the Resident Homeowner Advance portion of the Manitoba Education Property Tax Credit (EPTC) is provided directly
to school divisions as revenue from the Province of Manitoba to more accurately reflect the amount of provincial funding provided in support of
education. Amounts shown here do not include the Farmland School Tax Rebate nor the income tax portion of the EPTC nor the School Tax
Assistance for Tenants and Homeowners (55+) because these are not quantifiable on a school division basis. For these amounts shown on a
provincial basis, see page i.
EDUCATION
PROVINCIAL GOVERNMENT
FUNDING OF
SCHOOLS
PROGRAM (1)
EDUCATION
PROPERTY
TAX CREDIT (2)
TAX
INCENTIVE
GRANT(3)
OTHER
REVENUE (4)
OTHER
PROVINCIAL
REVENUE (5)
TOTAL
PROVINCIAL
REVENUE
%
OPERATING
FUND
REVENUE (6)

- 42 -
ANALYSIS OF OPERATING FUND REVENUE: 2019/2020 BUDGET PAGE 2 OF 3
DIVISION / DISTRICT REVENUE % REVENUE % REVENUE % REVENUE %
BEAUTIFUL PLAINS 7,601,370 36.4 35,000 0.2
BORDER LAND 12,574,814 35.2 610,000 1.7 1,238,000 3.5
BRANDON 18,500 0.0 40,192,499 38.0 457,400 0.4 195,200 0.2
DSFM 142,000 0.1 26,055,766 27.0 2,219,389 2.3
EVERGREEN 8,582,416 39.9 61,000 0.3 120,000 0.6
FLIN FLON 3,531,196 23.7 258,497 1.7
FORT LA BOSSE 8,186,265 43.5 25,000 0.1 863,460 4.6
FRONTIER 3,248,562 2.3 84,730,358 59.6
GARDEN VALLEY 16,496,859 32.0 345,000 0.7
HANOVER 27,878,470 30.4 86,000 0.1
INTERLAKE 16,170,965 41.9 25,000 0.1
KELSEY 26,000 0.1 3,208,684 15.9 10,000 0.0 20,000 0.1
LAKESHORE 270,192 1.7 3,872,288 23.9 70,000 0.4 250,000 1.5
LORD SELKIRK 25,216,906 42.7 145,500 0.2 440,000 0.7
LOUIS RIEL 77,148,599 39.7 550,000 0.3
MOUNTAIN VIEW 20,010 0.0 13,622,162 32.2 540,022 1.3 617,496 1.5
MYSTERY LAKE 6,882,243 16.4 110,000 0.3 300,000 0.7
PARK WEST 8,246,923 28.4 65,600 0.2 7,475,609 25.7
PEMBINA TRAILS 85,891,155 48.1 525,000 0.3
PINE CREEK 6,623,119 42.8 44,000 0.3
PORTAGE LA PRAIRIE 15,357,535 37.6 180,000 0.4 1,776,000 4.3
PRAIRIE ROSE 14,491,814 46.2 102,000 0.3
PRAIRIE SPIRIT 34,680 0.1 11,770,203 40.6 39,000 0.1 200,000 0.7
RED RIVER VALLEY 21,225 0.1 15,061,942 46.5 1,492,200 4.6
RIVER EAST TRANSCONA 68,112,778 34.6 215,000 0.1
ROLLING RIVER 46,565 0.2 10,052,682 40.6 64,000 0.3 1,242,700 5.0
SEINE RIVER 15,000 0.0 17,554,931 31.7 250,000 0.5
SEVEN OAKS 1,030,900 0.7 46,922,293 30.8 1,300,000 0.9 750,000 0.5
SOUTHWEST HORIZON 11,819,876 50.0 100,000 0.4
ST. JAMES-ASSINIBOIA 9,680 0.0 51,500,361 46.0 563,500 0.5 150,000 0.1
SUNRISE 29,550,279 44.0 74,870 0.1 245,144 0.4
SWAN VALLEY 6,409,216 30.0 10,000 0.0 140,250 0.7
TURTLE MOUNTAIN 6,159,711 44.6 43,816 0.3
TURTLE RIVER 2,867,421 24.9 66,300 0.6
WESTERN 20,000 0.1 7,385,494 34.0 55,250 0.3
WINNIPEG 3,696,101 0.9 160,926,875 38.6 2,517,500 0.6 2,270,000 0.5
PROVINCE 5,350,853 0.2 877,174,672 35.3 13,255,844 0.5 103,024,217 4.1 WHITESHELL 2,120,799 58.4 32,500 0.9
MITT 2,323,603 6.9 2,227,907 6.6
FEDERAL
GOVERNMENT
MUNICIPAL
GOVERNMENT (1)
OTHER SCHOOL
DIVISIONS FIRST NATIONS
(1) Municipal Government revenue is net of $210,693,225 in Education Property Tax Credit (EPTC) revenue paid directly to school divisions. See
page 41 for EPTC revenue.

- 43 -
ANALYSIS OF OPERATING FUND REVENUE: 2019/2020 BUDGET PAGE 3 OF 3
DIVISION / DISTRICT REVENUE % REVENUE % REVENUE % REVENUE
BEAUTIFUL PLAINS 14,000 0.1 74,000 0.4 7,724,370 37.0 20,899,011
BORDER LAND 146,000 0.4 190,500 0.5 14,759,314 41.3 35,742,965
BRANDON 875,000 0.8 319,700 0.3 42,058,299 39.7 105,835,100
DSFM 90,000 0.1 10,000 0.0 28,517,155 29.6 96,327,386
EVERGREEN 92,600 0.4 17,500 0.1 8,873,516 41.2 21,515,276
FLIN FLON 191,842 1.3 88,493 0.6 4,070,028 27.4 14,872,355
FORT LA BOSSE 21,600 0.1 9,096,325 48.3 18,820,355
FRONTIER 4,571,284 3.2 478,644 0.3 93,028,848 65.5 142,119,566
GARDEN VALLEY 11,000 0.0 414,000 0.8 17,266,859 33.5 51,618,292
HANOVER 453,000 0.5 173,168 0.2 28,590,638 31.1 91,788,500
INTERLAKE 193,300 0.5 146,930 0.4 16,536,195 42.9 38,552,000
KELSEY 66,500 0.3 3,331,184 16.6 20,126,662
LAKESHORE 239,500 1.5 46,000 0.3 4,747,980 29.3 16,183,893
LORD SELKIRK 381,000 0.6 102,100 0.2 26,285,506 44.5 59,118,415
LOUIS RIEL 2,809,673 1.4 100,000 0.1 80,608,272 41.5 194,359,468
MOUNTAIN VIEW 554,200 1.3 220,000 0.5 15,573,890 36.8 42,364,760
MYSTERY LAKE 201,500 0.5 49,000 0.1 7,542,743 18.0 41,960,427
PARK WEST 14,000 0.0 5,000 0.0 15,807,132 54.4 29,038,789
PEMBINA TRAILS 3,470,000 1.9 252,000 0.1 90,138,155 50.5 178,530,436
PINE CREEK 14,800 0.1 6,681,919 43.2 15,460,919
PORTAGE LA PRAIRIE 6,000 0.0 28,000 0.1 17,347,535 42.5 40,854,136
PRAIRIE ROSE 5,000 0.0 80,750 0.3 14,679,564 46.8 31,358,225
PRAIRIE SPIRIT 154,800 0.5 77,500 0.3 12,276,183 42.4 28,963,242
RED RIVER VALLEY 130,500 0.4 41,450 0.1 16,747,317 51.7 32,380,962
RIVER EAST TRANSCONA 480,000 0.2 425,000 0.2 69,232,778 35.2 196,637,823
ROLLING RIVER 36,100 0.1 71,600 0.3 11,513,647 46.5 24,780,930
SEINE RIVER 56,000 0.1 17,875,931 32.3 55,386,000
SEVEN OAKS 1,413,500 0.9 12,000 0.0 51,428,693 33.8 152,114,591
SOUTHWEST HORIZON 57,265 0.2 11,977,141 50.6 23,661,900
ST. JAMES-ASSINIBOIA 2,131,842 1.9 786,370 0.7 55,141,753 49.3 111,849,931
SUNRISE 72,658 0.1 29,942,951 44.6 67,153,282
SWAN VALLEY 264,900 1.2 202,115 0.9 7,026,481 32.9 21,344,840
TURTLE MOUNTAIN 3,750 0.0 20,242 0.1 6,227,519 45.1 13,801,446
TURTLE RIVER 21,350 0.2 2,955,071 25.6 11,538,712
WESTERN 236,000 1.1 16,100 0.1 7,712,844 35.5 21,743,342
WINNIPEG 1,838,700 0.4 720,000 0.2 171,969,176 41.2 417,444,400
PROVINCE 21,075,491 0.8 5,411,835 0.2 1,025,292,912 41.2 2,486,248,337 WHITESHELL 15,000 0.4 50,000 1.4 2,218,299 61.1 3,630,643
MITT 17,968,967 53.4 965,776 2.9 23,486,253 69.8 33,660,706
PRIVATE
ORGANIZATIONS &
INDIVIDUALS OTHER
TOTAL
NON-PROVINCIAL
REVENUE
TOTAL
OPERATING
FUND

- 44 -
NET TRANSFERS TO/(FROM) CAPITAL FUND
2019/2020 BUDGET
DIVISION / DISTRICT
BEAUTIFUL PLAINS
BORDER LAND 428,586
BRANDON 40,000
DSFM 32,500
EVERGREEN 400,000
FLIN FLON 120,500
FORT LA BOSSE
FRONTIER 350,000
GARDEN VALLEY 60,000
HANOVER 582,500
INTERLAKE 311,000
KELSEY 45,000
LAKESHORE (200,000)
LORD SELKIRK 367,475
LOUIS RIEL 997,963
MOUNTAIN VIEW 985,322
MYSTERY LAKE 535,000
PARK WEST 115,000
PEMBINA TRAILS 1,202,500
PINE CREEK 90,000
PORTAGE LA PRAIRIE 882,644
PRAIRIE ROSE 404,400
PRAIRIE SPIRIT 281,670
RED RIVER VALLEY 434,659
RIVER EAST TRANSCONA 2,517,500
ROLLING RIVER 215,000
SEINE RIVER 810,000
SEVEN OAKS 2,673,441
SOUTHWEST HORIZON
ST. JAMES-ASSINIBOIA 2,335,842
SUNRISE 1,178,481
SWAN VALLEY 5,000
TURTLE MOUNTAIN
TURTLE RIVER
WESTERN 323,638
WINNIPEG 2,088,300
PROVINCE 20,613,921 WHITESHELL
MITT 449,298
(1) Includes transfers to bus reserves and other capital reserves.
NET TRANSFERS
TO/(FROM)
CAPITAL FUND (1)
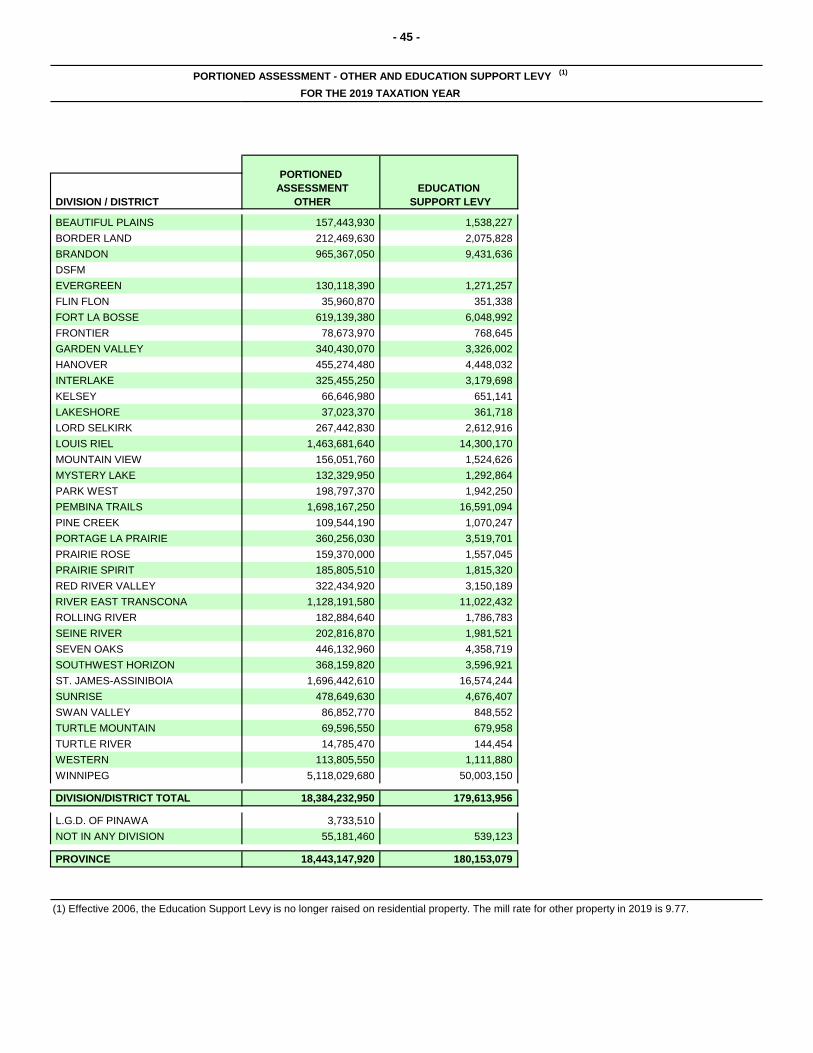
- 45 -
PORTIONED ASSESSMENT - OTHER AND EDUCATION SUPPORT LEVY (1)
FOR THE 2019 TAXATION YEAR
DIVISION / DISTRICT
BEAUTIFUL PLAINS 157,443,930 1,538,227
BORDER LAND 212,469,630 2,075,828
BRANDON 965,367,050 9,431,636
DSFM
EVERGREEN 130,118,390 1,271,257
FLIN FLON 35,960,870 351,338
FORT LA BOSSE 619,139,380 6,048,992
FRONTIER 78,673,970 768,645
GARDEN VALLEY 340,430,070 3,326,002
HANOVER 455,274,480 4,448,032
INTERLAKE 325,455,250 3,179,698
KELSEY 66,646,980 651,141
LAKESHORE 37,023,370 361,718
LORD SELKIRK 267,442,830 2,612,916
LOUIS RIEL 1,463,681,640 14,300,170
MOUNTAIN VIEW 156,051,760 1,524,626
MYSTERY LAKE 132,329,950 1,292,864
PARK WEST 198,797,370 1,942,250
PEMBINA TRAILS 1,698,167,250 16,591,094
PINE CREEK 109,544,190 1,070,247
PORTAGE LA PRAIRIE 360,256,030 3,519,701
PRAIRIE ROSE 159,370,000 1,557,045
PRAIRIE SPIRIT 185,805,510 1,815,320
RED RIVER VALLEY 322,434,920 3,150,189
RIVER EAST TRANSCONA 1,128,191,580 11,022,432
ROLLING RIVER 182,884,640 1,786,783
SEINE RIVER 202,816,870 1,981,521
SEVEN OAKS 446,132,960 4,358,719
SOUTHWEST HORIZON 368,159,820 3,596,921
ST. JAMES-ASSINIBOIA 1,696,442,610 16,574,244
SUNRISE 478,649,630 4,676,407
SWAN VALLEY 86,852,770 848,552
TURTLE MOUNTAIN 69,596,550 679,958
TURTLE RIVER 14,785,470 144,454
WESTERN 113,805,550 1,111,880
WINNIPEG 5,118,029,680 50,003,150
DIVISION/DISTRICT TOTAL 18,384,232,950 179,613,956
L.G.D. OF PINAWA 3,733,510
NOT IN ANY DIVISION 55,181,460 539,123
PROVINCE 18,443,147,920 180,153,079
(1) Effective 2006, the Education Support Levy is no longer raised on residential property. The mill rate for other property in 2019 is 9.77.
PORTIONED
ASSESSMENT
OTHER
EDUCATION
SUPPORT LEVY

- 46
-
BE
AU
TIF
UL
PL
AIN
S
BO
RD
ER
LA
ND
BR
AN
DO
N
EV
ER
GR
EE
N
FL
IN F
LO
N
FO
RT
LA
BO
SS
E
FR
ON
TIE
R
GA
RD
EN
VA
LL
EY
HA
NO
VE
R
INT
ER
LA
KE
KE
LS
EY
LA
KE
SH
OR
E
LO
RD
SE
LK
IRK
LO
UIS
RIE
L
MO
UN
TA
IN V
IEW
MY
ST
ER
Y L
AK
E
PA
RK
WE
ST
PE
MB
INA
TR
AIL
S
PIN
E C
RE
EK
PO
RTA
GE
LA
PR
AIR
IE
PR
AIR
IE R
OS
E
PR
AIR
IE S
PIR
IT
RE
D R
IVE
R V
AL
LE
Y
RIV
ER
EA
ST
TR
AN
SC
ON
A
RO
LL
ING
RIV
ER
SE
INE
RIV
ER
SE
VE
N O
AK
S
SO
UT
HW
ES
T H
OR
IZO
N
ST. J
AM
ES
-AS
SIN
IBO
IA
SU
NR
ISE
SW
AN
VA
LL
EY
TU
RT
LE
MO
UN
TA
IN
TU
RT
LE
RIV
ER
WE
ST
ER
N
WIN
NIP
EG
0.0
5.0
10.0
15.0
20.0
25.0
SCHOOL DIVISIONS
2019 SPECIAL LEVY MILL RATES

- 47 -
TOTAL PORTIONED ASSESSMENT, SPECIAL LEVY AND MILL RATES
FOR THE 2019 TAXATION YEAR
DIVISION / DISTRICT OTHER TOTAL
BEAUTIFUL PLAINS 321,953,530 324,104,180 157,443,930 803,501,640 9,229,279 11.5
BORDER LAND 356,828,150 436,707,020 212,469,630 1,006,004,800 14,839,929 14.8
BRANDON 2,161,566,000 105,711,900 965,367,050 3,232,644,950 48,456,525 15.0
DSFM
EVERGREEN 780,684,830 106,839,550 130,118,390 1,017,642,770 11,245,070 11.1
FLIN FLON 100,629,610 35,960,870 136,590,480 4,504,503 21.4
FORT LA BOSSE 341,364,060 275,526,850 619,139,380 1,236,030,290 9,498,508 7.7
FRONTIER 150,446,360 25,172,230 78,673,970 254,292,560 3,357,170 13.2
GARDEN VALLEY 682,759,070 288,668,350 340,430,070 1,311,857,490 19,699,586 15.0
HANOVER 1,579,108,180 230,096,980 455,274,480 2,264,479,640 34,343,162 15.2
INTERLAKE 836,564,810 271,421,800 325,455,250 1,433,441,860 19,476,323 13.6
KELSEY 172,843,860 21,560,570 66,646,980 261,051,410 4,515,601 17.3
LAKESHORE 173,719,930 117,617,810 37,023,370 328,361,110 4,927,532 15.0
LORD SELKIRK 1,707,049,400 88,412,870 267,442,830 2,062,905,100 30,801,157 14.9
LOUIS RIEL 6,590,981,360 19,782,980 1,463,681,640 8,074,445,980 110,565,323 13.7
MOUNTAIN VIEW 533,462,250 397,946,590 156,051,760 1,087,460,600 16,992,673 15.6
MYSTERY LAKE 334,580,740 132,329,950 466,910,690 8,660,374 18.5
PARK WEST 293,889,710 470,369,640 198,797,370 963,056,720 10,120,968 10.5
PEMBINA TRAILS 6,964,254,780 26,569,760 1,698,167,250 8,688,991,790 107,931,473 12.4
PINE CREEK 156,369,910 280,321,910 109,544,190 546,236,010 7,606,582 13.9
PORTAGE LA PRAIRIE 607,176,320 381,797,290 360,256,030 1,349,229,640 18,723,418 13.9
PRAIRIE ROSE 552,814,580 817,008,060 159,370,000 1,529,192,640 17,276,435 11.3
PRAIRIE SPIRIT 358,307,330 976,040,460 185,805,510 1,520,153,300 14,839,114 9.8
RED RIVER VALLEY 598,387,010 651,659,010 322,434,920 1,572,480,940 21,340,072 13.6
RIVER EAST TRANSCONA 5,775,542,240 16,223,710 1,128,191,580 6,919,957,530 93,210,845 13.5
ROLLING RIVER 534,713,450 342,415,870 182,884,640 1,060,013,960 12,194,269 11.5
SEINE RIVER 1,542,213,060 156,985,180 202,816,870 1,902,015,110 27,790,388 14.6
SEVEN OAKS 3,068,067,970 19,671,990 446,132,960 3,533,872,920 59,084,421 16.7
SOUTHWEST HORIZON 319,745,500 579,844,660 368,159,820 1,267,749,980 13,368,274 10.5
ST. JAMES-ASSINIBOIA 3,085,122,010 27,646,800 1,696,442,610 4,809,211,420 64,466,144 13.4
SUNRISE 1,920,464,220 279,065,000 478,649,630 2,678,178,850 37,077,231 13.8
SWAN VALLEY 245,282,810 242,548,280 86,852,770 574,683,860 7,942,234 13.8
TURTLE MOUNTAIN 244,736,560 310,608,920 69,596,550 624,942,030 7,383,993 11.8
TURTLE RIVER 101,388,290 117,011,220 14,785,470 233,184,980 3,560,675 15.3
WESTERN 382,883,510 112,844,130 113,805,550 609,533,190 9,338,008 15.3
WINNIPEG 7,662,900,310 5,964,270 5,118,029,680 12,786,894,260 191,440,649 15.0
DIVISION/DISTRICT TOTAL 51,238,801,710 8,524,165,840 18,384,232,950 78,147,200,500 1,075,807,908 13.8
L.G.D. OF PINAWA 67,787,430 383,760 3,733,510 71,904,700
NOT IN ANY DIVISION 18,754,090 16,867,990 55,181,460 90,803,540
PROVINCE 51,325,343,230 8,541,417,590 18,443,147,920 78,309,908,740
(2) Mill rate for Flin Flon is adjusted for mining revenue.
(1) Special levy requisitioned by school divisions for the 2019 tax year. Actual remittance to school divisions by municipalities is reduced by the
Education Property Tax Credit. See pages 41 and 42 for more detail.
TOTAL PORTIONED ASSESSMENT
URBAN
AND FARM
RESIDENTIAL
FARM
LAND AND
BUILDINGS
SPECIAL
LEVY (1)
SPECIAL
LEVY
MILL RATE (2)

- 48 -
DIVISION / DISTRICT
BEAUTIFUL PLAINS 9,565,500 336,221 9,229,279
BORDER LAND 17,468,500 2,628,571 14,839,929
BRANDON 49,688,534 1,232,009 48,456,525
DSFM
EVERGREEN 12,777,212 1,532,142 11,245,070
FLIN FLON 5,006,312 501,809 4,504,503
FORT LA BOSSE 9,966,977 468,469 9,498,508
FRONTIER 3,569,486 212,316 3,357,170
GARDEN VALLEY 20,130,368 430,782 19,699,586
HANOVER 35,348,579 1,005,417 34,343,162
INTERLAKE 20,336,024 859,701 19,476,323
KELSEY 4,721,872 206,271 4,515,601
LAKESHORE 5,350,178 422,646 4,927,532
LORD SELKIRK 33,387,421 2,586,264 30,801,157
LOUIS RIEL 114,925,992 4,360,669 110,565,323
MOUNTAIN VIEW 17,452,913 460,240 16,992,673
MYSTERY LAKE 9,384,407 724,033 8,660,374
PARK WEST 10,905,954 784,986 10,120,968
PEMBINA TRAILS 111,171,266 3,239,793 107,931,473
PINE CREEK 7,925,641 319,059 7,606,582
PORTAGE LA PRAIRIE 19,072,109 348,691 18,723,418
PRAIRIE ROSE 18,383,881 1,107,446 17,276,435
PRAIRIE SPIRIT 15,697,697 858,583 14,839,114
RED RIVER VALLEY 22,175,501 835,429 21,340,072
RIVER EAST TRANSCONA 94,204,527 993,682 93,210,845
ROLLING RIVER 12,927,909 733,640 12,194,269
SEINE RIVER 29,509,784 1,719,396 27,790,388
SEVEN OAKS 62,660,310 3,575,889 59,084,421
SOUTHWEST HORIZON 14,096,696 728,422 13,368,274
ST. JAMES-ASSINIBOIA 66,786,493 2,320,349 64,466,144
SUNRISE 39,385,339 2,308,108 37,077,231
SWAN VALLEY 8,956,893 1,014,659 7,942,234
TURTLE MOUNTAIN 7,383,993 7,383,993
TURTLE RIVER 3,873,288 312,613 3,560,675
WESTERN 9,338,008 9,338,008
WINNIPEG 197,827,580 6,386,931 191,440,649
PROVINCE 1,121,363,144 45,555,236 1,075,807,908
(1) The Tax Incentive Grant (TIG) was a voluntary program intended to assist school divisions that maintained their Special Levy amount
adjusted for real growth in property assessment. Starting in 2018, the $61.4 million TIG is being phased out at 1/6th per year and
adjusted (per a TIG Guarantee) to ensure that total operating support including the TIG is at least 98 per cent of last year’s funding. The
2019 TIG of $45.6 million is a $8.4 million reduction from the 2018 grant of $53.9 million which is comprised of a $10.2 million reduction
(1/6th) offset by a $4.6 million TIG guarantee.
NET SPECIAL LEVY
FOR THE 2019 TAXATION YEAR
GROSS SPECIAL
LEVY
TAX INCENTIVE
GRANT (1)
NET SPECIAL
LEVY

- 49
-
BE
AU
TIF
UL
PL
AIN
S
BO
RD
ER
LA
ND
BR
AN
DO
N
DS
FM
EV
ER
GR
EE
N
FL
IN F
LO
N
FO
RT
LA
BO
SS
E
FR
ON
TIE
R
GA
RD
EN
VA
LL
EY
HA
NO
VE
R
INT
ER
LA
KE
KE
LS
EY
LA
KE
SH
OR
E
LO
RD
SE
LK
IRK
LO
UIS
RIE
L
MO
UN
TA
IN V
IEW
MY
ST
ER
Y L
AK
E
PA
RK
WE
ST
PE
MB
INA
TR
AIL
S
PIN
E C
RE
EK
PO
RTA
GE
LA
PR
AIR
IE
PR
AIR
IE R
OS
E
PR
AIR
IE S
PIR
IT
RE
D R
IVE
R V
AL
LE
Y
RIV
ER
EA
ST
TR
AN
SC
ON
A
RO
LL
ING
RIV
ER
SE
INE
RIV
ER
SE
VE
N O
AK
S
SO
UT
HW
ES
T H
OR
IZO
N
ST. J
AM
ES
-AS
SIN
IBO
IA
SU
NR
ISE
SW
AN
VA
LL
EY
TU
RT
LE
MO
UN
TA
IN
TU
RT
LE
RIV
ER
WE
ST
ER
N
WIN
NIP
EG
$0
$40,000
$80,000
$120,000
$160,000
$200,000
$240,000
$280,000
$320,000
$360,000
$400,000
$440,000
$480,000
$520,000
$560,000
$600,000
$640,000
$680,000
$720,000
$760,000
$800,000
$840,000
$880,000
$920,000
SCHOOL DIVISIONS
2019 ASSESSMENT PER RESIDENT PUPIL
(1) DSFM assessment per resident pupil is derived on a pro rata basis according to enrolment within DSFM boundaries.
(1)

- 50 -
LOCAL TAXATION AND ASSESSMENT PER RESIDENT PUPIL
FOR THE 2019 TAXATION YEAR
DIVISION / DISTRICT SPECIAL LEVY TOTAL
BEAUTIFUL PLAINS 1,538,227 9,229,279 10,767,506 442,092
BORDER LAND 2,075,828 14,839,929 16,915,757 476,373
BRANDON 9,431,636 48,456,525 57,888,161 376,633
DSFM 468,321
EVERGREEN 1,271,257 11,245,070 12,516,327 726,888
FLIN FLON 351,338 4,504,503 4,855,841 211,130
FORT LA BOSSE 6,048,992 9,498,508 15,547,500 911,863
FRONTIER 768,645 3,357,170 4,125,815 114,978
GARDEN VALLEY 3,326,002 19,699,586 23,025,588 300,968
HANOVER 4,448,032 34,343,162 38,791,194 273,984
INTERLAKE 3,179,698 19,476,323 22,656,021 495,401
KELSEY 651,141 4,515,601 5,166,742 174,815
LAKESHORE 361,718 4,927,532 5,289,250 336,160
LORD SELKIRK 2,612,916 30,801,157 33,414,073 540,409
LOUIS RIEL 14,300,170 110,565,323 124,865,493 488,248
MOUNTAIN VIEW 1,524,626 16,992,673 18,517,299 384,710
MYSTERY LAKE 1,292,864 8,660,374 9,953,238 155,961
PARK WEST 1,942,250 10,120,968 12,063,218 624,146
PEMBINA TRAILS 16,591,094 107,931,473 124,522,567 619,867
PINE CREEK 1,070,247 7,606,582 8,676,829 537,899
PORTAGE LA PRAIRIE 3,519,701 18,723,418 22,243,119 433,714
PRAIRIE ROSE 1,557,045 17,276,435 18,833,480 640,231
PRAIRIE SPIRIT 1,815,320 14,839,114 16,654,434 681,966
RED RIVER VALLEY 3,150,189 21,340,072 24,490,261 665,460
RIVER EAST TRANSCONA 11,022,432 93,210,845 104,233,277 426,807
ROLLING RIVER 1,786,783 12,194,269 13,981,052 648,089
SEINE RIVER 1,981,521 27,790,388 29,771,909 336,015
SEVEN OAKS 4,358,719 59,084,421 63,443,140 333,778
SOUTHWEST HORIZON 3,596,921 13,368,274 16,965,195 827,723
ST. JAMES-ASSINIBOIA 16,574,244 64,466,144 81,040,388 598,190
SUNRISE 4,676,407 37,077,231 41,753,638 566,870
SWAN VALLEY 848,552 7,942,234 8,790,786 428,070
TURTLE MOUNTAIN 679,958 7,383,993 8,063,951 636,721
TURTLE RIVER 144,454 3,560,675 3,705,129 317,474
WESTERN 1,111,880 9,338,008 10,449,888 346,680
WINNIPEG 50,003,150 191,440,649 241,443,799 440,936
PROVINCE 179,613,956 1,075,807,908 1,255,421,864 455,854
ASSESSMENT
PER
RESIDENT PUPIL (1)
EDUCATION
SUPPORT
LEVY
(1) Assessment per resident pupil is based on total portioned assessment adjusted for allocations to the DSFM and corresponds to data provided
in the calculation of support to school divisions. Assessment per resident pupil for Flin Flon, Frontier and Mystery Lake reflects non-assessed
mining properties. DSFM assessment per resident pupil is derived on a pro rata basis according to enrolment within DSFM boundaries.

APPENDIX

- 51 -
ANALYSIS OF OPERATING FUND REVENUE: 2019/2020 BUDGET PAGE 1 OF 5
DIVISION / DISTRICT
BEAUTIFUL PLAINS 3,493,458 92,935 199,205 108,774 112,400 166,787
BORDER LAND 3,931,658 393,276 122,418 126,499 187,708
BRANDON 16,428,400 125,700 511,500 528,600 784,300
DSFM 10,388,650 77,327 757,668 323,466 334,248 495,981
EVERGREEN 2,698,571 245,847 84,024 86,825 128,837
FLIN FLON 1,741,815 54,234 56,042 83,159
FORT LA BOSSE 2,617,830 61,542 279,712 81,510 84,227 124,982
FRONTIER 4,111,447 953,182 128,016 132,283 196,291
GARDEN VALLEY 8,422,532 2,263 197,607 262,248 270,990 402,114
HANOVER 15,181,484 240,052 472,698 488,455 724,804
INTERLAKE 5,464,587 31,434 484,124 170,148 175,820 260,894
KELSEY 2,785,671 25,643 86,736 89,627 132,995
LAKESHORE 1,808,490 17,948 355,747 56,310 58,187 86,342
LORD SELKIRK 7,238,005 342,974 225,366 232,878 345,561
LOUIS RIEL 28,055,964 39,441 873,564 902,683 1,339,465
MOUNTAIN VIEW 5,552,651 18,384 533,542 172,890 178,653 265,098
MYSTERY LAKE 5,644,954 175,764 181,623 269,505
PARK WEST 2,859,090 77,947 508,021 89,022 91,989 136,500
PEMBINA TRAILS 26,325,132 37,321 819,672 846,994 1,256,830
PINE CREEK 1,972,285 42,705 332,415 61,410 63,457 94,162
PORTAGE LA PRAIRIE 5,864,246 207,416 182,592 188,678 279,974
PRAIRIE ROSE 4,289,502 636,952 133,560 138,012 204,792
PRAIRIE SPIRIT 3,846,870 26,686 804,964 119,778 123,771 183,660
RED RIVER VALLEY 4,202,016 102,836 599,162 130,836 135,197 200,615
RIVER EAST TRANSCONA 30,640,264 954,030 985,831 1,462,846
ROLLING RIVER 3,042,155 61,828 476,711 94,722 97,879 145,240
SEINE RIVER 8,344,488 459,639 259,818 268,479 398,388
SEVEN OAKS 21,458,687 668,148 690,420 1,024,494
SOUTHWEST HORIZON 2,862,366 535,253 89,124 92,095 136,657
ST. JAMES-ASSINIBOIA 15,505,606 482,790 498,883 740,278
SUNRISE 8,468,209 482,539 263,784 272,577 404,469
SWAN VALLEY 2,610,122 53,291 261,394 81,270 83,979 124,614
TURTLE MOUNTAIN 1,910,621 36,235 240,575 59,490 61,473 91,218
TURTLE RIVER 1,364,701 17,172 301,859 42,492 43,908 65,154
WESTERN 3,428,326 106,746 110,304 163,677
WINNIPEG 56,838,173 1,769,766 1,828,758 2,713,641
PROVINCE 331,399,026 797,295 10,981,179 10,318,716 10,662,724 15,822,032 WHITESHELL 217,098 32,902 10,590 10,943 16,238
MITT
(1) Based on a grant per eligible pupil at September 30, 2018.
(2) Provided in recognition of the higher costs associated with sparsely populated rural and northern divisions.
EDUCATION
FUNDING OF SCHOOLS PROGRAM
BASE SUPPORT
INSTRUCTIONAL
SUPPORT (1)
ADD'N INST.
SUPPORT FOR
SMALL SCHOOLS
SPARSITY
SUPPORT (2)
CURRICULAR
MATERIALS
INFORMATION
TECHNOLOGY
LIBRARY
SERVICES

- 52 -
ANALYSIS OF OPERATING FUND REVENUE: 2019/2020 BUDGET PAGE 2 OF 5
DIVISION / DISTRICT OCCUPANCY
BEAUTIFUL PLAINS 566,245 150,471 83,393 35,750 893,475 5,902,893
BORDER LAND 683,663 169,345 93,854 41,263 1,220,940 6,970,624
BRANDON 2,906,600 707,600 392,200 190,400 3,009,600 25,584,900
DSFM 1,716,276 447,461 210,253 81,000 2,738,565 17,570,895
EVERGREEN 480,432 116,233 54,616 35,000 846,450 4,776,835
FLIN FLON 325,443 75,024 46,099 24,000 590,805 2,996,621
FORT LA BOSSE 435,643 112,756 62,491 24,625 846,450 4,731,768
FRONTIER 1,312,237 177,089 83,210 28,625 4,180,095 11,302,475
GARDEN VALLEY 1,394,924 362,776 201,057 91,963 1,676,655 13,285,129
HANOVER 2,595,316 653,899 307,254 144,000 2,804,400 23,612,362
INTERLAKE 894,430 235,371 110,596 57,625 1,527,885 9,412,914
KELSEY 491,831 119,985 73,726 27,750 918,270 4,752,234
LAKESHORE 336,842 77,896 43,171 18,875 796,005 3,655,813
LORD SELKIRK 1,295,768 311,756 146,488 90,125 2,004,975 12,233,896
LOUIS RIEL 5,051,426 1,208,430 567,817 301,625 6,473,205 44,813,620
MOUNTAIN VIEW 1,008,494 239,165 132,549 62,763 2,255,490 10,419,679
MYSTERY LAKE 1,091,361 243,140 149,399 63,250 1,284,210 9,103,206
PARK WEST 484,035 123,147 68,250 28,000 1,274,805 5,740,806
PEMBINA TRAILS 4,430,871 1,133,880 532,787 301,750 5,129,145 40,814,382
PINE CREEK 339,367 84,951 47,081 19,000 790,020 3,846,853
PORTAGE LA PRAIRIE 1,065,192 252,586 118,685 71,000 1,792,935 10,023,304
PRAIRIE ROSE 714,715 184,758 86,814 39,000 1,407,330 7,835,435
PRAIRIE SPIRIT 619,546 165,693 91,830 39,750 1,742,490 7,765,038
RED RIVER VALLEY 695,291 180,990 85,043 44,375 1,179,900 7,556,261
RIVER EAST TRANSCONA 5,341,973 1,319,742 620,120 341,688 6,882,750 48,549,244
ROLLING RIVER 507,807 131,032 72,620 26,875 1,158,525 5,815,394
SEINE RIVER 1,422,773 359,415 168,882 83,250 1,710,000 13,475,132
SEVEN OAKS 3,811,618 924,271 434,296 263,250 3,732,930 33,008,114
SOUTHWEST HORIZON 464,730 123,288 68,328 26,638 1,031,130 5,429,609
ST. JAMES-ASSINIBOIA 2,754,154 667,860 313,814 172,875 4,188,645 25,324,905
SUNRISE 1,429,361 364,901 171,460 85,125 2,107,575 14,050,000
SWAN VALLEY 455,657 112,424 69,080 29,750 985,815 4,867,396
TURTLE MOUNTAIN 312,619 82,295 45,609 17,750 585,675 3,443,560
TURTLE RIVER 295,682 58,781 32,577 13,625 600,210 2,836,161
WESTERN 569,362 147,665 81,839 34,400 602,775 5,245,094
WINNIPEG 16,329,763 2,448,176 1,150,348 737,938 14,297,310 98,113,873
PROVINCE 64,631,447 14,274,252 7,017,636 3,694,678 85,267,440 554,866,425 WHITESHELL 55,216 14,650 8,119 4,625 231,705 602,086
MITT
(1) Support for Function 200 Student Support Services expenses less Counselling and Guidance and Categorical support for Special Needs.
EDUCATION
FUNDING OF SCHOOLS PROGRAM (CONT'D)
BASE SUPPORT
STUDENT
SERVICES (1)
COUNSELLING
AND GUIDANCE
PROFESSIONAL
DEVELOPMENT
PHYSICAL
EDUCATION
TOTAL
BASE
SUPPORT

- 53 -
ANALYSIS OF OPERATING FUND REVENUE: 2019/2020 BUDGET PAGE 3 OF 5
DIVISION / DISTRICT
BEAUTIFUL PLAINS 679,947 678,825 45,651 288,600 36,000
BORDER LAND 1,263,061 1,123,888 168,740 179,825 54,000
BRANDON 1,097,400 3,139,000 646,200 766,400 371,000
DSFM 3,430,184 1,188,934 110,990 182,200 530,000
EVERGREEN 859,652 835,057 64,378 16,100 128,000
FLIN FLON 103,886 470,757 29,975 750 81,500
FORT LA BOSSE 871,587 592,895 55,165 23,300 18,000
FRONTIER 1,270,811 1,825,254 84,535 3,200 851,750
GARDEN VALLEY 1,559,104 1,942,050 312,290 583,000 27,000
HANOVER 2,609,261 3,430,254 475,090 567,900 171,000
INTERLAKE 1,133,600 1,313,664 85,168 45,300 135,000
KELSEY 297,788 942,425 71,665 12,850 171,000
LAKESHORE 907,327 649,292 40,645 11,900 99,000
LORD SELKIRK 1,599,469 1,997,470 323,896 78,950 356,500
LOUIS RIEL 1,280,710 8,726,303 700,040 1,343,550 816,100
MOUNTAIN VIEW 1,567,661 1,169,604 220,550 12,825 245,000
MYSTERY LAKE 70,607 1,968,004 212,190 83,650 280,500
PARK WEST 1,191,557 595,175 78,045 43,600 90,500
PEMBINA TRAILS 1,124,697 7,174,508 268,620 2,282,000 333,000
PINE CREEK 660,209 573,975 33,935 65,000 47,000
PORTAGE LA PRAIRIE 809,419 1,822,281 180,565 150,825 245,000
PRAIRIE ROSE 1,323,361 883,932 56,458 152,700 99,000
PRAIRIE SPIRIT 1,384,496 857,681 52,966 121,900 36,000
RED RIVER VALLEY 1,501,139 1,293,878 76,863 86,175 108,000
RIVER EAST TRANSCONA 1,932,083 9,474,399 874,665 969,300 864,000
ROLLING RIVER 897,846 569,071 19,635 34,150 74,000
SEINE RIVER 1,785,967 2,383,332 164,891 191,125 396,000
SEVEN OAKS 1,052,096 6,302,130 451,276 755,350 359,500
SOUTHWEST HORIZON 1,054,086 589,273 42,625 60,750 36,000
ST. JAMES-ASSINIBOIA 741,590 4,758,073 589,105 522,425 370,000
SUNRISE 2,938,337 2,610,289 193,270 124,950 254,500
SWAN VALLEY 1,042,269 723,047 181,555 2,250 146,000
TURTLE MOUNTAIN 551,209 381,373 31,790 63,475 27,000
TURTLE RIVER 778,909 423,914 31,378 15,150 99,000
WESTERN 523,876 624,851 69,245 208,550 27,000
WINNIPEG 1,389,333 16,431,031 1,625,580 2,528,260 2,379,400
PROVINCE 43,284,534 90,465,889 8,669,635 12,578,235 10,362,250 WHITESHELL 1,301 67,281 8,305
MITT
(1) Includes vehicle support for school buses.
(2) Includes support for coordinators, clinicians and Level 2 and 3 pupils. Note: total special needs support is $155,097,336 (Student Services,
page 52 and Special Needs).
EDUCATION
FUNDING OF SCHOOLS PROGRAM (CONT'D)
CATEGORICAL SUPPORT
TRANSPORTATION (1)
SPECIAL
NEEDS (2)
SENIOR YEARS
TECHNOLOGY
EDUCATION
ENGLISH AS AN
ADDITIONAL
LANGUAGE
INDIGENOUS
ACADEMIC
ACHIEVEMENT

- 54 -
ANALYSIS OF OPERATING FUND REVENUE: 2019/2020 BUDGET PAGE 4 OF 5
DIVISION / DISTRICT
BEAUTIFUL PLAINS 3,240 25,330 145,032 141,804 2,044,429
BORDER LAND 34,661 28,413 163,224 212,538 3,228,350
BRANDON 203,600 156,700 742,000 261,600 7,383,900
DSFM 1,587,101 93,573 431,288 437,487 7,991,757
EVERGREEN 5,113 19,550 112,032 112,670 2,152,552
FLIN FLON 30,741 13,940 72,312 663,991 1,467,852
FORT LA BOSSE 1,778 16,660 108,680 138,193 1,826,258
FRONTIER 36 39,356 176,688 2,418,272 6,669,902
GARDEN VALLEY 3,889 56,605 349,664 94,129 4,927,731
HANOVER 23,460 115,945 630,264 218,163 8,241,337
INTERLAKE 69,287 38,643 226,864 160,242 3,207,768
KELSEY 41,576 25,993 115,648 1,072,366 2,751,311
LAKESHORE 1,467 14,942 75,080 167,374 1,967,027
LORD SELKIRK 95,352 54,529 359,988 242,734 5,108,888
LOUIS RIEL 1,365,619 199,221 1,164,752 427,816 16,024,111
MOUNTAIN VIEW 61,753 36,485 291,520 253,887 3,859,285
MYSTERY LAKE 70,718 50,886 234,352 2,143,305 5,114,212
PARK WEST 4,702 21,749 118,696 262,208 2,406,232
PEMBINA TRAILS 758,307 189,868 1,095,896 711,154 13,938,050
PINE CREEK 2,160 14,790 81,880 165,650 1,644,599
PORTAGE LA PRAIRIE 77,820 44,530 243,456 282,497 3,856,393
PRAIRIE ROSE 41,915 32,640 178,080 274,691 3,042,777
PRAIRIE SPIRIT 32,918 32,282 159,704 497,010 3,174,957
RED RIVER VALLEY 106,791 27,049 174,448 281,845 3,656,188
RIVER EAST TRANSCONA 779,591 225,059 1,398,540 426,546 16,944,183
ROLLING RIVER 4,880 25,367 126,296 201,147 1,952,392
SEINE RIVER 369,660 64,529 346,424 176,744 5,878,672
SEVEN OAKS 472,098 159,594 890,864 450,406 10,893,314
SOUTHWEST HORIZON 1,144 18,360 118,832 251,541 2,172,611
ST. JAMES-ASSINIBOIA 407,947 119,376 761,720 215,993 8,486,229
SUNRISE 158,436 61,954 351,712 150,518 6,843,966
SWAN VALLEY 28,726 20,173 108,360 79,794 2,332,174
TURTLE MOUNTAIN 493 13,090 79,320 124,826 1,272,576
TURTLE RIVER 9,804 10,200 56,656 147,775 1,572,786
WESTERN 73,338 26,520 142,328 129,337 1,825,045
WINNIPEG 942,627 501,043 2,475,688 610,628 28,883,590
PROVINCE 7,872,748 2,594,944 14,308,288 14,606,881 204,743,404 WHITESHELL 1,104 5,555 14,120 34,464 132,130
MITT
(1) All other categorical support not shown elsewhere (eg. Indigenous and International Languages, Northern Allowance, etc.).
EDUCATION
FUNDING OF SCHOOLS PROGRAM (CONT'D)
CATEGORICAL SUPPORT
FRENCH
LANGUAGE
PROGRAMS
EARLY
CHILDHOOD
DEVELOPMENT
INITIATIVE
LITERACY
AND
NUMERACY
OTHER
CATEGORICAL (1)
TOTAL
CATEGORICAL
SUPPORT

- 55 -
ANALYSIS OF OPERATING FUND REVENUE: 2019/2020 BUDGET PAGE 5 OF 5
DIVISION / DISTRICT
BEAUTIFUL PLAINS 2,570,113 96,140 10,613,575
BORDER LAND 3,734,800 1,575 411,305 206,729 14,553,383
BRANDON 18,874,600 300,500 52,143,900
DSFM 11,588,271 243,480 37,394,403
EVERGREEN 805,890 83,960 7,819,237
FLIN FLON 4,163,527 208,582 60,800 8,897,382
FORT LA BOSSE 360,490 102,980 7,021,496
FRONTIER 13,601,885 4,758,592 381,320 36,714,174
GARDEN VALLEY 11,042,958 124,900 29,380,718
HANOVER 21,150,175 270,540 53,274,414
INTERLAKE 3,854,673 156,820 16,632,175
KELSEY 5,544,995 970,692 78,040 14,097,272
LAKESHORE 2,860,145 419,953 176,299 101,040 9,180,277
LORD SELKIRK 4,329,296 756,556 258,660 22,687,296
LOUIS RIEL 19,823,561 573,240 81,234,532
MOUNTAIN VIEW 6,490,551 719,357 293,660 21,782,532
MYSTERY LAKE 12,965,441 3,841,201 120,100 31,144,160
PARK WEST 334,272 1,500,294 137,800 10,119,404
PEMBINA TRAILS 3,798,038 423,620 58,974,090
PINE CREEK 1,040,401 506,595 94,360 7,132,808
PORTAGE LA PRAIRIE 4,927,378 174,820 18,981,895
PRAIRIE ROSE 254,650 868,103 160,180 12,161,145
PRAIRIE SPIRIT 2,187,254 195,600 13,322,849
RED RIVER VALLEY 523,358 120,920 11,856,727
RIVER EAST TRANSCONA 27,799,521 3,036,165 698,040 97,027,153
ROLLING RIVER 76,354 1,627,452 133,020 9,604,612
SEINE RIVER 10,299,243 148,900 29,801,947
SEVEN OAKS 29,859,818 4,111,702 339,700 78,212,648
SOUTHWEST HORIZON 925,452 109,800 8,637,472
ST. JAMES-ASSINIBOIA 3,909,172 489,900 38,210,206
SUNRISE 3,680,485 215,220 24,789,671
SWAN VALLEY 2,888,861 557,431 304,570 138,120 11,088,552
TURTLE MOUNTAIN 134,566 797,832 61,080 5,709,614
TURTLE RIVER 2,296,562 434,059 67,720 7,207,288
WESTERN 4,033,576 38,760 11,142,475
WINNIPEG 52,716,829 4,863,665 1,352,880 185,930,837
PROVINCE 290,644,717 23,922,974 11,751,450 8,553,349 1,094,482,319 WHITESHELL 161,759 895,975
MITT
(3) Formula Guarantee is provided to ensure that every school division receives at least 98% of the level of funding provided in 2018/19.
(4) Includes School Buildings "D" Support, Technology Education Equipment Replacement and other minor capital support.
(1) Equalization is provided to recognize the varying ability of school divisions to meet the cost of unsupported program requirements through the
property tax base of the school division.
(2) Additional Equalization is provided to specifically assist school divisions or districts that have both higher than average tax effort and lower
than average assessment per pupil. Please see 2019/20 Funding of Schools Booklet for more information.
EDUCATION
FUNDING OF SCHOOLS PROGRAM (CONT'D)
EQUALIZATION
SUPPORT (1)
ADDITIONAL
EQUALIZATION
SUPPORT (2)
FORMULA
GUARANTEE (3)
OTHER
PROGRAM
SUPPORT (4)
TOTAL FUNDING
OF SCHOOLS
PROGRAM

- 56 -
PAGE 1 0F 2
DIVISION / DISTRICT
BEAUTIFUL PLAINS 651,952 (30,000) 621,952
BORDER LAND 1,217,250 (37,500) 1,179,750
BRANDON 3,131,000 (79,700) 3,051,300
DSFM
EVERGREEN 764,390 (27,000) 737,390
FLIN FLON 657,913 (25,000) 632,913
FORT LA BOSSE 682,050 (37,200) 644,850
FRONTIER
GARDEN VALLEY 1,568,200 (41,000) 1,527,200
HANOVER 2,339,400 (71,200) 2,268,200
INTERLAKE 1,305,000 (50,000) 1,255,000
KELSEY 877,355 (43,000) 834,355
LAKESHORE 588,650 (28,500) 560,150
LORD SELKIRK 1,878,010 (61,500) 1,816,510
LOUIS RIEL 6,374,470 (1,196,203) 5,178,267
MOUNTAIN VIEW 1,359,614 (44,000) 1,315,614
MYSTERY LAKE 1,803,612 (70,000) 1,733,612
PARK WEST 1,103,342 (277,178) 826,164
PEMBINA TRAILS 5,840,190 (1,030,409) 4,809,781
PINE CREEK 550,264 (21,508) 528,756
PORTAGE LA PRAIRIE 1,070,120 (50,000) 1,020,120
PRAIRIE ROSE 1,090,060 (34,000) 1,056,060
PRAIRIE SPIRIT 898,275 (42,000) 856,275
RED RIVER VALLEY 1,139,338 (47,000) 1,092,338
RIVER EAST TRANSCONA 5,039,840 (120,000) 4,919,840
ROLLING RIVER 887,385 (52,100) 835,285
SEINE RIVER 1,644,600 (50,000) 1,594,600
SEVEN OAKS 4,143,080 (86,500) 4,056,580
SOUTHWEST HORIZON 857,900 (39,400) 818,500
ST. JAMES-ASSINIBOIA 3,334,737 (334,893) 2,999,844
SUNRISE 2,059,474 (60,000) 1,999,474
SWAN VALLEY 771,508 (34,108) 737,400
TURTLE MOUNTAIN 478,287 (23,000) 455,287
TURTLE RIVER 397,202 (20,000) 377,202
WESTERN 753,969 (27,000) 726,969
WINNIPEG 11,350,727 (175,000) 11,175,727
PROVINCE 68,609,164 (4,365,899) 64,243,265 WHITESHELL
MITT
(2) For a definition of Divisional Administration, see expense definitions, page iii.
(1) This appendix provides an analysis of divisional administration expenses as a percentage of the adjusted operating expense base. Frontier
School Division, DSFM, Whiteshell and Manitoba Institute of Trades and Technology are exempt from these limits and are not reflected in
the above totals. Expenses shown for Function 500 may differ from corresponding amounts shown on page 16 owing to the inclusion of
operating transfers for the purpose of calculating administration costs. Effective with fiscal year 2019/20, school divisions are required to
limit the proportion of the budget spent on divisional administration to 2.7% for school divisions with F.T.E enrolment of 5,000 or over; 3.53%
for school divisions with F.T.E enrolment of 1,000 or less; and between 2.94% and 3.53% for school divisions with F.T.E enrolment between
1,000 and 5,000. Northern school divisions are subject to a 4.25% limit.
ADMINISTRATION EXPENSES (1)
2019/2020 BUDGET
DEFINED ADMINISTRATION EXPENSES
DEFINED
ADMINISTRATION
EXPENSES
DIVISIONAL
ADMINISTRATION
FUNCTION 500 (2)
LESS: LIABILITY
INSURANCE, ADMIN.
PORTION OF SELF-
FUNDED EXPENSES &
TRUSTEE ELECTION
COSTS

- 57 -
ADMINISTRATION EXPENSES 2019/2020 BUDGET PAGE 2 0F 2
DIVISION / DISTRICT
BEAUTIFUL PLAINS 20,899,011 20,899,011 621,952 3.0 3.4
BORDER LAND 35,314,379 428,586 (617,056) 35,125,909 1,179,750 3.4 3.4
BRANDON 105,795,100 40,000 105,835,100 3,051,300 2.9 2.9
DSFM N/A N/A
EVERGREEN 21,110,015 400,000 21,510,015 737,390 3.4 3.5
FLIN FLON 14,913,300 120,500 (94,000) 14,939,800 632,913 4.2 4.3
FORT LA BOSSE 18,820,355 18,820,355 644,850 3.4 3.5
FRONTIER N/A N/A
GARDEN VALLEY 51,484,500 60,000 51,544,500 1,527,200 3.0 3.0
HANOVER 91,526,000 587,500 92,113,500 2,268,200 2.5 2.9
INTERLAKE 38,241,000 311,000 38,552,000 1,255,000 3.3 3.3
KELSEY 20,559,662 45,000 (560,185) 20,044,477 834,355 4.2 4.3
LAKESHORE 16,456,224 100,000 (272,000) 16,284,224 560,150 3.4 3.5
LORD SELKIRK 58,750,940 367,475 (356,050) 58,762,365 1,816,510 3.1 3.1
LOUIS RIEL 193,361,505 997,963 (581,051) 193,778,417 5,178,267 2.7 2.7
MOUNTAIN VIEW 41,379,438 985,322 42,364,760 1,315,614 3.1 3.2
MYSTERY LAKE 41,960,427 535,000 42,495,427 1,733,612 4.1 4.3
PARK WEST 28,945,161 115,000 (161,817) 28,898,344 826,164 2.9 3.4
PEMBINA TRAILS 177,327,936 1,202,500 178,530,436 4,809,781 2.7 2.7
PINE CREEK 15,445,569 90,000 15,535,569 528,756 3.4 3.5
PORTAGE LA PRAIRIE 39,971,492 882,644 40,854,136 1,020,120 2.5 3.2
PRAIRIE ROSE 31,543,405 404,400 (279,114) 31,668,691 1,056,060 3.3 3.4
PRAIRIE SPIRIT 28,681,572 281,670 28,963,242 856,275 3.0 3.4
RED RIVER VALLEY 32,172,303 434,659 32,606,962 1,092,338 3.4 3.4
RIVER EAST TRANSCONA 194,120,323 2,517,500 196,637,823 4,919,840 2.5 2.7
ROLLING RIVER 24,565,930 215,000 24,780,930 835,285 3.4 3.4
SEINE RIVER 54,576,000 810,000 55,386,000 1,594,600 2.9 3.0
SEVEN OAKS 149,441,150 2,673,441 (2,027,377) 150,087,214 4,056,580 2.7 2.7
SOUTHWEST HORIZON 23,661,900 23,661,900 818,500 3.5 3.5
ST. JAMES-ASSINIBOIA 109,485,763 2,335,842 111,821,605 2,999,844 2.7 2.7
SUNRISE 65,974,801 1,178,481 (994,120) 66,159,162 1,999,474 3.0 3.0
SWAN VALLEY 21,339,840 5,000 21,344,840 737,400 3.5 3.5
TURTLE MOUNTAIN 13,891,446 (199,256) 13,692,190 455,287 3.3 3.5
TURTLE RIVER 11,538,712 11,538,712 377,202 3.3 3.5
WESTERN 21,469,206 323,638 (427,461) 21,365,383 726,969 3.4 3.4
WINNIPEG 415,356,100 2,088,300 (795,800) 416,648,600 11,175,727 2.7 2.7
PROVINCE 2,230,080,465 20,536,421 (7,365,287) 2,243,251,599 64,243,265 2.9 N/A WHITESHELL N/A N/A
MITT N/A N/A
CALCULATION OF EXPENDITURE BASE AND ADMINISTRATION PERCENTAGE
(1) For a definition of Adult Learning Centres, see expense definitions, page iii. Expenditures shown here may differ from those shown for Adult
Learning Centres on page 15 owing to the inclusion of operating transfers for the purpose of calculating administration costs.
TOTAL
OPERATING
EXPENSES
(from page 3)
PLUS
TRANSFERS
TO
CAPITAL
ADJUSTED
EXPENDITURE
BASE
DEFINED
ADMIN.
EXPENSES
(from page 56)
ADMIN.
LIMIT
DEFINED
ADMIN.
EXPENSES
AS % OF
EXPENDITURE
BASE
LESS ADULT
LEARNING
CENTRES
FUNCTION
300 (1)

- 58 -
DIVISION/DISTRICT TEACHING OTHER
BEAUTIFUL PLAINS 12.9 121.0 58.9 42.6 9.5 2.0 2.3 249.2
BORDER LAND 19.4 174.6 117.0 69.1 24.6 6.4 5.5 416.6
BRANDON 49.8 637.4 313.2 137.6 50.6 28.3 8.0 1,224.9
DSFM 60.2 438.6 247.5 75.6 56.5 11.4 8.0 897.8
EVERGREEN 14.1 102.0 64.5 48.8 14.8 2.9 2.0 249.0
FLIN FLON 11.7 72.5 32.0 26.6 8.2 2.7 1.0 154.7
FORT LA BOSSE 11.0 101.8 42.6 49.7 12.4 3.0 2.0 222.5
FRONTIER 71.0 469.0 453.2 291.2 72.1 14.4 10.0 1,380.9
GARDEN VALLEY 22.0 281.2 185.6 123.5 20.0 12.0 8.0 652.2
HANOVER 44.0 518.5 187.5 212.2 73.2 20.1 11.0 1,066.4
INTERLAKE 22.8 214.3 102.7 69.0 24.0 8.5 5.0 446.2
KELSEY 10.5 117.5 54.5 30.0 15.0 4.0 2.0 233.5
LAKESHORE 10.1 77.0 56.5 32.5 9.5 4.5 2.0 192.1
LORD SELKIRK 31.5 292.8 179.1 118.2 33.5 16.5 9.0 680.6
LOUIS RIEL 85.0 1,026.3 610.0 181.2 122.0 42.7 18.0 2,085.1
MOUNTAIN VIEW 29.6 208.5 133.4 111.0 25.0 7.1 7.0 521.6
MYSTERY LAKE 19.0 225.9 110.0 39.8 22.0 12.6 5.0 434.4
PARK WEST 16.2 159.5 87.3 56.4 19.2 3.8 4.0 346.3
PEMBINA TRAILS 78.0 944.2 508.6 170.3 112.2 30.0 22.7 1,866.0
PINE CREEK 12.2 79.7 42.3 38.3 10.6 3.8 2.0 188.8
PORTAGE LA PRAIRIE 21.0 243.6 131.6 73.0 21.5 7.0 5.2 502.9
PRAIRIE ROSE 19.3 179.7 83.6 71.0 18.5 4.3 4.0 380.4
PRAIRIE SPIRIT 19.3 148.5 97.4 78.8 19.9 4.7 6.0 374.5
RED RIVER VALLEY 16.8 162.3 98.3 80.9 17.7 7.7 4.2 387.8
RIVER EAST TRANSCONA 94.2 1,090.7 478.7 284.6 125.6 30.1 17.0 2,120.7
ROLLING RIVER 14.5 123.9 69.3 59.5 15.5 3.0 3.0 288.6
SEINE RIVER 28.1 295.2 146.9 126.5 31.2 11.9 5.0 644.8
SEVEN OAKS 69.0 770.6 348.4 156.7 78.9 21.3 10.0 1,454.9
SOUTHWEST HORIZON 12.7 118.2 59.9 57.2 13.7 2.7 2.5 267.0
ST. JAMES-ASSINIBOIA 58.2 573.9 334.1 99.4 71.4 28.5 12.0 1,177.4
SUNRISE 32.5 330.5 148.6 163.2 39.8 17.5 6.0 738.0
SWAN VALLEY 11.6 102.9 69.6 54.0 15.6 2.0 3.0 258.8
TURTLE MOUNTAIN 7.6 74.6 40.1 32.3 6.4 3.4 1.3 165.7
TURTLE RIVER 5.3 59.5 38.6 35.2 7.2 1.7 2.0 149.5
WESTERN 10.5 126.3 69.3 35.6 11.9 2.7 4.0 260.3
WINNIPEG 138.9 2,141.2 1,141.8 699.3 280.9 94.0 18.0 4,514.2
PROVINCE 1,190.0 12,803.8 6,942.7 4,030.5 1,510.4 479.0 237.6 27,194.0
WHITESHELL 1.9 18.8 4.8 2.4 2.7 0.2 30.7
MITT 29.0 38.0 14.5 86.5 12.0 3.0 183.0
(2) Includes clinicians contracted/outsourced/private or employed by other divisions on a full time equivalent basis.
(3) Information Technology.
(1) Excludes personnel in Function 300 (Adult Learning Centres) and Function 400 (Community Education and Services) who do not provide
educational services to K-12 pupils.
INSTRUCTIONAL
TOTAL
FULL TIME EQUIVALENT (FTE) PERSONNEL EMPLOYED (1)
2019/2020 BUDGET
EXECUTIVE,
MANAGERIAL
AND
SUPERVISORY
TECHNICAL,
SPECIALIZED
AND SERVICE
SECRETARIAL
CLERICAL
AND OTHER
CLINICIAN (2)
IT (3)

- 59 -
DIRECT SUPPORT TO PUPILS
2018/19 AND 2019/20 BUDGET
DIVISION / DISTRICT 2018/19
% of Total
Expense 2019/20
% of Total
Expense 2018/19 2019/20
BEAUTIFUL PLAINS 16,102,618 79.2 16,423,972 79.0 8,929 9,117
BORDER LAND 26,418,961 77.4 26,418,223 77.3 12,400 12,353
BRANDON 87,437,400 84.3 88,815,300 84.3 10,174 10,240
DSFM 66,415,646 72.7 67,694,426 72.3 11,471 11,716
EVERGREEN 15,381,527 74.3 15,352,995 73.3 11,402 10,951
FLIN FLON 11,030,716 74.7 11,060,966 74.7 11,951 11,773
FORT LA BOSSE 13,957,082 75.8 13,984,135 75.8 10,012 9,728
FRONTIER 87,039,955 66.9 87,558,468 66.2 14,187 14,212
GARDEN VALLEY 40,262,600 80.1 40,521,200 79.6 9,231 9,328
HANOVER 69,660,600 80.0 71,112,000 79.9 8,858 8,954
INTERLAKE 29,434,800 79.0 29,545,500 78.8 10,492 10,499
KELSEY 15,781,556 78.2 15,332,734 77.1 10,830 10,743
LAKESHORE 12,145,491 74.0 11,574,491 73.1 11,678 12,229
LORD SELKIRK 45,467,203 78.9 45,629,905 79.0 12,041 12,024
LOUIS RIEL 152,313,287 82.3 155,028,312 81.7 10,233 10,387
MOUNTAIN VIEW 30,482,964 74.5 30,934,144 75.0 10,739 10,287
MYSTERY LAKE 34,370,616 80.6 33,846,442 80.8 11,280 11,327
PARK WEST 21,532,339 75.4 21,510,437 75.5 11,003 10,720
PEMBINA TRAILS 135,588,605 80.1 140,288,042 80.3 10,035 10,118
PINE CREEK 11,543,120 75.6 11,752,419 76.3 11,429 11,166
PORTAGE LA PRAIRIE 31,970,569 82.3 32,916,818 82.6 9,846 9,866
PRAIRIE ROSE 23,347,871 76.0 23,648,950 76.4 10,315 10,598
PRAIRIE SPIRIT 21,254,260 74.6 21,345,529 74.8 10,355 10,532
RED RIVER VALLEY 23,504,309 75.6 24,146,840 76.4 10,835 10,814
RIVER EAST TRANSCONA 154,644,837 81.3 157,780,140 81.5 9,579 9,689
ROLLING RIVER 18,076,070 75.1 18,034,150 74.7 10,617 10,494
SEINE RIVER 41,485,147 78.7 42,460,900 79.1 9,727 9,790
SEVEN OAKS 116,883,510 82.4 118,792,016 82.4 10,405 10,357
SOUTHWEST HORIZON 17,173,428 74.2 17,117,400 73.7 11,351 11,389
ST. JAMES-ASSINIBOIA 87,626,238 81.6 88,948,970 82.3 10,492 10,642
SUNRISE 48,206,123 75.7 48,697,030 76.3 11,059 10,955
SWAN VALLEY 15,695,260 73.9 15,745,431 74.2 11,163 11,439
TURTLE MOUNTAIN 10,685,760 79.0 10,563,773 77.4 11,254 10,622
TURTLE RIVER 8,267,148 73.4 8,250,134 72.7 11,904 11,794
WESTERN 16,412,774 81.0 16,801,520 80.7 9,128 9,009
WINNIPEG 315,641,750 79.7 322,385,516 80.0 10,433 10,687
PROVINCE 1,873,242,140 78.7 1,902,019,228 78.8 10,461 10,538
(1) Total of Regular Instruction, Student Support Services and Instructional and Other Support Services. See pages 15 and
16 for details.
DIRECT SUPPORT
PER PUPIL
DIRECT SUPPORT TO PUPILS
FUNCTIONS 100 + 200 + 600 (1)

- 60 -
STATISTICAL SUMMARY
2018/19 AND 2019/20 BUDGET
DIVISION / DISTRICT 2018/19 2019/20 2018/19 2019/20 (2)
2018 2019 (3)
2018 2019 (4)
BEAUTIFUL PLAINS 11,273 11,543 13.9 13.8 443,623 442,092 11.3 11.5
BORDER LAND 16,028 15,983 11.0 11.3 488,257 476,373 14.4 14.8
BRANDON 12,072 12,146 12.8 12.8 373,941 376,633 15.0 15.0
DSFM 15,788 16,194 12.0 11.8 469,974 468,321
EVERGREEN 15,346 14,938 12.2 12.5 716,133 726,888 11.0 11.1
FLIN FLON 15,996 15,759 11.7 11.7 210,306 211,130 21.4 21.4
FORT LA BOSSE 13,209 12,836 12.6 13.1 911,122 911,863 7.7 7.7
FRONTIER 21,215 21,460 12.1 12.0 111,404 114,978 12.9 13.2
GARDEN VALLEY 11,518 11,722 14.4 14.5 292,594 300,968 15.1 15.0
HANOVER 11,074 11,200 14.3 14.4 270,159 273,984 15.1 15.2
INTERLAKE 13,283 13,316 12.1 12.2 491,652 495,401 13.6 13.6
KELSEY 13,849 13,937 11.5 11.4 172,077 174,815 17.5 17.3
LAKESHORE 15,784 16,726 11.5 11.3 329,425 336,160 14.8 15.0
LORD SELKIRK 15,265 15,227 11.8 11.9 525,961 540,409 14.8 14.9
LOUIS RIEL 12,430 12,714 13.7 13.6 494,398 488,248 13.2 13.7
MOUNTAIN VIEW 14,417 13,726 12.3 13.0 380,667 384,710 15.3 15.6
MYSTERY LAKE 14,003 14,023 12.4 12.4 163,924 155,961 18.6 18.5
PARK WEST 14,598 14,194 11.4 11.7 615,540 624,146 10.4 10.5
PEMBINA TRAILS 12,527 12,594 13.9 13.8 630,272 619,867 12.3 12.4
PINE CREEK 15,112 14,628 11.2 11.9 543,183 537,899 13.7 13.9
PORTAGE LA PRAIRIE 11,966 11,947 12.8 12.8 426,810 433,714 13.7 13.9
PRAIRIE ROSE 13,569 13,866 12.1 11.5 648,173 640,231 11.1 11.3
PRAIRIE SPIRIT 13,882 14,087 12.5 12.4 665,193 681,966 9.6 9.8
RED RIVER VALLEY 14,330 14,154 12.3 12.8 669,242 665,460 13.8 13.6
RIVER EAST TRANSCONA 11,788 11,881 14.0 14.0 428,612 426,807 13.3 13.5
ROLLING RIVER 14,141 14,046 12.4 12.7 643,784 648,089 11.4 11.5
SEINE RIVER 12,352 12,378 13.6 13.7 335,946 336,015 14.6 14.6
SEVEN OAKS 12,625 12,572 13.7 13.9 327,972 333,778 16.5 16.7
SOUTHWEST HORIZON 15,296 15,451 11.4 11.7 816,595 827,723 10.4 10.5
ST. JAMES-ASSINIBOIA 12,861 12,927 13.5 13.5 610,145 598,190 12.8 13.4
SUNRISE 14,617 14,356 12.5 12.6 555,919 566,870 13.8 13.8
SWAN VALLEY 15,098 15,411 12.6 12.3 421,447 428,070 13.7 13.8
TURTLE MOUNTAIN 14,252 13,729 12.2 12.5 644,926 636,721 11.7 11.8
TURTLE RIVER 16,219 16,226 10.7 11.1 312,589 317,474 15.2 15.3
WESTERN 11,270 11,163 13.7 13.9 354,882 346,680 15.4 15.3
WINNIPEG 13,091 13,353 13.4 13.3 438,125 440,936 14.6 15.0
PROVINCE 13,284 13,374 13.1 13.1 454,968 455,854 13.6 13.8
WHITESHELL 20,238 20,428 8.7 8.3
(1) From page 4 (for more information, see page 4).
(2) From page 9 (for more information, see page 9).
(3) From page 50 (for more information, see page 50).
(4) From page 47 (for more information, see page 47).
SPECIAL LEVY
MILL RATE
ASSESSMENT
PER RESIDENT
PUPIL
PUPIL / EDUCATOR
RATIO
OPERATING
EXPENDITURE
PER PUPIL (1)