fracture of neck of femur services in new zealand
TRANSCRIPT
DRAFT
Fracture of Neck of Femur Services In New Zealand Hospitals
1999/2000
April 2002

1
TABLE OF CONTENTS TABLE OF FIGURES ............................................................................................................ 2 ACKNOWLEDGEMENT ...................................................................................................... 2 EXECUTIVE SUMMARY..................................................................................................... 3 1. INTRODUCTION .......................................................................................................... 5
1.1. Objective .................................................................................................................. 5 1.2. Methodological approach......................................................................................... 5 1.3 Limitations ............................................................................................................... 7
2. MORTALITY ................................................................................................................. 8
2.1. The crude mortality rate........................................................................................... 8 2.2. Survival rates ........................................................................................................... 9
2.2.1 Observed survival.......................................................................................... 10 2.2.2. Relative survival............................................................................................ 10
3. CAUSES OF MORTALITY........................................................................................ 12
3.1. Stepwise multiple regression analysis.................................................................... 12 3.2. Logistic regression analysis ................................................................................... 13 3.3. Risk-adjusted mortality index (RAMI) at a hospital level ..................................... 14
4. ACCESS TO SERVICE ............................................................................................... 16
4.1. Time from injury to admission............................................................................... 16 4.2. Time from admission to operation ......................................................................... 16 4.3. Time from operation to discharge .......................................................................... 18 4.4. Day of admission versus day of operation ............................................................. 18 4.5. Optimum injury-operation time ............................................................................. 19
5. CLINICAL PRACTICE .............................................................................................. 20
5.1 Treatment options .................................................................................................. 20 5.2. Type of procedure .................................................................................................. 25
6. QUESTIONS FOR THE FUTURE............................................................................. 27 APPENDIX 1: DATA............................................................................................................ 28
Data clean up....................................................................................................................... 28 Data validation .................................................................................................................... 31 The assessment of data quality............................................................................................ 32
APPENDIX 2: ADDITIONAL MORTALITY STATISTICS........................................... 33 APPENDIX 3: SURVIVAL ANALYSIS ............................................................................. 34 APPENDIX 4. REGRESSION ANALYSIS ....................................................................... 37
Causes of mortality ............................................................................................................. 37 Stepwise Multiple Regression............................................................................................. 38 Logistical Regression.......................................................................................................... 38
APPENDIX 5: ACCESS TO SERVICE STATISTICS ..................................................... 42 APPENDIX 6: CLINICAL PRACTICE METHODS........................................................ 45
Treatment options ............................................................................................................... 45 Type of procedure ............................................................................................................... 46
APPENDIX 7: DEFINITIONS............................................................................................. 47 Orthopaedic terms ............................................................................................................... 47 Hip fracture codes ............................................................................................................... 48

2
TABLE OF FIGURES Figure 1. Mortality estimated on the basis of morbidity and mortality datasets.......................................8 Figure 2. Cumulative mortality rate for both treatment options ...............................................................9 Figure 3. Mortality estimated on the basis of survival analysis..............................................................10 Figure 4. Relative survival for both patient groups ................................................................................11 Figure 5. RAMI calculated for each hospital 1999/2000........................................................................14 Figure 6. RAMI calculated for each hospital 1997-2000 .......................................................................15 Figure 7. Admission to operation time ...................................................................................................17 Figure 8. Time to surgery vs. mortality ..................................................................................................17 Figure 9. Distribution of admission and operation days .........................................................................18 Figure 10. Disparity between actual and expected number of operations ..............................................19 Figure 11. Comparison between conservative and surgical treatment options.......................................20 Figure 12. Distribution of fracture types in patients with conservative treatment..................................21 Figure 13. Distribution of fracture types in patients with surgical treatment .........................................21 Figure 14. Demographic and severity/complexity factors in patients with conservative treatment .......22 Figure 15. Survival in patients with cervical fractures ...........................................................................23 Figure 16. Survival in patients with trochanteric fractures.....................................................................23 Figure 17. Survival in patients with trochanteric fractures treated conservatively.................................24 Figure 18. Types of procedures for transcervical fractures across hospitals ..........................................25 Figure 19. Surgical preference given to internal fixation .......................................................................26 Figure 20. Surgical preference given to hemiarthroplasty......................................................................26 Figure 21. Surgical preference given to types other than hemiarthroplasty ...........................................26 Figure 22. Data processing .....................................................................................................................28 Figure 23. NMDS extraction criteria ......................................................................................................29 Figure 24. Pathologic fracture exclusion criteria....................................................................................30 Figure 25. Injury-death time...................................................................................................................33 Figure 26. Patient age .............................................................................................................................33 Figure 27. Patient gender........................................................................................................................33 Figure 28. Age and gender of patients who died ....................................................................................33 Figure 29. Follow-up of patients with hip fractures in 1999/2000 .........................................................34 Figure 30. Survival analysis – patients treated non-surgically ...............................................................35 Figure 31. Survival analysis – patients treated surgically.......................................................................36 Figure 32. Cardiac and respiratory complications ..................................................................................37 Figure 33. Stepwise multiple regression.................................................................................................38 Figure 34. Variables used for logistic regression ...................................................................................39 Figure 35. Correlation between variables...............................................................................................40 Figure 36. Combinations of variables for the model fitting....................................................................40 Figure 37. Association of predicted probabilities and observed responses ............................................40 Figure 38. RAMI over time ....................................................................................................................41 Figure 39. Injury to admission time........................................................................................................42 Figure 40. Admission to operation time .................................................................................................42 Figure 41. Key average times per hospital .............................................................................................43 Figure 44. Relationship between delay in time to surgery and mortality ...............................................44 Figure 45. The most common complications in patients treated conservatively ....................................45 Figure 46. Observed and relative survival in patients treated conservatively.........................................45 Figure 47. Transcervical fractures decision tree model on the basis of New Zealand practice ..............46 Figure 48. Hip fracture diagram .............................................................................................................47 ACKNOWLEDGEMENT We thank The New Zealand Orthopaedic Association, Dr Allan Panting, Dr Chris Bossley and Dr Brett Krause for their collaboration, clinical advice and guidance throughout this study.

3
EXECUTIVE SUMMARY This report is the result of comments and questions received following the release of the “Fracture of Neck of Femur Services in New Zealand 1998/99” report. There were two main objectives of this study:
• To use current administrative data (the mortality and morbidity data within the National Minimum Dataset-NMDS) and statistical techniques to produce quality of care indicators for fracture of neck of femur services in New Zealand hospitals for clinicians.
• To evaluate the usefulness of current data collections for assisting clinicians
with decision making and identifying areas for improvement. The full methodology for this analysis is detailed in Appendix 1. The key statistical analysis performed was stepwise and logistic regression. Survival analysis tools developed by the Finnish Cancer Registry were used to analyse survival rates. The study included 3131 patients aged 65 years and over with a hip fracture who were treated in public hospitals from 1 July 1999 to 30 June 2000. Out of that number, 2859 patients received surgical treatment and 272 were managed non-operatively. Mortality The findings of this study showed that 27% of patients died within 12 months of their injury. As the expected number of deaths estimated on the basis of patient’s age, gender and calendar time was roughly 10%, the actual burden of hip fractures was 17%. Mortality rates at one-month and six-months were 8% and 20% respectively. There was also a significant difference between genders. Mortality for male patients was 37% compared to 24% for females, although males were generally younger (median age 84 vs. 87 years). Patients treated surgically had a significantly lower mortality rate than those treated conservatively. The difference between the two treatment options was most obvious during the initial hospital episode (4% vs. 20%). Deaths occurred predominantly in hospital, either during the initial/procedure episode or subsequent readmissions due to complications. Approximately one third of deaths occurred in community. Causes of mortality The injury was not solely responsible for the high mortality rate. The combination of the injury with the patient’s age, gender, co-morbidity and case management were all significant factors.

4
The following predictors of death were identified as relevant by both stepwise and logistic regression modeling:
• age (being older), • gender (being male), • severity of co-morbid conditions (in particular cardiac and respiratory), and • delay in time to surgery
Access to service The only relevant determinant of mortality found by this study that was at the discretion of hospitals was time from admission to operation. Delay in time to surgery, either because of pre-existing comorbidity or because of non-medical reasons, was generally associated with increased mortality. The need to delay surgery may often be a reflection of patient’s general condition and measures instituted to reduce the anesthetic and operative risk. However, this study found that the medical condition was not exclusively responsible for delay. There is strong evidence that the number of patients operated on during the weekends is significantly lower than expected given the admission day. This was most likely caused by the unavailability of surgery resources. It appears that patients who sustain a fractured hip are commonly treated with a low priority. There was also considerable variation in both the injury-admission and admission-operation time across the New Zealand hospitals. Although the former time is not always recorded accurately, the findings of this study suggest that delay in time to surgery of more than two days after an injury is associated with increased mortality. This may indicate that the optimal injury-operation time is approximately 48 hours and that all patients with relatively stable medical condition should undergo surgery within that timeframe. Clinical practice Approximately 9% of patients in New Zealand did not proceed to surgery either by patient choice or surgeon’s decision. Non-operative care was mostly associated with trochanteric fracture and co-morbid conditions. Besides showing a higher incidence of common cardiac and respiratory complications, patients cared for conservatively showed more nervous system and mental disorders than those treated surgically. The higher than expected rate of conservative treatment may reflect coding variations where avulsion fracture of the greater trochanter could not be separated from inter-trochanteric fracture. There was variation in the surgical management of hip fractures across New Zealand hospitals. This is reflected in the variable proportion of internal fixation, hemiarthroplasty and total hip replacement. Some hospitals were identified as appearing to have preferences towards certain types of operation. However, it is always at the discretion of the surgeon to make the decision according to the individual circumstances.

5
Fracture of Neck of Femur Services in New Zealand Hospitals
1999/2000 1. INTRODUCTION In June 2000, NZHIS produced the report “Fracture of Neck of Femur Services in New Zealand 1998/99”, outlining the quality of care for fracture of neck of femur services across New Zealand hospitals. The objective was to report on the efficiency of hospital services to the Accident Compensation Corporation with the main focus on length of stay indicators. The report was sent to Hospital and Health Service (HHS) Chief Executives along with a request that they discuss the results with the members of the orthopaedic department. Comments and questions received from the orthopaedic surgeons were answered individually and considered for this report. The 1999/2000 neck of femur analysis reports on four areas of clinical care. These are:
• mortality, • cause of death, • access, and • variation in clinical practice.
1.1. Objective There were two major objectives in carrying out this study:
• To use current administrative data (the mortality and morbidity data within the National Minimum Dataset-NMDS) and statistical techniques to produce quality of care indicators for fracture of neck of femur services in New Zealand hospitals for clinicians.
• To evaluate the usefulness of current data collections for assisting clinicians with decision making and identifying areas for improvement.
1.2. Methodological approach The first step involved identifying the neck of femur fracture events from the financial year 1999/2000 used in the analysis. The information was obtained from the mortality (NZ Mortality Registry) and morbidity datasets (NMDS). All public hospital events were identified and then excluded if they met at least one of the following criteria:
• the age of the patient was less than 65, • the fracture was pathological.
The records were thoroughly cleaned up and validated in regard to the data accuracy, specificity and standardisation. The clean up involved removing fatal duplicates, modifying length of stay for overlapping events and identifying inconsistencies between the description and the recorded code. Subsequently the resulting data were

6
divided into two data sets: patients treated non-surgically and patients treated surgically. After the exclusion criteria were applied, the number of patients aged 65 years and over with a hip fracture who were treated in public hospitals from 1 July 1999 to 30 June 2000 was 3131. Out of that number, 2859 were managed operatively and 272 non-operatively. A thorough explanation of the method is provided in Appendix 1. Since the national data collection does not record information on patient satisfaction or functional outcome, mortality was used as an indicator for adverse patient outcomes. Mortality rates were calculated on the basis of:
• in-hospital deaths during initial episodes - patients who died in hospital during first admissions up to one month following the injury,
• in-hospitals deaths during all episodes - patients who died in hospital during first and subsequent admissions,
• community deaths
• survival time - patients followed-up until death (either in hospital or community) or - cut-off date of 1 April 2001.
Survival analysis was used to estimate relative survival time. The individual survival time was divided into intervals of one month. Data were processed by SURV3, the program developed at the Finnish Cancer Registry. The aim of such a comprehensive estimation of mortality rates was to give a broad picture and enable valid comparisons with the results of international and New Zealand studies should it be required. The NMDS variables likely to be associated with mortality were examined, and the probability of death was calculated based on the combination of those variables that offered the best statistical fit. Both stepwise multiple regression and logistic regression were used for model fitting. The access to orthopaedic services was investigated through analysis of key times. The key times of a neck of femur fracture episode were identified as the time from injury to admission and the time from admission to operation. As the time of injury was not reliably recorded, only the time from admission to operation was examined further. Finally, an analysis of clinical practice is presented, reflecting patient management decisions and variation in surgical procedures.

7
1.3 Limitations The following is a list of the limitations of this study:
• The patient sample only includes patients aged 65 and over. It is argued that most fractures of the neck of femur in younger patients are related to trauma, which is not the focus of this study.
• The study focuses at facility level so some District Health Boards (DHBs) will
have more than one hospital in the analysis. • Some facilities have only a small number of events relating to neck of femur
fractures. Those with less than five events have been excluded in any DHB specific analysis. Only two facilities were affected.
• Private Hospitals are not included in the study. • Issues with coding quality are discussed in the assessment of data quality in
Appendix 1. • No reference has been made to international research. We did undertake some
research, however this document is not designed to make national comparisons or judgements about treatment of femoral neck fractures. Our aim is only to share with hospitals the findings from our analysis of data from the NMDS.
• The NMDS does not allow any analysis of return to independence or outcome
of surgical procedure.
8
2. MORTALITY This section presents the mortality analysis of patients following a neck of femur fracture. The two separate indicators examined were:
• the crude mortality rate, • the survival rate.
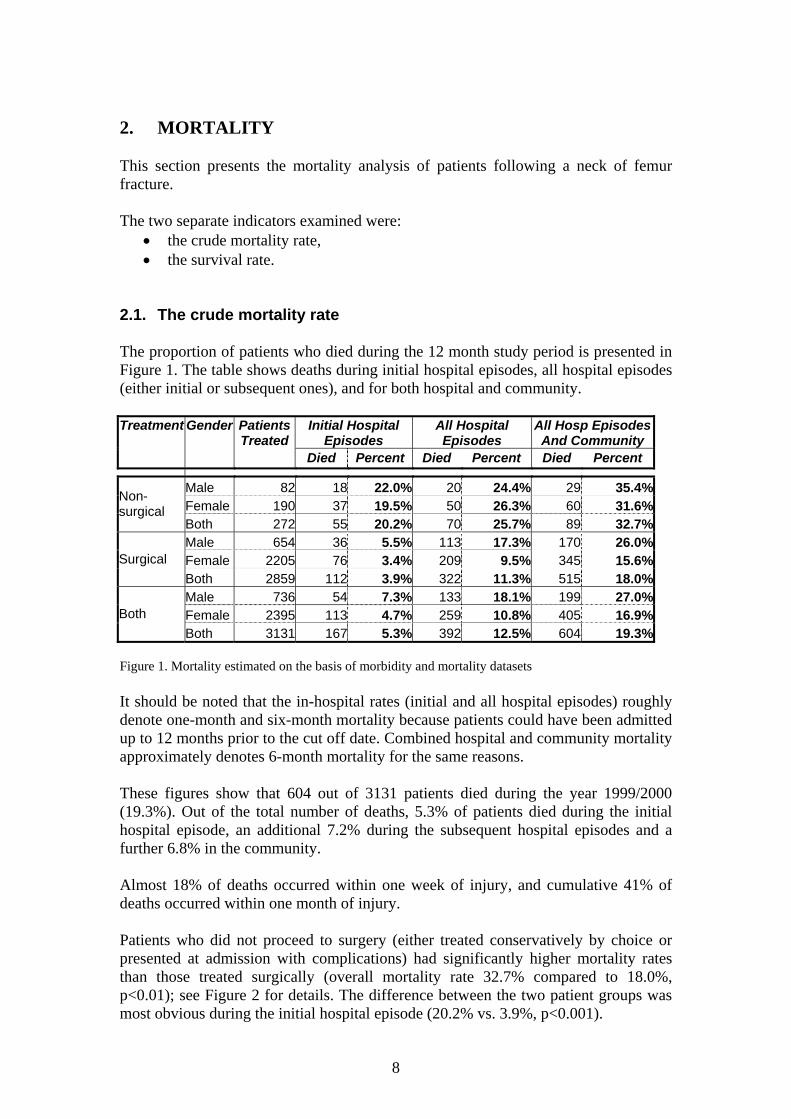
2.1. The crude mortality rate The proportion of patients who died during the 12 month study period is presented in Figure 1. The table shows deaths during initial hospital episodes, all hospital episodes (either initial or subsequent ones), and for both hospital and community.
Initial Hospital Episodes
All Hospital Episodes
All Hosp Episodes And Community
Treatment Gender Patients Treated
Died Percent Died Percent Died Percent
Male 82 18 22.0% 20 24.4% 29 35.4%Female 190 37 19.5% 50 26.3% 60 31.6%
Non-surgical
Both 272 55 20.2% 70 25.7% 89 32.7%Male 654 36 5.5% 113 17.3% 170 26.0%Female 2205 76 3.4% 209 9.5% 345 15.6%Surgical Both 2859 112 3.9% 322 11.3% 515 18.0%Male 736 54 7.3% 133 18.1% 199 27.0%Female 2395 113 4.7% 259 10.8% 405 16.9%Both Both 3131 167 5.3% 392 12.5% 604 19.3%
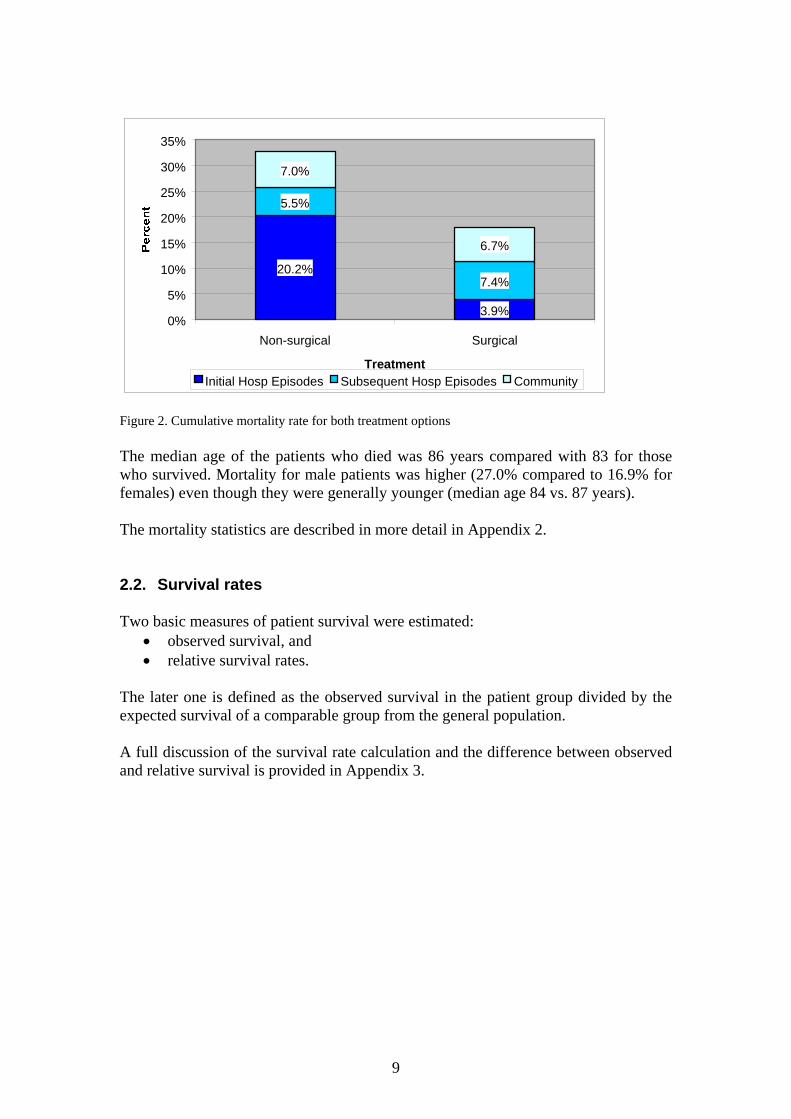
Figure 1. Mortality estimated on the basis of morbidity and mortality datasets It should be noted that the in-hospital rates (initial and all hospital episodes) roughly denote one-month and six-month mortality because patients could have been admitted up to 12 months prior to the cut off date. Combined hospital and community mortality approximately denotes 6-month mortality for the same reasons. These figures show that 604 out of 3131 patients died during the year 1999/2000 (19.3%). Out of the total number of deaths, 5.3% of patients died during the initial hospital episode, an additional 7.2% during the subsequent hospital episodes and a further 6.8% in the community. Almost 18% of deaths occurred within one week of injury, and cumulative 41% of deaths occurred within one month of injury. Patients who did not proceed to surgery (either treated conservatively by choice or presented at admission with complications) had significantly higher mortality rates than those treated surgically (overall mortality rate 32.7% compared to 18.0%, p<0.01); see Figure 2 for details. The difference between the two patient groups was most obvious during the initial hospital episode (20.2% vs. 3.9%, p<0.001).
9
20.2%
3.9%
5.5%
7.4%
7.0%
6.7%
0%
5%
10%
15%
20%
25%
30%
35%
Non-surgical Surgical
TreatmentInitial Hosp Episodes Subsequent Hosp Episodes Community
Figure 2. Cumulative mortality rate for both treatment options The median age of the patients who died was 86 years compared with 83 for those who survived. Mortality for male patients was higher (27.0% compared to 16.9% for females) even though they were generally younger (median age 84 vs. 87 years). The mortality statistics are described in more detail in Appendix 2. 2.2. Survival rates Two basic measures of patient survival were estimated:
• observed survival, and • relative survival rates.
The later one is defined as the observed survival in the patient group divided by the expected survival of a comparable group from the general population. A full discussion of the survival rate calculation and the difference between observed and relative survival is provided in Appendix 3.

10
2.2.1 Observed survival The observed mortality rates obtained on the basis of crude survival are shown in Figure 3.
Mortality Treatment Gender Patients 1-month 6-month 12-month
Male 82 23.2% 35.4% 42.0% Female 190 22.6% 33.2% 38.2%
Non-surgical
Both 272 22.8% 33.8% 39.3% Male 654 10.1% 28.0% 36.2% Female 2205 5.6% 15.7% 22.7% Surgical Both 2859 6.6% 18.5% 25.8% Male 736 11.6% 28.8% 36.8% Female 2395 7.0% 17.0% 23.9% Both Both 3131 8.1% 19.8% 27.0%
Figure 3. Mortality estimated on the basis of survival analysis The one-year crude mortality for all patients who sustained a hip fracture was 27%. Patients treated surgically had a significantly lower one-year mortality than those who did not proceed to surgery (25.8% vs. 39.3%, p<0.05). A comparison of the mortality rates from the NMDS with those from the survival analysis, which included deaths in the community, shows that the NMDS provides a good predictor of death rates.
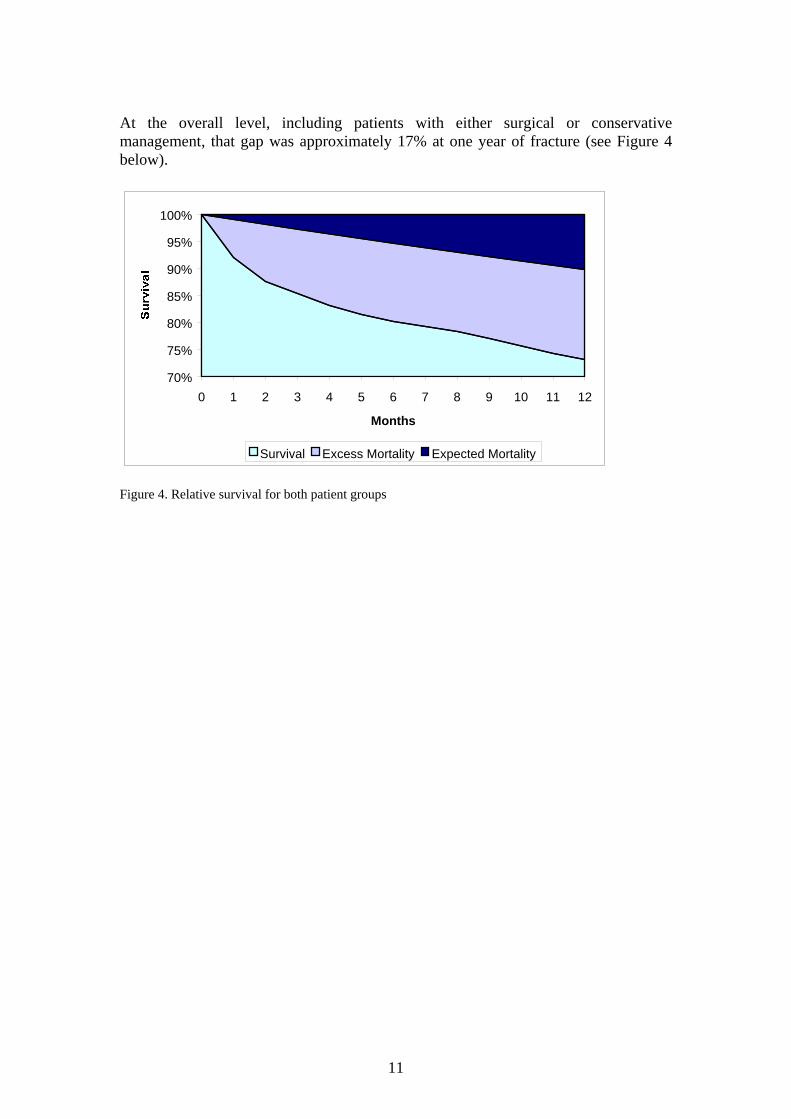
2.2.2. Relative survival The relative survival rate is calculated to allow comparisons with other survival rates without information on cause of death. The one-year relative mortality rate was approximately 8% lower in both patient groups: 17.4% for patients treated surgically and 31.9% for patients treated non-surgically (see Figures 30 and 31 in Appendix 3). This is the proportion (i.e. observed/expected) of patients who died in the hypothetical situation where the hip fracture was the only possible cause of death. The measure of the excess one-year mortality (i.e. observed–expected difference) experienced by patients who sustained femoral neck fractures was approximately 16% for those treated surgically (i.e. 25.8% - 10.2%) and 28% for those treated non-surgically (i.e. 39.3% - 10.9%). This gap suggests the actual proportion of patients who died due to femoral neck fractures and competing risks rather than natural causes.
11
At the overall level, including patients with either surgical or conservative management, that gap was approximately 17% at one year of fracture (see Figure 4 below).
70%
75%
80%
85%
90%
95%
100%
0 1 2 3 4 5 6 7 8 9 10 11 12
Months
Survival Excess Mortality Expected Mortality
Figure 4. Relative survival for both patient groups

12
3. CAUSES OF MORTALITY This section presents the analysis of causes of mortality by assessing a number of potential determinants that were available from the NMDS data. A model for predicting probability of death was developed on the basis of patients receiving surgical treatment. The variables examined were:
1. sex, 2. age, 3. ethnicity, 4. socio-economic status, 5. fracture type, 6. procedure type, 7. admission to operation time, 8. cardiac complications, 9. respiratory complications, 10. complication-comorbidity level (CCL), 11. combined weights.
There are other predictors associated with the management of hip fracture that could be classified within an overall package of care such as:
• antibiotic and thrombolytic prophylaxis, • anaesthetic, surgical and nursing factors, • early mobilisation, etc.
However, these factors cannot be assessed on the basis of NMDS data. 3.1. Stepwise multiple regression analysis Analysis was performed to estimate the effect of each independent variable on a dependent variable (i.e. death). The independent variables which have the most explanatory power were identified by controlling and comparing the effects of all other independent variables in the model. More details are available in Appendix 4. This approach identified the following variables as the most relevant ones in predicting the likelihood of death:
• age, • male gender, • cardiac and respiratory complications, and • delay in time to surgery.
13
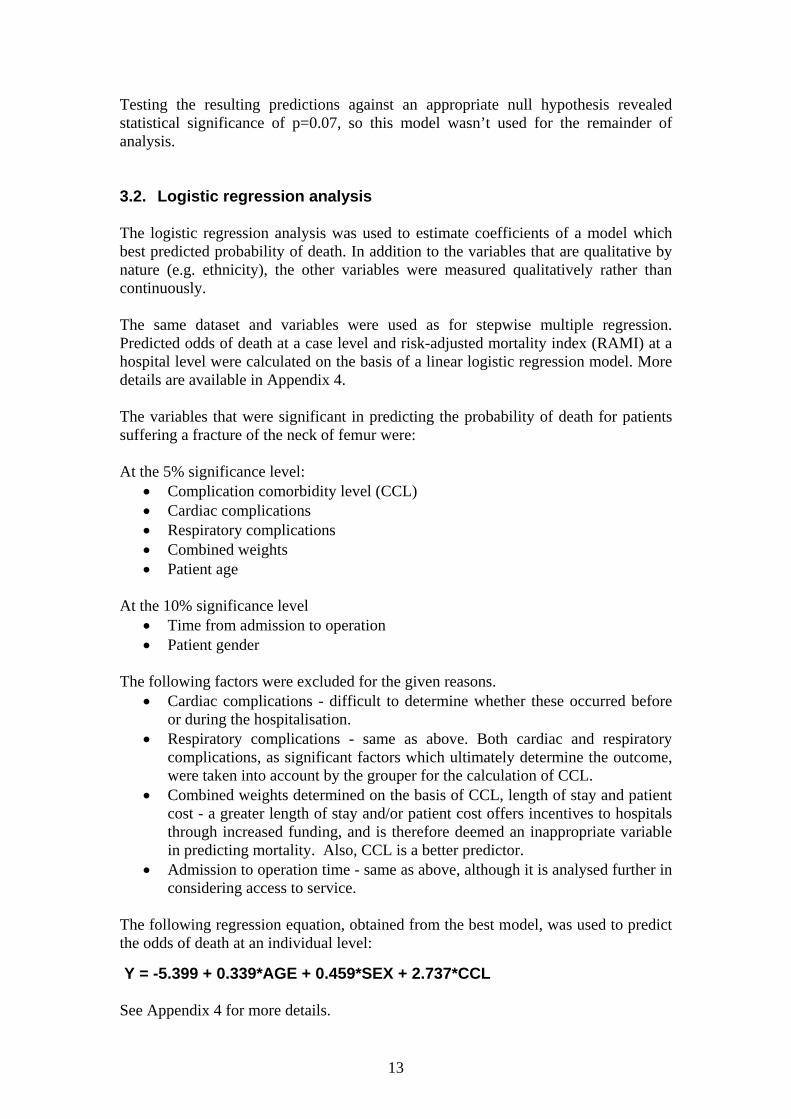
Testing the resulting predictions against an appropriate null hypothesis revealed statistical significance of p=0.07, so this model wasn’t used for the remainder of analysis. 3.2. Logistic regression analysis The logistic regression analysis was used to estimate coefficients of a model which best predicted probability of death. In addition to the variables that are qualitative by nature (e.g. ethnicity), the other variables were measured qualitatively rather than continuously. The same dataset and variables were used as for stepwise multiple regression. Predicted odds of death at a case level and risk-adjusted mortality index (RAMI) at a hospital level were calculated on the basis of a linear logistic regression model. More details are available in Appendix 4. The variables that were significant in predicting the probability of death for patients suffering a fracture of the neck of femur were: At the 5% significance level:
• Complication comorbidity level (CCL) • Cardiac complications • Respiratory complications • Combined weights • Patient age
At the 10% significance level
• Time from admission to operation • Patient gender
The following factors were excluded for the given reasons.
• Cardiac complications - difficult to determine whether these occurred before or during the hospitalisation.
• Respiratory complications - same as above. Both cardiac and respiratory complications, as significant factors which ultimately determine the outcome, were taken into account by the grouper for the calculation of CCL.
• Combined weights determined on the basis of CCL, length of stay and patient cost - a greater length of stay and/or patient cost offers incentives to hospitals through increased funding, and is therefore deemed an inappropriate variable in predicting mortality. Also, CCL is a better predictor.
• Admission to operation time - same as above, although it is analysed further in considering access to service.
The following regression equation, obtained from the best model, was used to predict the odds of death at an individual level: Y = -5.399 + 0.339*AGE + 0.459*SEX + 2.737*CCL See Appendix 4 for more details.

14
3.3. Risk-adjusted mortality index (RAMI) at a hospital level The Risk-Adjusted Mortality Index (RAMI) provides a means of comparing inpatient mortality (deaths occurring during patients’ stay in hospital), adjusting for patient risk on admission. The RAMI is the ratio of actual to expected mortality rate, where the expected mortality rate is estimated by using logistic regression to control significant risk factors not associated with the injury, in this case, age, sex and complication comorbidity level (CCL). The expected mortality number at a hospital level was calculated as a sum of predicted probabilities at an individual level. Hospitals with a RAMI greater than 1 had more deaths than expected. Those hospitals with a RAMI less than 1 had fewer deaths than expected. The results are presented in Figure 5.
Hospital
Event Number
Actual Mortality Number
Actual Mortality Percent
Expected Mortality Percent
RAMI p-value Rank
A 147 8 5.44 3.37 1.61 0.165 19B 51 1 1.96 3.40 0.58 0.568 4C 59 1 1.69 2.62 0.65 0.659 5D 149 10 6.71 4.19 1.60 0.124 17E 44 3 6.82 4.89 1.40 0.552 15F 82 1 1.22 4.32 0.28 0.168 3G 88 5 5.68 3.07 1.85 0.158 20H 113 5 4.42 4.11 1.08 0.868 11I 172 4 2.33 2.58 0.90 0.836 9J 372 14 3.76 4.38 0.86 0.560 8K 82 1 1.22 5.19 0.24 0.105 2L 161 4 2.48 3.38 0.73 0.530 6M 96 5 5.21 4.49 1.16 0.734 13N 251 9 3.59 3.55 1.01 0.976 10O 413 15 3.63 4.26 0.85 0.527 7P 33 0 0.00 2.93 0.00 0.318 1=Q 61 4 6.56 2.81 2.34 0.076 21R 41 2 4.88 3.67 1.33 0.678 14S 363 15 4.13 3.82 1.08 0.753 12T 71 4 5.63 3.51 1.60 0.330 18U 19 1 5.26 3.49 1.51 0.670 16V 27 0 0.00 4.13 0.00 0.280 1=W 16 0 0.00 4.12 0.00 0.407 1=
NZ 2911 112 3.85 Figure 5. RAMI calculated for each hospital 1999/2000 Note: This work is calculated using events. There were 2859 surgically treated patients who had 2916 events. Two facilities had less than 5 patients and were removed from the study. Hospitals such as Q and G had a greater mortality rate than expected, even after patient risk is controlled for. Hospitals K and F had lower than expected mortality, but hospitals P, V and W had a zero actual mortality rate and thus a zero RAMI. Because
15
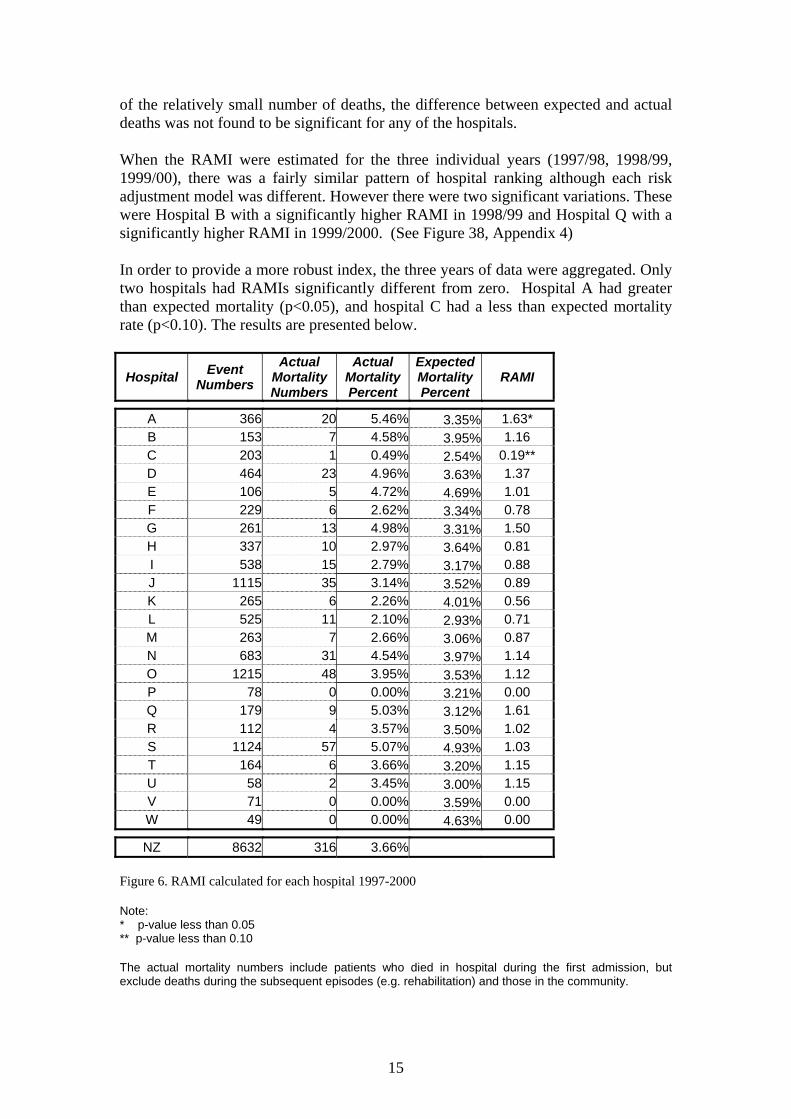
of the relatively small number of deaths, the difference between expected and actual deaths was not found to be significant for any of the hospitals. When the RAMI were estimated for the three individual years (1997/98, 1998/99, 1999/00), there was a fairly similar pattern of hospital ranking although each risk adjustment model was different. However there were two significant variations. These were Hospital B with a significantly higher RAMI in 1998/99 and Hospital Q with a significantly higher RAMI in 1999/2000. (See Figure 38, Appendix 4) In order to provide a more robust index, the three years of data were aggregated. Only two hospitals had RAMIs significantly different from zero. Hospital A had greater than expected mortality (p<0.05), and hospital C had a less than expected mortality rate (p<0.10). The results are presented below.
Hospital Event Numbers
Actual Mortality Numbers
Actual Mortality Percent
Expected Mortality Percent
RAMI
A 366 20 5.46% 3.35% 1.63* B 153 7 4.58% 3.95% 1.16 C 203 1 0.49% 2.54% 0.19** D 464 23 4.96% 3.63% 1.37 E 106 5 4.72% 4.69% 1.01 F 229 6 2.62% 3.34% 0.78 G 261 13 4.98% 3.31% 1.50 H 337 10 2.97% 3.64% 0.81 I 538 15 2.79% 3.17% 0.88 J 1115 35 3.14% 3.52% 0.89 K 265 6 2.26% 4.01% 0.56 L 525 11 2.10% 2.93% 0.71 M 263 7 2.66% 3.06% 0.87 N 683 31 4.54% 3.97% 1.14 O 1215 48 3.95% 3.53% 1.12 P 78 0 0.00% 3.21% 0.00 Q 179 9 5.03% 3.12% 1.61 R 112 4 3.57% 3.50% 1.02 S 1124 57 5.07% 4.93% 1.03 T 164 6 3.66% 3.20% 1.15 U 58 2 3.45% 3.00% 1.15 V 71 0 0.00% 3.59% 0.00 W 49 0 0.00% 4.63% 0.00
NZ 8632 316 3.66% Figure 6. RAMI calculated for each hospital 1997-2000 Note: * p-value less than 0.05 ** p-value less than 0.10 The actual mortality numbers include patients who died in hospital during the first admission, but exclude deaths during the subsequent episodes (e.g. rehabilitation) and those in the community.

16
4. ACCESS TO SERVICE This section looks at access to neck of femur services in New Zealand through analysis of key times. The four indicators of access to service examined were:
1. Time from injury to admission 2. Time from admission to operation 3. Time from operation to discharge 4. Day of admission versus day of operation
The most reliable indicators are time from admission to operation and day of admission versus day of operation. The admission-operation time was identified as the only relevant predictor of death which may be at the discretion of hospitals. The NMDS does not contain time in hours, which would enable a more accurate assessment of these indicators, however the aim of the analysis was to estimate the level of priority and the impact of delay in time to surgery on mortality so estimates based on days were suitable. See Appendix 5 for more details. 4.1. Time from injury to admission Time from injury to admission was not investigated comprehensively for the following reasons:
• Inconsistent injury dates - injury dates are not always recorded accurately and are sometimes defaulted to the first of the month.
• Admission to hospital following an injury is not at the discretion of the hospital.
A total of 2325 patients or approximately 80% were admitted into hospital on the day the injury occurred and an additional 200 patients or 7% were admitted into hospital on the day following their injury (see Figure 39, Appendix 5). 4.2. Time from admission to operation According to Figure 7, 73% of patients who sustained hip fractures underwent surgery on the day of admission or the day after admission (27% and 46% respectively). The majority of remaining patients were operated by the fourth day after admission (cumulative 96%). More details are presented in Figure 40, Appendix 5.

17
Figure 7. Admission to operation time When considering mortality in relation to time to surgery, the findings showed that a delay, either due to the patient’s condition or for non-medical reasons, was likely to be associated with an increase in mortality rate (see Figure 8 below). The correlation coefficient equalled 0.81, indicating a moderately strong relationship between the variables. Since the p-value was less than 0.10, the relationship between time to surgery and mortality variables was significant at the 90% confidence level. The R-squared statistic showed that the time to surgery could explain 66% of the variability in mortality.
Figure 8. Time to surgery vs. mortality The variation in key times (the injury-admission, admission-operation and injury-operation) across the New Zealand hospitals is presented in Figure 41, Appendix 5.
0%
5%
10%
15%
20%
25%
30%
35%
40%
45%
50%
0 1 2 3 4 5 6 7 8 9 10 11 12 13 14 15 18 19 28
Admission to Operation Time (days)
Percent
0%
10%
20%
30%
40%
50%
60%
70%
80%
90%
100%Cumulative percent
0%
1%
2%
3%
4%
5%
6%
7%
DaysMortality 4.20% 3.39% 3.73% 5.30% 6.67%
0 1 2 3 4
18
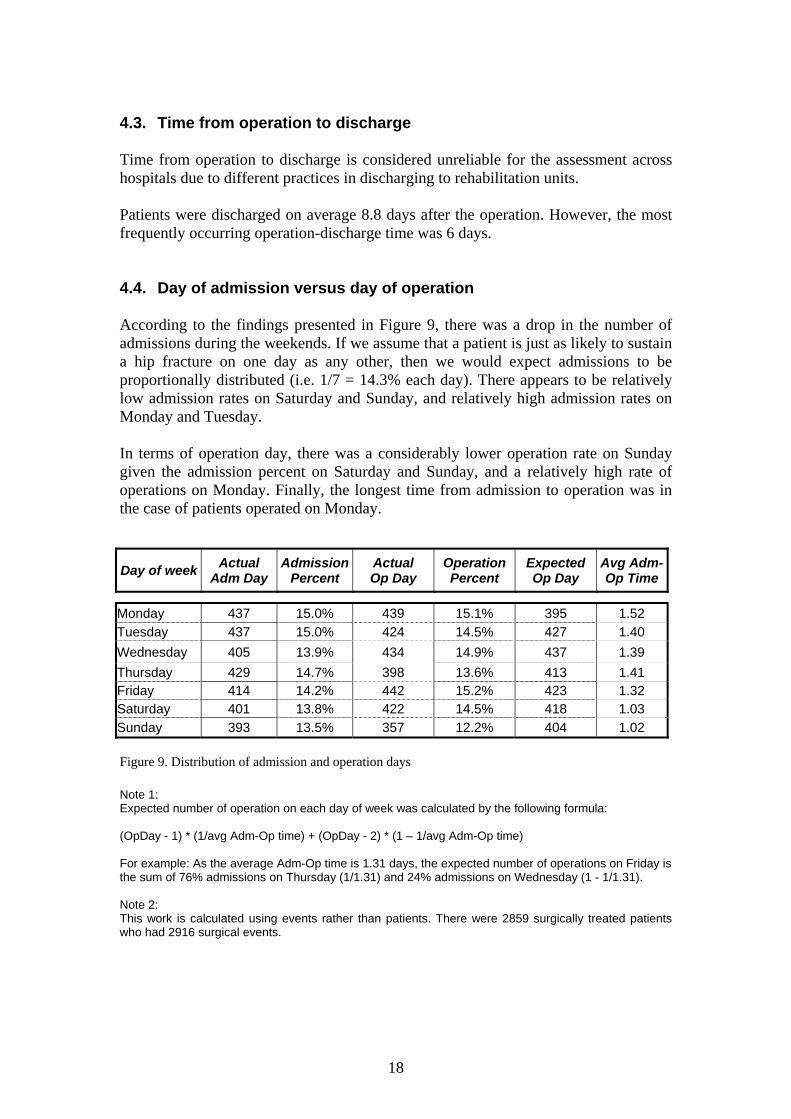
4.3. Time from operation to discharge Time from operation to discharge is considered unreliable for the assessment across hospitals due to different practices in discharging to rehabilitation units. Patients were discharged on average 8.8 days after the operation. However, the most frequently occurring operation-discharge time was 6 days. 4.4. Day of admission versus day of operation According to the findings presented in Figure 9, there was a drop in the number of admissions during the weekends. If we assume that a patient is just as likely to sustain a hip fracture on one day as any other, then we would expect admissions to be proportionally distributed (i.e. 1/7 = 14.3% each day). There appears to be relatively low admission rates on Saturday and Sunday, and relatively high admission rates on Monday and Tuesday. In terms of operation day, there was a considerably lower operation rate on Sunday given the admission percent on Saturday and Sunday, and a relatively high rate of operations on Monday. Finally, the longest time from admission to operation was in the case of patients operated on Monday.
Day of week Actual Adm Day
Admission Percent
Actual Op Day
Operation Percent
Expected Op Day
Avg Adm-Op Time
Monday 437 15.0% 439 15.1% 395 1.52 Tuesday 437 15.0% 424 14.5% 427 1.40 Wednesday 405 13.9% 434 14.9% 437 1.39 Thursday 429 14.7% 398 13.6% 413 1.41 Friday 414 14.2% 442 15.2% 423 1.32 Saturday 401 13.8% 422 14.5% 418 1.03 Sunday 393 13.5% 357 12.2% 404 1.02 Figure 9. Distribution of admission and operation days Note 1: Expected number of operation on each day of week was calculated by the following formula: (OpDay - 1) * (1/avg Adm-Op time) + (OpDay - 2) * (1 – 1/avg Adm-Op time) For example: As the average Adm-Op time is 1.31 days, the expected number of operations on Friday is the sum of 76% admissions on Thursday (1/1.31) and 24% admissions on Wednesday (1 - 1/1.31). Note 2: This work is calculated using events rather than patients. There were 2859 surgically treated patients who had 2916 surgical events.

19
It was found that the expected operation day was not significantly different to the actual operation day between Tuesday and Saturday, however on Sunday and Monday the expected operation day was significantly different to the actual operation day at the 1% significance level (see Figure 10).
Actual-Expected Number of Operations
-50
-40
-30
-20
-10
0
10
20
30
40
50
Friday Saturday Sunday Monday
Figure 10. Disparity between actual and expected number of operations There was no significant difference in patient’s clinical severity and case complexity between admission days in a week. However, patients with the highest severity of co-morbid conditions were typically admitted on Monday and operated on Tuesday or Wednesday (see Figure 42 in Appendix 5). 4.5. Optimum injury-operation time When comparing both key times (injury-admission and admission-operation) to mortality, the results suggest that an increase in mortality was observed after two days following the injury across all combinations: 0 + 3, 1 + 2, and 2 + 1 days respectively (see Appendix 5, Figure 43 for more details). This may indicate that the optimal injury-operation time is up to approximately two days following the injury, subject to the patient’s medical condition. Despite concerns regarding the accuracy of the injury-admission time, patients with surgical treatments were assessed according to above criteria. There was a statistically significant difference in mortality between those who had surgery within two days of the injury and those with a delay of more than two days at the subsequent episodes (6.99% and 10.56% respectively) and the overall level (16.97% and 22.05%). (See Figure 44 in Appendix 5)
20
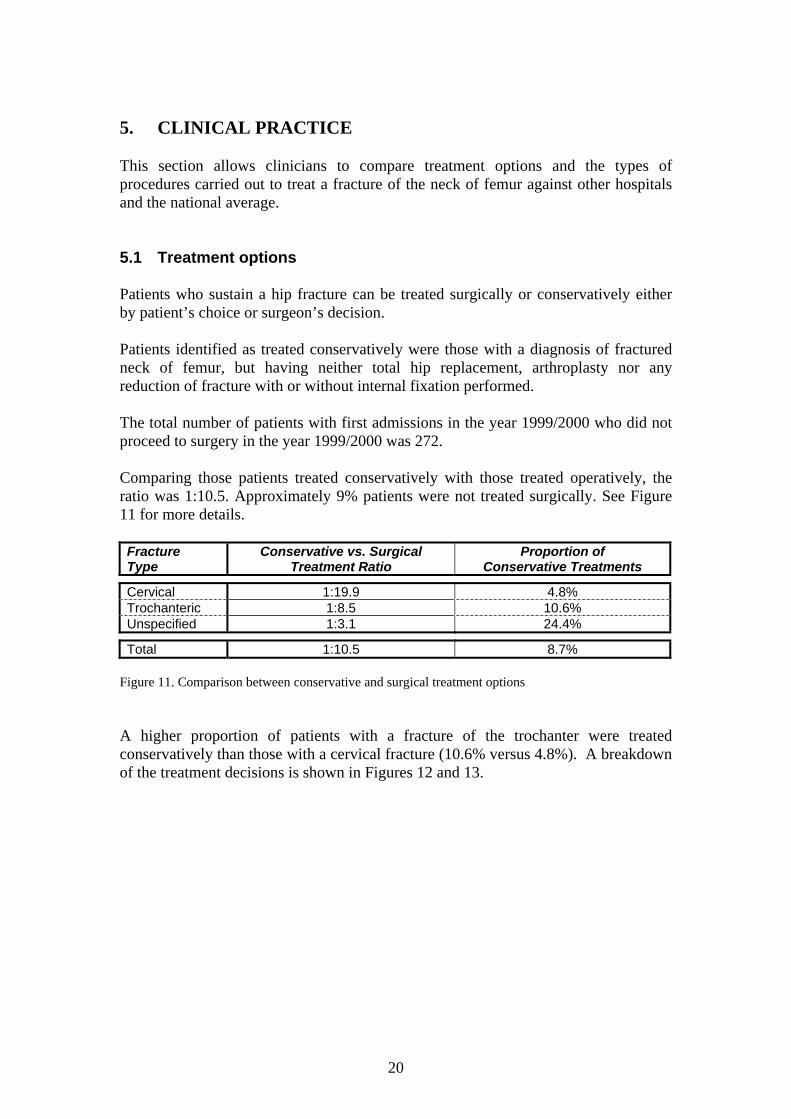
5. CLINICAL PRACTICE This section allows clinicians to compare treatment options and the types of procedures carried out to treat a fracture of the neck of femur against other hospitals and the national average. 5.1 Treatment options Patients who sustain a hip fracture can be treated surgically or conservatively either by patient’s choice or surgeon’s decision. Patients identified as treated conservatively were those with a diagnosis of fractured neck of femur, but having neither total hip replacement, arthroplasty nor any reduction of fracture with or without internal fixation performed. The total number of patients with first admissions in the year 1999/2000 who did not proceed to surgery in the year 1999/2000 was 272. Comparing those patients treated conservatively with those treated operatively, the ratio was 1:10.5. Approximately 9% patients were not treated surgically. See Figure 11 for more details. Fracture Type
Conservative vs. Surgical Treatment Ratio
Proportion of Conservative Treatments
Cervical 1:19.9 4.8% Trochanteric 1:8.5 10.6% Unspecified 1:3.1 24.4%
Total 1:10.5 8.7% Figure 11. Comparison between conservative and surgical treatment options A higher proportion of patients with a fracture of the trochanter were treated conservatively than those with a cervical fracture (10.6% versus 4.8%). A breakdown of the treatment decisions is shown in Figures 12 and 13.

21
Conservative Treatment
0%
10%
20%
30%
40%
50%
60%
Cervical Trochanteric Unspecified
Fracture Type
Perc
ent
Figure 12. Distribution of fracture types in patients with conservative treatment
Surgical Treatment
0%
10%
20%
30%
40%
50%
60%
Cervical Trochanteric Unspecified
Fracture Type
Figure 13. Distribution of fracture types in patients with surgical treatment There was a statistically significant difference between treatment options at the 99% confidence level. Typically, the unspecified fractures were more frequently reported in patients managed conservatively. The other factor that might influence the decision not to operate could be the patient’s condition. Analysis of the first five diagnosis codes for each patient identified mostly the same complications as for patients treated surgically, but also included a number of nervous system and mental disorders (e.g. Alzheimer’s disease, hemiplegia, senile dementia, organic psychotic conditions). These were more frequently associated with patients who were treated conservatively (see Table 45 in Appendix 6).
22
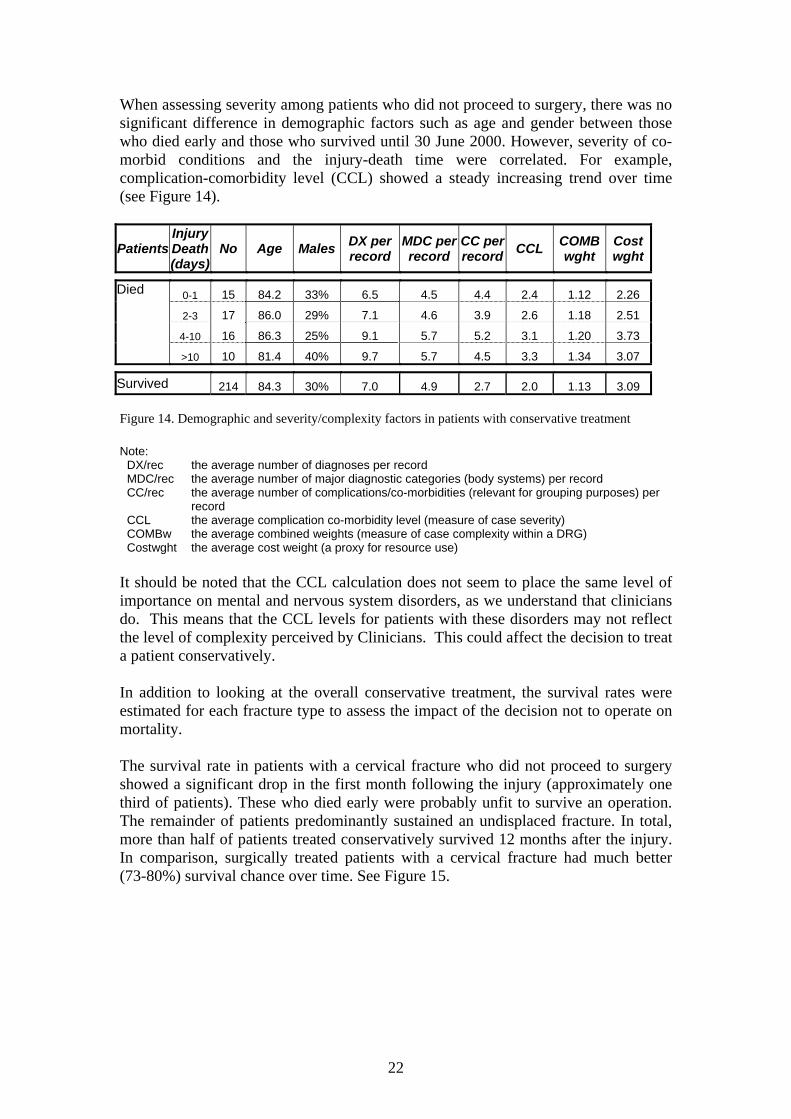
When assessing severity among patients who did not proceed to surgery, there was no significant difference in demographic factors such as age and gender between those who died early and those who survived until 30 June 2000. However, severity of co-morbid conditions and the injury-death time were correlated. For example, complication-comorbidity level (CCL) showed a steady increasing trend over time (see Figure 14).
Patients InjuryDeath (days)
No Age Males DX per record
MDC perrecord
CC perrecord CCL COMB
wght Cost wght
0-1 15 84.2 33% 6.5 4.5 4.4 2.4 1.12 2.26
2-3 17 86.0 29% 7.1 4.6 3.9 2.6 1.18 2.51
4-10 16 86.3 25% 9.1 5.7 5.2 3.1 1.20 3.73
Died
>10 10 81.4 40% 9.7 5.7 4.5 3.3 1.34 3.07
Survived 214 84.3 30% 7.0 4.9 2.7 2.0 1.13 3.09 Figure 14. Demographic and severity/complexity factors in patients with conservative treatment Note:
DX/rec the average number of diagnoses per record MDC/rec the average number of major diagnostic categories (body systems) per record CC/rec the average number of complications/co-morbidities (relevant for grouping purposes) per
record CCL the average complication co-morbidity level (measure of case severity) COMBw the average combined weights (measure of case complexity within a DRG) Costwght the average cost weight (a proxy for resource use)
It should be noted that the CCL calculation does not seem to place the same level of importance on mental and nervous system disorders, as we understand that clinicians do. This means that the CCL levels for patients with these disorders may not reflect the level of complexity perceived by Clinicians. This could affect the decision to treat a patient conservatively. In addition to looking at the overall conservative treatment, the survival rates were estimated for each fracture type to assess the impact of the decision not to operate on mortality. The survival rate in patients with a cervical fracture who did not proceed to surgery showed a significant drop in the first month following the injury (approximately one third of patients). These who died early were probably unfit to survive an operation. The remainder of patients predominantly sustained an undisplaced fracture. In total, more than half of patients treated conservatively survived 12 months after the injury. In comparison, surgically treated patients with a cervical fracture had much better (73-80%) survival chance over time. See Figure 15.

23
Cervical Fractures
50
60
70
80
90
100
0 1 2 3 4 5 6 7 8 9 10 11 12
Follow-up (months)
Conservative treatment Surgical treatment
Figure 15. Survival in patients with cervical fractures The gap in survival rates between two groups of patients with trochanteric fractures was much narrower (approximately 3-6%). Also both types of management showed a steady decreasing trend over time (Figure 16).
Trochanteric Fractures
50
60
70
80
90
100
0 1 2 3 4 5 6 7 8 9 10 11 12
Follow-up (months)
Conservative treatment Surgical treatment
Figure 16. Survival in patients with trochanteric fractures See Figure 46 in Appendix 6 for more details.
24
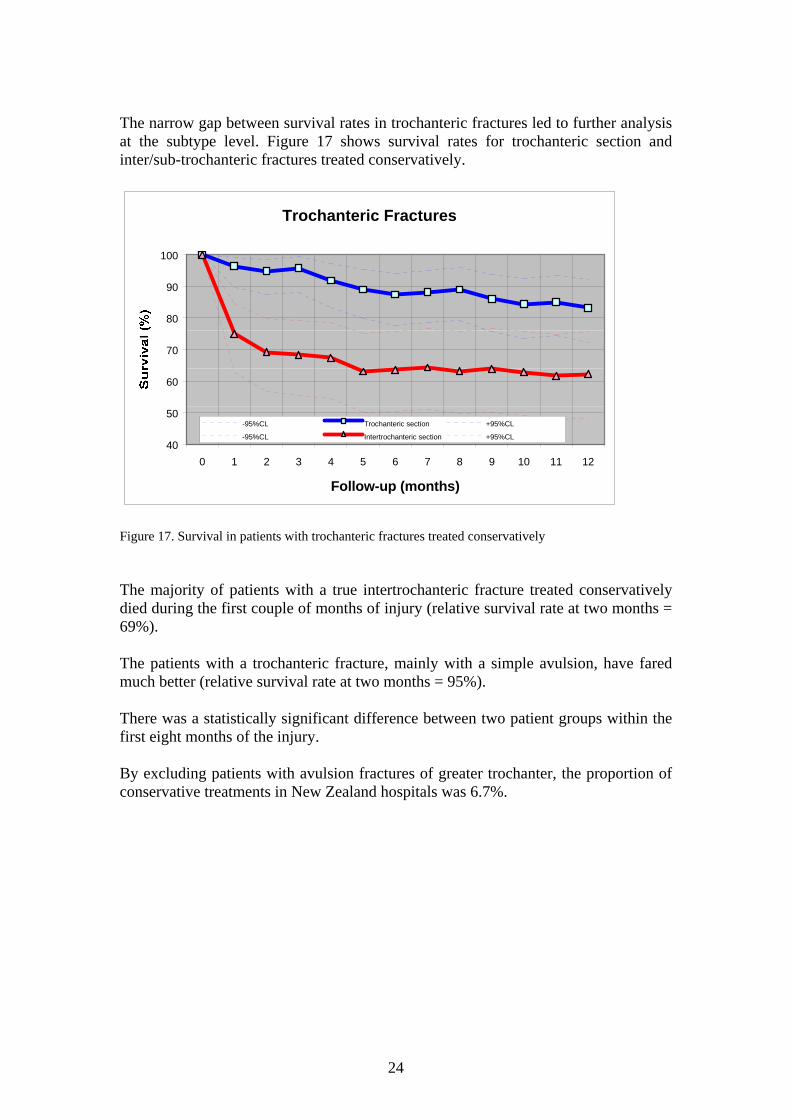
The narrow gap between survival rates in trochanteric fractures led to further analysis at the subtype level. Figure 17 shows survival rates for trochanteric section and inter/sub-trochanteric fractures treated conservatively.
Trochanteric Fractures
40
50
60
70
80
90
100
0 1 2 3 4 5 6 7 8 9 10 11 12
Follow-up (months)
-95%CL Trochanteric section +95%CL
-95%CL Intertrochanteric section +95%CL
Figure 17. Survival in patients with trochanteric fractures treated conservatively The majority of patients with a true intertrochanteric fracture treated conservatively died during the first couple of months of injury (relative survival rate at two months = 69%). The patients with a trochanteric fracture, mainly with a simple avulsion, have fared much better (relative survival rate at two months = 95%). There was a statistically significant difference between two patient groups within the first eight months of the injury. By excluding patients with avulsion fractures of greater trochanter, the proportion of conservative treatments in New Zealand hospitals was 6.7%.

25
5.2. Type of procedure Due to the specificity of information regarding cervical fractures available in the NMDS data, the operative procedures were investigated at the major type level: internal fixation, hemiarthroplasty and total hip replacement. The average medical practice in New Zealand for the year 1999/2000 is demonstrated by a decision tree model which makes use of variables such as fracture displacement, patient’s age and osteoarthritis (see Figure 47 in Appendix 6). The variation in clinical practice regarding operative procedures is presented in Figure 18.
Operative Procedures Fixation Hemiarthro- Total Fixation Hemiarthro- Total Hospital
Total Cerv Fract Reduct plasty Hip Repl Reduct% plasty% Hip Repl%
A 78 35 35 8 44.9% 44.9% 10.3%B 25 9 14 2 36.0% 56.0% 8.0%C 30 20 8 2 66.7% 26.7% 6.7%D 59 23 30 6 39.0% 50.8% 10.2%E 19 4 9 6 21.1% 47.4% 31.6%F 42 13 23 6 31.0% 54.8% 14.3%G 43 15 28 0 34.9% 65.1% 0.0%H 52 14 24 14 26.9% 46.2% 26.9%I 101 33 53 15 32.7% 52.5% 14.9%J 179 67 100 12 37.4% 55.9% 6.7%K 39 15 22 2 38.5% 56.4% 5.1%L 83 32 38 13 38.6% 45.8% 15.7%M 37 11 20 6 29.7% 54.1% 16.2%N 129 34 90 5 26.4% 69.8% 3.9%O 211 63 118 30 29.9% 55.9% 14.2%P 14 5 8 1 35.7% 57.1% 7.1%Q 29 6 23 0 20.7% 79.3% 0.0%R 25 10 12 3 40.0% 48.0% 12.0%S 200 82 86 32 41.0% 43.0% 16.0%T 31 14 16 1 45.2% 51.6% 3.2%U 9 6 2 1 66.7% 22.2% 11.1%V 7 1 5 1 14.3% 71.4% 14.3%W 6 1 5 0 16.7% 83.3% 0.0%
NZ 1449 513 769 167 35.4% 53.1% 11.5% Figure 18. Types of procedures for transcervical fractures across hospitals

26
The Figures 19-21 show surgical preference in terms of particular types of procedures. These are an illustration of the variation in the management of hip fractures across New Zealand hospitals.
Hospital C
0%
20%
40%
60%
80%
Int.Fixation Hemiarthroplasty Total Hip Repl
Figure 19. Surgical preference given to internal fixation
Hospital N
0%
20%
40%
60%
80%
Int.Fixation Hemiarthroplasty Total Hip Repl
Figure 20. Surgical preference given to hemiarthroplasty
Hospital S
0%
20%
40%
60%
80%
Int.Fixation Hemiarthroplasty Total Hip Repl
Figure 21. Surgical preference given to types other than hemiarthroplasty

27
6. QUESTIONS FOR THE FUTURE This study is intended to encourage clinicians to investigate sources of variation in health care quality by providing accurate and unbiased information on clinical outcomes. The findings might raise some questions and initiate further discussion among orthopaedic surgeons regarding the following issues:
1. Given the observed regional variation in mortality for patients who suffer a fracture of the neck of femur, what can be done to improve the outcome?
2. How do New Zealand mortality rates compare with those reported from other
countries? 3. Are these patients given low priority for their surgery in our hospitals? Is this
appropriate? Can it be changed? 4. How frequently is the delay between injury and surgery a reflection of limited
resources? If so, can this be changed?
5. How can we encourage hospitals to ensure that the majority of patients who are medically stable undergo surgery within two days of fracture?
6. How do New Zealand rates of conservative treatment compare with those
reported internationally? 7. Why is there wide variation across New Zealand hospitals in the choice of
operative procedures in the management of fracture of the neck of femur? How does this affect outcomes?
Further studies may look at other aspects of management of the fracture of neck of femur, such as short and long-term outcomes (functional, quality of life, lifespan of the prosthesis, etc).

28
APPENDIX 1: DATA Data clean up The data processing included the following steps (see Figure 22)
Figure 22. Data processing
NMDS1 July 1999-
30 June 2000762,547 records
Procedure
Duplicates
Sample
Clean-Up
1
2
3
4
Filter5
Agency6 Private Hosp
Fracture7 Pathological
Age8 Age<65
Service Type9 Elective
HIPS22859 patients2916 events
yes
HIPS1272 patients357 events
no
HIPS33131 patients7997 events
NHI
10
11 12
29
1. Access the NMDS hospital data for the financial year 1999/2000. The extract was
performed in the first half of November 2000, and consisted of 762,547 records. The financial years 1997/98 and 1998/99 were used for the estimation of RAMI.
2. Run the AN-DRG grouper software version 3.1 against the data with output to
database including the CCL (complication comorbidity level) field. The AN-DRG grouper classifies health care events into a number of categories that are characterised by both clinical homogeneity and a similar resource use. The CCL is a field calculated and output by the grouper as a result of evaluation of secondary diagnoses against the CC list.
3. Run the WIES5A software against the data with output to a database including the
CCL field. The WIES5S application performs conversion into Victorian DRGs and cost weights.
4. Run the Data Clean-up software against the data, excluding fatal duplicates, i.e.
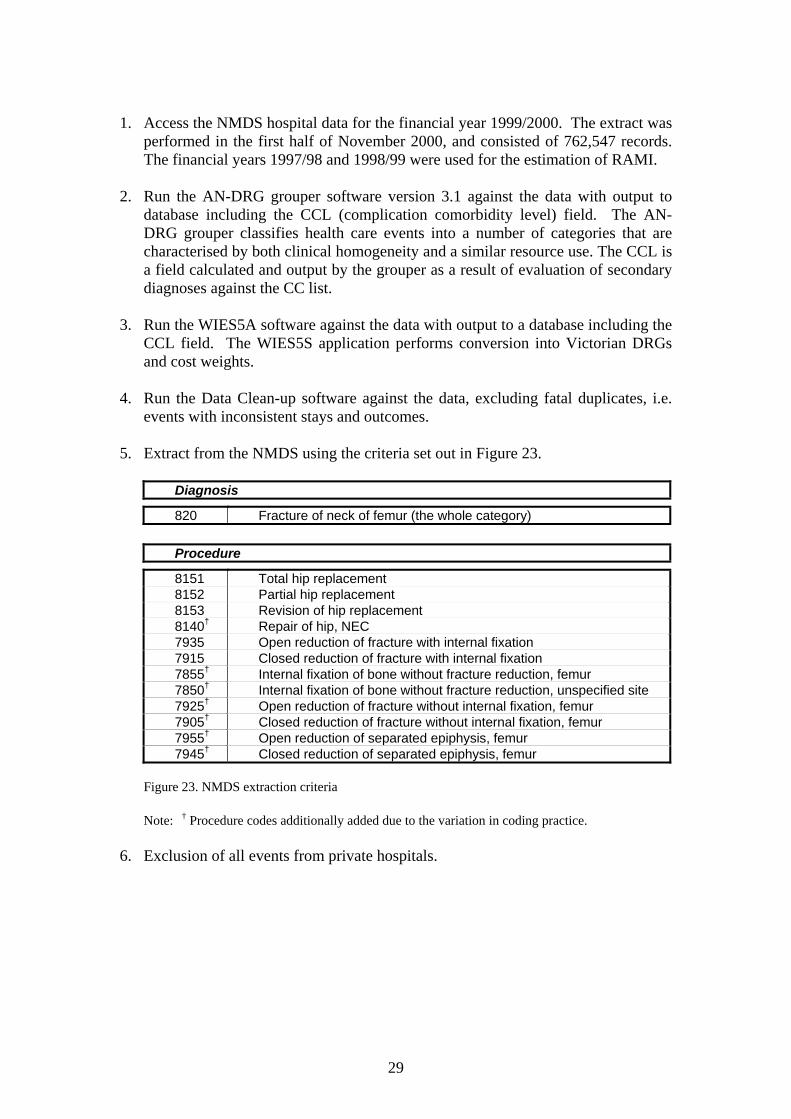
events with inconsistent stays and outcomes. 5. Extract from the NMDS using the criteria set out in Figure 23.
Diagnosis
820 Fracture of neck of femur (the whole category)
Procedure
8151 Total hip replacement 8152 Partial hip replacement 8153 Revision of hip replacement 8140† Repair of hip, NEC 7935 Open reduction of fracture with internal fixation 7915 Closed reduction of fracture with internal fixation 7855† Internal fixation of bone without fracture reduction, femur 7850† Internal fixation of bone without fracture reduction, unspecified site 7925† Open reduction of fracture without internal fixation, femur 7905† Closed reduction of fracture without internal fixation, femur 7955† Open reduction of separated epiphysis, femur 7945† Closed reduction of separated epiphysis, femur
Figure 23. NMDS extraction criteria
Note: † Procedure codes additionally added due to the variation in coding practice.
6. Exclusion of all events from private hospitals.
30
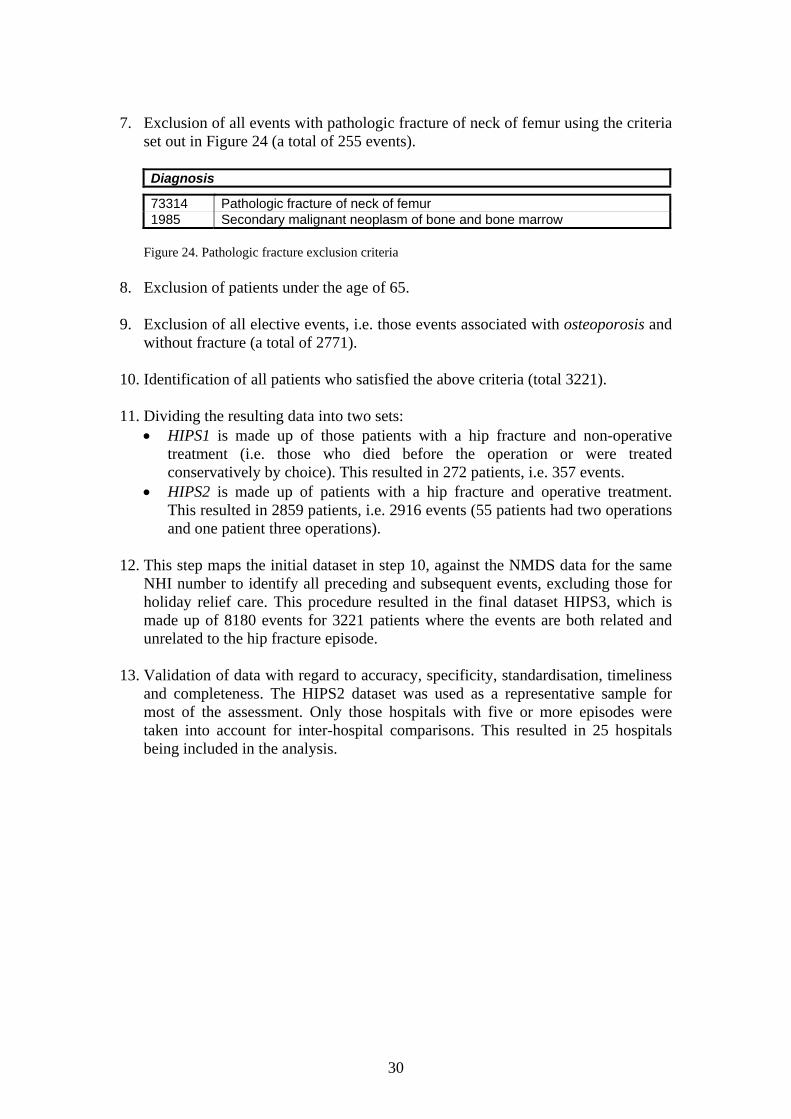
7. Exclusion of all events with pathologic fracture of neck of femur using the criteria
set out in Figure 24 (a total of 255 events).
Diagnosis
73314 Pathologic fracture of neck of femur 1985 Secondary malignant neoplasm of bone and bone marrow
Figure 24. Pathologic fracture exclusion criteria
8. Exclusion of patients under the age of 65. 9. Exclusion of all elective events, i.e. those events associated with osteoporosis and
without fracture (a total of 2771). 10. Identification of all patients who satisfied the above criteria (total 3221). 11. Dividing the resulting data into two sets:
• HIPS1 is made up of those patients with a hip fracture and non-operative treatment (i.e. those who died before the operation or were treated conservatively by choice). This resulted in 272 patients, i.e. 357 events.
• HIPS2 is made up of patients with a hip fracture and operative treatment. This resulted in 2859 patients, i.e. 2916 events (55 patients had two operations and one patient three operations).
12. This step maps the initial dataset in step 10, against the NMDS data for the same
NHI number to identify all preceding and subsequent events, excluding those for holiday relief care. This procedure resulted in the final dataset HIPS3, which is made up of 8180 events for 3221 patients where the events are both related and unrelated to the hip fracture episode.
13. Validation of data with regard to accuracy, specificity, standardisation, timeliness
and completeness. The HIPS2 dataset was used as a representative sample for most of the assessment. Only those hospitals with five or more episodes were taken into account for inter-hospital comparisons. This resulted in 25 hospitals being included in the analysis.

31
Data validation
The NMDS data reconciliation process NZHIS provides reports with the number of discharges per month for each facility. Hospitals are asked to reconcile these reports with their own information from patient management systems. If there are discrepancies, unit record data is provided to hospitals to enable a record-by-record comparison. NZHIS works with hospitals to delete or modify records that they identify as errors.
Events with inconsistent stays and outcomes An algorithm designed to detect events with inconsistent stays and outcomes is applied to the NMDS. There were three out of 2916 records (0.1%) modified within the HIPS2 dataset.
Edit checks This technique is used for the purpose of the internal audit of data. Each clinical code found in a record is checked against the appropriate edit flags within the Clinical Code Table: gender, low age, high age, acceptable cause of death, normal New Zealand morbidity, late effect and injury/external cause. There were 18 warnings raised (0.6%), however none of these were recognised as fatal errors (i.e. needed to be removed).
Semantics analysis of descriptions The semantic analysis of descriptions identifies the meaning of terms in the context of the other terms. It can distinguish a specific condition, its certain type or nature, anatomical site, or a procedure and how that procedure is performed. A total of 13 errors were identified (0.4%). These were mostly related to postoperative complications and comorbidities.
ACS checks Accurate coding of diagnoses and procedures in relation to the Australian Coding Standards, in particular principal diagnosis, is essential for adequate reporting. The standards are addressed with scope definitions including existing and non-existing diagnosis and procedure codes expected to be found in health event records, as well as specific terms within descriptions. When the program reads each record, comparisons are made across all codes with any appropriate warnings provided in program output. There were 10 warnings (0.3%). These events were adjusted accordingly.
32
The assessment of data quality
Accuracy The NZHIS Audit Team did not identify any mismatch between assigned procedure codes and procedures performed during the timeframe. There is the chance that some errors could occur during data entry, however the filtering method (both diagnosis and procedure code, plus external cause) as well as tracking patients through episodes, should eliminate such errors. Finally, an insignificant number of duplicates and incorrect codes were detected.
Specificity There are several potential problems associated with the specificity of the data. These are outlined below.
• Common assignment of unspecified codes although specific information within the medical record is available.
• Coders lack knowledge in regard to the medical terminology. • ‘Teething’ problems during the introduction of the new classification system
(ICD-10-AM). • Backwards mapping issues from the ICD-10 into the ICD-9 (e.g. internal
fixation of fracture of trochanteric, subcapital or femoral condyle is mapped back to unspecified internal fixation of femur).
Standardisation More than 99% of records comply with the ACS 13 Musculoskeletal system and connective tissue specialty category.
Timeliness The data used is the November 2000 NMDS extract, which was the most recently available data at the time this analysis was performed.
Completeness The NMDS is a “live” database. According to the NMDS reconciliation, at the moment of data extract, only 0.01% to 0.10% of records were different between hospital systems and the NMDS. It is unlikely a significant number of hip fracture events were affected.

33
APPENDIX 2: ADDITIONAL MORTALITY STATISTICS The figures presented are for the 1999/2000 year, unless otherwise stated. The figures denote an approximately 6 month mortality rate. Inj Death time
in days Number
died Percent Cumulative Number
Cumulative Percent
0 3 0.5% 3 0.5% 1 16 2.7% 19 3.2% 2 20 3.3% 39 6.5% 3 21 3.5% 60 9.9% 4 15 2.5% 75 12.4% 5 15 2.5% 90 14.9% 6 7 1.2% 97 16.1% 7 9 1.5% 106 17.6%
30 (1 month) 247 40.9% 90 (3 months) 430 71.2%
180 (6 months) 528 87.4% 364 (12 months) 604 100.0%
Figure 25. Injury-death time Died Alive
Median 86 83Average 85.3 82.3
Age
Standard deviation 7.4 7.2
Number of patients 604 2527 Figure 26. Patient age Died Alive Total Mortality
Males 199 537 736 27.0% Females 405 1990 2395 16.9%
Number of patients 604 2527 3131 19.3% Figure 27. Patient gender Males Females
Median 84 87Average 83.4 86.3
Age
Standard deviation 7.3 7.2
Number of patients 199 405 Figure 28. Age and gender of patients who died

34
APPENDIX 3: SURVIVAL ANALYSIS Survival analysis refers to the technique used to analyse the time from the hip fracture to a certain cut-off date or eventual patient death. The New Zealand Mortality Register data were searched to record community deaths. For the purpose of this analysis, the cut-off date was set as 1 April 2001 (see Figure 29).
Surgery?
Hips 1272
patients
1 July 1999
Injury
Surgery?
Hips 22859
patients
Injury
No (28)
No (244)
Conservativetreatments
DiedHospital
70
DiedCommunity
19
DiedHospital
322
DiedCommunity
193
1 July 2000
Died26
1 April 2001Alive157
Died310
Alive2034
Surgicaltreatments
Yes
Figure 29. Follow-up of patients with hip fractures in 1999/2000

35
Method The estimation of patient survival is complicated by the difficulty in following patients after they leave the hospital. The statistical method of censoring was used to account for patients entering the sample group at different times, and for our inability to follow some patients up to termination of the study. The survival time is estimated using the life table method by classifying individual survival times into monthly intervals. The basic measures are observed and relative survival rates. It is also possible to estimate cause-specific survival, however it would be very difficult to distinguish between deaths due to hip fractures and other competing risks. The observed survival rate is the proportion of patients who would survive a certain period of time following hip fracture in the situation where the injury or its consequence was the only possible cause of death. The relative survival rate is defined as the observed survival divided by the expected survival of a comparable group from the general population on the basis of age, gender and calendar time. Hence the relative survival rate is a measure of the excess mortality of the patients in the presence of the competing risks. Results
I (months)
L D W P CP (observed)
CP* (expected)
CR (relative)
2*seCR
0-1 272 62 0 0.77206 0.77206 0.99022 0.77968 0.05137 1-2 210 10 0 0.95238 0.73529 0.98058 0.74985 0.05456 2-3 200 2 0 0.99000 0.72794 0.97108 0.74962 0.05557 3-4 198 6 0 0.96970 0.70588 0.96171 0.73399 0.05746 4-5 192 10 0 0.94792 0.66912 0.95247 0.70251 0.05991 5-6 182 2 0 0.98901 0.66176 0.94335 0.70150 0.06082 6-7 180 1 0 0.99444 0.65809 0.93436 0.70432 0.06156 7-8 179 1 0 0.99441 0.65441 0.92550 0.70709 0.06231 8-9 178 4 0 0.97753 0.63971 0.91675 0.69780 0.06351 9-10 174 4 14 0.97605 0.62438 0.90810 0.68757 0.06476 10-11 156 2 11 0.98671 0.61609 0.89948 0.68493 0.06580 11-12 143 2 13 0.98535 0.60706 0.89093 0.68138 0.06698 Figure 30. Survival analysis – patients treated non-surgically

36
I
(months) L D W P CP
(observed)CP*
(expected)CR
(relative) 2*seCR
0-1 2859 190 0 0.93354 0.93354 0.99081 0.94221 0.00940 1-2 2669 126 0 0.95279 0.88947 0.98175 0.90601 0.01195 2-3 2543 70 0 0.97247 0.86499 0.97283 0.88915 0.01314 3-4 2473 65 0 0.97372 0.84225 0.96404 0.87367 0.01414 4-5 2408 41 0 0.98297 0.82791 0.95537 0.86659 0.01478 5-6 2367 36 0 0.98479 0.81532 0.94684 0.86110 0.01533 6-7 2331 29 0 0.98756 0.80518 0.93843 0.85800 0.01579 7-8 2302 32 0 0.98610 0.79398 0.93013 0.85363 0.01626 8-9 2270 34 0 0.98502 0.78209 0.92195 0.84830 0.01675 9-10 2236 39 131 0.98203 0.76804 0.91388 0.84041 0.01730 10-11 2066 38 176 0.98079 0.75328 0.90591 0.83152 0.01789 11-12 1852 26 166 0.98530 0.74221 0.89802 0.82649 0.01842 Figure 31. Survival analysis – patients treated surgically Note: Columns in Figures 29-30 denote the following:
I Life table time interval L Number of patients alive at the beginning of interval D Number of deaths at the time interval W Number of withdrawals at the time interval P Interval-specific observed survival rate CP Cumulative observed survival rate CP* Cumulative expected survival rate (Hakulinen method) CR Cumulative relative survival rate corresponding to CP* 2*seCR 2 * standard error of CR (95% confidence limits)
The program used for the relative survival analysis was SURV3 (version 3.00, August 2000) developed at the Finnish Cancer Registry by Voutilainen ET, Dickman PW and Hakulinen T. The general population mortality file including life tables with expected number of years of life remaining at certain age the expectation of deaths within the year for each gender and calendar period was provided by the NZ Statistics.

37
APPENDIX 4. REGRESSION ANALYSIS Causes of mortality It is not the injury itself that is responsible for the high mortality rate, rather the complications associated with other risk factors such as patient’s age and gender, as well as complications and co-morbidities. Figure 32 presents the main cardiac and respiratory complications associated with death as an outcome. Top 10 Cardiac Complications Top 10 Respiratory Complications ICD Description ICD Description
4280 Congestive heart failure 486 Pneumonia, organism unspecified
42731 Atrial fibrillation 9973 Respiratory complications, not elsewhere classified
41091 Acute myocardial infarction of unspecified site, initial care episode
496 Chronic airway obstruction, not elsewhere classified
4275 Cardiac arrest 5070 Pneumonitis due to inhalation of food or vomitus
4281 Left heart failure 51881 Respiratory failure
41071 Subendocardial infarction, initial episode of care 485 Bronchopneumonia,
organism unspecified
9971 Cardiac complications, not elsewhere classified 49121 Obstructive chronic bronchitis
with acute exacerbation
41041 Acute myocardial infarction of other inferior wall, initial care episode
49390 Asthma, unspecified, without mention of status asthmaticus
41011 Acute myocardial infarction of other anterior wall, initial care episode
5180 Pulmonary collapse
4111 Intermediate coronary syndrome 41511 Iatrogenic pulmonary embolism and infarction
Figure 32. Cardiac and respiratory complications Other conditions associated with death, but not in the above table, include renal failure, urinary tract infection, septicaemia, cerebral and peripheral vascular complications. However, at an aggregated level, the most frequent conditions among all complications were heart failure, myocardial infarction and cardiac dysrhythmia. It should be noted that complications were evaluated on the basis of the first five ICD-9-CM’s diagnosis codes and co-morbidity annotation criteria. Any of these conditions cannot be considered as the underlying cause of death, unless confirmed as such by a clinician (i.e. death certificate). Also the coding information does not allow a broad picture of the patient’s state of health pre-operatively in terms of problems such as limited access to General Practitioner services, neglect and malnutrition.
38
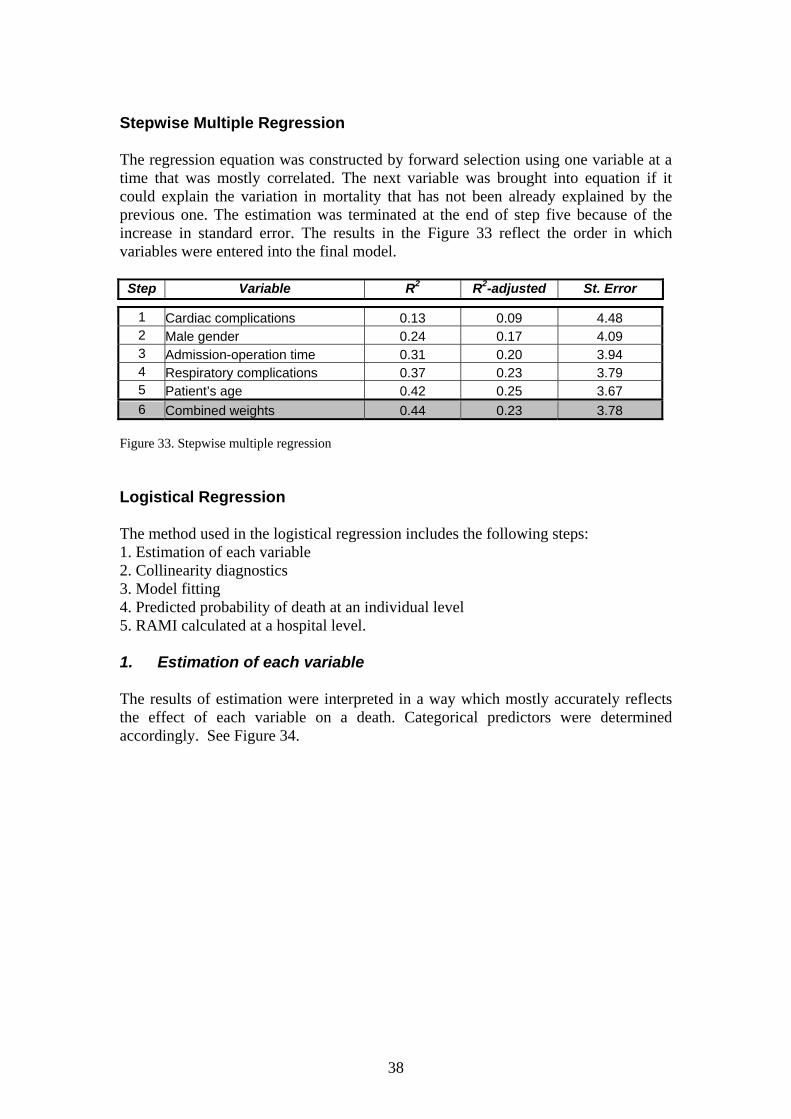
Stepwise Multiple Regression The regression equation was constructed by forward selection using one variable at a time that was mostly correlated. The next variable was brought into equation if it could explain the variation in mortality that has not been already explained by the previous one. The estimation was terminated at the end of step five because of the increase in standard error. The results in the Figure 33 reflect the order in which variables were entered into the final model.
Step Variable R2 R2-adjusted St. Error
1 Cardiac complications 0.13 0.09 4.48 2 Male gender 0.24 0.17 4.09 3 Admission-operation time 0.31 0.20 3.94 4 Respiratory complications 0.37 0.23 3.79 5 Patient’s age 0.42 0.25 3.67 6 Combined weights 0.44 0.23 3.78
Figure 33. Stepwise multiple regression Logistical Regression The method used in the logistical regression includes the following steps: 1. Estimation of each variable 2. Collinearity diagnostics 3. Model fitting 4. Predicted probability of death at an individual level 5. RAMI calculated at a hospital level. 1. Estimation of each variable The results of estimation were interpreted in a way which mostly accurately reflects the effect of each variable on a death. Categorical predictors were determined accordingly. See Figure 34.

39
Field
Name Description Type Width Dec Value
1 FTYPE Fracture type Numeric 1 0 0 = unspecified 1 = cervical 2 = trochanteric
2 OTYPE Operation type Numeric 1 0 0 = fixation & reduction 1 = hip replacement
3 SEX Gender Numeric 1 0 0 = female 1 = male
4 AGE Age Numeric 1 0
1 = 65-74 years 2 = 75-84 years 3 = 85-94 years 4 = 95+ years
5 CCL Complication Comorbidity Levels Numeric 1 0 0 = levels 0-3
1 = level 4
6 ETHN Ethnicity Numeric 1 0 0 = other 1 = Maori/Pacific
7 NZDEP NZ Deprivation Index Numeric 1 0 0 = up to 1032 1 = 1032+ (upper quartile)
8 COMBW Combined weights Numeric 1 0 0 = up to 1 1 = 1+ (DRG average)
9 TIMEAO Admission-operation time Numeric 1 0
1 = 0 days 2 = 1 day 3 = 2 days 4 = 3+ days
10 CARD Cardiac complication Numeric 1 0 0 = no 1 = yes
11 RESP Respiratory complication Numeric 1 0 0 = no
1 = yes
12 DIED Died in the hospital Numeric 1 0 0 = no 1 = yes
Figure 34. Variables used for logistic regression 2. Collinearity diagnostics The assessment of collinearity was performed by regressing each variable on all other independent variables. No significant multicollinearity was found using the multivariate approach (i.e. condition index more than 15 and proportion of variation more than 0.50). The results showed that variables could be classified into four groups (see Figure 35):
• age and gender factors influence all others, • severity, complexity and complication factors are the main cause of death, • delay in time to surgery is associated with the above factors, • ethnicity and social deprivation have little impact.

40
Figure 35. Correlation between variables 3. Model fitting Consequently, four models were produced with the combinations of variables.
Variables Model
Age Gender CCL Card/Resp Compl
1 ∗ ∗ 2 ∗ ∗ ∗ 3 ∗ ∗ ∗ 4 ∗ ∗ ∗ ∗
Figure 36. Combinations of variables for the model fitting The prediction ability of the models was assessed by looking at the association of predicted probabilities and observed responses, i.e. the higher the percentage of concordant pairs and the higher the c-value, the greater the prediction ability of the model (see Figure 37 below).
Model Concordant percent
C-value
1 77.1% 0.828 2 85.2% 0.868 3 79.4% 0.839 4 85.9% 0.871
Figure 37. Association of predicted probabilities and observed responses According to the results, models 3 and 4 had a higher concordant percent and c-value than models 1 and 2. The inclusion of the gender variable may increase the predicating ability of the model to some extent, however it is not significant in model 4.

41
Due to concerns regarding the inclusion of cardiac and respiratory complications as predictors within model 4, and the fairly good predictive ability and simplicity of model 3, the latter was used as the best model for predicting the probability of death. The following regression equation obtained from the best model was used to predicting odds of death at an individual level:
Y = -5.399 + 0.339*AGE + 0.459*SEX + 2.737*CCL 4. Predicted probability of death at an individual level The probability of death was calculated on the basis of formula: Predicted probability = exp(Y) / (1+exp(Y)) where the exponent(Y) corresponds to predicted odds.
RAMI Hospital 1997/98 1998/99 1999/00
A 1.60 1.66 1.61 B 0.00 3.08* 0.58 C 0.00 0.00 0.65 D 1.21 1.29 1.60 E 0.00 1.42 1.40 F 1.42 0.93 0.28 G 1.27 1.45 1.85 H 0.34 0.83 1.08 I 0.38 1.21 0.90 J 1.12 0.69 0.86 K 0.91 0.68 0.24 L 0.79 0.63 0.73 M 1.07 0.00 1.16 N 1.11 1.33 1.01 O 1.44 1.13 0.85 P 0.00 0.00 0.00 Q 1.99 0.52 2.34** R 0.99 0.72 1.33 S 1.00 1.03 1.08 T 0.68 0.76 1.60 U 1.09 0.00 1.51 V 0.00 0.00 0.00 W 0.00 0.00 0.00
Figure 38. RAMI over time Note: * p-value less than 0.01 ** p-value less than 0.05

42
APPENDIX 5: ACCESS TO SERVICE STATISTICS
Time (days)
Event No
Percent Cumulative Number
Cumulative Percent
0 2325 79.73% 2325 79.73%1 200 6.86% 2525 86.59%2 50 1.71% 2575 88.30%3 25 0.86% 2600 89.17%4 11 0.38% 2611 89.54%5 16 0.55% 2627 90.09%6 10 0.34% 2637 90.43%7 11 0.38% 2648 90.81%
Total 2648 90.81% 2648 90.81% Figure 39. Injury to admission time
Time (days)
Event No Percent Cumulative
Number Cumulative
Percent
0 785 26.92% 785 26.90%1 1356 46.50% 2141 73.40%2 456 15.64% 2597 89.10%3 151 5.18% 2748 94.20%4 60 2.06% 2808 96.30%5 29 0.99% 2837 97.30%6 22 0.75% 2859 98.00%7 18 0.62% 2877 98.70%8 9 0.31% 2886 99.00%9 5 0.17% 2891 99.10%
10 8 0.27% 2899 99.40%11 4 0.14% 2903 99.60%12 2 0.07% 2905 99.60%13 2 0.07% 2907 99.70%14 3 0.10% 2910 99.80%15 2 0.07% 2912 99.90%18 2 0.07% 2914 99.90%19 1 0.03% 2915 100.00%28 1 0.03% 2916 100.00%
Figure 40. Admission to operation time
43
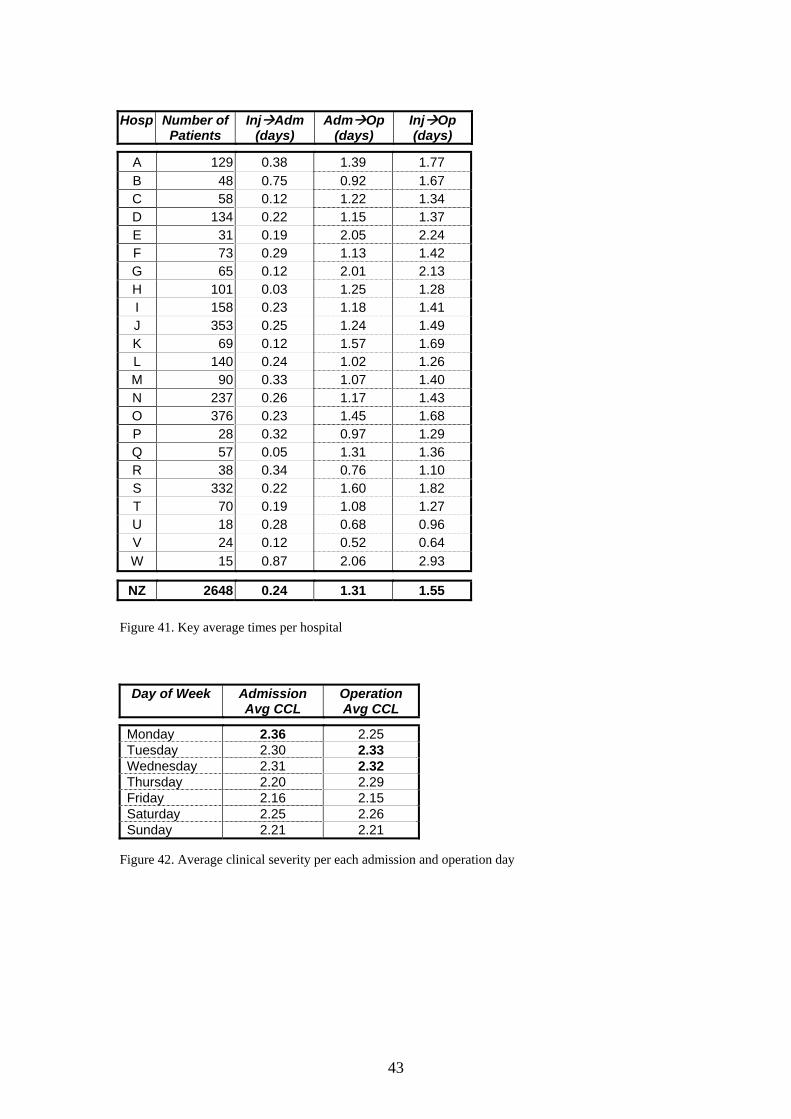
Hosp Number of
Patients Inj Adm
(days) Adm Op
(days) Inj Op (days)
A 129 0.38 1.39 1.77 B 48 0.75 0.92 1.67 C 58 0.12 1.22 1.34 D 134 0.22 1.15 1.37 E 31 0.19 2.05 2.24 F 73 0.29 1.13 1.42 G 65 0.12 2.01 2.13 H 101 0.03 1.25 1.28 I 158 0.23 1.18 1.41 J 353 0.25 1.24 1.49 K 69 0.12 1.57 1.69 L 140 0.24 1.02 1.26 M 90 0.33 1.07 1.40 N 237 0.26 1.17 1.43 O 376 0.23 1.45 1.68 P 28 0.32 0.97 1.29 Q 57 0.05 1.31 1.36 R 38 0.34 0.76 1.10 S 332 0.22 1.60 1.82 T 70 0.19 1.08 1.27 U 18 0.28 0.68 0.96 V 24 0.12 0.52 0.64 W 15 0.87 2.06 2.93
NZ 2648 0.24 1.31 1.55 Figure 41. Key average times per hospital
Day of Week Admission Avg CCL
Operation Avg CCL
Monday 2.36 2.25 Tuesday 2.30 2.33 Wednesday 2.31 2.32 Thursday 2.20 2.29 Friday 2.16 2.15 Saturday 2.25 2.26 Sunday 2.21 2.21
Figure 42. Average clinical severity per each admission and operation day

44
Admission – Operation Time Days 0 1 2 3+
Deaths/Total Patients
26/630 37/1095 13/378 10/222
0 Mortality
4.1% 3.4% 3.4% 4.5%
Deaths/Total Patients
5/84 3/66 2/32 3/18
1 Mortality
6.0% 4.5% 6.3% 16.7%
Deaths/Total Patients
1/62 5/133 2/35 1/44
Inju
ry –
Adm
issi
on T
ime
2+ Mortality
1.6% 3.8% 5.7% 2.3%
Figure 43. Impact of key times on mortality Note: Some people sustained their injury after admission to hospital (i.e. Injury – admission time is <0). These people have been removed from this analysis.
Injury-Operation Time Episode 0-2 Days 2+ Days
Deaths/Total Patients
86/2304 24/526
Initial Mortality
3.73% 4.56%
Deaths/Total Patients
155/2218 53/502
Subsequent Mortality
6.99% 10.56%
Deaths/Total Patients
150/2063 39/449
Community Mortality
7.27% 8.69%
Deaths/Total Patients
391/2304 116/526
Total Mortality
16.97% 22.05%
Figure 44. Relationship between delay in time to surgery and mortality Note: Twenty nine episodes were removed from this analysis due to an incorrect injury date.

45
APPENDIX 6: CLINICAL PRACTICE METHODS Treatment options Top 20 Complications ICD Description
4019 Essential hypertension 4280 Congestive heart failure 42731 Atrial fibrillation 2949 Chronic organic psychotic condition 4149 Chronic ischaemic heart disease 5990 Urinary tract infection 496 Chronic airway obstruction 25000 Diabetes mellitus without complication (NIDDM type) 486 Pneumonia 4241 Aortic valve disorders 34290 Hemiplegia 78830 Urinary incontinence 73300 Osteoporosis 3899 Unspecified hearing loss 3310 Alzheimer's disease 438 Late effects of cerebrovascular disease 41091 Acute myocardial infarction, unspec site, initial episode 2900 Senile dementia, uncomplicated 2859 Anaemia 2939 Transient organic mental disorder
Figure 45. The most common complications in patients treated conservatively
Observed/Crude Survival Fracture Type 1 Month 6 Months 12 Months
Cervical 66.7% 58.3% 55.5% Trochanteric 87.3% 73.3% 66.3% Unspecified 62.0% 56.0% 51.5%
Total 77.2% 66.2% 60.7%
Relative Survival Fracture Type 1 Month 6 Months 12 Months
Cervical 67.3% 61.6% 61.8% Trochanteric 88.2% 77.7% 74.3% Unspecified 62.7% 59.9% 58.9%
Total 78.0% 70.2% 68.1% Figure 46. Observed and relative survival in patients treated conservatively Note: The relative survival is the observed survival divided by the expected survival of a comparable group from the general population.
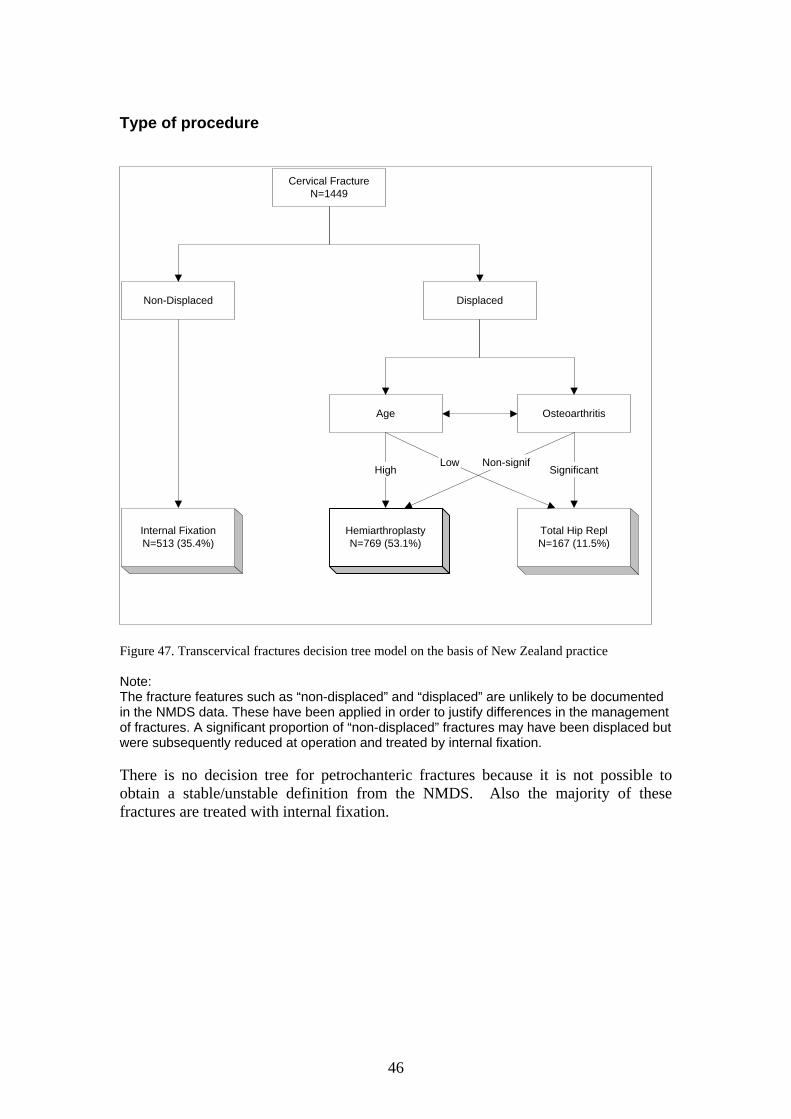
46
Type of procedure
Figure 47. Transcervical fractures decision tree model on the basis of New Zealand practice Note: The fracture features such as “non-displaced” and “displaced” are unlikely to be documented in the NMDS data. These have been applied in order to justify differences in the management of fractures. A significant proportion of “non-displaced” fractures may have been displaced but were subsequently reduced at operation and treated by internal fixation. There is no decision tree for petrochanteric fractures because it is not possible to obtain a stable/unstable definition from the NMDS. Also the majority of these fractures are treated with internal fixation.
Cervical FractureN=1449
Non-Displaced Displaced
Age Osteoarthritis
HemiarthroplastyN=769 (53.1%)
Total Hip ReplN=167 (11.5%)
HighLow Non-signif
Significant
Internal FixationN=513 (35.4%)

47
APPENDIX 7: DEFINITIONS Orthopaedic terms See Figure 48 for details:
• Transcervical fracture – is a fracture through the femoral neck.
• Trochanteric fracture – is a fracture between the greater and lesser trochanter.
• Greater trochanter – is a large prominence at the proximal end of the shaft of the femur.
• Lesser trochanter – is a prominence on the shaft of femur below the neck.
• Closed fracture – is a break in the bone that does not protrude through the skin.
• Open fracture – is a break in which the skin has been damaged at the time of injury allowing contact with the broken bone.
Figure 48. Hip fracture diagram
Greatertrochanter
Lessertrochanter
HeadTranscervical
fractures
Pertrochanteric
fractures

48
Hip fracture codes The following ICD-9-CM codes could be assigned to fracture of neck of femur: 820.0*
Transcervical fracture, closed
.00 – Intracapsular section, unspecified .01 – Epiphysis (separation)(upper), Transepiphyseal .02 – Midcervical, Transcervical .03 – Base of neck, Cervicotrochanteric .09 – Other, Head of femur, Subcapital
820.1*
Transcervical fracture, open
.10 – Intracapsular section, unspecified .11 – Epiphysis (separation)(upper) .12 – Midcervical .13 – Base of neck .19 – Other
820.2*
Pertrochanteric fracture, closed
.20 – Trochanteric section, unspecified, Trochanter greater/lesser .21 – Intertrochanteric section .22 – Subtrochanteric section
820.3*
Pertrochanteric fracture, open
.30 – Trochanteric section, unspecified .31 – Intertrochanteric section .32 – Subtrochanteric section
820.8
Unspecified part of neck of femur, closed
820.9
Unspecified part of neck of femur, open