fpwg consultation on the draft nfp plan of action monitoring report overview of progress and needs...
TRANSCRIPT
FPWG Consultation on the draft NFP Plan of Action Monitoring Report
Overview of progress and needs for further action in selected areas of intervention (AoIs) NFP Objective 3 Adequate nutrition for all individuals, especially mothers and children
Lalita Bhattacharjee, Nutritionist
6 December 2009

Long term planning for balanced food AoI # 3.1
Policy targets Indicators Past status Current MT/LT Target
1. Consistent physical growth targets established.
1983-84 2002 2006-07
BNNC: NCHS standard BINP: NCHS standard
NNP: WHO New Child Growth Standards (2006) finalized by NNP and being used 1
Achieved
2. Per capita calorie requirements for different age groups for balanced nutrition determined
1985 1998 2008 In progress
FAO/WHO/UNU INFS
BIDS/WFP
3. RDA for energy and other nutrients for different age groups determined
FAO/WHO/UNU/ ICMR
INFS, ICMR INFS; ICMR; BIDS/WFP
4. National food composition table produced
1977 1979
1988 2009
Long-term targets for physical growth established; Standard food intake established for different population groups; Integrated plan for attaining standard food intake targets established.
INFS
IPHN
HKI/WFP
INFS working on more updated information and coverage of foods , including ethnic foods
Updated FCT with more coverage, including ethnic foods
Source: see Consolidated Monitoring Indicators Matrix in Appendix
1 Hoque AM (2006) Shishur Shastya Card, National Nutrition Programme (NNP).

1.Progress towards policy targetsEstablishing consistent physical growth targets
Current growth charts developed by NNP, MoHFW adapting new WHO Standards in 2006
Determining per capita calorie requirements & age specific RDA for energy and other nutrients
Normative recommendations proposed by FAO/WHO (2001) and RDA of ICMR (2004) are being used in Bangladesh
Task Force set up by GoB in 6/2005 under chairmanship of DG,FPMU to review issues related to food and energy requirement and provide recommendations on per capita daily food intake requirement;
National Food Composition Tables (FCT)
Comprehensive FCT compiled in 1988 (INFS/WFP/HKI) using INFS and NIN data

2. Recent policy development/actions underway
MoFDM/WFP MoU in 2007 -08 study by BIDS/WFP with NFPCSP technical support estimated energy requirements comparable with FAO/WHO/UNU for males ( 2755 vs 2780 kcal), lower for females( 1888 vs 2235 kcal)
Expert Consultation held in 2007 to develop national food basket for balanced nutrition, initiated by FPMU/MoFDM, BAN-HRDB/MoA and experts from 22 national and international agencies;
Arrived at national average calorie requirement 2350 kcal – needs further validation through research
Institutions working on FCT: INFS, ICDDR,B; INFS updating/developing FCT database with new and old data;
INFS analyzing 50 ethnic and indigenous foods with NFPCSP support
3.Needs for further action
Defining long term targets for physical growth and nutrition
Determining per capita consumption of cereals and other foods
Determining RDA Developing/updating FCT Monitoring impacts of food based nutrition
interventions Strengthening GMP

Balanced and nutritious food for vulnerable groups
(AoI # 3.2) Policy targets Indicators Past status Current Target
FY04-05 FY05-06 FY06-07 FY07-08 Increased availability through local production of low cost foods for balanced nutrition; See also indicators under Section III.1 and V.4 (Agricultural diversification)
1. Per capita net production of pulses (Kg/capita/annum)
2,25 1,95 1,74 1,36
2002 2005 2008 2009 2010
2. # women covered by VGD (fortified atta)
12,723 247,437 231,538 231,538 231,538
FY01-02 FY05-06 FY07-08 FY09-10 3. # women covered by VGD (including atta)
450,000 750,000 750,000 750,000
2002 2004 2008 4. # children covered by FFE
1.06 m 1.2 m 0.694 m -
1991 1998 2006 2009
Poor, distressed and vulnerable women and children (including those from monga areas) effectively covered by food based nutrition programmes and growth monitoring and promotion (GMP) programmes.
5. Low cost diet chart from local ingredients for balanced food INFS INFS
BAN-HRDB/NNP/BNNC
Available

1. Progress towards policy targets
Availability of variety of low cost foods:
Decline in pulse production and consumption (14g/d) and likewise sweet potato => protein and beta carotene gaps in diet;
Price differentials between rice and non rice foods - a source of dietary imbalance; !!! price hike led to rise in the share of rice to total food expenditure (45-50%)
Coverage of food based nutrition programmes:
National level data NA; VGD coverage ↑ 450,000 in 2001-02 to 750,000 in 2005-06, remained
same 2009; # children in FFE ↑ from 1.06 M in 2002 to 1.20 M in 2004 but ↓to
0.694 M in 2008
Development of low cost diet chart from local ingredients for balanced diet: INFS ( 1991, modified in 1998; Charts produced by BAN-HRDB, BNNC, NNP,
being used in community nutrition programmes (CNP), GMP integral part of CNP

2. Recent policy developments underway
Revised National Agriculture Policy ( 2009) calls for enhanced crop diversification to improve availability of non rice food crops
Interventions underway AoI # 1.4 (Agricultural diversification)
3. Needs for further action
Balance in crop diversification strategy to ensure availability of low cost nutritious foods current emphasis on high value profitable crops; decline in
sweet potato production in favour of potato In the context of food price inflation, promoting potato
production & consumption can address cereal deficitsPromoting the production and demand for healthy rice varieties
(BR 16, BR 25)Promote integrated home gardening – integrated horticulture
development, backyard poultry and community fish pondsPromote food based strategies in agriculture sector interventions
and nutrition considerations in policies Improve FFE coverage and scaling up food supplementation
programmes for children 6 mo – 2 y (150 kcal/d)

Nutrition education on dietary diversification (AoI # 3.3)
Policy targets Indicators Past status Current Target 1998 2002 2005 Increased % of women educated in nutrition and primary health care activities through formal and non-formal education Increased home gardening and backyard poultry raising activities by poor households
1. % of poor households rearing home gardening and backyard poultry
60% (traditional
home gardens)
65.2% (completed
home gardens) 860,000 HH
47.2 n.a. na

1. Progress towards policy targets
No national level data on education and awareness of women in nutrition and PHC activities
↑ in adult literacy rate ( 18 % in 1981; 25.8% in 1991 and 40.8% in 2001);
Home gardening : National data ( 47.2% HG ) HKI - HG promotion since 1988, progress in 1998 -
2002, 65% completed HG Diversification of HG produce ( average 9.9
vegetable crops in 3 mo period; 65% sale among active HG households, provides
extra household income

2. Recent policy developments underway
Dietary diversification being promoted through NE
Training programmes implemented for DAE at various levels
NNP providing training to mothers of under 2s (modules on nutrition, health & hygiene, home gardening, poultry raising and income generation)

3. Needs for further action
Integrating FBDGs into NFP as a tool to inform agriculture, trade, health and nutrition policies
Strengthen NE interventions Improve coverage of ABCN under NNP areas
and piloting ABCN in urban areas Scaling up HG and dietary diversification
using women centered CB approaches in at least 2/3 HH at union levels, promoting SG

Food supplementation and fortification (AoI # 3.4)
Policy targets Indicators Past Status Current Target 1996 1999 2005 2015
1. HH coverage with adequately iodized salt (≥15 ppm)
54% 55% 51% 90%
1999-00 2004 2007 2015 2. Coverage of vitamin A supplementation (children 12-59 m)
73% 82% 88% 100% (UNICEF/WHO)
2002 2004 2008 2009 2010
Increased coverage of vitamin A and iron-folate supplementation, and adequately iodized salt; Increased coverage of food items for fortification with important micronutrients, e.g. vitamin A, iron and zinc
3. # of food processing units producing fortified food products (atta) 4 18 2 5 (total=29)
80% of food planned for distribution in fortified form
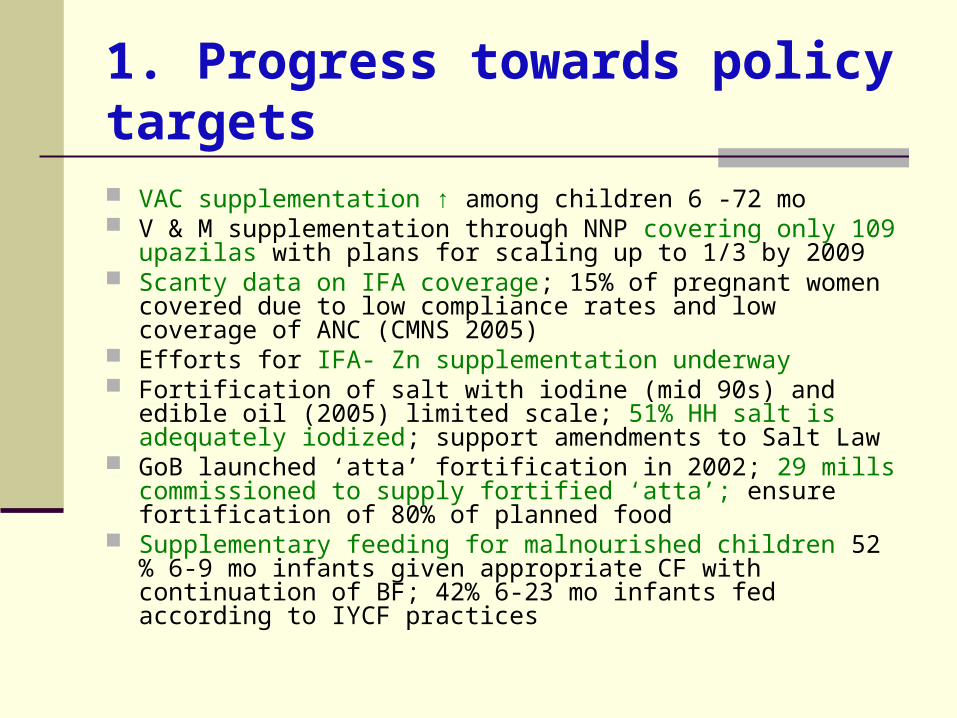
1. Progress towards policy targets
VAC supplementation ↑ among children 6 -72 mo V & M supplementation through NNP covering only 109 upazilas
with plans for scaling up to 1/3 by 2009 Scanty data on IFA coverage; 15% of pregnant women covered
due to low compliance rates and low coverage of ANC (CMNS 2005)
Efforts for IFA- Zn supplementation underway Fortification of salt with iodine (mid 90s) and edible oil (2005)
limited scale; 51% HH salt is adequately iodized; support amendments to Salt Law
GoB launched ‘atta’ fortification in 2002; 29 mills commissioned to supply fortified ‘atta’; ensure fortification of 80% of planned food
Supplementary feeding for malnourished children 52 % 6-9 mo infants given appropriate CF with continuation of BF; 42% 6-23 mo infants fed according to IYCF practices

Decline in nightblindness among under-5 children in Bangladesh, 1962-2006
4.13.6
1.78
10.6
0.3 0.2 0.2
00.5
11.5
22.5
33.5
44.5
1962-64
1982 1989 1995 1997 1999 2002 2005
Pe
rce
nt
Night blindness almost non existent, prevalence below 0.1% in 2006; Attributed to blend of actions VAC distribution with EPI and food basedstrategies VAD is still high, 30% among women and children
2. Policy developments/actions underway
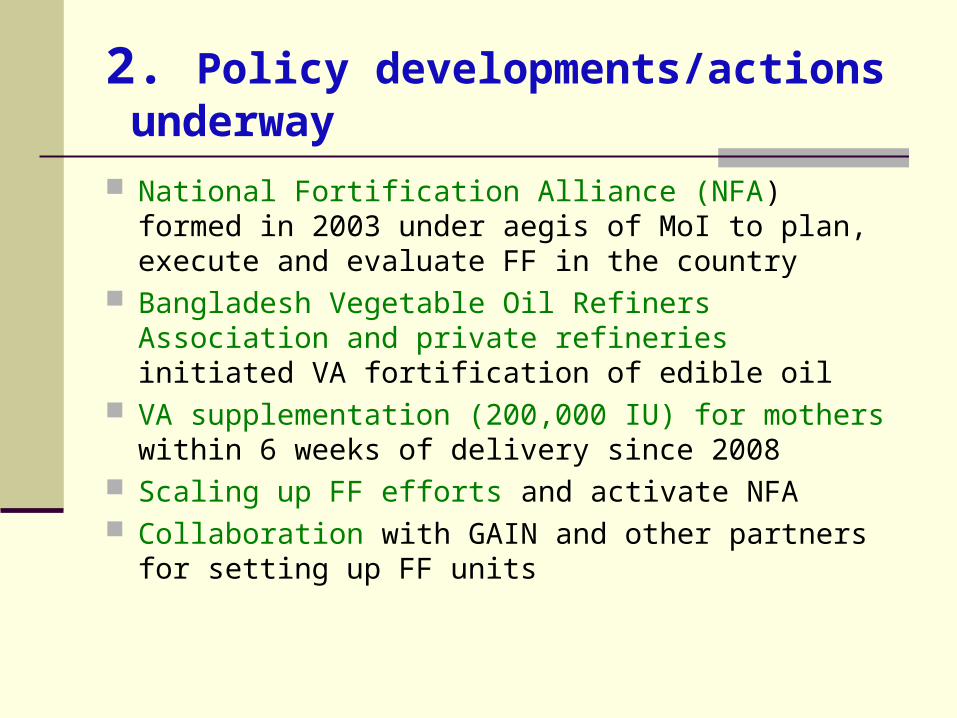
National Fortification Alliance (NFA) formed in 2003 under aegis of MoI to plan, execute and evaluate FF in the country
Bangladesh Vegetable Oil Refiners Association and private refineries initiated VA fortification of edible oil
VA supplementation (200,000 IU) for mothers within 6 weeks of delivery since 2008
Scaling up FF efforts and activate NFA Collaboration with GAIN and other partners for
setting up FF units

3. Needs for further action
Filling up monitoring data gaps regarding SFP coverage as well as IFA-Zn supplementation
IDD assessment to be included in MICS Improving coverage of SFP, IFA and VA prophylaxis Research on effects on growth of childern following
Zn combined with other MN supplementation Strengthening of CIDD Project implemented by
BSCIC under MoI

Safe drinking water and improved sanitation (AoI # 3.5)
1 Source: Bangladesh National Sanitation Secretariat
Policy target Indicators Past status Current Target
2002 2004 2006 2009 1. Increased coverage of safe water supply 75% 74% 80% 97%
By 2010, 100%
Oct 2003 June 2005 June 2008
2. % of families using hygienic latrines1
Total Rural CityCorporations
33.21 28.77 69.9
55.9 (Total)
88.22 87.08 85.03
100% by 2010
2003 2009 3. Increased access to safe drinking water in arsenic affected areas
n.a. 51.2 n.a. 68.
Safe water and sanitation facilities available and accessible for all by 2010
51.2

Progress in sanitation coverage (2003 -08)

1. Progress towards policy targets
Coverage of safe water supply ↑ Achievement in tube wells feared with arsenic
contamination Use of sanitary latrines ↑ by almost 1/3 in last
5 years Significant progress in people’s access and
use of improved sanitation (estimates of 39% rural and 58% urban noted )

2. Recent policy developments/actions underway
WSSD supported by multi sectors –DPHE, LGED, WASA, international, multi lateral (UNICEF, IDA,ADB, WB and WHO; bilateral agencies DFID,DANIDA, JICA and Dutch Govt, INGOs WaterAid, Plan Bangladesh
NGO initiatives to integrate community participation with hygiene education, water supply and sanitation
Implementation of National Sanitation Strategy, monitoring and updating progress
ESHWRA Project implementation in 68 upazilas and scaling up planned

3. Needs for further action
Scale up interventions/funding to improve use of sanitary latrines
Ensure proper maintenance of existing latrines
Strengthening of arsenic mitigation programmes

Safe, quality food supply (AoI 3.6)
Policy target Indicators Past status Current status
Target
2004 2008 2009
1. # of food items standardized by BSTI
48 52 58
2002
Enhanced access to safe and quality food, for domestic consumption and also for international trade 2. Estimated %
of adulterated food items
70-75% 50

1.Progress towards policy targets
No reliable NATIONAL food safety monitoring (FSM) data
↑ in # of BSTI certified foods ↑ demand for fast foods, processed foods facilitated
commercial production of these foods; Adulteration in 50% food samples (IPH 2004), 100 %
fat samples, Shrimp produce rejected on few occasions (MoFL, 2004),
Some rice and wheat samples (DGF data, 2004) not within quality specifications

2. Recent policy developments/actions underway
Consumers’ Right Protection Act, 2009 passed 1967 Bangladesh Pure Food Rules amended to
Bangladesh Pure Food (Amendment) Act, 2005 Formation of Food Safety Advisory Council BSTI Ordinance 1985 enacted as BSTI Act 2003
giving BSTI some regulatory responsibilities Institutionalize Street Food Vending System (pilot
model in 3 wards in Dhaka tested) National Food Safety Policy and Plan of Action
underway National anti adulteration drives in progress MoHFW supported by FAO/WHO for 3 yr project on
‘Food Safety’ being implemented with EC funding
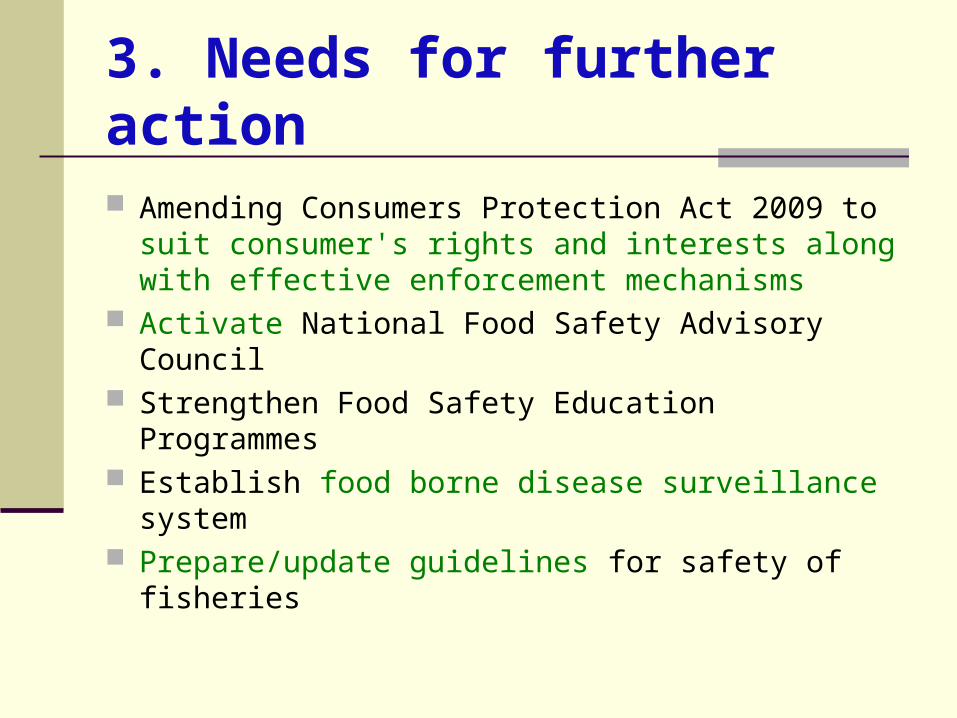
3. Needs for further action
Amending Consumers Protection Act 2009 to suit consumer's rights and interests along with effective enforcement mechanisms
Activate National Food Safety Advisory Council Strengthen Food Safety Education Programmes Establish food borne disease surveillance system Prepare/update guidelines for safety of fisheries
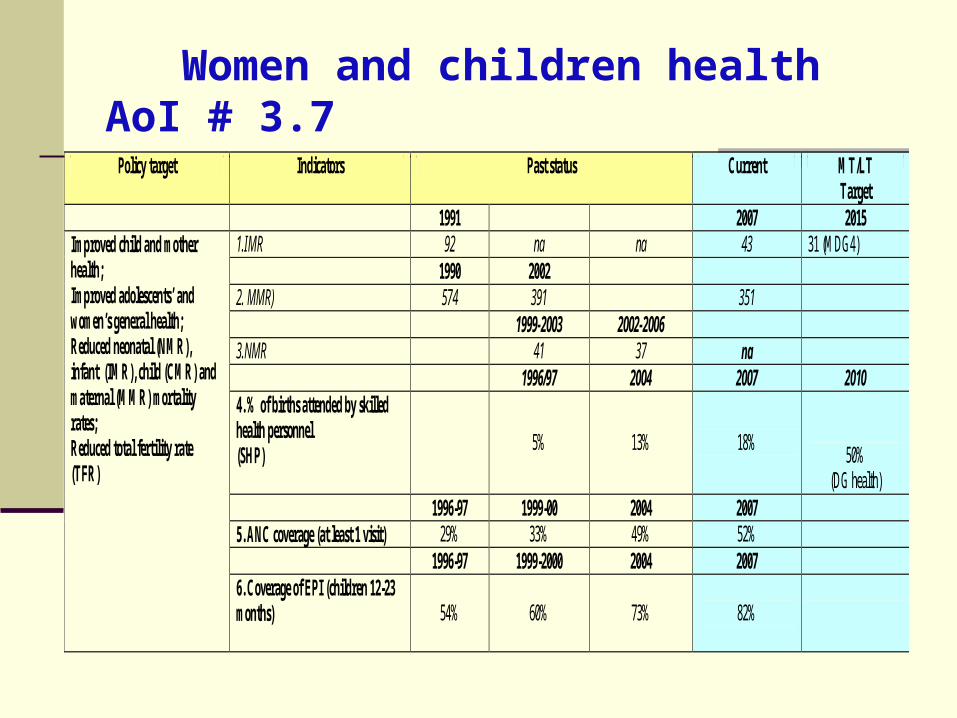
Women and children health AoI # 3.7
Policy target Indicators Past status Current MT/LT Target
1991 2007 2015 1.IMR 92 na na 43 31 (MDG4) 1990 2002 2. MMR) 574 391 351 1999-2003 2002-2006 3.NMR 41 37 na 1996/97 2004 2007 2010 4. % of births attended by skilled health personnel (SHP)
5% 13% 18%
50% (DG health)
1996-97 1999-00 2004 2007 5. ANC coverage (at least 1 visit) 29% 33% 49% 52% 1996-97 1999-2000 2004 2007
Improved child and mother health; Improved adolescents’ and women’s general health; Reduced neonatal (NMR), infant (IMR), child (CMR) and maternal (MMR) mortality rates; Reduced total fertility rate (TFR)
6. Coverage of EPI (children 12-23 months)
54%
60%
73%
82%

1. Progress towards policy targets
↓ in IMR (43% in 2007) attributed to UIP, improved health services and social awareness; NMR ↓ from 41% 1999 -2003 to 37% in 2002 -2006; ↓ in MMR from 574 in 1990 to 391 in 2002 and 351 in 2007; MMR not declining at the desired level
Attendance of skilled birth attendants , steadily improving though at a low pace
ANC and EPI coverage : NIP underway, EPI coverage ↑ markedly from 54% to 82% in last decade

2. Policy developments/actions underway
Formulation of new National Health Policy (NHP) 2009 replacing NHP of 1999; draft in preparation
Since January 2009 MoHFW in collaboration with FAO/WHO is implementing a 3 yr EC funded project on “Improving Food safety, quality and improving food control in Bangladesh”
Modular project – Preventive food chain approach, legislation and regulatory standards & enhancing analytical capacity

3. Needs for further action
Strengthen EPI : ARI, Cholera, diarrhoeal diseases, PHC coverage and low cost health facilities for the poor
Improve measures to facilitate access to health care facilities, particularly women and children in remote and hard –to-reach locations
Strengthen training to doctors, nurses and paramedics & provision of appropriate reproductive services to female adolescents and young women

Protection and promotion of breast feeding and complementary feeding (AoI 3.8)Policy targets Indicators Past Status Current
1999/00 2004 2007
1. % newborns put on breast within 1 hour of birth increased (HY)
17% 24% 43%
1993/94 1999/00 2004 2007
2. % infants exclusively breast fed for 6 months after birth
46% 46% 42% 43%
1996/97 1999/00 2004 2007
3. % infants given complementary feeding at 6 months of age
28% 59% 62% 68%
Strengthened exclusive breastfeeding practices; Expanded practice of breastfeeding; ensured safe and nutritious complementary feeding; Strengthened baby-friendly hospital initiative; Increased maternity leave, particularly post-partum; BMS Codes respected by the breast milk substitutes marketers

1. Progress towards policy targets
Slight improvement in BF practice being
initiated within 1 hr of birth (43% in 2007);
prelacteal feeding widely practised despite
global recommendations of feeding colostrum
and continue BF
No notable improvement in exclusive BF

2. Recent policy developments/actions underway
National IYCF Strategy formulated by MoHFW in 2006
Building upon /strengthening Innocenti Declaration (1990) and BFHI
Strengthening IYCF activities by NNP, BBF, NGOs, UNICEF and development partners
MDG –F Project on ‘Protecting and Promoting Food Security and Nutrition for Families and Children in Bangladesh’ to be implemented by GoB with Inter Agency (WFP/FAO/UNICEF) collaboration and Spanish Government funding support
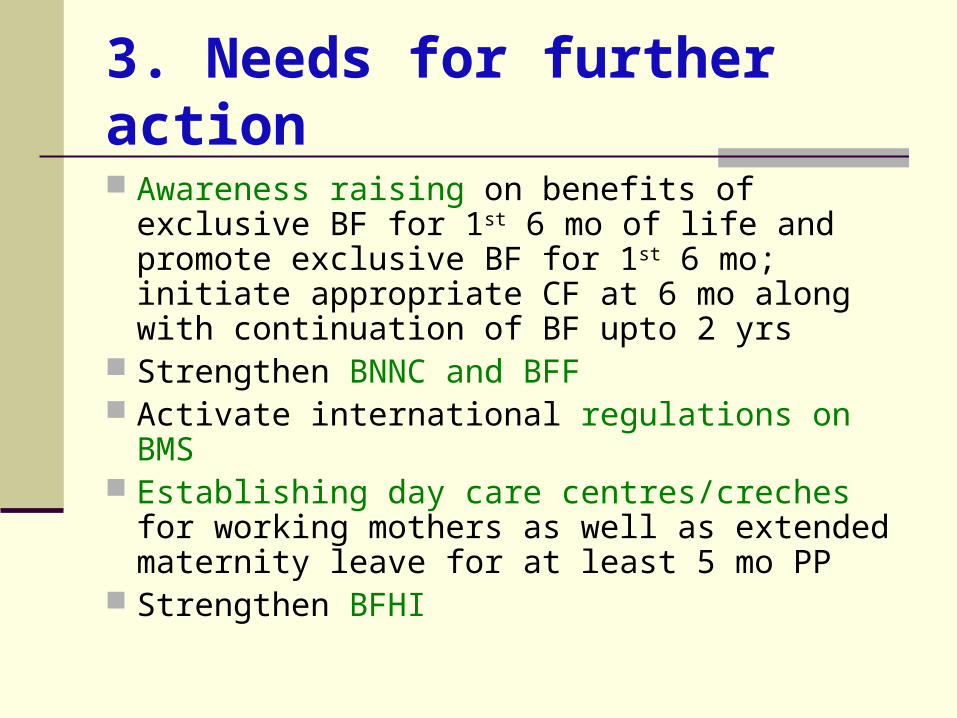
3. Needs for further action
Awareness raising on benefits of exclusive BF for 1st 6 mo of life and promote exclusive BF for 1st 6 mo; initiate appropriate CF at 6 mo along with continuation of BF upto 2 yrs
Strengthen BNNC and BFF Activate international regulations on BMS Establishing day care centres/creches for
working mothers as well as extended maternity leave for at least 5 mo PP
Strengthen BFHI

THANK YOU FOR YOUR KIND ATTENTION