fourth quarter & full year 2017 financial report · cfroi . cfroi improved to 6.9%, bringing it...
TRANSCRIPT

FOURTH QUARTER & FULL YEAR 2017 FINANCIAL REPORT Forenote Following the announcements in December 2016 of the divestment of the Acetow and Vinythai businesses and in September 2017 of plans to divest the Polyamide business, these have been reclassified as discontinued operations and as assets held for sale. For comparative purposes, the fourth quarter and the full year 2016 income statement have been restated. The Vinythai transaction was completed end of February 2017 and the Acetow transaction end of May 2017.
Besides IFRS accounts, Solvay also presents underlying Income Statement performance indicators to provide a more consistent and comparable indication of the Group’s financial performance. The underlying performance indicators adjust IFRS figures for the non-cash Purchase Price Allocation (PPA) accounting impacts related to acquisitions, for the coupons of perpetual hybrid bonds, classified as equity under IFRS but treated as debt in the underlying statements, and for other elements that would distort the analysis of the Group’s underlying performance. The comments on the results made on pages 2 to 12 are on an underlying basis, unless otherwise stated.
Inside / regulated information
February 28, 2018 7:00 AM
28/02/2018 Fourth quarter & full year 2017 financial report 2/31
HIGHLIGHTS
Fourth quarter 2017 results
Net sales totaled €2.5 billion, up 2% versus the fourth quarter of 2016, as the strong volume increase of 8% was partly offset by the negative foreign exchange impact on conversion.
Underlying EBITDA grew 2.8% to €494 million. On a constant scope and forex conversion basis, the underlying EBITDA rose 9.4%, reflecting volume growth in each segment more than offsetting cost increases. Adverse foreign exchange had a -5% effect on conversion. The underlying EBITDA margin reached 20%, consistent with the prior year quarter.
Advanced Materials at €260 million, stable versus a strong quarter last year, with volume growth in automotive, aerospace and electronics offset by forex;
Advanced Formulations at €138 million, up 11% year on year mainly driven by strong volume growth in shale oil & gas;
Performance Chemicals at €170 million, flat year-on-year with volume growth in soda ash and peroxides mostly offset by higher energy costs.
Free cash flow was €388 million for the fourth quarter, of which €336 million from continuing operations, €13 million up year on year.
Full year 2017 results
Net sales totaled €10.1 billion, up 6%, on 8% higher volumes.
Underlying EBITDA grew 7.5% to €2,230 million. Excluding forex conversion and scope effects, it grew 10%, driven by the 16% effect of volume growth, which more than offset the 7% increase in fixed costs and higher raw material and energy prices. The result also reflects the one-time synergy benefit of €38 million in the former Cytec businesses. The EBITDA margin for the year was sustained at 22%.
Advanced Materials at €1,202 million, an 8% increase mainly from growing demand for high-performance polymers in automotive and smart devices, while composites sales to aero ended the year slightly up;
Advanced Formulations at €524 million, up 8%, supported predominantly by the North American shale oil and gas market recovery;
Performance Chemicals at €749 million, up 4% on strong soda ash demand, eroded partly by negative net pricing.
Earnings per share [1] on an IFRS basis were €10.27, versus €6.01 in 2016. On an underlying basis it reached €7.59 from continuing operations, a 26% increase, driven by a 9% increase in EBIT, a reduction of financial charges and a positive effect from the decrease in underlying tax rate.
Free cash flow was €871 million, including €782 million from continuing operations, up 19% versus 2016. This reflects the higher EBITDA and capital discipline, which improved cash conversion. Combined with €875 million net proceeds from M&A transactions this led to a reduction of underlying net debt [2] to €(5.3) billion from €(6.6) billion at year start.
CFROI rose to 6.9%, from 6.3% in 2016 on a non-restated basis, reflecting the volume growth, while maintaining capital discipline.
2018 Outlook [3]
At constant scope and relative to average 2017 forex levels, Solvay expects full year underlying EBITDA to grow 5% to 7% organically.
Advanced Materials to grow by double-digits, driven by broad-based demand expansion in its key end-markets, including aerospace, automotive, electronics, batteries and healthcare, and supported by operational excellence;
Advanced Formulations to grow at a high single-digit, driven by increased demand in mining, and some further improvement in oil and gas, and positive net pricing;
Performance Chemicals profitability to decrease around €(50) million, as current higher energy prices are expected to weigh on soda ash margins, partly offset by excellence and growth in peroxides.
Notwithstanding underlying organic EBITDA growth of 5 to 7%, 2018 begins with forex headwinds. Assuming current rates prevail for the full year, reported underlying EBITDA will also be impacted both by forex conversion impacts of around €(125) million, and scope effects of small realized divestments of some €(30) million.
Including above-mentioned scope and forex elements, free cash flow from continuing operations is expected to exceed the 2017 level of €782 million. The optimized debt structure will lead to a reduction of net cash financing payments by more than €100 million. [1] Earnings per share, basic calculation. [2] Underlying net debt includes the perpetual hybrid bonds, accounted for as equity under IFRS. [3] The extended version of the 2018 outlook may be found on page 13.
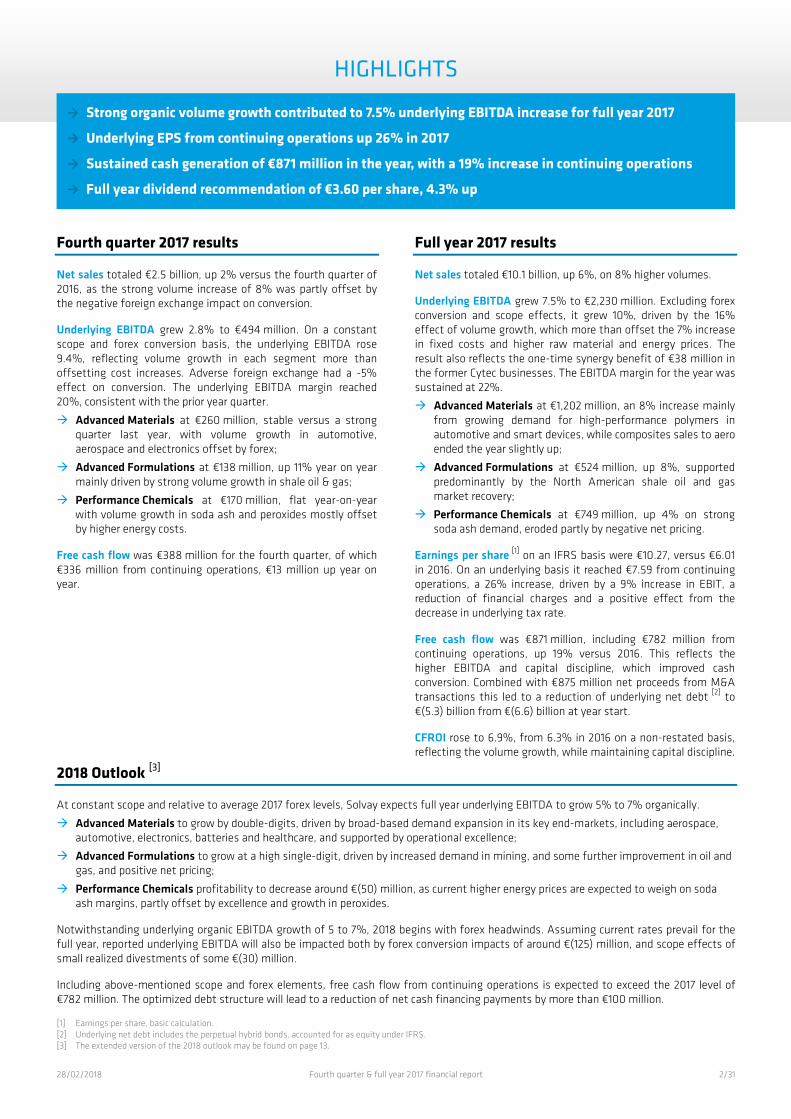
Strong organic volume growth contributed to 7.5% underlying EBITDA increase for full year 2017
Underlying EPS from continuing operations up 26% in 2017
Sustained cash generation of €871 million in the year, with a 19% increase in continuing operations
Full year dividend recommendation of €3.60 per share, 4.3% up
28/02/2018 Fourth quarter & full year 2017 financial report 3/31
MORE SUSTAINABLE VALUE
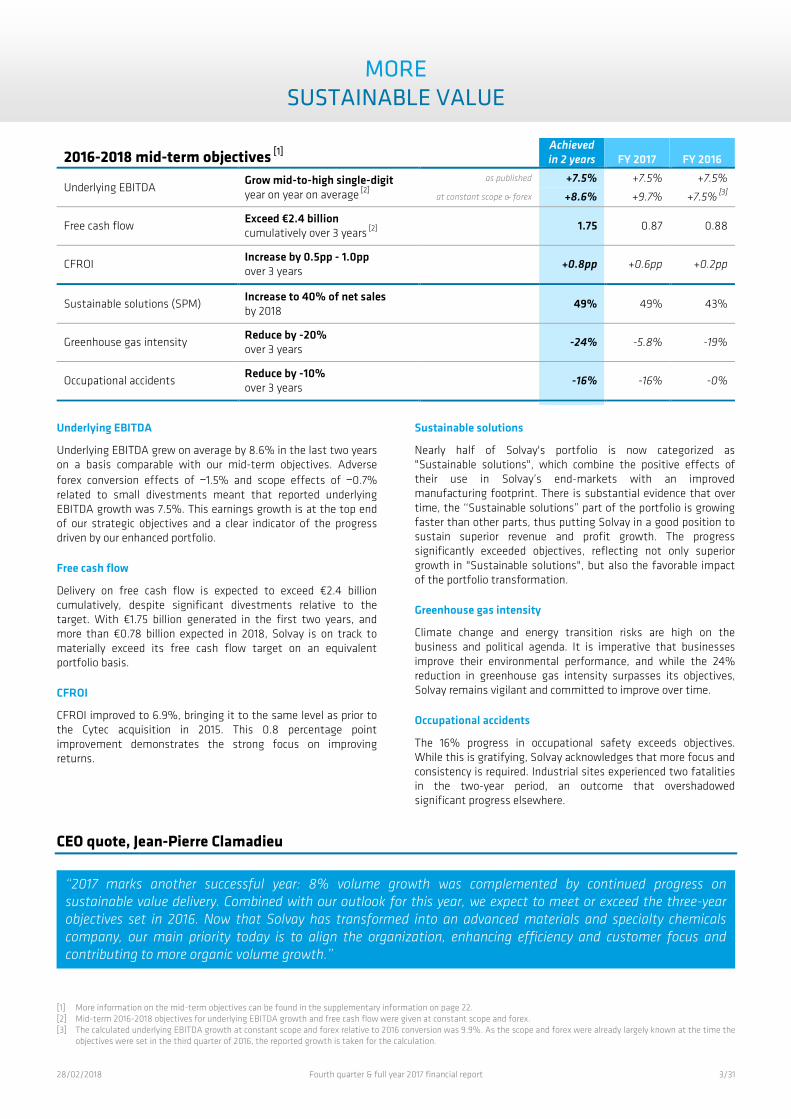
2016-2018 mid-term objectives [1] Achieved in 2 years FY 2017 FY 2016
Underlying EBITDA Grow mid-to-high single-digit year on year on average [2]
as published +7.5% +7.5% +7.5%
at constant scope & forex +8.6% +9.7% +7.5% [3]
Free cash flow Exceed €2.4 billion cumulatively over 3 years [2]
1.75 0.87 0.88
CFROI Increase by 0.5pp - 1.0pp over 3 years
+0.8pp +0.6pp +0.2pp
Sustainable solutions (SPM) Increase to 40% of net sales by 2018
49% 49% 43%
Greenhouse gas intensity Reduce by -20% over 3 years
-24% -5.8% -19%
Occupational accidents Reduce by -10% over 3 years
-16% -16% -0%
Underlying EBITDA
Underlying EBITDA grew on average by 8.6% in the last two years on a basis comparable with our mid-term objectives. Adverse forex conversion effects of -1.5% and scope effects of -0.7% related to small divestments meant that reported underlying EBITDA growth was 7.5%. This earnings growth is at the top end of our strategic objectives and a clear indicator of the progress driven by our enhanced portfolio.
Free cash flow
Delivery on free cash flow is expected to exceed €2.4 billion cumulatively, despite significant divestments relative to the target. With €1.75 billion generated in the first two years, and more than €0.78 billion expected in 2018, Solvay is on track to materially exceed its free cash flow target on an equivalent portfolio basis.
CFROI
CFROI improved to 6.9%, bringing it to the same level as prior to the Cytec acquisition in 2015. This 0.8 percentage point improvement demonstrates the strong focus on improving returns.
Sustainable solutions
Nearly half of Solvay's portfolio is now categorized as "Sustainable solutions", which combine the positive effects of their use in Solvay’s end-markets with an improved manufacturing footprint. There is substantial evidence that over time, the ‘‘Sustainable solutions’’ part of the portfolio is growing faster than other parts, thus putting Solvay in a good position to sustain superior revenue and profit growth. The progress significantly exceeded objectives, reflecting not only superior growth in "Sustainable solutions", but also the favorable impact of the portfolio transformation.
Greenhouse gas intensity
Climate change and energy transition risks are high on the business and political agenda. It is imperative that businesses improve their environmental performance, and while the 24% reduction in greenhouse gas intensity surpasses its objectives, Solvay remains vigilant and committed to improve over time.
Occupational accidents
The 16% progress in occupational safety exceeds objectives. While this is gratifying, Solvay acknowledges that more focus and consistency is required. Industrial sites experienced two fatalities in the two-year period, an outcome that overshadowed significant progress elsewhere.
CEO quote, Jean-Pierre Clamadieu
[1] More information on the mid-term objectives can be found in the supplementary information on page 22. [2] Mid-term 2016-2018 objectives for underlying EBITDA growth and free cash flow were given at constant scope and forex. [3] The calculated underlying EBITDA growth at constant scope and forex relative to 2016 conversion was 9.9%. As the scope and forex were already largely known at the time the
objectives were set in the third quarter of 2016, the reported growth is taken for the calculation.
‘‘2017 marks another successful year: 8% volume growth was complemented by continued progress on sustainable value delivery. Combined with our outlook for this year, we expect to meet or exceed the three-year objectives set in 2016. Now that Solvay has transformed into an advanced materials and specialty chemicals company, our main priority today is to align the organization, enhancing efficiency and customer focus and contributing to more organic volume growth.’’

28/02/2018 Fourth quarter & full year 2017 financial report 4/31
BUSINESS REVIEW FOURTH QUARTER 2017 UNDERLYING RESULTS [1]
Q4 key figures IFRS Underlying
(in € million) Q4 2017 Q4 2016 % yoy Q4 2017 Q4 2016 % yoy Net sales 2,480 2,431 +2.0% 2,480 2,431 +2.0% EBITDA 457 483 -5.3% 494 480 +2.8% EBITDA margin 20% 20% +0.1pp
EBIT 204 218 -6.3% 307 296 +3.5% Net financial charges (86) (80) -8.1% (90) (109) +17% Income taxes 206 146 +42% (60) (50) -20% Profit (loss) from discontinued operations (39) (14) n.m. 2 66 n.m. (Profit) loss attributable to non-controlling interests (16) (25) -36% (14) (21) -34%
Profit attributable to Solvay share 269 245 +9.8% 145 183 -21%
Basic earnings per share (in €) 2.60 2.37 +9.5% 1.40 1.77 -21%
of which from continuing operations 2.98 2.64 +13% 1.38 1.22 +13%
Capex (287) (302) +4.9% (287) (302) +4.9% of which from continuing operations (243) (252) +3.8% (243) (252) +3.8%
Free cash flow 388 412 -5.9% 388 412 -5.9% of which from continuing operations 336 323 +4.0% 336 323 +4.0%
Net debt [2] (3,146) (5,346)
Q4 yoy net sales bridge (in €million)
Q4 yoy underlying EBITDA bridge (in €million)
Q4 2017 underlying net debt [2] bridge (in €million)
[1] A full reconciliation of IFRS and underlying income statement data can be found on page 18 of this report. [2] Underlying net debt includes the perpetual hybrid bonds, accounted for as equity under IFRS.
Q4 2016
Scope Forex
conversion Volume & mix
Price
Q4 2017
2,431 -22 -116 +188 -1 2,480
Q4 2016
Scope Forex conversion
Volume & mix
Net pricing
Fixed costs
Others (including
equity earnings)
Q4 2017
480 -6 -23 +80 -25 -18 +6 494
September 30, 2017
Underlying EBITDA
Capex Changes in working capital needs:
industrial +149
non-industrial +20
Taxes Changes in provisions
& other operating cash flow
Free cash flow from
discontinued operations
Acquisitions &
divestments
Financing payments:
Net interests -111
Perpetual hybrid bond
coupons -27
Dividends: non-controlling
interests
Other changes
in net debt
December 31, 2017
(5,538) +494 -243 +169 -26 -58 +52 -53 -139 -35 +31 (5,346)
IFRS net debt (3,146)
Perpetual hybrid bonds (2,200)
Perpetual hybrid bonds (2,200)
IFRS net debt (3,338)
Free cash flow € 388 m
28/02/2018 Fourth quarter & full year 2017 financial report 5/31
Net sales totaled €2,480 million, up 2% versus the fourth quarter of 2016, as the strong volume increase of 8% was partly offset by the negative foreign exchange impact on conversion.
The -1% scope [1] effect reflects the sale of the smaller polyolefin cross-linkable compounds and formulated resins businesses in June 2017.
Foreign exchange fluctuations had a -5% conversion effect on sales, reflecting mainly the depreciation of the US dollar and to a lesser extent the Chinese yuan, Brazilian real and Japanese yen.
The 8% volume increase was supported across operating segments. Advanced Materials volume growth was driven by demand for high-performance polymers used in automotive and smart devices, and for composites in aeronautics. The on-going recovery in the North American shale oil and gas market drove higher volumes in Advanced Formulations. At Performance Chemicals, sales volumes were up for soda ash, bicarbonates and peroxides.
Underlying EBITDA grew 3% to €494 million. On a constant basis, the underlying EBITDA rose 9%, reflecting volume growth in each segment more than offsetting cost increases. Adverse foreign exchange had a -5% effect on conversion. The underlying EBITDA margin reached 20% in the quarter, consistent with the prior year quarter.
Foreign exchange fluctuations led to a negative conversion effect on EBITDA of -6%. The decrease is almost entirely due to the depreciation of the US dollar.
Higher volumes added 17% to EBITDA, reflecting growth across all operating segments.
Net pricing had a negative effect of -5%. While commercial and operational excellence initiatives offset higher raw material costs in Advanced Materials and Advanced Formulations, higher energy costs in the soda ash activities led to a margin contraction in Performance Chemicals.
Fixed costs grew €(18) million. Although operational excellence and synergies compensated for inflation, new capacities expanded the footprint and hence the fixed costs base.
Other elements contributed €7 million net and include a €12 million one-time indemnity received for the loss of certain smaller Advanced Formulations assets in China.
Underlying EBIT was €307 million up 4%, reflecting the higher level of profitability.
Underlying net financial charges [2] were €(90) million, a 17% reduction year on year, as gross debt was reduced significantly over the year. At the start of the quarter senior bonds for a total
amount of €(376) million were repurchased as part of the on-going plan to optimize the financing structure.
Underlying income taxes rose to €(60) million, in line with the higher profitability of the Group. On an IFRS basis the tax result is positive due to tax elements related to prior periods, mainly €202 million recognition of deferred tax assets in France and €49 million net impact of the US tax reform.
Discontinued operations added €2 million to profit on an underlying basis, well below the €66 million in 2016, as the sale of the Acetow and Vinythai businesses were completed earlier in the year, and therefore those operations are no longer contributing.
Underlying earnings per share, basic, were €1.40 versus €1.77 in 2016, reflecting the lower contribution from discontinued operations. For continuing operations they grew 13% reflecting the lower financial charges on top of a higher operational profit.
Free cash flow from continuing operations was €336 million compared to €323 million in the same quarter of 2016. Including the €52 million contribution from discontinued operations, total free cash flow was €388 million.
Capex from continuing operations was €(287) million, 5% lower than in 2016 and in line with the planned reduction in capex intensity;
Working capital inflow from continuing operations was €169 million, with industrial working capital needs of €149 million. As a result, the net working capital to sales ratio dropped to 12.8% in the quarter, from 15.5% at the start of the quarter.
Underlying net debt [2] fell to €(5,346) million from €(5.538) million at the start of the quarter, an improvement of €192 million.
The outflow on acquisitions and divestments of €(53) million largely consisted of the acquisition of the large-tow carbon fiber plant in Germany, as well as customary price adjustments and costs related to recent and on-going divestments.
Financing payments were €(139) million, versus €(76) million in 2016. The senior bond tender in early October and the unwinding of currency swaps on intercompany financing resulted in an increase in net interest payments.
Dividend payments consisted of €(35) million paid out to non-controlling interests.
Other changes were positive and included the devaluation of the US dollar-denominated debt, due to the currency’s depreciation over the quarter, and the reversal of accruals for interest payments unequally spread over the quarters.
[1] Scope effects include acquisitions and divestments of smaller businesses not leading to the restatement of previous periods. [2] Underlying net debt includes the perpetual hybrid bonds, treated as equity under IFRS. Underlying net financial charges include the coupons on perpetual hybrid bonds, which
are accounted as dividends under IFRS, and thereby excluded from the P&L, as well as the financial charges and realized foreign exchange losses in the RusVinyl joint venture, which under IFRS are part of the earnings from associates & joint ventures and thereby included in the IFRS EBITDA.

28/02/2018 Fourth quarter & full year 2017 financial report 6/31
BUSINESS REVIEW FULL YEAR 2017 UNDERLYING RESULTS [1]
FY key figures IFRS Underlying
(in € million) FY 2017 FY 2016 % yoy FY 2017 FY 2016 % yoy Net sales 10,125 9,569 +5.8% 10,125 9,569 +5.8% EBITDA 2,029 1,932 +5.1% 2,230 2,075 +7.5% EBITDA margin 22% 22% +0.3pp
EBIT 976 858 +14% 1,527 1,403 +8.8% Net financial charges (298) (334) +11% (394) (464) +15% Income taxes 197 68 n.m. (299) (272) -10% Tax rate 27.5% 30.3% -2.8pp Profit (loss) from discontinued operations 241 82 n.m. 159 240 -34% (Profit) loss attributable to non-controlling interests (56) (53) +3.9% (54) (61) -11%
Profit attributable to Solvay share 1,061 621 +71% 939 846 +11%
Basic earnings per share (in €) 10.27 6.01 +71% 9.08 8.19 +11%
of which from continuing operations 7.97 5.34 +49% 7.59 6.02 +26%
Capex (822) (981) +16% (822) (981) +16% of which from continuing operations (716) (839) +15% (716) (839) +15%
Free cash flow 871 876 -0.5% 871 876 -0.5% of which from continuing operations 782 658 +19% 782 658 +19%
Net debt [2] (3,146) (4,356) +28% (5,346) (6,556) +18%
CFROI [3] 6.9% 6.3% +0.6pp
Research & innovation [3] (325) (350) +7.0% Research & innovation intensity [3] 3.2% 3.2%
FY yoy net sales bridge (in €million)
FY yoy underlying EBITDA bridge (in €million)
FY 2017 underlying net debt [2] bridge (in €million)
[1] A full reconciliation of IFRS and underlying income statement data can be found on page 18 of this report. [2] Underlying net debt includes the perpetual hybrid bonds, accounted for as equity under IFRS. [3] CFROI (Cash Flow Return On Investment) and Research & Innovation reference figures are provided on a non-restated basis.
FY 2016
Scope Forex conversion
Volume & mix
Price
FY 2017
9,569 -71 -116 +754 -11 10,125
FY 2016
Scope Forex conversion
Volume & mix
Net pricing Fixed
costs Others
(including equity
earnings)
FY 2017
2,075 -19 -22 +327 -45 -135 +50 2,230
December 31, 2016
Underlying EBITDA
Capex
Changes in working capital needs:
industrial -140
non-industrial -20
Taxes Changes in provisions
& other operating cash flow
Free cash flow from
discontinued operations
Acquisitions &
divestments
Financing payments:
Net interests -255
Perpetual hybrid bond
coupons -111
Dividends: non-controlling
interests -39
Solvay -357
Other changes
in net debt
December 31, 2017
(6,556) +2,230
-716 -160 -199 -373 +89 +875
-367 -396 +227 (5,346)
IFRS net debt (3,146)
Perpetual hybrid bonds (2,200)
Perpetual hybrid bonds (2,200)
IFRS net debt (4,356)
Free cash flow € 871 m

28/02/2018 Fourth quarter & full year 2017 financial report 7/31
Net sales totaled €10,125 million, up 6%, on 8% higher volumes.
The -1% scope [1] effect reflects the sale of the smaller polyolefin cross-linkable compounds and formulated resins businesses in June 2017.
Foreign exchange fluctuations had a -1% effect on conversion, mainly from the depreciation of the US dollar, and to a lesser extent from the Chinese yuan, British pound and Japanese yen, partly offset by the appreciation of the Brazilian real.
The 8% volume increase came from all segments. In Advanced Materials, demand for high-performance polymers continued to grow, most notably for automotive and smart devices. Composites sales stabilized year on year, with aerospace composite sales slightly above the prior year offset by weak demand in industrial markets. Advanced Formulations volumes grew strongly, driven by the North American shale oil and gas market recovery. In Performance Chemicals soda ash volumes were strong throughout the year and the new peroxide HPPO plant started up.
Underlying EBITDA grew 7% to €2,230 million. Excluding conversion forex and scope effects, it grew 10%, driven by the 16% effect of volume growth, which more than offset the 7% increase in fixed costs and higher raw material and energy costs. The result also reflects a one-time synergy benefit of €38 million in the former Cytec businesses. The underlying EBITDA margin was sustained at 22%.
Foreign exchange impacted conversion by -1%, following the depreciation of the US dollar and to a lesser extent the Chinese yuan in the second half of the year.
The higher volumes added 16% to EBITDA.
Fixed costs went up. Although operational excellence and synergy benefits largely compensated for inflation, volume increases and new capacities expanded the cost base. Higher profitability also led to an increase in provisions for variable remuneration.
Net pricing was down and affected EBITDA by -2%, as the increase in raw material and energy prices could only partly be compensated by commercial and operational excellence.
Other elements added €50 million net to EBITDA and consist mainly of one-time elements, including the €38 million synergy benefit on post-retirement obligations in the former Cytec businesses, as well as a €17 million total indemnity over the year for the loss of some production assets in China.
Underlying EBIT was €1,527 million, up 9% and includes 5% higher amortization and depreciation charges, following the start-up of new capacities.
Underlying net financial charges [2] totaled €(394) million, 15% lower year on year. Net cost of borrowings fell as gross debt was reduced throughout 2016 and 2017, and as discounting costs on pensions dropped on lower discount rates.
Underlying income taxes were €(299) million, 10% higher than in 2016, though the underlying tax rate was significantly reduced from 30.3% to 27.5%. On an IFRS basis, the tax result is positive due to tax elements related to prior periods, mainly €202 million recognition of deferred tax assets in France and €49 million net impact triggered by the US tax reform.
Discontinued operations added €159 million to profit on an underlying basis. The decrease versus €240 million in 2016 is explained by the divestment of the Vinythai Asian PVC activity
and the Acetow acetate tow business, which were completed mid-2017. The discontinued operations in the second half of the year still contain the Polyamide activity that is planned to be sold to BASF for an enterprise value of €1.6 billion. This divestment is expected to be finalized in the second half of 2018.
Underlying earnings per share, basic, reached €9.08, up 11%. €7.59 came from continuing operations, a 26% increase, which is more than operating profit, thanks to lower financial charges and a 5% effect from the decrease in tax rate.
Free cash flow from continuing operations was €782 million a 19% increase versus 2016. This reflects higher EBITDA and the focus on capital discipline. Including discontinued operations, total free cash flow was €871 million.
Capex from continuing operations was €(716) million, €123 million lower than in 2016, in line with the planned reduction in capex intensity, raising cash conversion from 60% to 68%.
Working capital outflow from continuing operations was €(160) million, of which €(140) million industrial working capital, in line with higher sales. The average working capital to sales ratio over the quarters thereby reached 13.8%, 1.5 percentage point better than the 15.3% in 2016, when the receivable on the Inovyn transaction weighed on the balance sheet.
Underlying net debt [2] fell to €(5,346) million from €(6,556) million at the start of the year, an improvement of €1,210 million, Strong free cash flow generation and the divestment proceeds resulting from the strategic portfolio transformation reduced the gross debt position by €1,200 million, through the redemption of bonds at maturity and the repurchase operation in early October. The financing structure optimization improved the underlying leverage ratio from 2.6x at the start of the year to 2.2x, both on an adjusted basis [3].
Acquisitions and divestments contribution of €875 million net consisted mainly of net sales proceeds from the discontinued operations Vinythai and Acetow, and those of the smaller formulated resins and cross-linkable compounds product lines. The net amount also included post-closing payments on the Indupa and Inovyn divestments.
Financing payments were €(367) million, more than the €(300) million paid in 2016. Net interest payments increased to €(255) million, despite the reduction in gross debt, due to the costs related to the senior bond tender in early October and cash-out related to the unwinding of currency swaps on intercompany financing. A higher coupon was also paid out on the hybrid bonds, since some of them only required a half pay-out in 2016.
Dividend payments in the year were €(396) million, of which €(357) million to Solvay shareholders.
Other changes had a positive impact of €227 million, which ensued mainly from the devaluation of US dollar-denominated debt, following the currency’s depreciation over the period.
Dividend recommendation for 2017 is €3.60 gross per share, up 4.3% versus 2016. Subject to shareholder’s approval, the balance of €2.22, after deduction of the €1.38 interim dividend distributed in January, will be payable to shareholders on May 23, 2018.
CFROI rose to 6.9%, the same level as prior to the Cytec acqui-sition, and is now in the value-creation zone. The 0.6 percentage point increase versus 6.3% on a non-restated basis in 2016, reflected both volume growth and maintained capital discipline.
[1] Scope effects include acquisitions and divestments of smaller businesses not leading to the restatement of previous periods. [2] Underlying net debt includes the perpetual hybrid bonds, treated as equity under IFRS. Underlying net financial charges include the coupons on perpetual hybrid bonds, which
are accounted as dividends under IFRS, and thereby excluded from the P&L, as well as the financial charges and realized foreign exchange losses in the RusVinyl joint venture, which under IFRS are part of the earnings from associates & joint ventures and thereby included in the IFRS EBITDA.
[3] EBITDA of the discontinued Polyamide business was added to the denominator, as the proceeds to be received on completion do not yet reduce the net debt in the numerator.
28/02/2018 Fourth quarter & full year 2017 financial report 8/31
SEGMENT REVIEW FOURTH QUARTER & FULL YEAR 2017 UNDERLYING RESULTS
Q4 2017 by segment [1]
FY 2017 by segment [1][2]
FY 2017 net sales by region and end-market
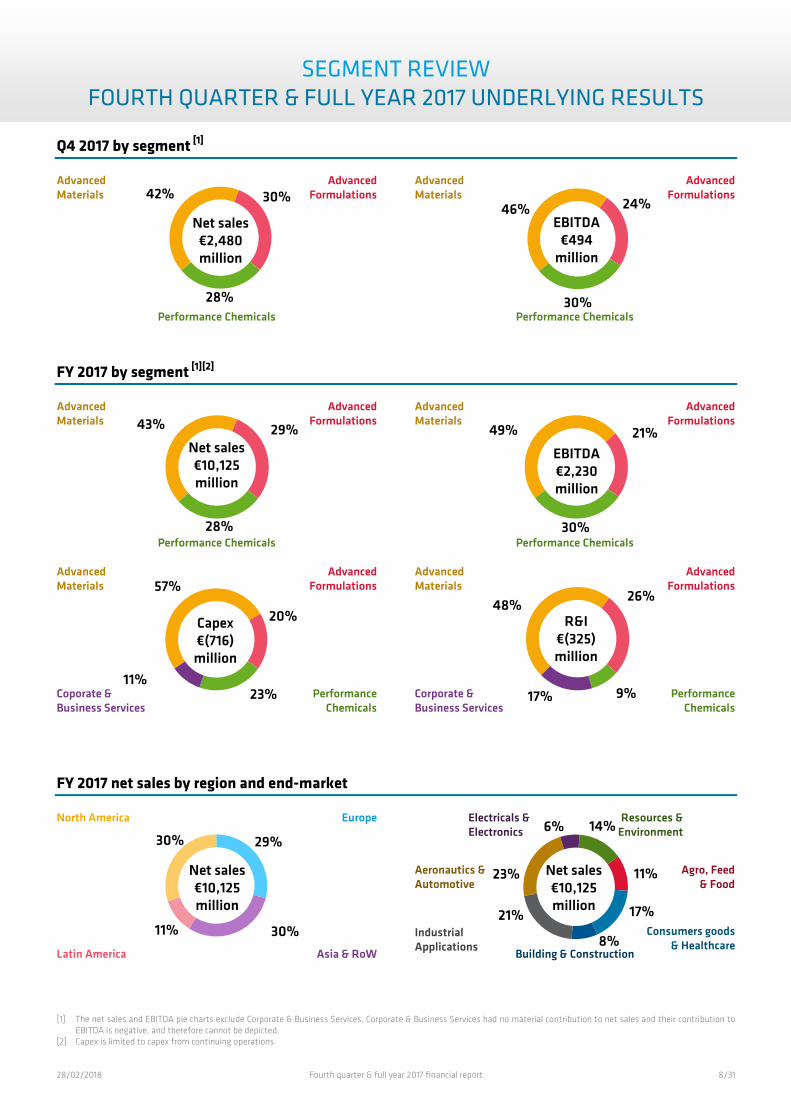
[1] The net sales and EBITDA pie charts exclude Corporate & Business Services, Corporate & Business Services had no material contribution to net sales and their contribution to
EBITDA is negative, and therefore cannot be depicted. [2] Capex is limited to capex from continuing operations.
42% 30%
28%
Net sales €2,480 million
Advanced Materials
Advanced Formulations
Performance Chemicals
46% 24%
30%
EBITDA €494
million
Advanced Materials
Advanced Formulations
Performance Chemicals
43% 29%
28%
Net sales €10,125 million
Advanced Materials
Advanced Formulations
Performance Chemicals
57%
20%
23% 11%
Capex €(716) million
Advanced Materials
Advanced Formulations
Performance Chemicals
Coporate & Business Services
49% 21%
30%
EBITDA €2,230 million
Advanced Materials
Advanced Formulations
Performance Chemicals
48% 26%
9% 17%
R&I €(325) million
Advanced Materials
Advanced Formulations
Performance Chemicals
Corporate & Business Services
29%
30% 11%
30%
Net sales €10,125 million
Europe North America
Asia & RoW Latin America
23%
6% 14%
11%
17%
8%
21%
Net sales €10,125 million
Aeronautics & Automotive
Resources & Environment
Agro, Feed & Food
Consumers goods & Healthcare
Electricals & Electronics
Building & Construction
Industrial Applications
28/02/2018 Fourth quarter & full year 2017 financial report 9/31
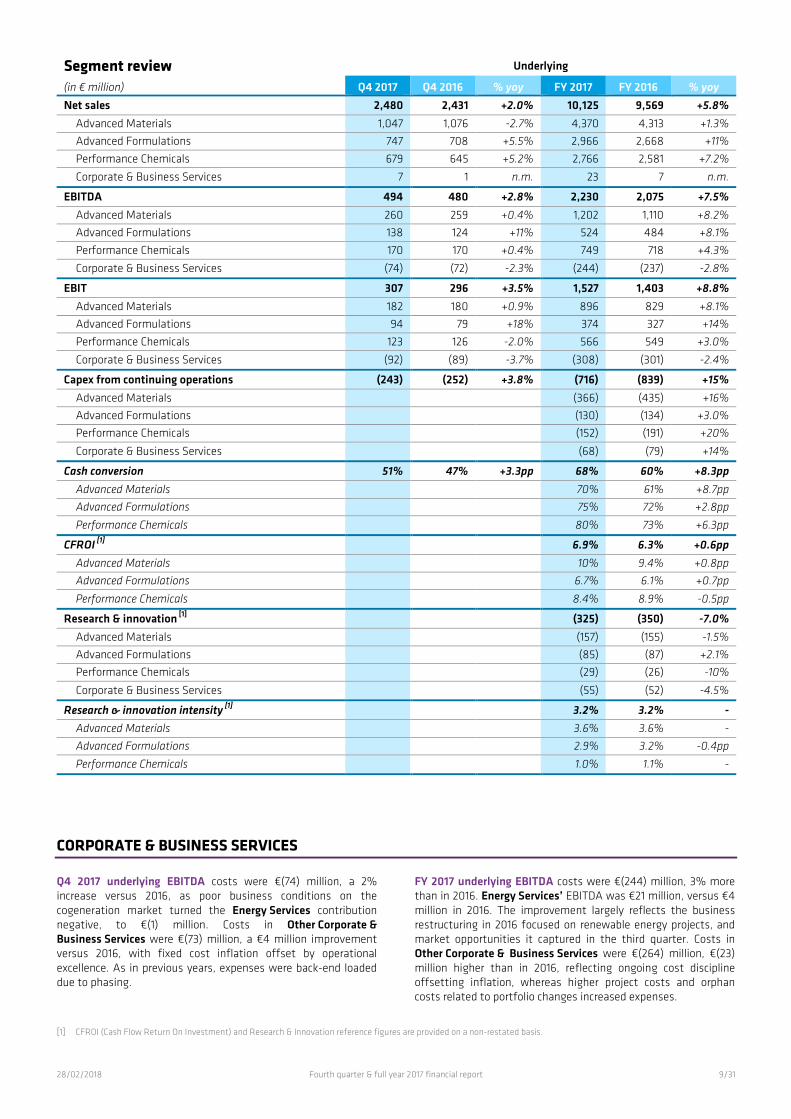
Segment review Underlying
(in € million) Q4 2017 Q4 2016 % yoy FY 2017 FY 2016 % yoy Net sales 2,480 2,431 +2.0% 10,125 9,569 +5.8%
Advanced Materials 1,047 1,076 -2.7% 4,370 4,313 +1.3% Advanced Formulations 747 708 +5.5% 2,966 2,668 +11% Performance Chemicals 679 645 +5.2% 2,766 2,581 +7.2%
Corporate & Business Services 7 1 n.m. 23 7 n.m.
EBITDA 494 480 +2.8% 2,230 2,075 +7.5% Advanced Materials 260 259 +0.4% 1,202 1,110 +8.2% Advanced Formulations 138 124 +11% 524 484 +8.1% Performance Chemicals 170 170 +0.4% 749 718 +4.3%
Corporate & Business Services (74) (72) -2.3% (244) (237) -2.8%
EBIT 307 296 +3.5% 1,527 1,403 +8.8% Advanced Materials 182 180 +0.9% 896 829 +8.1% Advanced Formulations 94 79 +18% 374 327 +14% Performance Chemicals 123 126 -2.0% 566 549 +3.0%
Corporate & Business Services (92) (89) -3.7% (308) (301) -2.4%
Capex from continuing operations (243) (252) +3.8% (716) (839) +15% Advanced Materials (366) (435) +16% Advanced Formulations (130) (134) +3.0% Performance Chemicals (152) (191) +20%
Corporate & Business Services (68) (79) +14%
Cash conversion 51% 47% +3.3pp 68% 60% +8.3pp Advanced Materials 70% 61% +8.7pp Advanced Formulations 75% 72% +2.8pp
Performance Chemicals 80% 73% +6.3pp
CFROI [1] 6.9% 6.3% +0.6pp Advanced Materials 10% 9.4% +0.8pp Advanced Formulations 6.7% 6.1% +0.7pp
Performance Chemicals 8.4% 8.9% -0.5pp
Research & innovation [1] (325) (350) -7.0% Advanced Materials (157) (155) -1.5% Advanced Formulations (85) (87) +2.1% Performance Chemicals (29) (26) -10%
Corporate & Business Services (55) (52) -4.5%
Research & innovation intensity [1] 3.2% 3.2% - Advanced Materials 3.6% 3.6% - Advanced Formulations 2.9% 3.2% -0.4pp
Performance Chemicals 1.0% 1.1% -
CORPORATE & BUSINESS SERVICES
Q4 2017 underlying EBITDA costs were €(74) million, a 2% increase versus 2016, as poor business conditions on the cogeneration market turned the Energy Services contribution negative, to €(1) million. Costs in Other Corporate & Business Services were €(73) million, a €4 million improvement versus 2016, with fixed cost inflation offset by operational excellence. As in previous years, expenses were back-end loaded due to phasing.
FY 2017 underlying EBITDA costs were €(244) million, 3% more than in 2016. Energy Services’ EBITDA was €21 million, versus €4 million in 2016. The improvement largely reflects the business restructuring in 2016 focused on renewable energy projects, and market opportunities it captured in the third quarter. Costs in Other Corporate & Business Services were €(264) million, €(23) million higher than in 2016, reflecting ongoing cost discipline offsetting inflation, whereas higher project costs and orphan costs related to portfolio changes increased expenses.
[1] CFROI (Cash Flow Return On Investment) and Research & Innovation reference figures are provided on a non-restated basis.
28/02/2018 Fourth quarter & full year 2017 financial report 10/31
ADVANCED MATERIALS
Key figures Underlying
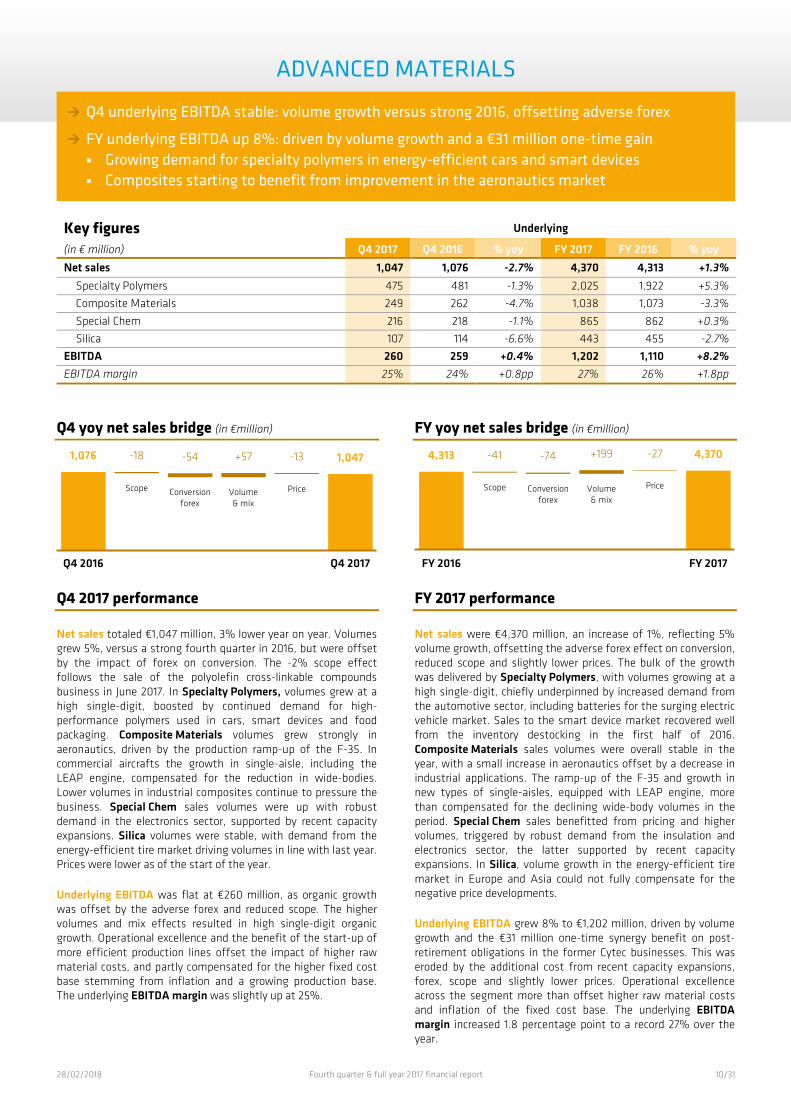
(in € million) Q4 2017 Q4 2016 % yoy FY 2017 FY 2016 % yoy Net sales 1,047 1,076 -2.7% 4,370 4,313 +1.3%
Specialty Polymers 475 481 -1.3% 2,025 1,922 +5.3% Composite Materials 249 262 -4.7% 1,038 1,073 -3.3% Special Chem 216 218 -1.1% 865 862 +0.3% Silica 107 114 -6.6% 443 455 -2.7%
EBITDA 260 259 +0.4% 1,202 1,110 +8.2% EBITDA margin 25% 24% +0.8pp 27% 26% +1.8pp
Q4 yoy net sales bridge (in €million)
FY yoy net sales bridge (in €million)
Q4 2017 performance
Net sales totaled €1,047 million, 3% lower year on year. Volumes grew 5%, versus a strong fourth quarter in 2016, but were offset by the impact of forex on conversion. The -2% scope effect follows the sale of the polyolefin cross-linkable compounds business in June 2017. In Specialty Polymers, volumes grew at a high single-digit, boosted by continued demand for high-performance polymers used in cars, smart devices and food packaging. Composite Materials volumes grew strongly in aeronautics, driven by the production ramp-up of the F-35. In commercial aircrafts the growth in single-aisle, including the LEAP engine, compensated for the reduction in wide-bodies. Lower volumes in industrial composites continue to pressure the business. Special Chem sales volumes were up with robust demand in the electronics sector, supported by recent capacity expansions. Silica volumes were stable, with demand from the energy-efficient tire market driving volumes in line with last year. Prices were lower as of the start of the year.
Underlying EBITDA was flat at €260 million, as organic growth was offset by the adverse forex and reduced scope. The higher volumes and mix effects resulted in high single-digit organic growth. Operational excellence and the benefit of the start-up of more efficient production lines offset the impact of higher raw material costs, and partly compensated for the higher fixed cost base stemming from inflation and a growing production base. The underlying EBITDA margin was slightly up at 25%.
FY 2017 performance
Net sales were €4,370 million, an increase of 1%, reflecting 5% volume growth, offsetting the adverse forex effect on conversion, reduced scope and slightly lower prices. The bulk of the growth was delivered by Specialty Polymers, with volumes growing at a high single-digit, chiefly underpinned by increased demand from the automotive sector, including batteries for the surging electric vehicle market. Sales to the smart device market recovered well from the inventory destocking in the first half of 2016. Composite Materials sales volumes were overall stable in the year, with a small increase in aeronautics offset by a decrease in industrial applications. The ramp-up of the F-35 and growth in new types of single-aisles, equipped with LEAP engine, more than compensated for the declining wide-body volumes in the period. Special Chem sales benefitted from pricing and higher volumes, triggered by robust demand from the insulation and electronics sector, the latter supported by recent capacity expansions. In Silica, volume growth in the energy-efficient tire market in Europe and Asia could not fully compensate for the negative price developments.
Underlying EBITDA grew 8% to €1,202 million, driven by volume growth and the €31 million one-time synergy benefit on post-retirement obligations in the former Cytec businesses. This was eroded by the additional cost from recent capacity expansions, forex, scope and slightly lower prices. Operational excellence across the segment more than offset higher raw material costs and inflation of the fixed cost base. The underlying EBITDA margin increased 1.8 percentage point to a record 27% over the year.
Q4 2016
Scope Conversion forex
Volume & mix
Price
Q4 2017
1,076 -18 -54 +57 -13 1,047
FY 2016
Scope Conversion forex
Volume & mix
Price
FY 2017
4,313 -41 -74 +199 -27 4,370
Q4 underlying EBITDA stable: volume growth versus strong 2016, offsetting adverse forex
FY underlying EBITDA up 8%: driven by volume growth and a €31 million one-time gain Growing demand for specialty polymers in energy-efficient cars and smart devices Composites starting to benefit from improvement in the aeronautics market

28/02/2018 Fourth quarter & full year 2017 financial report 11/31
ADVANCED FORMULATIONS
Key figures Underlying
(in € million) Q4 2017 Q4 2016 % yoy FY 2017 FY 2016 % yoy Net sales 747 708 +5.5% 2,966 2,668 +11%
Novecare 480 438 +9.6% 1,937 1,663 +16% Technology Solutions 174 170 +2.5% 662 656 +1.0% Aroma Performance 93 100 -7.1% 366 350 +4.7%
EBITDA 138 124 +11% 524 484 +8.1% EBITDA margin 18% 18% +0.9pp 18% 18% -0.5pp
Q4 yoy net sales bridge (in €million)
FY yoy net sales bridge (in €million)
Q4 2017 performance
Net sales grew 6% to €747 million, underpinned by volume growth of 10%, and with a -6% adverse forex effect on conversion. Novecare volumes benefited from the higher activity level in the North American shale oil and gas industry since the start of the year, driving sales up 10% year on year. Volumes also rose in coatings and industrial applications, albeit at a lower level. Sales volumes in Technology Solutions benefitted from improved demand from the copper and aluminum mining sector, which was at its highest level since 2015. Sales of specialty phosphines were up as well, mainly driven by the electronics industry. Aroma Performance sales volumes were stable on the higher-end products, such as vanillin aroma ingredients, but decreased on lower-grade performance solutions.
Underlying EBITDA was up 11%, reaching €138 million in the quarter, as a result of the higher volumes, which more than offset the adverse forex impact. Higher raw material costs were offset by operational and commercial excellence initiatives. The result also includes a €12 million one-time indemnity received for the loss of some production assets in China. The underlying EBITDA margin was largely stable at 18%.
FY 2017 performance
Net sales rose 11% to €2,966 million, thanks to volume growth of 13%, which forex effects on conversion eroded by -2%. The 16% sales surge in Novecare was triggered by the recovery of the North American shale oil and gas market and a gradual improvement in the product mix throughout the year. This was supplemented by moderate demand growth in agro, coatings and industrial applications. Sales in Technology Solutions were up slightly, tempered by the scope decrease following the sale of the formulated resins business in June 2017. While volumes to the mining sector were mostly stable over the year, as underlying demand was offset by production issues at customers’ mines, demand rose significantly for phosphine specialties. Aroma Performance sales grew 5%, with the new vanillin plant in China ramping up, but competitive price pressure continued in the region.
Underlying EBITDA increased by 8% to €524 million, reflecting the volume increase across business units. Higher raw material and fixed costs were mitigated by operational and commercial excellence. EBITDA also benefitted from one-time benefits of €24 million in total, consisting of the €7 million synergy benefit on post-retirement obligations in the former Cytec businesses and a €17 million indemnity received for the loss of some production assets in China. The underlying EBITDA margin remained stable at 18%.
Q4 2016
Scope Conversion forex
Volume & mix
Price
Q4 2017
708 -4 -38 +72 +9 747
FY 2016
Scope Conversion forex
Volume & mix
Price
FY 2017
2,668 -14 -44 +342 +14 2,966
Q4 underlying EBITDA up 11%: volume growth more than compensating for adverse forex
FY underlying EBITDA up 8%: higher volumes offsetting higher raw materials and fixed costs Recovery in the North American shale oil and gas market Benefiting from commercial and operational excellence initiatives in second half

28/02/2018 Fourth quarter & full year 2017 financial report 12/31
PERFORMANCE CHEMICALS
Key figures Underlying
(in € million) Q4 2017 Q4 2016 % yoy FY 2017 FY 2016 % yoy Net sales 679 645 +5.2% 2,766 2,581 +7.2%
Soda Ash & Derivatives 397 392 +1.4% 1,629 1,561 +4.4% Peroxides 150 136 +10% 600 542 +11% Coatis 106 93 +15% 410 346 +18% Functional Polymers 26 25 +2.5% 126 131 -3.8%
EBITDA 170 170 +0.4% 749 718 +4.3% EBITDA margin 25% 26% -1.2pp 27% 28% -0.7pp
Q4 yoy net sales bridge (in €million)
FY yoy net sales bridge (in €million)
Q4 2017 performance
Net sales reached €679 million, a 5% increase year on year, carried by 8% higher volumes, partly offset by -4% forex effects on conversion. Soda Ash & Derivatives sales volumes were up on sustained demand, especially on the seaborne market as Chinese exports dropped, while prices were slightly lower year on year. Sales of bicarbonate also grew, albeit at a slower pace, as the new plant in Thailand has fully ramped up. Peroxides sales were up 10%, reflecting the supply contract for the new HPPO plant in Saudi Arabia. Coatis sales were up 15% thanks to higher pricing for both phenols and solvents, while volumes benefitted from a recovery on the domestic Latin American market and decreased import pressure. In Functional Polymers, the retained polyamide activities in Latin America also benefitted from signs of recovery on the domestic market.
Underlying EBITDA was largely stable at €170 million. The strong impact of volumes was mostly offset by margin compression and to a lesser extent adverse forex. A relentless focus on cost optimization through operational excellence initiatives compensated for inflation and the added fixed costs of the new peroxide plant, but could not outweigh energy price increases, which pushed the underlying EBITDA margin down by 1.2 percentage point to 25%.
FY 2017 performance
Net sales grew 7% to €2,766 million on the back of higher volumes. In Soda Ash & Derivatives, sales increased by 4% thanks to higher soda ash volumes for the seaborne market, and despite slightly lower prices. Bicarbonate sales growth was even stronger, at a high single-digit, supported by the ramp-up of the new plant in Thailand in the first part of the year. Peroxides sales were up 11%, as the supply contract for the new HPPO plant in Saudi Arabia took effect in the start of the year and the new Chinese plant ramped up, offsetting lower sales in the bulk market and specialties. Coatis sales grew 18%, mainly thanks to a price increase policy and modest volume growth, showing signs of recovery in the domestic Latin American market. This was also the case for the retained polyamide activities in Latin America, which are part of the Functional Polymers business unit. The sales decrease is linked to the sale of a smaller residual PVC compounding activity in September 2017.
Underlying EBITDA rose 4%, to €749 million, reflecting volume growth, partly offset by higher energy costs, mainly in the second half of the year. Fixed costs grew as well due to the increased footprint in Peroxides, while inflation was compensated by operational excellence initiatives. The comparison is skewed by the €11 million one-time gain realized in 2016, owing to an asset optimization initiative at that time. The underlying EBITDA margin was 0.7 percentage point lower at 27%.
Q4 2016
Scope Conversion forex
Volume & mix
Price
Q4 2017
645 - -24 +54 +4 679
FY 2016
Scope Conversion forex
Volume & mix
Price
FY 2017
2,581 -16 +2 +196 +3 2,766
Q4 underlying EBITDA stable: volumes compensating for higher energy costs
FY underlying EBITDA up 4%: volume growth more than offsetting higher energy and fixed costs Strong demand for soda ash and bicarbonate partly eroded by higher energy costs Peroxide growth driven by new HPPO plant

28/02/2018 Fourth quarter & full year 2017 financial report 13/31
OUTLOOK 2018
Underlying EBITDA
At constant scope and relative to average 2017 forex levels, Solvay expects full year underlying EBITDA to grow 5% to 7% organically.
Advanced Materials to grow by double-digits:
Volume growth driven by the use of high-performance polymers in the automotive market, use of polymers in EV batteries and other electronic devices, and growing applications in the healthcare market.
Aerospace programs utilizing Solvay composites, including aircraft powered by the LEAP engine and the F-35 jet in military will support additional growth in the segment, along with reaching stability in the industrial composites markets after two years of decline.
Excellence initiatives across all businesses will further support profit growth in the segment.
Advanced Formulations to grow at a high single-digit:
Increased metal prices should stimulate mining production and therefore higher demand for technology solutions.
Modest improvement in oil and gas against a strong recovery in 2017, complemented by profit growth in home & personal care, and coatings markets, and supported by positive pricing power.
Performance Chemicals profitability to decrease around €(50) million:
Additional capacity in the soda ash market has been well anticipated and volumes are largely locked in for the year, albeit at modestly lower prices. Current higher energy costs are expected to compress margins, partly compensated by operational excellence.
Modest growth in peroxides, across businesses.
Corporate & Business Services are expected to remain broadly flat, reflecting continued cost discipline.
In the second quarter of 2018 additional one-time synergy benefits of approximately €20 million are expected to be generated on post-retirement obligations in the former Cytec businesses. These compare to the €38 million synergy benefits generated in the second quarter of 2017.
Notwithstanding the above underlying organic EBITDA growth of 5 to 7%, 2018 begins with headwinds from foreign currency. Assuming current exchange rates prevail for the full year, and in particular the US dollar at US$/€1.25, the underlying EBITDA will be materially impacted by conversion effects of around €(125) million.
Small realized divestments in Specialty Polymers and Technology Solutions in June 2017 and February 2018, will account for some €(30) million scope effects.
Other P&L elements
Underlying depreciation & amortization charges are expected to remain in line with the €(704) million in 2017, and exclude PPA amortization charges of approximately €(240) million.
Underlying net financial charges are expected at about €(350) million,
Underlying net cost of borrowings of around €(150) million, including Rusvinyl, a €50 million reduction resulting from the gross debt optimization;
Stable coupons on perpetual hybrid bonds of €(112) million;
Non-cash underlying discounting costs of approximately €(80) million, slightly lower due to the decrease in discount rates.
The underlying income tax rate is expected to decline further to around 26% from 27.5% in 2017, reflecting in large part the favorable impact of the tax reform in the US.
Cash flow elements
Including above-mentioned scope and forex elements, free cash flow from continuing operations is expected to exceed the 2017 level of €782 million.
Capex from continuing operations is expected to reduce further to depreciation level, i.e. approximately €(700) million.
The total net cash-out for provisions, is expected to increase to some €(390) million, and includes mainly:
Higher pensions and related payments of €(235)million;
Environmental provision payments stable at €(80) million;
Higher restructuring payments account for approximately €(80) million. Opportunities to accelerate restructurings and create additional value may impact annual spend levels, though would not likely impact the overall cash generation profile.
Net cash financing payments will reduce by more than €100 million to approximately €(250) million. The reduction is due to the gross debt optimization and the 2017 comparison base, which included one-time costs, such as €(25) million on the repurchase of senior bonds and such as the unwinding of currency swaps on intercompany financing.
With sustained free cash flow generation and proceeds of approximately €1.1 billion to be received on the completion of the Polyamide divestment to BASF, underlying net debt is expected to further reduce from €(5.3) billion to €(4.1) billion, bringing the underlying leverage ratio down from 2.2x to 1.9x.
Forex sensitivities
Solvay is mostly exposed to the US dollar, with the main sensitivities per US$/€0.10 change:
EBITDA sensitivity of about €(120) million based on the average rate in 2017 of US$/€1.13, with some 2/3 on conversion and 1/3 on transaction, the latter being mostly hedged.
Net debt sensitivity of about €140 m based on the rate at the end of 2017 of US$/€1.20.

28/02/2018 Fourth quarter & full year 2017 financial report 14/31
SUPPLEMENTARY INFORMATION
Reconciliation of alternative performance metrics
Solvay measures its financial performance using alternative performance metrics, which can be found below. Unless otherwise stated, 2016 data are presented on a restated basis, after discontinuation of Acetow, Vinythai and Polyamide. Solvay believes that these measurements are useful for analyzing and explaining changes and trends in its historical results of operations, as they allow performance to be compared on a consistent basis.
Tax rate Underlying (in € million) Q4 2017 Q4 2016 FY 2017 FY 2016
Profit for the period before taxes a 217 188 1,133 939
Earnings from associates & joint ventures b 19 19 71 69 Interests and realized foreign exchange gains (losses) on the RusVinyl joint venture
c (4) (4) (24) (26)
Income taxes d (60) (50) (299) (272)
Tax rate e = -d/(a-b-c) 29.7% 28.8% 27.5% 30.3%
Tax rate = Income taxes / (Result before taxes --- Earnings from associates & joint ventures --- Interests & realized foreign exchange results on the RusVinyl joint venture). The adjustment made to the denominator regarding associates and joint ventures is done because these contributions are already net of income taxes.
Research & innovation
(in € million) FY 2017 FY 2016 [1] IFRS research & development costs a (290) (305)
Grants netted in research & development costs b 26 33 Depreciation, amortization & impairments included in research & development costs c (55) (54) Capex in research & innovation d (64) (66)
Research & innovation e = a-b-c+d (325) (350) Advanced Materials (157) (155) Advanced Formulations (85) (87) Performance Chemicals (29) (26)
Corporate & Business Services (55) (52)
Net sales f 10,125 10,884
Advanced Materials 4,370 4,313 Advanced Formulations 2,966 2,668 Performance Chemicals 2,766 2,460
Corporate & Business Services 23 7
Research & innovation intensity g = -e/f 3.2% 3.2% Advanced Materials 3.6% 3.6% Advanced Formulations 2.9% 3.2%
Performance Chemicals 1.0% 1.1%
Research & innovation measures the total cash effort in research and innovation, regardless of whether the costs were expensed or capitalized. It consists of research & development costs from the income statement before netting of related subsidies and royalties, and where depreciation and amortization are replaced by related capital expenditure. Research & innovation intensity is the ratio of research & innovation to net sales.
[1] Research & Innovation reference 2016 figures are provided on a non-restated basis.

28/02/2018 Fourth quarter & full year 2017 financial report 15/31
Free cash flow
(in € million) Q4 2017 Q4 2016 FY 2017 FY 2016 Cash flow from operating activities a 649 660 1,604 1,788
of which cash flow related to acquisition of subsidiaries
b - (9) (23) 7
Cash flow from investing activities c (291) (422) 70 (807) of which capital expenditures required by share sale agreement
d (12) - (12) -
Acquisition (-) of subsidiaries e (15) (5) (44) (23) Acquisition (-) of investments - Other f 2 5 (11) 4 Loans to associates and non-consolidated companies g 3 (2) (7) (25) Sale (+) of subsidiaries and investments h (29) (163) 891 144 Income taxes paid on sale of investments i - - (14) -
Recognition of factored receivables j 21 - 21 - Free cash flow k = a-b+c-d-e-f-g-h-i-j 388 412 871 876
Free cash flow from discontinued operations l 52 89 89 218
Free cash flow from continuing operations m = k-l 336 323 782 658
Free cash flow measures cash flow from operating activities, net of investments. It excludes any M&A or financing related activities, but includes elements like dividends from associates and joint-ventures, pensions, restructuring costs, etc. It is defined as cash flow from operating activities (excluding cash flows from expenses incurred in connection with acquisitions of subsidiaries) and cash flow from investing activities (excluding cash flows from or related to acquisitions and disposals of subsidiaries and other investments, and excluding loans to associates and non-consolidated investments, as well as related tax elements and recognition of factored receivables).
Capital expenditure (capex)
(in € million) Q4 2017 Q4 2016 FY 2017 FY 2016 Acquisition (-) of tangible assets a (252) (272) (707) (883)
Acquisition (-) of intangible assets b (35) (30) (115) (98) Capex c = a+b (287) (302) (822) (981)
Capex flow from discontinued operations d (44) (49) (105) (141) Capex from continuing operations e = c-d (243) (252) (716) (839)
Advanced Materials (366) (435) Advanced Formulations (130) (134) Performance Chemicals (152) (191)
Corporate & Business Services (68) (79)
Underlying EBITDA f 494 480 2,230 2,075
Advanced Materials 1,202 1,110 Advanced Formulations 524 484 Performance Chemicals 749 718
Corporate & Business Services (244) (237)
Cash conversion g = (f+e)/f 51% 47% 68% 60% Advanced Materials 70% 61% Advanced Formulations 75% 72%
Performance Chemicals 80% 73%
Capital expenditure (capex) is cash paid for the acquisition of tangible and intangible assets.
Cash conversion is a ratio used to measure the conversion of EBITDA into cash. It is defined as (Underlying EBITDA + Capex from continuing operations) / Underlying EBITDA.

28/02/2018 Fourth quarter & full year 2017 financial report 16/31
Net working capital 2017 2016
(in € million) December
31 September
30 June 30
March 31
December 31
Inventories a 1,504 1,507 1,732 1,747 1,672
Trade receivables b 1,462 1,505 1,719 1,781 1,621 Other current receivables c 627 693 671 705 736 Trade payables d (1,330) (1,206) (1,475) (1,563) (1,547) Other current liabilities e (848) (882) (804) (1,078) (1,085)
Net working capital f = a+b+c+d+e 1,414 1,617 1,843 1,592 1,396
Sales [1] g 2,765 2,609 3,188 3,159 2,933
Annualized quarterly total sales [1] h = 4*g 11,060 10,436 12,753 12,638 11,731
Net working capital / sales [1] i = f / h 12.8% 15.5% 14.5% 12.6% 11.9% Year average j = µ(Q1,Q2,Q3,Q4) 13.8% 15.3%
Net working capital includes inventories, trade receivables and other current receivables, netted with trade payables and other current liabilities.
Net debt 2017 2016
(in € million) December
31 September
30 June 30
March 31
December 31
Non-current financial debt a (3,182) (3,190) (3,512) (4,039) (4,087)
Current financial debt b (1,044) (2,004) (1,820) (1,322) (1,338) Gross debt c = a+b (4,226) (5,194) (5,332) (5,361) (5,426)
Other financial instrument receivables d 89 498 637 99 101 Cash & cash equivalents e 992 1,358 1,156 1,094 969
Total cash and cash equivalents f = d+e 1,080 1,856 1,792 1,193 1,070 IFRS net debt g = c+f (3,146) (3,338) (3,540) (4,168) (4,356)
Perpetual hybrid bonds h (2,200) (2,200) (2,200) (2,200) (2,200)
Underlying net debt i = g+h (5,346) (5,538) (5,740) (6,368) (6,556)
Underlying EBITDA (last 12 months) [2] j 2,230 2,217 2,455 2,348 2,284
Adjustment for discontinued operations [3] k 236 235 - 158 235 Adjusted underlying EBITDA for leverage calculation [3]
l = j+k 2,466 2,453 2,455 2,506 2,519
Underlying leverage ratio [3] m = -i/l 2.2 2.3 2.3 2.5 2.6
(IFRS) net debt = Non-current financial debt + Current financial debt --- Cash & cash equivalents --- Other financial instrument receivables. Underlying net debt represents the Solvay share view of debt, reclassifying as debt 100% of the hybrid perpetual bonds, classified as equity under IFRS. Leverage ratio = Net debt / Underlying EBITDA of last 12 months. Underlying leverage ratio = Underlying net debt / Underlying EBITDA of last 12 months.
[1] The scope covered by sales corresponds to the scope of the net working capital, i.e. including Polyamide for June 30, 2017, March 31, 2017, and December 31, 2016. [2] The scope covered by underlying EBITDA corresponds to the scope of the net debt, i.e. including Polyamide for June 30, 2017, March 31, 2017, and December 31, 2016. [3] As net debt at the end of the period does not yet reflect the net proceeds to be received on the divestment of discontinued operations, whereas the underlying EBITDA
excludes the contribution of discontinued operations, the underlying EBITDA is adjusted to calculate the leverage ratio. For December and September 2017, Polyamide’s underlying EBITDA was added; for March 2017, Acetow’s was added; and for December 2016, Acetow’s and Vinythai’s were added.

28/02/2018 Fourth quarter & full year 2017 financial report 17/31
CFROI FY 2017 FY 2016 [1]
(in € million)
As publi-shed
Adjust-ment
As calcu-lated
As publi-shed
Adjust-ment
As calcu-lated
Underlying EBIT a 1,527 1,527 1,534 1,534
Underlying EBITDA b 2,230 2,230 2,284 2,284 Earnings from associates & joint ventures c 71 71 69 69 Dividends received from associates & joint ventures [2]
d 18 - 18 22 - 22
Recurring capex [3] e = -2%*l (326) (363) Recurring income taxes [4] f = -30%*(a-c) (437) (439)
Recurring "CFROI" cash flow data g = b-c+d+e+f 1,415 1,434 Advanced Materials 798 729 Advanced Formulations 335 307 Performance Chemicals 458 443 Functional Polymers - 119
Corporate & Business Services (176) (164)
Tangible assets h 5,433 6,472
Intangible assets i 2,940 3,600 Goodwill j 5,042 5,679
Replacement value of goodwill & fixed assets
[5][6] k = h+i+j 13,415 5,093 18,508 15,751 4,669 20,420
of which fixed assets l 16,314 18,134 Investments in associates & joint ventures [5] m 466 16 482 497 (52) 445 Net working capital [5] n 1,414 111 1,525 1,396 355 1,751
"CFROI" invested capital o = k+m+n 20,515 22,615 Advanced Materials 7,777 7,729 Advanced Formulations 4,972 5,074 Performance Chemicals 5,450 4,964 Functional Polymers - 2,350
Corporate & Business Services 2,315 2,499
CFROI p = g/o 6.9% 6.3% Advanced Materials 10% 9.4% Advanced Formulations 6.7% 6.1%
Performance Chemicals 8.4% 8.9%
Cash Flow Return On Investment measures the cash returns of Solvay’s business activities. Movements in CFROI levels are relevant indicators for showing whether economic value is being added, though it is accepted that this measure cannot be benchmarked or compared with industry peers. The definition uses a reasonable estimate of the replacement cost of assets and avoids accounting distortions, e.g. for impairments. It is calculated as the ratio between recurring cash flow and invested capital, where:
Recurring cash flow = Underlying EBITDA + Dividends from associates and joint ventures --- Earnings from associates and joint ventures + Recurring capex + Recurring income taxes;
Invested capital = Replacement value of goodwill & fixed assets + Net working capital + Carrying amount of associates and joint ventures;
Recurring capex is normalized at 2% of the replacement value of fixed assets net of goodwill values;
Recurring income tax is normalized at 30% of (Underlying EBIT --- Earnings from associates and joint ventures)
[1] CFROI 2016 reference figures are provided on a non-restated basis. [2] Excluding discontinued operations [3] Currently estimated at 2% of replacement value of fixed assets [4] Currently estimated at 30% of underlying EBIT [5] The adjustment reflects the quarterly average over the year. [6] The adjustment reflects the difference between the estimated replacement value of goodwill and fixed assets, and the accounting value. The changes over time come from
foreign exchange variations, new investments and portfolio moves.

28/02/2018 Fourth quarter & full year 2017 financial report 18/31
Reconciliation of underlying income statement indicators
Besides IFRS accounts, Solvay also presents underlying Income Statement performance indicators to provide a more consistent and comparable indication of Solvay’s economic performance. These figures adjust IFRS figures for the non-cash Purchase Price Allocation (PPA) accounting impacts related to acquisitions, for the coupons of perpetual hybrid bonds classified as equity under IFRS but treated as debt in the underlying statements, and for other elements to generate a measure that avoids distortion and facilitates the appreciation of performance and comparability of results over time.
Q4 consolidated income statement Q4 2017 Q4 2016
(in € million) IFRS Adjust-ments
Under-lying IFRS
Adjust-ments
Under-lying
Sales 2,765 - 2,765 2,586 - 2,586 of which revenues from non-core activities 285 - 285 155 - 155 of which net sales 2,480 - 2,480 2,431 - 2,431
Cost of goods sold (2,034) - (2,034) (1,892) 1 (1,891) Gross margin 731 - 731 694 1 695
Commercial & administrative costs (375) 10 (366) (354) 11 (343) Research & development costs (82) 1 (81) (74) 1 (74) Other operating gains & losses (47) 50 3 (54) 54 (1) Earnings from associates & joint ventures 13 6 19 28 (9) 19 Result from portfolio management & reassessments (10) 10 - (1) 1 - Result from legacy remediation & major litigations (27) 27 - (20) 20 -
EBITDA 457 37 494 483 (2) 480 Depreciation, amortization & impairments (253) 66 (187) (265) 81 (184)
EBIT 204 103 307 218 78 296 Net financial charges (86) (3) (90) (80) (29) (109)
Net cost of borrowings (59) 25 (34) (50) - (50) Coupons on perpetual hybrid bonds - (28) (28) - (28) (28) Interests and realized foreign exchange gains (losses) on the RusVinyl joint venture
- (4) (4) - (4) (4)
Cost of discounting provisions (28) 3 (24) (31) 5 (26) Result from available-for-sale financial assets - - - 2 (2) -
Profit for the period before taxes 118 99 217 138 50 188 Income taxes 206 (266) (60) 146 (195) (50)
Profit for the period from continuing operations 324 (167) 157 284 (146) 138 Profit (loss) for the period from discontinued operations
(39) 41 2 (14) 80 66
Profit for the period 285 (126) 159 270 (66) 204 attributable to Solvay share 269 (124) 145 245 (62) 183 attributable to non-controlling interests 16 (2) 14 25 (4) 21
Basic earnings per share (in €) 2.60 1.40 2.37 1.77
of which from continuing operations 2.98 1.38 2.64 1.22 Diluted earnings per share (in €) 2.58 1.39 2.36 1.76
of which from continuing operations 2.96 1.37 2.63 1.22

28/02/2018 Fourth quarter & full year 2017 financial report 19/31
EBITDA on an IFRS basis totaled €457 million, versus €494 million on an underlying basis. The difference of €37 million is explained by the following adjustments to IFRS results, which are done to improve the comparability of underlying results:
€6 million in ‘‘Earnings from associates & joint ventures’’ for Solvay’s share in the financial charges of the Rusvinyl joint venture and the foreign exchange losses on the €-denominated debt of the joint venture, following the devaluation of the Russian ruble over the quarter. These elements are reclassified in ‘‘Net financial charges’’.
€4 million to adjust for the ‘‘Result from portfolio management and reassessments’’, excluding depreciation, amortization and impairment elements. This result comprises €(11) million of restructuring costs and a €6 million net gain related to post-closing M&A adjustments.
€27 million to adjust for the ‘‘Result from legacy remediation and major litigations’’, mainly on environmental expenses.
EBIT on an IFRS basis totaled €204 million versus €307 million on an underlying basis. The difference of €103 million is explained by the above-mentioned €37 million adjustment at the EBITDA level and €66 million of ‘‘Depreciation, amortization & impairments’’. The latter consist of:
€60 million to adjust for the non-cash impact of purchase price allocation (PPA), consisting of amortization charges on intangible assets, which are adjusted in "Commercial & administrative costs" for €10 million, in "Research & development costs" for €1 million and in "Other operating gains & losses" for €49 million.
€6 million to adjust for the net impact of impairments, which are non-cash in nature and are reported in ‘‘Result from portfolio management and reassessments’’, mainly related to the shutdown of production assets in Asia.
Net financial charges on an IFRS basis were €(86) million versus €(90) million on an underlying basis. The €(3) million adjustment made to IFRS net financial charges consists of:
€25 million on net cost of borrowings related to a one-time net debt management cost, i.e. the tender offer on senior bonds in early October.
€(28) million reclassification of coupons on perpetual hybrid bonds, which are treated as dividends under IFRS, and as financial charges in underlying results.
€(4) million reclassification of financial charges and realized foreign exchange result on the €-denominated debt of RusVinyl as net financial charges. The €2 million delta with the adjustment made to EBITDA is attributed to unrealized foreign exchange losses.
Income taxes on an IFRS basis were €206 million positive, versus charges of €(60) million on an underlying basis. The €(266) million adjustment consists of:
€(43) million to adjust for the tax impacts of the adjustments made to the underlying result before taxes (as described above).
€(223) million to adjust for tax elements related to prior periods, mainly resulting from the recognition of deferred tax assets in France for €202 million and the net impact triggered by the US tax reform of €49 million.
Discontinued operations generated a loss of €(39) million on an IFRS basis and €2 million on an underlying basis. The €41 million adjustment made to the IFRS profit adjusts mainly for the negative impact of post-closing warranties related to the disposal of the Pharma business.
Profit attributable to Solvay share on an IFRS basis was €269 million, and €145 million on an underlying basis. The delta of €(124) million reflects the above-mentioned adjustments to EBIT, net financial charges, income taxes and discontinued operations, totaling €(126) million, minus the impact of €(2) million these had on the profit attributable to non-controlling interests.

28/02/2018 Fourth quarter & full year 2017 financial report 20/31
FY consolidated income statement FY 2017 FY 2016
(in € million) IFRS Adjust-ments
Under-lying IFRS
Adjust-ments
Under-lying
Sales 10,891 - 10,891 10,045 - 10,045 of which revenues from non-core activities 766 - 766 476 - 476 of which net sales 10,125 - 10,125 9,569 - 9,569
Cost of goods sold (7,805) 2 (7,803) (7,213) 84 (7,129) Gross margin 3,086 2 3,088 2,831 84 2,915
Commercial & administrative costs (1,437) 42 (1,396) (1,363) 50 (1,313) Research & development costs (290) 3 (288) (284) 3 (282) Other operating gains & losses (154) 205 51 (200) 214 14 Earnings from associates & joint ventures 44 27 71 85 (16) 69 Result from portfolio management & reassessments (188) 188 - (157) 157 - Result from legacy remediation & major litigations (84) 84 - (54) 54 -
EBITDA 2,029 201 2,230 1,932 143 2,075 Depreciation, amortization & impairments (1,054) 350 (704) (1,074) 402 (672)
EBIT 976 551 1,527 858 545 1,403 Net financial charges (298) (96) (394) (334) (130) (464)
Net cost of borrowings (201) 32 (170) (224) - (224) Coupons on perpetual hybrid bonds (111) (111) - (111) (111) Interests and realized foreign exchange gains (losses) on the RusVinyl joint venture
(24) (24) - (26) (26)
Cost of discounting provisions (97) 8 (89) (115) 12 (103) Result from available-for-sale financial assets - - - 5 (5) -
Profit for the period before taxes 678 455 1,133 524 415 939 Income taxes 197 (496) (299) 68 (340) (272)
Profit for the period from continuing operations 875 (42) 834 592 75 667 Profit (loss) for the period from discontinued operations
241 (82) 159 82 158 240
Profit for the period 1,116 (124) 992 674 233 907 attributable to Solvay share 1,061 (122) 939 621 225 846 attributable to non-controlling interests 56 (2) 54 53 7 61
Basic earnings per share (in €) 10.27 9.08 6.01 8.19
of which from continuing operations 7.97 7.59 5.34 6.02 Diluted earnings per share (in €) 10.19 9.02 5.99 8.17
of which from continuing operations 7.92 7.53 5.33 6.01

28/02/2018 Fourth quarter & full year 2017 financial report 21/31
EBITDA on an IFRS basis totaled €2,029 million, versus €2,230 million on an underlying basis. The difference of €201 million is explained by the following adjustments to IFRS results, which are done to improve the comparability of underlying results:
€2 million for legacy acquisition costs, in this case the Chemlogics retention premiums, which are adjusted in "Commercial & administrative costs".
€27 million in ‘‘Earnings from associates & joint ventures’’ for Solvay’s share in the financial charges of the Rusvinyl joint venture and the foreign exchange losses on the €-denominated debt of the joint venture, following the devaluation of the Russian ruble over the year. These elements are reclassified in ‘‘Net financial charges’’.
€88 million to adjust for the ‘‘Result from portfolio management and reassessments’’, excluding depreciation, amortization and impairment elements. This result comprises €(48) million of restructuring costs and the €(72) million impact from the deconsolidation of the Venezuelan silica plant, of which €(60) million came from recycling currency translation adjustments through the P&L. These impacts were mitigated by €32 million net capital gains on multiple smaller divestments.
€84 million to adjust for the ‘‘Result from legacy remediation and major litigations’’, mainly on environmental expenses.
EBIT on an IFRS basis totaled €976 million, versus €1,527 million on an underlying basis. The difference of €551 million is explained by the above-mentioned €201 million adjustments at the EBITDA level and €350 million of ‘‘Depreciation, amortization & impairments’’. The latter consist of:
€250 million to adjust for the non-cash impact of purchase price allocation (PPA), consisting of amortization charges on intangible assets, which are adjusted in "Cost of goods sold" for €2 million, "Commercial & administrative costs" for €40 million, in "Research & development costs" for €3 million, and in "Other operating gains & losses" for €205 million.
€100 million to adjust for the net impact of impairments, which are non-cash in nature and are reported in ‘‘Result from portfolio management and reassessments’’, of which €(91) million is related to the retained polyamide assets in Latin America.
Net financial charges on an IFRS basis were €(298) million versus €(394) million on an underlying basis. The €(96) million adjustment made to IFRS net financial charges consists of:
€32 million on net cost of borrowings, mainly related to a one-time net debt management cost, i.e. the tender offer on senior bonds in early October
€(111) million reclassification of coupons on perpetual hybrid bonds, which are treated as dividends under IFRS, and as financial charges in underlying results.
€(24) million reclassification of financial charges and realized foreign exchange result on the €-denominated debt of RusVinyl as net financial charges. The €3 million delta with the adjustment made to EBITDA is attributed to unrealized foreign exchange losses.
€8 million for the net impact of decreasing discount rates on the valuation of environmental liabilities in the period.
Income taxes on an IFRS basis were €197 million positive, versus charges of €(299) million on an underlying basis. The €(496) million adjustment includes mainly:
€(168) million to adjust for the tax impacts of the adjustments made to the underlying result before taxes (as described above).
€(328) million to adjust for tax elements related to prior periods, mainly €202 million resulting from the recognition of deferred tax assets in France and €49 million net impact triggered by the US tax reform.
Discontinued operations generated a profit of €241 million on an IFRS basis and €159 million on an underlying basis. The €(82) million adjustment made to the IFRS profit adjusts mainly for:
€204 million capital gain on the divestment of Acetow and Vinythai.
€(46) million expenses related to the divestment of the polyamide activities.
€(36) million costs related to post-closing adjustments on the pharma divestment in 2010.
Profit attributable to Solvay share was €1,061 million on an IFRS basis and €939 million on an underlying basis. The delta of €(122) million reflects the above-mentioned adjustments to EBIT, net financial charges, income taxes and discontinued operations, totaling €(124) million, minus the impact of €(2) million these had on the profit attributable to non-controlling interests.
February 28, 2018 Fourth quarter & full year 2017 financial report 22/31
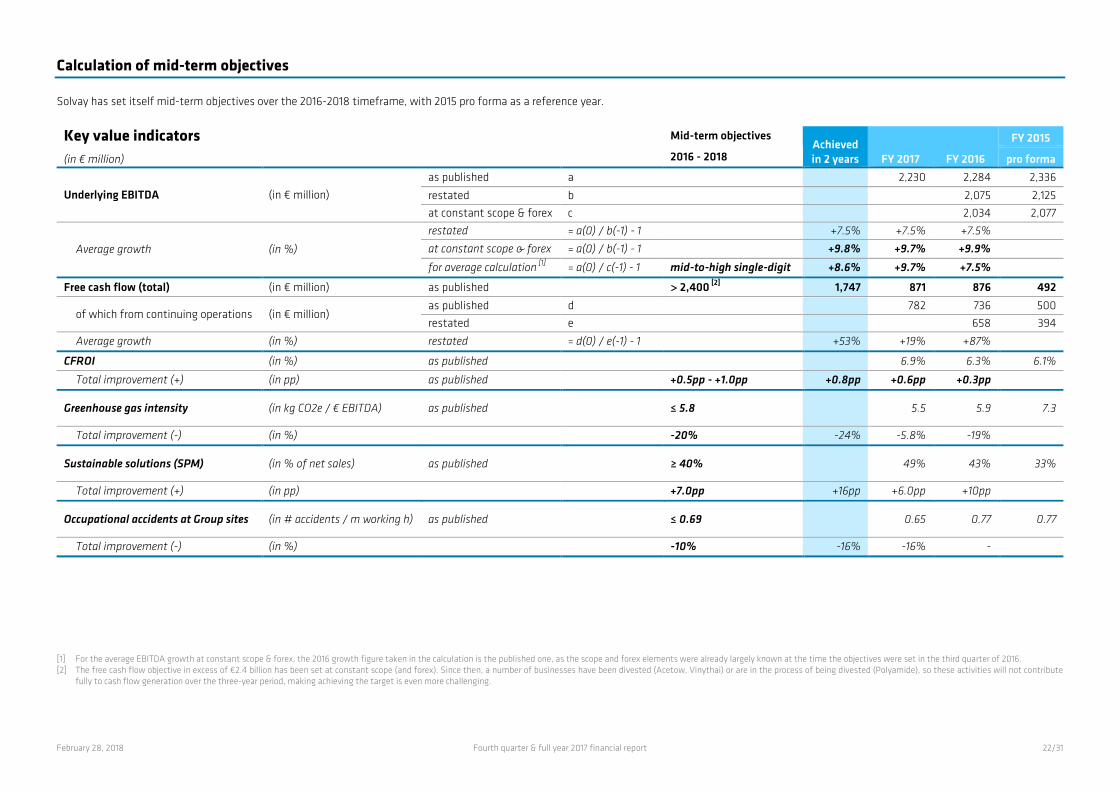
Calculation of mid-term objectives
Solvay has set itself mid-term objectives over the 2016-2018 timeframe, with 2015 pro forma as a reference year.
Key value indicators Mid-term objectives Achieved in 2 years FY 2017 FY 2016
FY 2015
(in € million) 2016 - 2018 pro forma
Underlying EBITDA (in € million) as published a 2,230 2,284 2,336
restated b 2,075 2,125 at constant scope & forex c 2,034 2,077
Average growth (in %)
restated = a(0) / b(-1) - 1 +7.5% +7.5% +7.5%
at constant scope & forex = a(0) / b(-1) - 1 +9.8% +9.7% +9.9% for average calculation [1] = a(0) / c(-1) - 1 mid-to-high single-digit +8.6% +9.7% +7.5%
Free cash flow (total) (in € million) as published > 2,400 [2] 1,747 871 876 492
of which from continuing operations (in € million) as published d 782 736 500 restated e 658 394
Average growth (in %) restated = d(0) / e(-1) - 1 +53% +19% +87%
CFROI (in %) as published 6.9% 6.3% 6.1%
Total improvement (+) (in pp) as published +0.5pp - +1.0pp +0.8pp +0.6pp +0.3pp
Greenhouse gas intensity (in kg CO2e / € EBITDA) as published ≤ 5.8 5.5 5.9 7.3
Total improvement (-) (in %) -20% -24% -5.8% -19%
Sustainable solutions (SPM) (in % of net sales) as published ≥ 40% 49% 43% 33%
Total improvement (+) (in pp) +7.0pp +16pp +6.0pp +10pp
Occupational accidents at Group sites (in # accidents / m working h) as published ≤ 0.69 0.65 0.77 0.77
Total improvement (-) (in %) -10% -16% -16% -
[1] For the average EBITDA growth at constant scope & forex, the 2016 growth figure taken in the calculation is the published one, as the scope and forex elements were already largely known at the time the objectives were set in the third quarter of 2016. [2] The free cash flow objective in excess of €2.4 billion has been set at constant scope (and forex). Since then, a number of businesses have been divested (Acetow, Vinythai) or are in the process of being divested (Polyamide), so these activities will not contribute
fully to cash flow generation over the three-year period, making achieving the target is even more challenging.

28/02/2018 Fourth quarter & full year 2017 financial report 23/31
CONDENSED CONSOLIDATED FINANCIAL STATEMENTS
Consolidated income statement IFRS
(in € million) Q4 2017 Q4 2016 FY 2017 FY 2016 Sales 2,765 2,586 10,891 10,045
of which revenues from non-core activities 285 155 766 476 of which net sales 2,480 2,431 10,125 9,569
Cost of goods sold (2,034) (1,892) (7,805) (7,213) Gross margin 731 694 3,086 2,831
Commercial & administrative costs (375) (354) (1,437) (1,363) Research & development costs (82) (74) (290) (284) Other operating gains & losses (47) (54) (154) (200) Earnings from associates & joint ventures 13 28 44 85 Result from portfolio management & reassessments (10) (1) (188) (157) Result from legacy remediation & major litigations (27) (20) (84) (54)
EBIT 204 218 976 858 Cost of borrowings (48) (44) (172) (187) Interest on lendings & deposits 4 4 15 13 Other gains & losses on net indebtedness (15) (11) (44) (50) Cost of discounting provisions (28) (31) (97) (115) Result from available-for-sale financial assets - 2 - 5
Profit for the period before taxes 118 138 678 524 Income taxes 206 146 197 68
Profit for the period from continuing operations 324 284 875 592 Profit (loss) for the period from discontinued operations (39) (14) 241 82
Profit for the period 285 270 1,116 674 attributable to Solvay share 269 245 1,061 621
attributable to non-controlling interests 16 25 56 53
Weighted average of number of outstanding shares, basic 103,412,650 103,124,034 103,351,807 103,294,396
Weighted average of number of outstanding shares, diluted 104,133,128 103,686,376 104,084,395 103,609,369
Basic earnings per share (in €) 2.60 2.37 10.27 6.01
of which from continuing operations 2.98 2.64 7.97 5.34 Diluted earnings per share (in €) 2.58 2.36 10.19 5.99
of which from continuing operations 2.96 2.63 7.92 5.33
Consolidated statement of comprehensive income IFRS
(in € million) Q4 2017 Q4 2016 FY 2017 FY 2016 Profit for the period 285 270 1,116 674
Other comprehensive income, net of related tax effects (153) 719 (684) 155 Recyclable components (118) 428 (816) 374
Gains and losses on available-for-sale financial assets - (2) (1) 9 Gains and losses on hedging instruments in a cash flow hedge (10) 14 15 36 Currency translation differences from subsidiaries & joint operations (101) 387 (790) 278 Currency translation differences from associates & joint ventures (7) 28 (40) 51
Non-recyclable components (112) 273 95 (275) Remeasurement of the net defined benefit liability [1] (112) 273 95 (275)
Income tax relating to components of other comprehensive income 77 18 37 56 Total comprehensive income 132 989 433 830
attributed to Solvay share 114 948 412 762
attributed to non-controlling interests 17 41 20 67
[1] The remeasurement of the net defined benefit liability of €95 million for FY 2017 mainly relates to the good performance of plan assets that more than offset the drop in discount rate in the US and UK at the end of the year.

28/02/2018 Fourth quarter & full year 2017 financial report 24/31
Consolidated statement of cash flows IFRS
(in € million) Q4 2017 Q4 2016 FY 2017 FY 2016 Profit for the period 285 270 1,116 674
Adjustments to profit for the period 181 215 1,100 1,554 Depreciation, amortization & impairments (-) 253 296 1,152 1,302 Earnings from associates & joint ventures (-) (13) (28) (44) (86) Net financial charges & result from available-for-sale financial assets (-) 88 87 302 374 Income tax expenses (-) (157) (132) (131) (21) Other non-operating and non-cash items [1] 10 (9) (179) (16)
Changes in working capital 228 199 (216) (99) Changes in provisions (21) 4 (192) (151) Dividends received from associates & joint ventures 4 5 18 22 Income taxes paid (excluding income taxes paid on sale of investments) (29) (33) (223) (212)
Cash flow from operating activities 649 660 1,604 1,788 of which cash flow related to acquisition of subsidiaries - (9) (23) 7
Acquisition (-) of subsidiaries (15) (5) (44) (23)
Acquisition (-) of investments - Other 2 5 (11) 4 Loans to associates and non-consolidated companies 3 (2) (7) (25) Sale (+) of subsidiaries and investments (29) (163) 891 144 Income taxes paid on sale of investments - - (14) - Acquisition (-) of tangible and intangible assets (capex) (287) (302) (822) (981)
of which tangible assets (252) (272) (707) (883) of which capital expenditures required by share sale agreement (12) - (12) -
of which intangible assets (35) (30) (115) (98) Sale (+) of tangible & intangible assets 11 19 75 76
of which cash flow related to the sale of real estate in the context of restructuring, dismantling or remediation
8 5 12 35
Dividends from available-for-sale financial assets (1) - 2 - Changes in non-current financial assets 26 26 (1) (2)
Cash flow from investing activities (291) (422) 70 (807) Sale (acquisition) of treasury shares (19) 10 (14) (55) Increase in borrowings 934 530 1,692 1,133 Repayment of borrowings (1,851) (699) (2,584) (2,300) Changes in other current financial assets 390 (46) (27) (50) Net interests paid (111) (50) (255) (216) Coupons paid on perpetual hybrid bonds (27) (26) (111) (84) Dividends paid (35) (37) (396) (386)
of which to Solvay shareholders - - (357) (337) of which to non-controlling interests (35) (37) (39) (49)
Other 1 25 13 7
Cash flow from financing activities (718) (291) (1,684) (1,951)
Net change in cash and cash equivalents (361) (53) (10) (970) Currency translation differences (6) 25 (52) (13) Opening cash balance 1,358 1,081 1,054 2,037
Closing cash balance 992 1,054 992 1,054 of which cash in assets held for sale - 85 - 85
[1] The increase in FY 2017 is largely related to the capital gain on the Acetow divestment of €180 million and the €(72) million deconsolidation impact of the Venezuelan plant.

28/02/2018 Fourth quarter & full year 2017 financial report 25/31
Statement of cash flow from discontinued operations IFRS
(in € million) Q4 2017 Q4 2016 FY 2017 FY 2016 Cash flow from operating activities 84 135 183 351
Cash flow from investing activities [1] (44) (47) (105) (166) Cash flow from financing activities - (5) (1) (67)
Net change in cash and cash equivalents 40 84 77 118
Consolidated statement of financial position IFRS
(in € million)
December 31,
2017
December 31,
2016 Non-current assets 15,394 17,548
Intangible assets 2,940 3,600 Goodwill 5,042 5,679 Tangible assets 5,433 6,472 Available-for-sale financial assets 44 44 Investments in associates & joint ventures 466 497 Other investments 47 55 Deferred tax assets 1,076 890 Loans & other assets 346 312
Current assets 6,057 6,597 Inventories 1,504 1,672 Trade receivables 1,462 1,621 Income tax receivables 100 166 Dividends receivable - 2 Other financial instrument receivables 89 101 Other receivables 627 736 Cash & cash equivalents 992 969 Assets held for sale 1,284 1,331
Total assets 21,451 24,145
Total equity 9,752 9,956 Share capital 1,588 1,588 Reserves 8,051 8,118 Non-controlling interests 113 250
Non-current liabilities 7,571 9,188 Provisions for employee benefits 2,816 3,118 Other provisions 793 860 Deferred tax liabilities 600 909 Financial debt 3,182 4,087 Other liabilities 180 214
Current liabilities 4,128 5,001 Other provisions 281 291 Financial debt 1,044 1,338 Trade payables 1,330 1,547 Income tax payables 129 197 Dividends payable 147 139 Other liabilities 848 1,085 Liabilities associated with assets held for sale 349 403
Total equity & liabilities 21,451 24,145
[1] The cash flow from investing activities of discontinued operations excludes the proceeds received on the divestment of Acetow and Vinythai.

February 28, 2018 Fourth quarter & full year 2017 financial report 26/31
Consolidated statement of changes in equity Revaluation reserve
(fair value) IFRS
(in € million) Share capital
Share premiums
Treasury shares
Perpetual hybrid bonds
Retained earnings
Currency translation differences
Available-for-sale financial
assets Cash flow
hedges
Defined benefit pension
plans Total
reserves
Non-controlling interests
Total equity
Balance on December 31, 2015 1,588 1,170 (230) 2,188 5,720 (353) (2) (28) (630) 7,835 245 9,668
Profit for the period - - - - 621 - - - - 621 53 674
Items of other comprehensive income - - - - - 313 10 23 (205) 141 14 155 Comprehensive income - - - - 621 313 10 23 (205) 762 67 830 Cost of stock options - - - - 9 - - - - 9 - 9 Dividends - - - - (336) - - - - (336) (45) (381) Coupons of perpetual hybrid bonds - - - - (84) - - - - (84) - (84) Sale (acquisition) of treasury shares - - (44) - (13) - - - - (57) - (57)
Other - - - - (19) - - - 7 (12) (17) (29)
Balance on December 31, 2016 1,588 1,170 (274) 2,188 5,899 (39) 8 (5) (828) 8,118 250 9,956
Profit for the period - - - - 1,061 - - - - 1,061 56 1,116
Items of other comprehensive income [1] - - - - - (795) (3) 22 128 (649) (35) (684) Comprehensive income - - - - 1,061 (795) (3) 22 128 412 20 433 Cost of stock options - - - - 10 - - - - 10 - 10 Dividends - - - - (363) - - - - (363) (41) (404) Coupons of perpetual hybrid bonds - - - - (111) - - - - (111) - (111) Sale (acquisition) of treasury shares - - (7) - (7) - - - - (14) - (14) Other [2] - - - - (33) - - - 34 1 (117) (116)
Balance on December 31, 2017 1,588 1,170 (281) 2,188 6,454 (834) 5 16 (666) 8,051 113 9,752
[1] The €(795) million reduction in equity related to currency translation differences is the result of €(921) million of translation differences (mainly US$ decrease versus €), partly offset by €126 million recycling of CTAs, following the closing of several divestments
and the deconsolidation of the Venezuelan plant. [2] The €(117) million reduction in equity related to non-controlling interest results mainly from the completion of the Vinythai divestment.
February 28, 2018 Fourth quarter & full year 2017 financial report 27/31
NOTES TO THE IFRS ACCOUNTS
1. General information
Solvay is a public limited liability company governed by Belgian law and quoted on Euronext Brussels and Euronext Paris. These condensed consolidated interim financial statements were authorized for issue by the Board of Directors on February 27, 2018.
On January 4, 2017, Solvay agreed to sell its formulated resins business to Altana AG’s Elantas PDG Inc. Under the agreement, Solvay’s Technology Solutions global business unit has divested the business line, which generated sales of €17 million in 2016. The divestment includes the formulated resins product portfolio, the manufacturing and R&D facility based in Olean, New York, US, and all associated technical, commercial and administrative staff. Completion of the transaction was subject to customary closing conditions, including antitrust approvals, and occurred on June 1, 2017. The assets of the business were presented as assets held for sale until completion of the transaction, which had no material impact on the result in the period.
On February 1, 2017, Solvay announced the acquisition of Energain™ Li-Ion high voltage technology from DuPont for €13 million. Energain™ technology and formulations enlarge Solvay Special Chem Global Business Unit's existing portfolio of high performance salts and additives for electrolytes and strengthen its capabilities to develop further innovative high-voltage solutions for Li-ion batteries.
On February 23, 2017, Solvay completed the divestment of its 58.77% stake in its Thai subsidiary, Vinythai PCL, to Japanese company AGC Asahi Glass. The assets and liabilities of the business were presented as assets held for sale and associated liabilities in December 2016, following the announcement of the intended divestment. The transaction was based on a total enterprise value of 16.5 billion Thai baht, €435 million, and triggered a capital gain of €24 million, recognized in discontinued operations.
On March 24, 2017, Solvay signed a definitive agreement to sell its 25.1% shares in National Peroxide Limited (BOM:500298) to the Wadia Group, a conglomerate of corporate India and promoter shareholder of National Peroxide Limited. The transaction was closed in March with a capital gain of €13 million.
On March 30, 2017, Solvay signed a definitive agreement to sell its polyolefin cross-linkable compounds business in Italy to family-owned group Finproject SpA. Based in Roccabianca, Parma, the business makes compounds that are used in applications in the wire and cable, as well as pipe industries, generating sales of €82 million in 2016. Finproject is a leading manufacturer of injection molded foam, polyolefin-based compounds and PVC compounds. The transaction was subject to customary closing conditions and closed on June 8, 2017. The assets of the business were presented as assets held for sale until completion of the transaction, which triggered a capital gain of €43 million.
On May 31, 2017, Solvay completed the divestment of its cellulose acetate tow business, Acetow, to private equity funds managed by Blackstone. The assets and liabilities of the business were presented as assets held for sale and associated liabilities in December 2016, following the announcement of the intended divestment. The transaction was based on an enterprise value of around €1 billion, resulting in net financial debt reduction of some €734 million and capital gain of €180 million recognized in discontinued operations, subject to potential post-closing adjustments.
Solvay has deconsolidated its investment in Venezuela triggered by the political situation in the country, and consequently a loss of €(72) million, mainly related to the €(60) million recycling of CTAs, has been recognized in the second quarter.
On July 5, 2017, Solvay agreed to sell its 50% stake in Dacarto Benvic to its joint venture partner which will become the sole owner of the Brazilian PVC compounder. The transaction led to an impairment of €(5) million in the second quarter and €(8) million of CTA recycling, and was completed on September 14, 2017.
On September 19, 2017, Solvay announced that it had entered into a binding agreement with German chemical company BASF for the sale of its Polyamides business. Under the proposed terms of the agreement, the transaction is based on an enterprise value of €1.6 billion. The expected net cash proceeds are estimated to be around €1.1 billion. The polyamide business planned to be divested has been reclassified to assets and liabilities held for sale and discontinued operations at the end of the third quarter. As a result of the discontinuation, the retained Latin American polyamide business incurred an impairment of €(91) million recognized at the end of September. This impairment is expected to be more than compensated by the capital gain on the transaction at the closing. Solvay and BASF aim to close the transaction in the second half of 2018, after customary regulatory approvals have been obtained.
On September 21, 2017, Solvay launched a cash tender offer to repurchase bonds on the senior US$400 million debt at 3.5%, due in 2023, the senior US$250 million debt at 3.95%, due in 2025, and the senior €500 million debt at 4.625%, due in 2018. On September 28, 2017, Solvay published the final results of the repurchase operation related to the aforementioned issuances. It committed to repurchase 51% of the outstanding aggregate principal amount of the US$400 million senior bonds due in 2023 for a total amount of US$204 million, 34.6% of the outstanding aggregate principal amount of the US$250 million senior bonds due in 2025 for a total amount of US$87 million, and 23.6% of the outstanding aggregate principal amount of the €500 million senior bonds due in 2018 for a total amount of €118 million. The repurchase closed on October 2, 2017, for a total amount of €(376) million, and resulted in an expense of € (25) million of which an accretion (acceleration) amounting to € (10) million and premiums amounting to € (15) million.
February 28, 2018 Fourth quarter & full year 2017 financial report 28/31
On November 7, 2017, Solvay completed the acquisition of European Carbon Fiber GmbH (ECF), a German producer of high-quality precursor for large-tow (50K) polyacrylonitrile (PAN) carbon fibers.
On November 15, 2017, Solvay agreed to sell its US facility in Charleston, South Carolina, and the phosphorus derivatives-based products made at the plant, to German specialty chemicals company Lanxess. Employees at the site will also be transferred. The products at the site are used primarily as intermediates in plastic additives, flame retardants and agricultural applications. The business represents sales of approximately €65 million. The transaction was completed on February 8, 2018.
2. Accounting policies
Solvay prepares its consolidated interim financial statements on a quarterly basis, in accordance with IAS 34 Interim Financial Reporting. They do not include all the information required for the preparation of the annual consolidated financial statements and should be read in conjunction with the consolidated financial statements for the year ended December 31, 2016.
The consolidated financial statements for the year ended December 31, 2017, were prepared using the same accounting policies as those adopted for the preparation of the consolidated financial statements for the year ended December 31, 2016.

February 28, 2018 Fourth quarter & full year 2017 financial report 29/31
3. Segment information
Solvay is organized in the following operating segments:
Advanced Materials offers high-performance materials for multiple applications primarily in the automotive, aerospace, electronics, and health markets. It particularly provides sustainable mobility solutions, reducing weight and improving CO2 and energy efficiency.
Advanced Formulations primarily serves the consumer goods, agro and food, as well as energy markets. It offers customized specialty formulations that impact surface chemistry and alter liquid behavior to optimize efficiency and yield, while minimizing environmental impact.
Performance Chemicals operates in mature and resilient markets and has leading positions in chemical intermediates. Success is based on economies of scale and state-of-the-art production technology. It mainly serves the consumer goods and food markets. As from Q3 2017, Performance Chemicals also encompasses the remaining business activities previously included in the Functional Polymers segment: following the signing of the binding agreement with German chemical company BASF for the sale of its Polyamides business in September, 2017, those polyamide activities, which constituted the major part of Functional Polymers, were reclassified to discontinued operations. Comparative periods have been reworked accordingly: fourth quarter 2016 net sales increased by €22 million and underlying EBITDA by €2 million; full year net sales went up €121 million and underlying EBITDA €23 million.
Corporate & Business Services includes corporate and other business services, such as the Research & Innovation Center. It also incorporates the Energy Services GBU, whose mission is to optimize energy consumption and reduce CO2 emissions.
Reconciliation of segment, underlying and IFRS data
(in € million) Q4 2017 Q4 2016 FY 2017 FY 2016 Net sales 2,480 2,431 10,125 9,569
Advanced Materials 1,047 1,076 4,370 4,313 Advanced Formulations 747 708 2,966 2,668 Performance Chemicals 679 645 2,766 2,581
Corporate & Business Services 7 1 23 7
Underlying EBITDA 494 480 2,230 2,075 Advanced Materials 260 259 1,202 1,110 Advanced Formulations 138 124 524 484 Performance Chemicals 170 170 749 718
Corporate & Business Services (74) (72) (244) (237)
Underlying depreciation, amortization & impairments (187) (184) (704) (672)
Underlying EBIT 307 296 1,527 1,403 Non-cash accounting impact from amortization & depreciation of purchase price allocation (PPA) from acquisitions [1]
(60) (66) (250) (341)
Other legacy costs related to changes in portfolio (e.g. retention premiums) - (1) (2) (9) Net financial charges and remeasurements of equity book value of the RusVinyl joint venture
(6) 9 (27) 16
Result from portfolio management & reassessments (10) (1) (188) (157) Result from legacy remediation & major litigations (27) (20) (84) (54)
EBIT 204 218 976 858 Net financial charges (86) (80) (298) (334)
Profit for the period before taxes 118 138 678 524 Income taxes 206 146 197 68
Profit for the period from continuing operations 324 284 875 592 Profit (loss) for the period from discontinued operations (39) (14) 241 82
Profit for the period 285 270 1,116 674 attributable to non-controlling interests 16 25 56 53
attributable to Solvay share 269 245 1,061 621
[1] The non-cash PPA impacts can be found in the reconciliation table on pages 18 to 21. For Q4 2017 these consist of €(60) million of amortization of intangible assets, which are
adjusted in "Commercial & administrative costs" for €10 million, in "Research & development costs" for €1 million, and in "Other operating gains & losses" for €50 million. For FY 2017 these consist of €(250) million of amortization of intangible assets, which are adjusted in "Cost of goods sold" for €2 million, in "Commercial & administrative costs" for €40 million, in "Research & development costs" for €3 million, and in "Other operating gains & losses" for €205 million.
February 28, 2018 Fourth quarter & full year 2017 financial report 30/31
4. Financial Instruments
a) Valuation techniques
Compared to December 31, 2016, there are no changes in valuation techniques.
b) Fair value of financial instruments measured at amortized cost
For all financial instruments not measured at fair value in Solvay’s consolidated statement of financial position, the fair value of those financial instruments as of December 31, 2017, is not significantly different from the ones published in Note F32 of the consolidated financial statements for the year ended December 31, 2016.
c) Financial instruments measured at fair value
For financial instruments measured at fair value in Solvay’s consolidated statement of financial position, the fair value of those instruments as of December 31, 2017, is not significantly different from the ones as published in the Note F32 of the consolidated financial statements for the year ended December 31, 2016.
5. Events after the reporting period
On February 7, Solvay has completed the sale of its U.S. facility in Charleston, South Carolina, and the phosphorus derivatives-based products made at the plant, to German specialty chemicals company Lanxess for US$68 million, leading to an estimated capital gain of US$20 million.
6. Declaration by responsible persons
Jean-Pierre Clamadieu, Chief Executive Officer, and Karim Hajjar, Chief Financial Officer, of the Solvay Group, declare that to the best of their knowledge:
The consolidated interim financial information, prepared in accordance with IAS 34 Interim Financial Reporting as adopted by the European Union, reflects a faithful image of the assets and liabilities, financial situation and results of the Solvay Group;
The management report contains a faithful presentation of significant events occurring during the full year 2017, and their impact on the consolidated interim financial information;
The main risks and uncertainties are in accordance with the assessment disclosed in the Risk Management section of the Solvay 2016 Annual Report, taking into account the current economic and financial environment .
7. Auditor report
Deloitte confirmed that the fieldwork related to the audit of the consolidated financial statements of Solvay SA/NV (‘‘the company’’) and its subsidiaries (jointly ‘‘the Group’’), prepared in accordance with International Financial Reporting Standards as adopted by the European Union, and with the legal and regulatory requirements applicable in Belgium, is substantially completed. Deloitte confirmed that the financial information shown in this press release requires no comments on its part and is in agreement with the consolidated financial statements of the Group.
Deloitte also confirmed that it has reviewed the alternative performance indicators and its compliance with the glossary published by the Company.
Deloitte confirmed that it will issue an unqualified reasonable assurance opinion on the information shown on the extra-financial priority domains ‘‘GHG intensity’’, ‘‘Sustainable solutions’’ and ‘‘Accident rate’’, which is prepared in accordance with Solvay’s Reporting Framework.
The complete audit report related to the audit of the consolidated financial statements and of the social, environmental and other sustainable development information will be shown in the 2017 Annual Report that will be published on the Internet (www.solvay.com) on March 30, 2018.

28/02/2018 Fourth quarter & full year 2017 financial report 31/31
Safe harbor
This press release may contain forward-looking information. Forward-looking statements describe expectations, plans, strategies, goals, future events or intentions. The achievement of forward-looking statements contained in this press release is subject to risks and uncertainties relating to a number of factors, including general economic factors, interest rate and foreign currency exchange rate fluctuations, changing market conditions, product competition, the nature of product development, impact of acquisitions and divestitures, restructurings, products withdrawals, regulatory approval processes, all-in scenario of R&I projects and other unusual items.
Consequently, actual results or future events may differ materially from those expressed or implied by such forward-looking statements. Should known or unknown risks or uncertainties materialize, or should our assumptions prove inaccurate, actual results could vary materially from those anticipated. The Company undertakes no obligation to publicly update or revise any forward-looking statements.
Key dates for investors May 3, 2018 1st quarter 2018 results
May 8, 2018 Annual general assembly
May 21, 2018 Final dividend ex-coupon date
May 22, 2018 Final dividend record date
May 23, 2018 Final dividend payment date
August 1, 2018 2nd quarter and 1st half 2018 results
November 8, 2018 3rd quarter 2018 results
Useful links News corner Conference call details
Excel version of the tables
Investor presentation
Financial & extra-financial glossary
Annual integrated report
Contact Investor Relations Kimberly Stewart
+32 2 264 3694 [email protected]
Jodi Allen +1 973 357 3283 [email protected]
Geoffroy Raskin +32 2 264 1540 [email protected]
Bisser Alexandrov +32 2 264 3687 [email protected]
Contact Media relations Caroline Jacobs
+32 2 264 1530 [email protected]
Amandine Grison +32 2 264 20 26 [email protected]
Rue de Ransbeek 310, 1120 Brussels, Belgium T: +32 2 264 2111 F: +32 2 264 3061
www.solvay.com
Solvay is an advanced materials and specialty chemicals company, committed to developing chemistry that address key societal challenges. Solvay innovates and partners with customers worldwide in many diverse end markets. Its products are used in planes, cars, batteries, smart and medical devices, as well as in mineral and oil and gas extraction, enhancing efficiency and sustainability. Its lightweighting materials promote cleaner mobility, its formulations optimize the use of resources and its performance chemicals improve air and water quality. Solvay is headquartered in Brussels with around 24,500 employees in 61 countries. Net sales were €10.1 billion in 2017, with 90% from activities where Solvay ranks among the world’s top 3 leaders, resulting in an EBITDA margin of 22%. Solvay SA (SOLB.BE) is listed on Euronext Brussels and Paris (Bloomberg: SOLB.BB - Reuters: SOLB.BR) and in the United States its shares (SOLVY) are traded through a level-1 ADR program.
Dit verslag is ook in het Nederlands beschikbaar. - Ce rapport est aussi disponible en français.