fourth quarter 20162016 can be characterized as a tale of two halves after weak commodity prices,...
TRANSCRIPT

Quarterly Commentary
Fourth Quarter 2016
333 S. Grand Ave., 18th Floor || Los Angeles, CA 90071 || (213) 633-8200
2
Quarterly Commentary 12/31/16
Quarterly Commentary
2016 can be characterized as a tale of
two halves after weak commodity
prices, low inflation, falling rates and
uncertain global growth expectations
were later met with some political
certainty and a reversal of these
trends as investors became optimistic
about the future. During the fourth
quarter, global markets were heavily
focused on the outcome of the U.S.
presidential election and what impact
the newly elected president would
have on the global economy. After
correctly calling for higher rates and a
Trump victory earlier in the year,
Jeffrey Gundlach is encouraging
investors to move forward with
caution as an enthusiastic December
could be met with some
disappointment in the coming months
as proposed policy changes may take
several months/years to take effect.
During the quarter, investors took to
risk assets despite the expected
Federal Open Market Committee
(FOMC) December rate hike which
brought the Fed Funds Rate target
range up to 0.50-0.75%. Although the
rate hike was underwhelming relative
to the three hikes expected at the
beginning of 2016, the expectation is
set again for three more hikes during
2017. Instead of the global sell-off
equity markets experienced at this
time last year, the investment thesis
for investors is predicated on any
positive change the policies enacted
by the Trump administration would
bring.
It appears, for now at least, that a
Trump presidency has given investors
a sense of confidence evident by the
renewed interest for equities,
particularly Financials and Industrials,
which performed well post-election.
Additionally, the U.S. Dollar (USD), as
measured by the trade-weighted
Dollar Spot Index (DXY), rose to the
highest level in years as uncertainty
over trade policy loomed. The U.S.
economy also experienced higher
inflation expectations, stable energy
prices and higher rates over the
quarter.
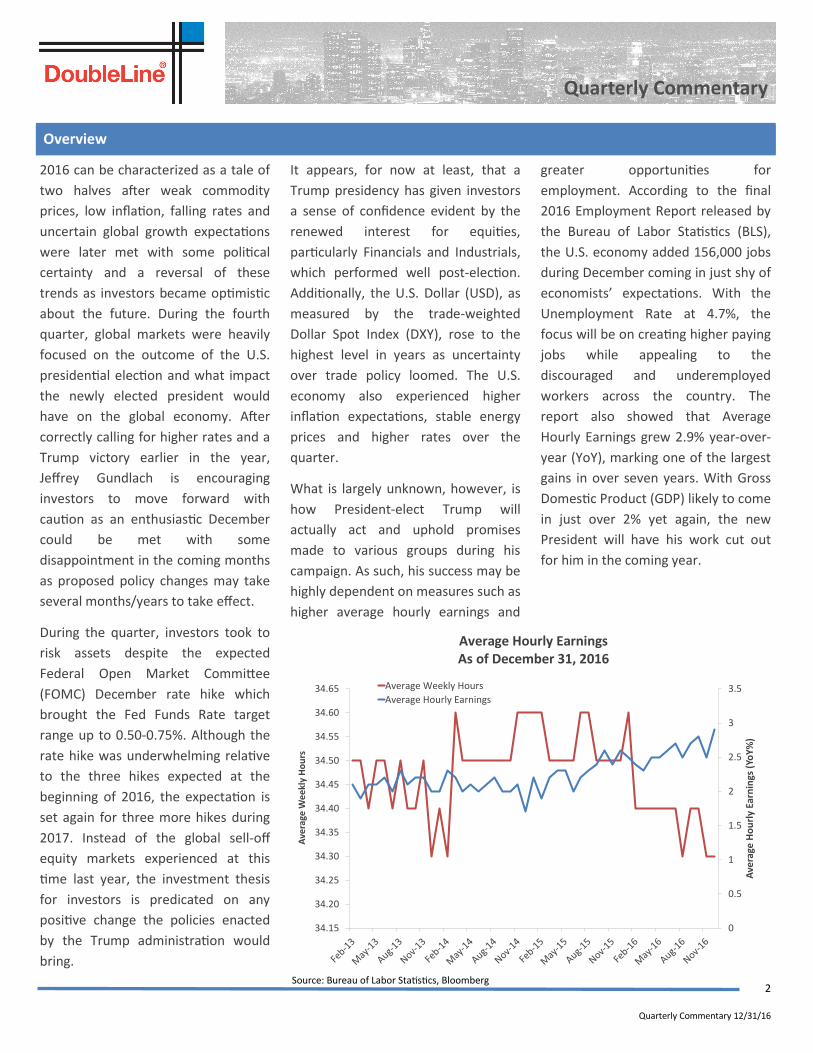
What is largely unknown, however, is
how President-elect Trump will
actually act and uphold promises
made to various groups during his
campaign. As such, his success may be
highly dependent on measures such as
higher average hourly earnings and
greater opportunities for
employment. According to the final
2016 Employment Report released by
the Bureau of Labor Statistics (BLS),
the U.S. economy added 156,000 jobs
during December coming in just shy of
economists’ expectations. With the
Unemployment Rate at 4.7%, the
focus will be on creating higher paying
jobs while appealing to the
discouraged and underemployed
workers across the country. The
report also showed that Average
Hourly Earnings grew 2.9% year-over-
year (YoY), marking one of the largest
gains in over seven years. With Gross
Domestic Product (GDP) likely to come
in just over 2% yet again, the new
President will have his work cut out
for him in the coming year.
Overview
Average Hourly Earnings As of December 31, 2016
Source: Bureau of Labor Statistics, Bloomberg
0
0.5
1
1.5
2
2.5
3
3.5
34.15
34.20
34.25
34.30
34.35
34.40
34.45
34.50
34.55
34.60
34.65
Ave
rage
Ho
url
y Ea
rnin
gs (
YoY
%)
Ave
rage
We
ekl
y H
ou
rs
Average Weekly Hours
Average Hourly Earnings
3
Quarterly Commentary 12/31/16
Quarterly Commentary
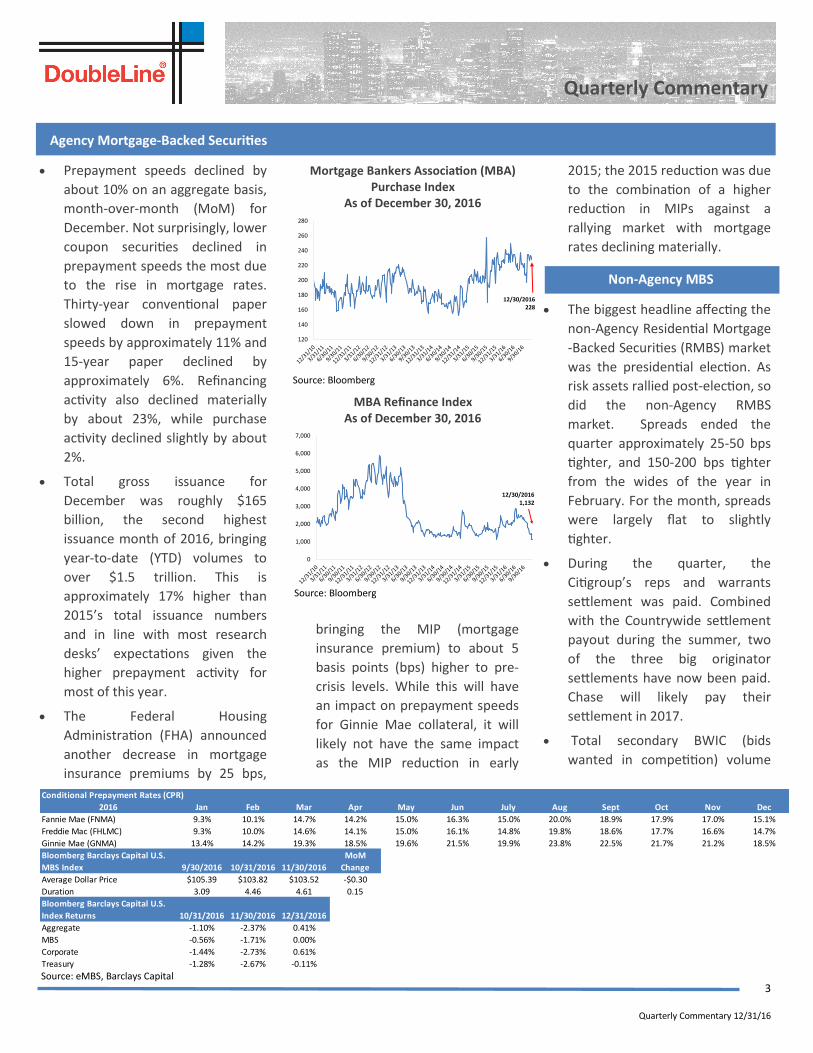
Prepayment speeds declined by
about 10% on an aggregate basis,
month-over-month (MoM) for
December. Not surprisingly, lower
coupon securities declined in
prepayment speeds the most due
to the rise in mortgage rates.
Thirty-year conventional paper
slowed down in prepayment
speeds by approximately 11% and
15-year paper declined by
approximately 6%. Refinancing
activity also declined materially
by about 23%, while purchase
activity declined slightly by about
2%.
Total gross issuance for
December was roughly $165
billion, the second highest
issuance month of 2016, bringing
year-to-date (YTD) volumes to
over $1.5 trillion. This is
approximately 17% higher than
2015’s total issuance numbers
and in line with most research
desks’ expectations given the
higher prepayment activity for
most of this year.
The Federal Housing
Administration (FHA) announced
another decrease in mortgage
insurance premiums by 25 bps,
bringing the MIP (mortgage
insurance premium) to about 5
basis points (bps) higher to pre-
crisis levels. While this will have
an impact on prepayment speeds
for Ginnie Mae collateral, it will
likely not have the same impact
as the MIP reduction in early
2015; the 2015 reduction was due
to the combination of a higher
reduction in MIPs against a
rallying market with mortgage
rates declining materially.
The biggest headline affecting the
non-Agency Residential Mortgage
-Backed Securities (RMBS) market
was the presidential election. As
risk assets rallied post-election, so
did the non-Agency RMBS
market. Spreads ended the
quarter approximately 25-50 bps
tighter, and 150-200 bps tighter
from the wides of the year in
February. For the month, spreads
were largely flat to slightly
tighter.
During the quarter, the
Citigroup’s reps and warrants
settlement was paid. Combined
with the Countrywide settlement
payout during the summer, two
of the three big originator
settlements have now been paid.
Chase will likely pay their
settlement in 2017.
Total secondary BWIC (bids
wanted in competition) volume
Agency Mortgage-Backed Securities
Mortgage Bankers Association (MBA) Purchase Index
As of December 30, 2016
Non-Agency MBS
Source: eMBS, Barclays Capital
Source: Bloomberg
MBA Refinance Index As of December 30, 2016
Source: Bloomberg
0
1,000
2,000
3,000
4,000
5,000
6,000
7,000
12/30/20161,132
120
140
160
180
200
220
240
260
280
12/30/2016228
Conditional Prepayment Rates (CPR)
2016 Jan Feb Mar Apr May Jun July Aug Sept Oct Nov Dec
Fannie Mae (FNMA) 9.3% 10.1% 14.7% 14.2% 15.0% 16.3% 15.0% 20.0% 18.9% 17.9% 17.0% 15.1%
Freddie Mac (FHLMC) 9.3% 10.0% 14.6% 14.1% 15.0% 16.1% 14.8% 19.8% 18.6% 17.7% 16.6% 14.7%
Ginnie Mae (GNMA) 13.4% 14.2% 19.3% 18.5% 19.6% 21.5% 19.9% 23.8% 22.5% 21.7% 21.2% 18.5%
Bloomberg Barclays Capital U.S.
MBS Index 9/30/2016 10/31/2016 11/30/2016
MoM
Change
Average Dollar Price $105.39 $103.82 $103.52 -$0.30
Duration 3.09 4.46 4.61 0.15
Bloomberg Barclays Capital U.S.
Index Returns 10/31/2016 11/30/2016 12/31/2016
Aggregate -1.10% -2.37% 0.41%
MBS -0.56% -1.71% 0.00%
Corporate -1.44% -2.73% 0.61%
Treasury -1.28% -2.67% -0.11%
4
Quarterly Commentary 12/31/16
Quarterly Commentary
was $6.3 billion in the fourth
quarter. The previous three
quarters averaged close to $20
billion in BWIC volume. The fourth
quarter volume was lower than
usual due to the election;
however BWIC volume is expected
to be lower in 2017 due to lower
supply. December BWIC volume
was $4.7 billion, in line with prior
months.
Prepayment speeds in the
December remittance report
(which represents November
performance) were flat to slightly
down MoM, due to the election
and holidays in November. As we
move forward in a higher rate
environment, prepayment speeds
should slow in 2017. Liquidation
rates were unchanged from the
prior month. Loss severities were
slightly higher in the December
remittance report due to an
increase in loans from judicial
states like New York, where
foreclosure timelines can be very
long due to the need for the
foreclosure to be seen by a judge
for approval, being liquidated.
Eight private-label transactions
totaling $5.3 billion priced in
December bringing total 2016
Commercial Mortgage-Backed
Securities (CMBS) issuance to
$66.3 billion, 28% lower than 2015
issuance. Fourth quarter issuance
was 29% higher quarter-over-
quarter (QoQ), with conduit
issuance 18% higher and single-
asset single-borrower (SASB) 59%
higher.
Conduit spreads ended the year
20-70 bps tighter compared to
year-end 2015. However, all-in
yields were only moderately lower
due to rising U.S. Treasury (UST)
rates. Fourth quarter 10- year last
cash flow (LCF) bonds priced in a
range of swaps +100 bps to swaps
+120 bps, with the last deal of the
quarter pricing 5 bps tighter than
the first deal of the quarter. BBB-
bonds priced in a range of swaps
+480 bps to swaps +700 bps, with
the final deal pricing 35 bps
tighter than the quarter’s initial
deal.
The Trepp CMBS Delinquency Rate
rose 20 bps in December to
5.23%, its highest level since
October 2015. The delinquency
rate has increased nine of the last
ten months. The current rate is 6
bps higher YoY. The all-time high
Delinquency Rate was 10.34% in
July 2012. This continued uptick in
delinquencies is anticipated as a
wave of deals issued pre-crisis
(2006/2007), primarily
collateralized by 10-year loans,
continues to mature. As of
November, the Moody’s/RCA
Commercial Property Price Indices
(CPPI) National All-Property
Composite Index gained 103.5%
since its financial crisis trough in
January 2010. Prices are now
22.3% above their pre-crisis peak
in November 2007.
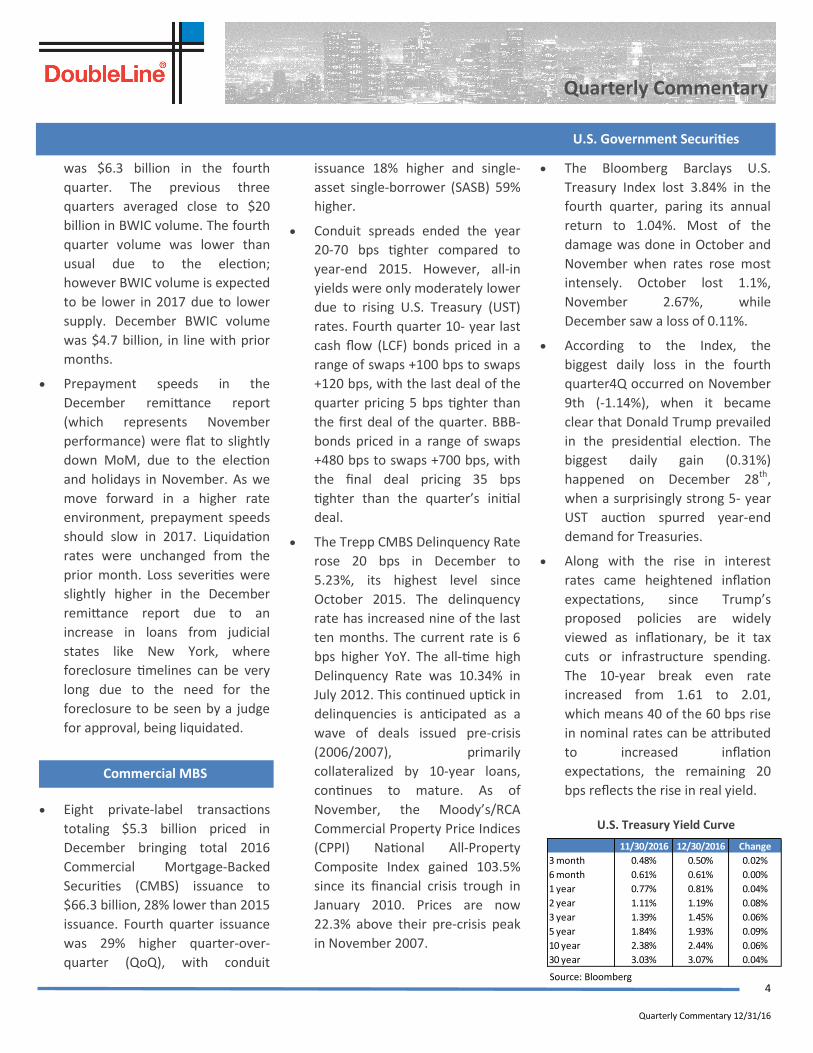
The Bloomberg Barclays U.S.
Treasury Index lost 3.84% in the
fourth quarter, paring its annual
return to 1.04%. Most of the
damage was done in October and
November when rates rose most
intensely. October lost 1.1%,
November 2.67%, while
December saw a loss of 0.11%.
According to the Index, the
biggest daily loss in the fourth
quarter4Q occurred on November
9th (-1.14%), when it became
clear that Donald Trump prevailed
in the presidential election. The
biggest daily gain (0.31%)
happened on December 28th,
when a surprisingly strong 5- year
UST auction spurred year-end
demand for Treasuries.
Along with the rise in interest
rates came heightened inflation
expectations, since Trump’s
proposed policies are widely
viewed as inflationary, be it tax
cuts or infrastructure spending.
The 10-year break even rate
increased from 1.61 to 2.01,
which means 40 of the 60 bps rise
in nominal rates can be attributed
to increased inflation
expectations, the remaining 20
bps reflects the rise in real yield.
U.S. Treasury Yield Curve
Source: Bloomberg
Commercial MBS
U.S. Government Securities
11/30/2016 12/30/2016 Change
3 month 0.48% 0.50% 0.02%
6 month 0.61% 0.61% 0.00%
1 year 0.77% 0.81% 0.04%
2 year 1.11% 1.19% 0.08%
3 year 1.39% 1.45% 0.06%
5 year 1.84% 1.93% 0.09%
10 year 2.38% 2.44% 0.06%
30 year 3.03% 3.07% 0.04%

5
Quarterly Commentary 12/31/16
Quarterly Commentary
Due to the increase in rates by the
Federal Reserve (Fed), the
Barclays U.S. Credit Index was
down 2.97% but delivered 1.56%
of excess return as spreads
tightened by 12 bps.
In December, while rates in the
UST market ended the month
virtually unchanged, the volatility
in rates continued to impact net
new issuance. New issuance in
December slowed to $38.9 billion
from $72.8 billion in November
and $55.4 billion in December
2015. Despite the slowdown, new
issuance for the year ended at an
all-time high of $1.44 billion.
Higher beta and longer dated
bonds continued to deliver higher
excess returns. The Long U.S.
Credit Index outperformed
duration matched treasuries by
384 bps in the quarter and 205
bps in December. The best
performing sector was in Energy
with Independents up 50 bps in
the quarter, and up 2.92%
December.
The outperformance relative to
UST in 2016, especially at the long
end of the market, was driven by
a strong technical backdrop.
Credit metrics, as measured by
gross and net leverage, are near
all-time highs, however, higher
U.S. yields have continued to
attract flows into the asset class
albeit at a slowing pace over the
past two months. Year-to-date
(YTD), Investment Grade (IG) has
seen mutual fund flows of $145
billion (8.5% as a percentage of
the asset class). It would appear
difficult to replicate the strong
technicals of 2016 but we would
expect to see continued interest
in the asset class if rates in the
U.S. remain higher than other
developed markets.
The Collateralized Loan Obligation
(CLO) new issue market ended the
year with monthly issuance of
$7.16 billion. This brings the yearly
issuance total of CLO paper to
$72.30 billion across 156 deals by
81 unique managers, meeting the
market’s original expectations of
$70 billion. The fourth quarter
saw the highest issuance of the
year with $26.21 billion in
issuance. Not only was the quarter
the highest quarterly issuance for
the year, but October, November
and December were the top three
months of issuance for 2016.
December also marked the final
month before Risk Retention
implementation. Managers rushed
to refinance and reset their deals
before December 24th. 23 deals
either refinanced or reset their
deals in December. In 2016, there
was a total of $41 billion in resets
and refinances, more than four
times the amount of refinancing
and reset activity seen in 2015.
The December Opal Conference
participants were constructive on
the loan and CLO market for their
2017 outlook. A majority of the
managers attending the
conference attended with plans
for Risk Retention and expected to
issue compliant deals in the first
quarter of 2017. Despite the
positive outlook, most managers
expect defaults in the Energy
sector and in some Retail areas
that have been displaced by
online shopping.
The S&P/LSTA Leveraged Loan
Index returned 1.16% in
December and 2.26% in the fourth
quarter. In 2016 the Index
achieved its second best
performance on record returning
10.16%, the highest since 2009.
Total returns for loans rated CCC
and below were more than 4
times the returns for loans rated B
for December and the quarter.
CCCs and below returned 4.31% in
December and 8.73% in the
quarter vs. single-Bs which
returned 1.09% in December and
2.18% in the quarter. However,
loans rated CCC and below only
represent approximately 7% of
the Index by market value and
Source: S&P Capital IQ
U.S. CLO Monthly Issuance January 2016— December 2016
Collateralized Loan Obligations
Investment Grade Credit
0
5
10
15
20
25
-
2.00
4.00
6.00
8.00
10.00
12.00
Jan
-16
Feb
-16
Mar
-16
Ap
r-1
6
May
-16
Jun
-16
Jul-
16
Au
g-1
6
Sep
-16
Oct
-16
No
v-1
6
Dec
-16
# o
f D
eal
s
Issu
ance
($
Bill
ion
s)
Number of Deals
Issuance
Bank Loans

6
Quarterly Commentary 12/31/16
Quarterly Commentary
thus only contributed
approximately 30 bps in
December and 60 bps in the
quarter to the overall total return
of the Index.
Performance by sector was
relatively uniform with most
sectors matching or marginally
underperforming the Index with a
few notable exceptions. Oil & Gas
and Metals & Mining led the pack
by wide margins, returning
14.20% and 12.53%, respectively,
during the quarter. Consumer-
related sectors generally
underperformed with Retailers,
Beverage & Tobacco & Food/Drug
Retailers returning -0.87%, -0.20%
and 0.61%, respectively, during
the quarter.
The weighted average bid price of
the Index rose $0.99 to $98.08
during the month, up $2.96 in the
quarter. At the end of the year
67% of the Index was bid at or
above par, the highest level since
the first quarter 2014. Yields
across the Index fell in December
and the fourth quarter. The
weighted average yield-to-
maturity (YTM), excluding
defaulted loans, fell 34 bps to
5.18% over the quarter.
Technicals have been supportive
for loans for most of the year and
especially over the past two
quarters. New demand for
leverage loans increased for the
sixth consecutive month in
December to $14.62 billion, up
from $13.49 billion in November.
During the quarter, demand for
leverage loans increased to $38.86
billion, comprised of $25.3 billion
of CLO issuance and $13.5 billion
of prime fund flows. The new
issue market was active with
$19.35 billion of institutional loan
volume in December, bringing
fourth quarter institutional loan
volume to $101 billion. Given that
refinancing activity made up
nearly 40% of new issue volume in
the quarter, the net increase in
par outstanding for the Index was
$8.95 billion in December and
$25.32 billion in the fourth
quarter.
The lagging 12-month issuer
weighted default rate fell slightly
to 2.06% in December, down from
2.11% in November and 2.23% at
the end of last quarter, but is up
from 1.08% a year ago.
In December, high-yield (HY)
bonds responded well to higher
oil prices, supported by the
Organization of Petroleum
Exporting Countries’ (OPEC) late
November agreement, as well as
the possibility of pro-business U.S.
legislative action in 2017. The Citi
High-Yield Cash-Pay Capped
Index’s monthly gain of 1.9% was
driven by lower-rated assets,
along with the Energy, Healthcare
and Aerospace sectors.
In December, high-yield (HY)
bonds responded well to higher
oil prices, supported by the
Organization of Petroleum
Exporting Countries’ (OPEC) late
November agreement, as well as
the possibility of pro-business U.S.
legislative action in 2017. The Citi
High Yield
U.S. Corporate High Yield Option-Adjusted Spread March 31, 2006 to December 31, 2016
Source: Barclays Live
1.2
501.2
1,001.2
1,501.2
2,001.2
2,501.2
12/30/2016409.0
7
Quarterly Commentary 12/31/16
Quarterly Commentary
High-Yield Cash-Pay Capped
Index’s monthly gain of 1.9% was
driven by lower-rated assets,
along with the Energy, Healthcare
and Aerospace sectors.
These themes generally held true
for the fourth quarter and full-
year 2016 as the Index returned
1.8% and 17.3%, respectively, with
CCC-rated assets significantly
outperforming the B- and BB-
rated categories. Commodity-
driven sectors also outperformed
as this 2016’s returns represented
a snapback from the previous two
years’ weakness in Metals, Mining
and Energy prices. The notable
underperformer in 2016 was
Pharmaceuticals, an industry
dominated by a few large HY
names that have been in the
political crosshairs.
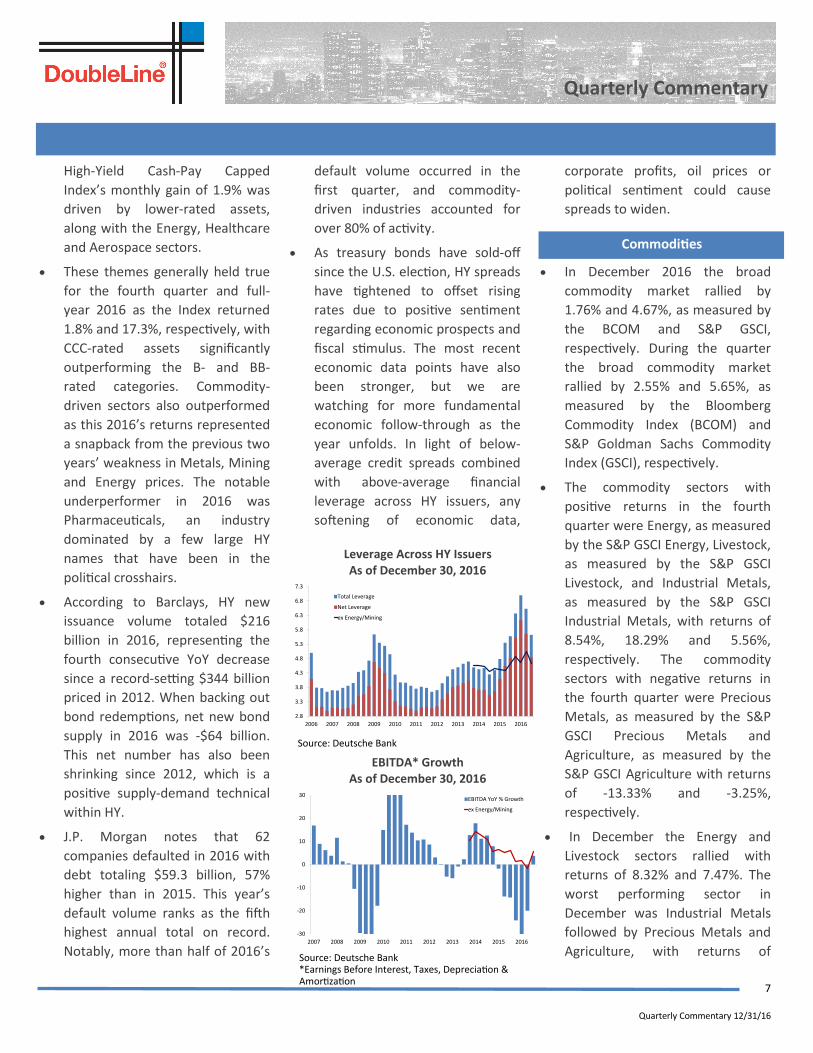
According to Barclays, HY new
issuance volume totaled $216
billion in 2016, representing the
fourth consecutive YoY decrease
since a record-setting $344 billion
priced in 2012. When backing out
bond redemptions, net new bond
supply in 2016 was -$64 billion.
This net number has also been
shrinking since 2012, which is a
positive supply-demand technical
within HY.
J.P. Morgan notes that 62
companies defaulted in 2016 with
debt totaling $59.3 billion, 57%
higher than in 2015. This year’s
default volume ranks as the fifth
highest annual total on record.
Notably, more than half of 2016’s
default volume occurred in the
first quarter, and commodity-
driven industries accounted for
over 80% of activity.
As treasury bonds have sold-off
since the U.S. election, HY spreads
have tightened to offset rising
rates due to positive sentiment
regarding economic prospects and
fiscal stimulus. The most recent
economic data points have also
been stronger, but we are
watching for more fundamental
economic follow-through as the
year unfolds. In light of below-
average credit spreads combined
with above-average financial
leverage across HY issuers, any
softening of economic data,
corporate profits, oil prices or
political sentiment could cause
spreads to widen.
In December 2016 the broad
commodity market rallied by
1.76% and 4.67%, as measured by
the BCOM and S&P GSCI,
respectively. During the quarter
the broad commodity market
rallied by 2.55% and 5.65%, as
measured by the Bloomberg
Commodity Index (BCOM) and
S&P Goldman Sachs Commodity
Index (GSCI), respectively.
The commodity sectors with
positive returns in the fourth
quarter were Energy, as measured
by the S&P GSCI Energy, Livestock,
as measured by the S&P GSCI
Livestock, and Industrial Metals,
as measured by the S&P GSCI
Industrial Metals, with returns of
8.54%, 18.29% and 5.56%,
respectively. The commodity
sectors with negative returns in
the fourth quarter were Precious
Metals, as measured by the S&P
GSCI Precious Metals and
Agriculture, as measured by the
S&P GSCI Agriculture with returns
of -13.33% and -3.25%,
respectively.
In December the Energy and
Livestock sectors rallied with
returns of 8.32% and 7.47%. The
worst performing sector in
December was Industrial Metals
followed by Precious Metals and
Agriculture, with returns of
Leverage Across HY Issuers As of December 30, 2016
Source: Deutsche Bank *Earnings Before Interest, Taxes, Depreciation & Amortization
EBITDA* Growth As of December 30, 2016
Source: Deutsche Bank
-30
-20
-10
0
10
20
30
2007 2008 2009 2010 2011 2012 2013 2014 2015 2016
EBITDA YoY % Growth
ex Energy/Mining
2.8
3.3
3.8
4.3
4.8
5.3
5.8
6.3
6.8
7.3
2006 2007 2008 2009 2010 2011 2012 2013 2014 2015 2016
Total Leverage
Net Leverage
ex Energy/Mining
Commodities

8
Quarterly Commentary 12/31/16
Quarterly Commentary
-5.43%, -2.02% and -1.34%,
respectively.
Emerging Market (EM) corporate
and sovereign external
performance was positive during
the month on improving
sentiment after a steep decline in
November following the U.S.
Presidential election.
The JP Morgan EMBI Global
Diversified Index returned 10.15%
in 2016, its best annual
performance since 2012, driven
primarily by spread performance,
with Latin America contributing to
almost half of the total return.
We expect to see fairly robust EM
sovereign and corporate gross
issuance in 2017, continuing the
trend from 2016, which could
provide the opportunity to
selectively add to issuers coming
with a new issue premium.
In 2017, headwinds could arise
from rising UST yields, a stronger
USD, increased protectionism and
trade barriers, potentially pivotal
elections in Europe, and policy risk
stemming from the U.S., Europe
and China.
December saw a more measured
continuation of the broad
reflationary themes that had
intensified in November in the
aftermath of the U.S. election with
a stronger USD and higher global
government yields.
The Italian referendum boosted
European periphery yields higher
as the Prime Minister, Matteo
Renzi, stepped down after his
planned reforms were soundly
rejected by a popular vote.
European government bond
markets also focused on the limits
to central bank monetary policy
accommodation. The European
Central Bank (ECB) extended its
quantitative easing (QE) program
to December 2017, but reduced
the monthly pace of bond
purchases to €60 billion¹ from €80
billion², which was interpreted by
some market participants as a
“tapering” or “trimming” of QE.
Developed market currencies sold
off this month. The Euro fell to its
lowest level against the USD in
almost 14 years with news of a
government rescue package for
the Italian banking sector, and an
attack on a Christmas market in
Berlin. Market participants also
looked ahead to pivotal elections
in Europe next year in France, the
Netherlands, Germany, and
potentially Italy.
The Japanese Yen also sold off
over the month, driven by the
yield differential between
Treasuries and benchmark ten-
year Japanese government bonds
(JGB).
Trading and new issue volume
were strong going into year-
end. As rates steadily rose during
December, issuers sought to price
transactions prior to the New
Year. From a sector perspective,
corporate issues in the Power and
Energy (refining) sectors
dominated while structured
JP Morgan Emerging Markets Bond Index Performance December 31, 2015 to December 31, 2016
Source: JP Morgan
-8.0%
-6.0%
-4.0%
-2.0%
0.0%
2.0%
4.0%
6.0%
8.0%
10.0%
JPM Emerging Markets Bond Global Diversified Index (EMBI)
JPM Corporate Emerging Markets Bond Broad Diversified Index (CEMBI)
JPM Government Bond Emerging Markets Broad Diversified Index (GBI EM)
International Sovereign
Emerging Markets
Infrastructure
1. Approximately $63.1 billion USD as of December 31, 2016 2. Approximately $84.2 billion USD as of December 31, 2016

9
Quarterly Commentary 12/31/16
Quarterly Commentary
products issues mostly focused on
clean energy and aircraft
securitizations. Spreads were
volatile with spreads tightening
early in the month and widening
modestly as year-end
approached. Asset-Backed
Securities (ABS) securitizations
saw strong demand throughout
the year, but with rising rates and
the desire for many market
participants to retain larger cash
positions, spreads also widened.
Mr. Trump identified
infrastructure spending as one of
his highest priorities and has
further supported this agenda by
nominating members to his
cabinet with significant expertise
in energy and infrastructure
financing.
Against this backdrop, financing
for infrastructure assets remained
robust. Rising interest rates
dampened issuance volume in
October, while November and
December witnessed robust
primary issuance as issuers looked
to lock in financing before year
end. Debt issues related to
utilities, midstream energy assets,
transportation and renewables
were met with fervent investor
demand.
While not as pronounced as what
investors experienced during the
first quarter, spread volatility
reappeared in the fourth quarter.
October saw marginal spread
widening in the U.S. Utility and
Transport sectors, only to tighten
back in November and December.
EM infrastructure issues saw the
opposite occur. ABS issues were
the least volatile, showing only
marginal spread movement during
the fourth quarter.
While the S&P 500’s advance
stalled in the third quarter, the
market quickly discounted the
prospect of more inflationary and
expansionary fiscal policies, as
well as a more business-friendly
regulatory environment, with the
election of Trump. Between
Election Day and the end of 2016,
the S&P 500 Index gained
approximately 5% to end the year
up almost 12%. We believe it
would be a mistake to attribute all
of the market’s actions in the last
two months of the year to the
outcome of the Presidential
election. Looking within the
market, many of the November
and December trends were an
acceleration of trends that were
already well established since the
summer. Specifically, the
bottoming of inflation
expectations and 10-year UST
yields in July saw a rotation in the
market. Formerly strong-
performing and defensive “yield-
proxy” sectors such as Consumer
Staples and Utilities began to
underperform. At the same time,
more cyclical sectors such as
Energy and Technology began
outperforming the broader index,
as did Financial Services –
perceived as a beneficiary of
higher rates and a steeper yield
curve.
These sector-level trends gained
momentum following the
election. Financial Services was
the leadership sector, regarded as
the greatest beneficiary from a
steeper yield-curve and less
regulation. The reaction of
Healthcare stocks was somewhat
counter-intuitive: the sector
initially rallied following the
election, only to sell off on the
realization that the shape of the
next round of healthcare policy
reform is very uncertain.
With YoY earnings expected to
grow in the fourth quarter, the
“earnings recession” is at an end.
Despite this, consensus estimates
for fourth quarter and 2017
earnings continued to fall through
the quarter and, in our opinion,
continue to be fairly optimistic.
As we enter 2017, we remain
cautious on the market. The
market seems to have quickly
concluded that the new
administration’s policies will
simultaneously be meritorious,
quickly passed into law, and
successful. Even if these
assumptions are true – a big “if” -
progress is rarely linear. After all,
it took Reagan two years to pass
tax reform. History teaches that
sometimes the underlying
momentum of the business cycle
and global economy can
temporarily overtake the best
conceived and executed of
policies.
U.S. Equities

10
Quarterly Commentary 12/31/16
Quarterly Commentary
Global equities, as measured by
the Morgan Stanley Capital
International All-Country World
Index (MSCI ACWI), returned
2.18% in December and 1.30% for
the quarter. European equities
outperformed the broader market
in December with the Eurostoxx
50 returning 7.94%. For the
quarter, European equities posted
positive returns with the
Eurostoxx 50 up 10.05%, DAX up
9.23%, CAC up 9.72%, FTSEMIB up
17.64% and IBEX up 7.83%. The
European banking sector
continued to recover in the fourth
quarter with the Eurostoxx Banks
Index returning 27.77%. UK
equities continued to rally during
the quarter with the FTSE 100 up
4.34%.
Asian equities were mixed in
December with the Nikkei
returning 4.70%, Shanghai
Composite returning -4.73%, and
Kospi returning 2.19%. For the
quarter, Asian equities were
mixed, with the Nikkei up 16.53%,
Shanghai Composite up 3.06%,
and Kospi returning -
0.82%. Weaker Japanese Yen
supported Japanese equities.
EM equities were little changed in
December with the MSCI EM
Index returning 0.05%, but posted
a -4.74% return in the fourth
quarter. Russian equities rallied in
December with the MSCI Russia
Index up 12.26% and ending the
quarter up 18.39%. Brazilian
equities, as measured by the
Bovespa, declined -2.71% in
December ending the quarter
3.19%.
Global Equities

11
Quarterly Commentary 12/31/16
Definitions
Bloomberg Barclays U.S. Corporate Index -An index designed to be a broad-based measure of the global investment-grade, fixed rate, fixed income corporate markets
outside the United States.
Bloomberg Barclays U.S. Credit Index—The US Credit component of the U.S. Government/Credit Index. This index consists of publically-issued U.S. corporate and
specified foreign debentures and secured notes that meet the specified maturity, liquidity, and quality requirements. To qualify, bonds must be SEC-registered. The US
Credit Index is the same as the former US Corporate Investment Grade Index.
Bloomberg Barclays U.S. Government Index - An index that measures the performance of all public U.S. government obligations with remaining maturities of one year
or more.
Bloomberg Commodity Index (BCOM) - An index calculated on an excess return basis that reflects commodity futures price movements. The index rebalances annually
weighted 2/3 by trading volume and 1/3 by world production and weight-caps are applied at the commodity, sector and group level for diversification. Roll period
typically occurs from 6th-10th business day based on the roll schedule.
Citi High-Yield Cash-Pay Capped Index -This index represents the cash-pay securities of the Citigroup High-Yield Market Capped Index, which represents a modified
version of the High Yield Market Index by delaying the entry of fallen angel issues and capping the par value of individual issuers at $5 billion par amount outstanding.
Cotation Assistee en Continu 40 (CAC 40) - The CAC 40 Index which is a French stock market index. It tracks 40 of the largest French stocks on the Paris Bourse, or
stock exchange.
Consumer Price Index (CPI) - A measure that examines the weighted average of prices of a basket of consumer goods and services, such as transportation, fo od and
medical care. The CPI is calculated by taking price changes for each item in the predetermined basket of goods and averaging them; the goods are weighted according to
their importance. Changes in CPI are used to assess price changes associated with the cost of living.
Credit Suisse High Yield Index - The index reflects a trader-priced portfolio constructed to mirror the global high-yield debt market.
Deutsche Borse AG German Stock Index (DAX) - The German stock index, which represents 30 of the largest and most liquid German companies that trade on the
Frankfurt Exchange.
Dow Jones Industrial Average (DJIA) - A price-weighted average of 30 significant stocks traded on the New York Stock Exchange and the Nasdaq.
ECB Corporate Sector Purchase Program - A program established by the European Central Bank with the goal of strengthening financing conditions. Six national
central banks will coordinate to purchase IG Euro-denominated bonds issued by non-bank corporations established in the euro area.
Eurostoxx 50 Index - A stock index of Eurozone stocks designed by STOXX, an index provider owned by Deutsche Borse Group and SIX group, with the goal of
providing a blue-chip representation of Supersector leaders in the Eurozone.
Financial Times Stock Exchange 100 (FTSE 100) - A capitalization-weighted index of the 100 most highly capitalized companies traded on the London Stock Exchange.
Financial Times Stock Exchange Milano Italia Borsa (FTSE MIB) - The benchmark stock market index for the Borsa Italiana, the Italian national stock exchange, which
superseded the MIB-30 in September 2004. The index consists of the 40 most-traded stock classes on the exchange.
Foreign Direct Investment - An investment made in business interests in a country other than the company or individual’s residing country through set up of business
operations or acquiring business assets in a foreign company.
S&P Goldman Sachs Commodity Index (GSCI) - Standard & Poor’s Goldman Sachs Commodity Index, or GSCI, is a composite index of commodity sector returns which
represents a broadly diversified, unleveraged, long-only position in commodity futures. The index’s components qualify for inclusion in the index based on liquidity
measures and are weighted in relation to their global production levels, making the Index a valuable economic indicator and commodities market benchmark.
Hang Seng Index - A free-float capitalization-weighted index of a selection of companies from the Stock Exchange of Hong Kong. The components of the index are divided
into four subindices: Commerce and Industry, Finance, Utilities, and Properties.
Ibovespa - This accumulation index represents the present value of a portfolio begun on 2 January 1968, with a starting value of 100 and taking into account share price
increases plus the reinvestment of all dividends, subscription rights and bonus stocks received.
Indice Bursatil Espanol (IBEX) - The official index of the Spanish Continuous Market. The index is comprised of the 35 most liquid stocks traded on the Continuous
market. It is calculated, supervised and published by the Sociedad de Bolsas.
JP Morgan Corporate Emerging Markets Bond Broad Diversified Index (CEMBI) -This index is a market capitalization weighted index consisting of US-denominated
Emerging Market corporate bonds. It is a liquid global corporate benchmark representing Asia, Latin America, Europe and the Middle East/Africa.
An investment cannot be made in an index.
12
Quarterly Commentary 12/31/16
Definitions
JP Morgan Emerging Markets Bond Global Diversified Index (EMBI) -This index is uniquely-weighted version of the EMBI Global. It limits the weights of those index
countries with larger debt stocks by only including specified portions of these countries’ eligible current face amounts of debt outstanding. The countries covered in the
EMBI Global Diversified are identical to those covered by EMBI Global.
JP Morgan Government Bond Emerging Markets Broad Diversified Index (GBI EM) -This index is the first comprehensive, global local Emerging Markets index, and
consists of regularly traded, liquid fixed-rate, domestic currency government bonds to which international investors can gain exposure.
Korea Composite Stock Price Index (Kospi) - A market capitalization weighted index of all common stocks traded on the Stock Market Division—previously, Korea
Stock Exchange—of the Korea Exchange. It is the representative stock market index of South Korea, similar to the Dow Jones Industrial Average or S&P 500 in the United
States.
London Interbank Offered Rate (LIBOR) - An indicative average interest rate at which a selection of banks known as the panel banks are prepared to lend one another unsecured funds on the London money market.
Moody’s/RCA Commercial Property Price Indices (CPPI) National All-Property Composite Index - The Moody's/RCA Commercial Property Price Index (CPPI) describes various non-residential property types for the U.S. (10 monthly series from 2000). The Moody's/RCA Commercial Property Price Index is a periodic same-property round-trip investment price change index of the U.S. commercial investment property market. The dataset contains 20 monthly indicators.
Morgan Stanley Capital International All Country World Index (MSCI ACWI) -A market-capitalization-weighted index designed to provide a broad measure of stock
performance throughout the world, including both developed and emerging markets.
MSCI Emerging Markets (MSCI EM)- An index that covers 23 Emerging Market countries and is designed to capture the large and mid-cap representation across those
countries.
MSCI Emerging Markets Latin America - A subindex of that MSCI Emerging Markets Index that covers 5 EM countries in Latin America and is designed to capture large
and mid cap representation from 119 constituents.
MSCI Russia Index - An index that includes 85% of the free float-adjusted market capitalization of Russia. It is designed to measure the performance of the large and
midcap segments of the Russian market.
NASDAQ - A stock market index of the common stocks and similar securities (e.g. ADRs, tracking stocks, limited partnership interests) listed on the NASDAQ stock
market with over 3,000 components. This index is highly followed in the U.S. as an indicator of the performance of stocks of technology companies and growth
companies. Since both U.S. and non-U.S. companies are listed on the NASDAQ stock market, the index is not exclusively a U.S. index.
Nikkei 225 Index - A price-weighted index comprised of Japan's top 225 blue-chip companies on the Tokyo Stock Exchange. The Nikkei is equivalent to the Dow Jones
Industrial Average Index in the U.S.
Russell 2000 Index - A subset of the Russell 3000 Index representing approximately10% of the total market capitalization and measuring the perform ance of the small-
cap segment of the U.S. equity universe.
Shanghai Composite Index - A capitalization-weighted index that tracks the daily performance of all A-shares and B-shares listed on the Shanghai Stock Exchange. The
index was developed on December 19, 1990 with a base value of 100.
S&P Goldman Sachs Commodity Index (GSCI) - An index that measures investment in the commodity markets and commodity market performance over time.
S&P 500 Index - Standard & Poor’s US 500 Index, a capitalized-weighted index of 500 stocks.
S&P/LSTA Leveraged Loan Index - An index designed to track the market-weighted performance of the largest institutional leveraged loans based on the market
weightings, spreads and interest payments.
World Interest Rate Probability (WIRP) - A Bloomberg function used as a measure of the likelihood of a Fed rate move using the Fed Funds futures and options
contracts.
An investment cannot be made in an index.

13
Quarterly Commentary 12/31/16
Disclaimers
Important Information Regarding This Report
Issue selection processes and tools illustrated throughout this presentation are samples and may be modified periodically. Such charts are not the only tools used by the
investment teams, are extremely sophisticated, may not always produce the intended results and are not intended for use by non-professionals.
DoubleLine has no obligation to provide revised assessments in the event of changed circumstances. While we have gathered this information from sources believed to
be reliable, DoubleLine cannot guarantee the accuracy of the information provided. Securities discussed are not recommendations and are presented as examples of
issue selection or portfolio management processes. They have been picked for comparison or illustration purposes only. No security presented within is either offered for
sale or purchase. DoubleLine reserves the right to change its investment perspective and outlook, as well as portfolio construction, without notice as market conditions
dictate or as additional information becomes available. This material may include statements that constitute “forward-looking statements” under the U.S. securities laws.
Forward-looking statements include, among other things, projections, estimates, and information about possible or future results related to a client’s account, or market
or regulatory developments.
Ratings shown for various indices reflect the average for the indices. Such ratings and indices are created independently of DoubleLine and are subject to change without notice.
Important Information Regarding Risk Factors
Investment strategies may not achieve the desired results due to implementation lag, other timing factors, portfolio management decision-making, economic or market
conditions or other unanticipated factors. The views and forecasts expressed in this material are as of the date indicated, are subject to change without notice, may not
come to pass and do not represent a recommendation or offer of any particular security, strategy, or investment. Past performance (whether of DoubleLine or any index
illustrated in this presentation) is no guarantee of future results. You cannot invest in an index.
Important Information Regarding DoubleLine
In preparing the client reports (and in managing the portfolios), DoubleLine and its vendors price separate account portfolio securities using various sources, including
independent pricing services and fair value processes such as benchmarking.
To receive a complimentary copy of DoubleLine’s current Form ADV (which contains important additional disclosure information), a copy of the DoubleLine’s proxy voting
policies and procedures, or to obtain additional information on DoubleLine’s proxy voting decisions, please contact DoubleLine’s Client Services.
Important Information Regarding DoubleLine’s Investment Style
DoubleLine seeks to maximize investment results consistent with our interpretation of client guidelines and investment mandate. While DoubleLine seeks to maximize
returns for our clients consistent with guidelines, DoubleLine cannot guarantee that DoubleLine will outperform a client's specified benchmark. Additionally, the nature
of portfolio diversification implies that certain holdings and sectors in a client's portfolio may be rising in price while others are falling; or, that some issues and sectors
are outperforming while others are underperforming. Such out or underperformance can be the result of many factors, such as but not limited to duration/interest rate
exposure, yield curve exposure, bond sector exposure, or news or rumors specific to a single name.
DoubleLine is an active manager and will adjust the composition of client’s portfolios consistent with our investment team’s judgment concerning market conditions and
any particular security. The construction of DoubleLine portfolios may differ substantially from the construction of any of a variety of bond market indices. As such, a
DoubleLine portfolio has the potential to underperform or outperform a bond market index. Since markets can remain inefficiently priced for long periods, DoubleLine’s
performance is properly assessed over a full multi-year market cycle.
Important Information Regarding Client Responsibilities
Clients are requested to carefully review all portfolio holdings and strategies, including by comparing the custodial statement to any statements received from
DoubleLine. Clients should promptly inform DoubleLine of any potential or perceived policy or guideline inconsistencies. In particular, DoubleLine understands that
guideline enabling language is subject to interpretation and DoubleLine strongly encourages clients to express any contrasting interpretation as soon as practical. Clients
are also requested to notify DoubleLine of any updates to Client’s organization, such as (but not limited to) adding affiliates (including broker dealer affiliates), issuing
additional securities, name changes, mergers or other alterations to Client’s legal structure.
DoubleLine® is a registered trademark of DoubleLine Capital LP.
© 2017 DoubleLine Capital LP