fourier transform infrared mapping of peels of citrus
TRANSCRIPT

International Journal of Science and Research (IJSR) ISSN (Online): 2319-7064
Impact Factor (2012): 3.358
Volume 3 Issue 11, November 2014 www.ijsr.net
Licensed Under Creative Commons Attribution CC BY
Fourier Transform Infrared Mapping of Peels of Citrus sinensis var mosambi after Physiochemical
Pretreatment and its SSF for Ethanol Production by Saccharomyces cerevisiae MTCC 3821- An
Economic & Ecological Venture
Latika Bhatia1, Sonia Johri2
1, 2Department of Life Sciences, Institute of Technology & Management University, Gwalior-475001, Madhya Pradesh, India
Abstract: Pulverized peels of Citrus sinensis var mosambi consists of 32 ± 0.36% cellulose, 25 ± 0.18% hemicellulose and 18 ± 0.08% of lignin on dry solid (DS) basis. 1% NaOH delignified peels of C. sinensis var mosambi yielded 4.98% glucose, 4.46% raffinose and 7.67% fructose under steam explosion, with a hydrolytic efficiency of 90.32 ± 0.55%. Fourier transform infrared spectroscopy results indicated the penetration of NaOH in the amorphous region of the biomass and degradation of hemicelluloses The enzymes required for hydrolysis were prepared from culture supernatants of Trichoderma reesei NCIM 1052 using wheat bran as carbon source under submerged fermentation conditions. Enzyme activity (U/ml) of crude cellulase produced by T. reesei NCIM 1052 was 311.1 µmole/ml/min. Delignified C. sinensis var mosambi peel yielded 40.51 ± 0.42 g/l glucose when enzymatically hydrolysed by crude cellulase at the substrate enzyme ratio of 1:5. Simultaneous Saccharification and Fermentation (SSF) of peels of C. sinensis var mosambi by crude cellulase and entrapped Saccharomyces cerevisiae MTCC 3821 cells in calcium alginate beads were also investigated in the present study. Important process variables for ethanol production from pretreated peels of C. sinensis var mosambi were optimized using Response Surface Methodology (RSM) based on Central Composite Design (CCD) experiments. A three level CCD experiments with central and axial points was used to develop a statistical model for the optimization of process variables such as incubation temperature (30°C, 32°C and 34°C) X1, inoculum level (2%, 4% and 6%) X2 and nutrients (1/2/3) X3. Data obtained from RSM on ethanol production were subjected to the analysis of variance (ANOVA) and analyzed using a second order polynomial equation and contour plots were used to study the interactions among three relevant variables of the fermentation process. The fermentation experiments were carried out at flask level. The processing parameters setup for reaching a maximum response for ethanol production was obtained when applying the optimum values for temperature (30°C), inoculum level (6%) and fermentation medium (ammonium sulphate, KH2PO4, peptone and yeast extract) for Saccharomyces cerevisiae MTCC 3821. Maximum ethanol concentration 9.94 g/l was obtained after 72 hours from Saccharomyces cerevisiae MTCC 3821 at the optimized process conditions in anaerobic batch fermentation. Keywords: Citrus sinensis var mosambi, physiochemical pretreatment, HPLC, FTIR, Enzymatic hydrolysis, Cell immobilization. 1. Introduction The development of the industrial and technological society together with the economic and environmental insinuation, such as global warming and depleting oil reserves, have been driving worldwide interest in exploring for renewably sourced materials, that can be used as feedstock for biofuel production. The term biofuel is attributed to any alternative fuel that is obtained from organic material, such as energy crops, crop residues or waste biomass. Decreasing greenhouse gas emissions is a plus point of biomass-based biofuels with respect to fossil fuels. Of all biofuels, ethanol has been trusted as an alternate fuel for the future and is already produced on a fair scale (about 14-26 million tons) worldwide. Bioethanol production from sugarcane and starch rich feed stocks such as corn, potato, etc., is considered first generation process and it has already been developed. Looking at the tapering off pace of food grains shortage and their price hike globally, fuel ethanol production from value added food and feedstock (maize grains, sorghum grains and sugarcane juice etc.) does not fit into the list of suitable alternative energy sources [1]. Therefore, second generation processes to produce
bioethanol are gaining impetus. The second generation processes will use lignocellulosic materials for this purpose and biosphere clearly has ample supplies of lignocellulosic materials. The production of ethanol from lignocellulosic biomass has become one of the best options, because these sources have widespread abundance and the cost of their cater is relatively cheap. During Citrus sinensis juice production, about 50% weight of fruit is discarded as waste peels, membranes, juice vesicles and seeds [2]. Currently, these solid wastes are spread on soil areas adjacent to the production locations [3]. This way of waste handling leads to an uncontrolled leaching on soil and groundwater. These leachates contain organic compounds that severely threat the surrounding environment [4]. However, alternatively bioethanol can be produced from this lignocellulosic waste. Citrus sinensis (L.) Osbeck var. Pineapple (syn, C. aurantium L. var. sinensis) belongs to Rutaceae family and it is commonly known as sweet orange or mosambi. Its fruit is strengthening, cardiotonic, laxative, anthelmintic and removes fatigue. It possesses anti-inflammatory and antioxidant properties [5]. Until recently, only limited research has been undertaken to assess this common and exotic citrus i.e. sweet orange (Citrus sinensis var mosambi)
Paper ID: OCT141379 1653

International Journal of Science and Research (IJSR) ISSN (Online): 2319-7064
Impact Factor (2012): 3.358
Volume 3 Issue 11, November 2014 www.ijsr.net
Licensed Under Creative Commons Attribution CC BY
[6]. A survey of literature showed that this variety had not been subjected to chemical analysis so far. Peels of sweet orange (C. sinensis var mosambi) are an important non edible lignocellulosic biomass, which are generated widely throughout India. But several important characteristics of peels of C. sinensis var mosambi such as easy availability, high cellulose content and no competition with the food chain makes it an ideal substrate for bioethanol production, and the present investigation had therefore been undertaken to explore the biovalorization potential of this waste. Peels of C. sinensis var mosambi constitute an abundant and cheap lignocellulosic feedstock, but the processing techniques required for ethanol production are presently costly and extensive. The cost of ethanol produced from lignocellulosic materials with currently available technology and under the present economic conditions is not competitive with the cost of gasoline. To make the process economically feasible, comprehensive process development and optimization are still required. The low enzymatic accessibility of the native cellulose is a prime problem for biomass-to-ethanol processes because lignin forms a protective covering around cellulose and hemicellulose, safeguarding the polysaccharides from enzymatic degradation. To convert the biomass into ethanol, the cellulose must be readily accessible for cellulase enzymes. Thus, by abolishing the lignin, the cellulose becomes vulnerable to enzymes and allows the yeast to convert the glucose into ethanol during fermentation. Pretreatment with dilute acids and bases not only debase the lignin, but also increases the surface area for enzymatic activity [7]. After pretreatment, the enzymatic hydrolysis of substrate is an auspicious way for obtaining cellulose sugars (mostly glucose) from lignocellulosic materials [because it has the advantages of reduced sugar loss through side-reactions, is milder and more specific] [8]. The cellulose conversion option that many currently favor is the Simultaneous Saccharification and Fermentation (SSF) process [9]. In this option, the cellulose hydrolysis and glucose fermentation steps are combined in a single vessel. Since cellulase is inhibited by glucose as it is formed, rapid conversion of the glucose into ethanol by yeast results in faster rates, higher yields, and greater ethanol concentrations than possible for Separate Hydrolysis and Fermentation (SHF). Furthermore, by combining the hydrolysis and fermentation steps in one vessel, the number of fermenters required is approximately one-half that for the SHF process. The presence of ethanol in the fermentation broth also makes the mixture less vulnerable to invasion by unwanted microorganisms [10]. The present study aimed at optimizing the conditions of physiochemical pretreatment as well as fermentation process using peels of C. sinensis var mosambi as substrate. Fourier transform infrared spectroscopy (FTIR) was used as an analytical tool for qualitative determination of the structural changes in peels of C. sinensis var mosambi after physiochemical pretreatment. The potential use of peels of C. sinensis var mosambi for ethanol fermentation (SSF) using crude cellulase and immobilized yeast Saccharomyces cerevisiae MTCC 3821 was also investigated. The influence of process variables such as incubation temperature, inoculum concentration and different nutrients on ethanol production were studied to optimize the fermentation
process. Economical and ecological aspects were considered in each step of this study. 2. Material and Methods 2.1 Raw Material Peels of sweet orange (C. sinensis var mosambi) were collected from local fruit juice vendors of Gwalior (26°13′N 78°11′E / 26.22°N 78.18°E), Madhya Pradesh, India. Peels were then air dried for 4-5 days. Dried peels were ground into 100 mesh (0.15mm) fine powder by use of laboratory blender at 3000 rpm and were further preserved in sealed plastic bags at 4°C to prevent any possible degradation or spoilage. 2.2 Analysis of chemical composition of C. sinensis var mosambi peel The cellulose, lignin and hemicellulose fractions of powdered peels were determined according to Technical Association of the Pulp and Paper Institute (TAPPI), test methods [11]. 2.3 Delignification Various pretreatment techniques such as steam autoclaving in an autoclave at 15 psi (121°C) for 60 minutes; dilute sulphuric acid (1% v/v), concentrated sulphuric acid (10% v/v), sodium hydroxide (1% v/v), nitric acid (1% v/v) and calcium hydroxide (1% v/v) with steam autoclaving at 15 psi (121°C) for about 20 minutes, were adopted separately for the pretreatment of C. sinensis var mosambi peel. The pretreated peels were collected and filtered in crucibles followed by a wash with distilled water under suction. Finally it was dried at room temperature before enzymatic hydrolysis [12, 13]. 2.4 Hydrolytic enzymes production Production of crude cellulase was done from Trichoderma reesei NCIM 1052. The medium for crude cellulase enzyme extraction was prepared by adding 45 g per l wheat bran, 15 g per l yeast extract, 10 g per l glucose, 2.5 g per l NH4Cl, 0.5 g per l thiamine hydrochloride, 2.0 g per l K2HPO4, 0.5 g per l MgSO4.7H2O, 0.1 g per l CaCl2 and 0.5 g per l KCl. This medium was inoculated with actively growing T. reesei NCIM 1052. The flasks were incubated for 10 days on a rotary shaker. After 10 days of incubation the culture broth was centrifuged at 10,000 rpm for 20 min to remove mycelia and spores. The supernatant was collected and used as the source of enzyme, which was stored at 4°C till use [14]. 2.5 Enzyme assays One ml of 0.05 M sodium citrate having pH 4.8 was added to a test tube. To this 0.5 ml of enzyme was added. One strip of Whatman No.1 filter paper (weighing 50 mg) was put into test tube (the filter paper strip has to be pushed down whenever it winds up the test tube). The tube along with blank was kept in a water bath at 50°C for 60 min. After 60 min, the tubes were taken out and dinitrosalicylic acid (DNSA) method of Miller [15] was followed further to
Paper ID: OCT141379 1654

International Journal of Science and Research (IJSR) ISSN (Online): 2319-7064
Impact Factor (2012): 3.358
Volume 3 Issue 11, November 2014 www.ijsr.net
Licensed Under Creative Commons Attribution CC BY
account for the amount of sugars released by the cellulase [16]. One unit (U) of each enzyme activity is defined as the amount of enzyme, which produces 1 µmol reducing sugar as glucose in the reaction mixture per minute under the above-specified conditions. 2.6 Enzymatic Hydrolysis Enzymatic hydrolysis of 1% H2SO4 delignified peels of C. sinensis var mosambi (300 g) was carried out in a 5 L round bottom glass vessel (Borosil, Mumbai, India) (equipped with agitator for stirring and outer jacket for water circulation to maintain the required temperature) containing 3 L citrate buffer (pH 5.0 ± 0.2, 50 mM, 50 ± 0.5°C) at 100 rpm. The cellulosic substrate was soaked in the citrate buffer for 2 h before adding the enzymes. Sodium azide was also added at a concentration of 0.005% to restrict any microbial growth during the course of enzymatic hydrolysis. The substrate soaked in citrate buffer was supplemented with cellulase 5 FPU/g at substrate to enzyme ratio of 1:5 [17]. Samples were withdrawn after 48 hrs, centrifuged and supernatant analyzed for total reducing sugars released. The amount of reducing sugars was estimated by DNSA method as described by Miller [15]. The extent of hydrolysis was calculated as: Saccharification % = Reducing sugar concentration obtained
X 0.98 X 100 / Potential sugar concentration in the pretreated substrate
2.7 Microorganism and Maintenance The wild type strain of Saccharomyces cerevisiae MTCC 3821 was procured from Microbial Type Culture Collection (MTCC), Institute of Microbial Technology (IMTECH), Chandigarh, India, and was used in the present investigation. The wild strain of Trichoderma reesei NCIM 1052 was procured from National Collection of Industrial Microorganisms, National Chemical Laboratory, Pune, India. Yeast culture was maintained on Malt Yeast Agar medium with following composition (g/l)-Malt extract, 3; Yeast extract, 3; Peptone, 5; Glucose, 10; Agar, 20, pH: 7.0 ± 0.2. The strain of T. reesei NCIM 1052 was maintained on PDA slants consisted of (g/l): potato, 200; dextrose, 20; agar, 25, pH: 4.8 ± 0.2. Stock cultures were stored at 4°C. The liquid medium for the growth of inoculum for yeast was YEPD medium consisted of (g/l): yeast extract, 10; peptone, 20; dextrose, 20, pH: 5.00 ± 0.2 for 48 h at 28 ± 0.5 °C [18]. Inocula was grown aerobically in 250 ml Erlenmeyer flasks containing the above mentioned medium at 28°C in an Environmental Shaker (Remi Scientific) at 200 rpm for 24 h. Active cells were centrifuged in a clinical centrifuge (1200 rpm), washed with sterile water, and were used as inoculum. 2.8 Immobilization of yeast and SSF Fermentation Immobilization of yeast was done by sodium alginate method [19]. Batch experiments were conducted in a 500 ml capacity of Erlenmeyer flask. Other parameters, like temperature, inoculum level and nutrients were chosen as the most significant ones. The process was conducted at the initial substrate concentration of 20 g/l pretreated substrate
(i.e. peel of C. sinensis var mosambi) and 200 ml citrate buffer (pH 5.0 ± 0.2, 50 mM) followed by sterilization for 15 min, at 15 psi (121°C). The substrate soaked in citrate buffer was supplemented with cellulase, at substrate to enzyme ratio of 1:5 (20g pretreated substrate: 100 ml crude cellulase) or 5 FPU of cellulase was used for hydrolyzing per gram of substrate. The saccharification was done for 24 hrs at 50°C after which simultaneous fermentation was conducted in same vessel by addition of 50 ml of sterilized hydrolysate (obtained after pretreatment) and different nutrients (nutrient parameter 1/2/3, as shown in table 1) at lower temperatures (30ºC / 32ºC / 34ºC). Immobilized yeast cells were used separately as inoculum at different concentrations viz. 2%, 4% or 6%. MgSO4, 0.5 g/l; KCl, 0.5 g/l and FeSO4 0.01 g/l were used as common nutrients in all fermentation experiments other than different nutrient parameters mentioned above. Fermentation was carried out for 72 h after which samples were withdrawn and centrifuged in a laboratory centrifuge at 1200 rpm, and the supernatants were analyzed for ethanol concentration [20]. 3. Analytical Methods 3.1 Biochemical Composition Analysis Total reducing sugars were estimated by dinitrosalicylic acid method of Miller [15]. The ethanol was estimated colorimetrically as described by Caputi et al. [21]. The quantitative and qualitative analysis of sugars in the hydrolysates after pretreatment were analyzed using high performance liquid chromatography (HPLC, Waters) with sugar pak column (Waters USA) and a system composed of a 510 pump, a refraction index differential detector (RI 2414 USA) and a data processor with register (Waters, USA). The samples were filtered through membrane filters 0.45 µm (Millipore) before injection. The temperature of the column was maintained at 70°C by column oven (Dyna, Mumbai) with injection valve of 20 µl. The RI detector was operated at 30°C and the solvent systems used were water as mobile phase at flow rate of 0.2 ml/min. Calculations and analysis were performed using Empower 2 software Build 2154 (Waters). All the experiments were carried out in duplicate and all the reported results were the mean value. The average standard deviation of the achieved results was less than 4%. 3.2 FTIR analysis of peel of C. sinensis var mosambi The structural characteristics of polysaccharide sample were recorded on a Fourier- transform infrared spectrophotometer (IR Affinity- 1, Shimadzu, Japan). The sample was ground with KBr powder (spectroscopic grade) and then pressed into 1mm pellet for FT-IR measurement in the frequency range 4000-400 cm-1, with a spectral resolution of 0.5 cm−1. The spectra would be obtained with an average of 64 scans Analysis was performed in both the native and pretreated samples. The baselines of the spectra were adjusted and normalized with the IRsolution software, and the absorption bands at 1427 and 898 cm-1 were used to calculate the crystallinity index [22].
Paper ID: OCT141379 1655

International Journal of Science and Research (IJSR) ISSN (Online): 2319-7064
Impact Factor (2012): 3.358
Volume 3 Issue 11, November 2014 www.ijsr.net
Licensed Under Creative Commons Attribution CC BY
3.3 Experimental design and Statistical Analysis In the Central Composite Design (CCD), the total number of experimental combinations was 2K +2K + n0, where K is the number of independent variables and n0 is the number of repetitions of the experiments at the central point, which indicated that 20 experiments were required for this procedure. The dependent variable selected for this study was ethanol concentration, Y (g/l). The independent variables chosen were incubation temperature (30°C, 32°C and 34°C) X1, inoculum level (2%, 4% and 6%) X2 and nutrients (1/2/3) X3. A mathematical model, describing the relationships among the process dependent variable and the independent variables in a second-order equation, was developed [23]. Design-based experimental data were matched according to the following second-order polynomial equation (1).
𝒀𝒀 = 𝒃𝒃𝒃𝒃 + �𝒃𝒃𝒃𝒃𝒃𝒃𝒃𝒃𝒌𝒌
𝒃𝒃=𝟏𝟏
+ �𝒃𝒃𝒃𝒃𝒃𝒃𝑥𝑥2𝒃𝒃 +𝒌𝒌
𝒃𝒃=𝟏𝟏
�𝒌𝒌
𝒃𝒃𝒃𝒃<𝑗𝑗
�𝒃𝒃𝒃𝒃𝒃𝒃x𝒃𝒃𝒃𝒃𝒃𝒃 +𝒌𝒌
𝑗𝑗
𝒆𝒆
Where, i, j are linear, quadratic coefficients, respectively, while ‘b’ is regression coefficient, k the number of factors studied and optimized in the experiment and ‘e’ is random error. The quality of fit of the second order equation was expressed by the coefficient of determination R2, and its statistical significance was determined by F-test. The significance of each coefficient was determined using Student’s t-test. The student t-test was used to determine the significance of the parameters regression coefficients. The P values (Probability value) were used as a tool to check the significance of the interaction effects, which in turn may indicate the patterns of the interactions among the variables. In general, larger magnitudes of t and smaller of P, indicates that the corresponding coefficient term is significant. The response surface equation was optimized for maximum yield in the range of process variables using Design Expert software version 9.0.2. Analysis of variance (ANOVA) for the final predictive equation was done using the same software package. Isoresponse contour plots were obtained based on the effect of the levels of three parameters and their interactions on the yield of ethanol by keeping the other parameters at their optimal concentrations. From these contour plots, the interaction of one parameter with another parameter was studied. The optimum concentration of each parameter was identified based on the hump in the contour plots [9]. 4. Results 4.1 Chemical composition of peel of C. sinensis var mosambi Peel of C. sinensis var mosambi was initially characterized with regard to its chemical composition. The pulverized material was found to contain 32 ± 0.36% cellulose, 25 ± 0.18% hemicellulose and 18 ± 0.08% of lignin on dry solid (DS) basis.
4.2 Delignification and enzymatic hydrolysis Among the all chemicals used, steam autoclaving pretreatment of C. sinensis var mosambi peel with NaOH (1% v/v) resulted in maximum hydrolysis (Table 2). The hydrolysate obtained after this pretreatment consisted of 7.67% fructose, 4.98% glucose and 4.46% raffinose (combination of glucose, fructose and galactose). Peaks and area covered by different sugars representing the above percentages can be seen in fig. 1. 2.02% fructose and 1.51% glucose was present in hydrolysate when autoclaving was conducted using distilled water. The average volume of hydrolysate was 10.0 ml, making the sugar stay more concentrated. At larger scale, the concentration value would be lower because the volume of hydrolysate would be greater. A comprehensive account of the above result indicate that 90.32 ± 0.55% saccharification (maximum) was obtained when C. sinensis var mosambi peels were steam autoclaved with 1% NaOH. We collected a significant amount of pulp from C. sinensis var mosambi peel after this pretreatment step when the hydrolysate was centrifuged at 10,000 rpm for 10 min (fig. 2). Enzymatic hydrolysis of 1% NaOH pretreated C. sinensis var mosambi peel was carried out for depolymerization of cell wall carbohydrate fraction into fermentable sugars. Culture supernatant from T. reesei was used for enzymatic saccharification. Enzyme activity (U/ml) of crude cellulase produced by T. reesei NCIM 1052 was 311.1 µmole/ml/min and was loaded @5 FPU/g of substrate and then enzymatic hydrolysis was done at physical parameters (50 ± 0.5 °C, 100 rpm). During the course of enzymatic hydrolysis, a regular increase in released sugars was observed till 50 h and remained constant thereafter (data not shown). Enzymatic saccharification of 1% NaOH pretreated C. sinensis var mosambi peel yielded a maximum of 405.10 ± 0.45 mg/g sugars (40.51 ± 0.42 g/l) glucose with a hydrolysis efficiency of 71.65 ± 0.45% after 48 h of treatment. 4.3 Fourier Transform Infrared (FTIR) Spectroscopy It is observed that absorbance increased in the region between 3800–3000 cm-1 after the pretreatment from 1.251 in native to 1.41 in NaOH treated C. sinensis var mosambi peel [fig. 3 (a1)]. Absorption around 1463 cm-1, 1733 cm-1 and 1515 cm-1 was seen in treated and native C. sinensis var mosambi peel [fig. 3(a2)]. In the range 1300–1000 cm-1, the appearance of peek at 1058 cm-1 observed very prominently in treated C. sinensis var mosambi peel but absent in its native counterpart [fig. 3 (a3)]. This indicates penetration of these chemicals in the amorphous region of the biomass and degrading hemicellulose. Peek at 1164 cm-1 is due to asymmetrical stretching of C-O-C [24, 25]. Absorption at 1010 cm-1 is due to etheric bands, C-O groups [26]. There was a significant increase in these groups after pretreatment [fig. 3 (a3)]. The 1427 and 898 cm-1 absorption bands, which were assigned to the respective crystalline cellulose I and cellulose II, were used to study crystallinity changes. The absorbance ratio A1427/A898 is called crystallinity index (CI). The peak ratio for the native peel was 1.019, while it was 1.037 for the pretreated peel. There is a great difference in CI of native and 1% NaOH treated peel (fig. 4)
Paper ID: OCT141379 1656

International Journal of Science and Research (IJSR) ISSN (Online): 2319-7064
Impact Factor (2012): 3.358
Volume 3 Issue 11, November 2014 www.ijsr.net
Licensed Under Creative Commons Attribution CC BY
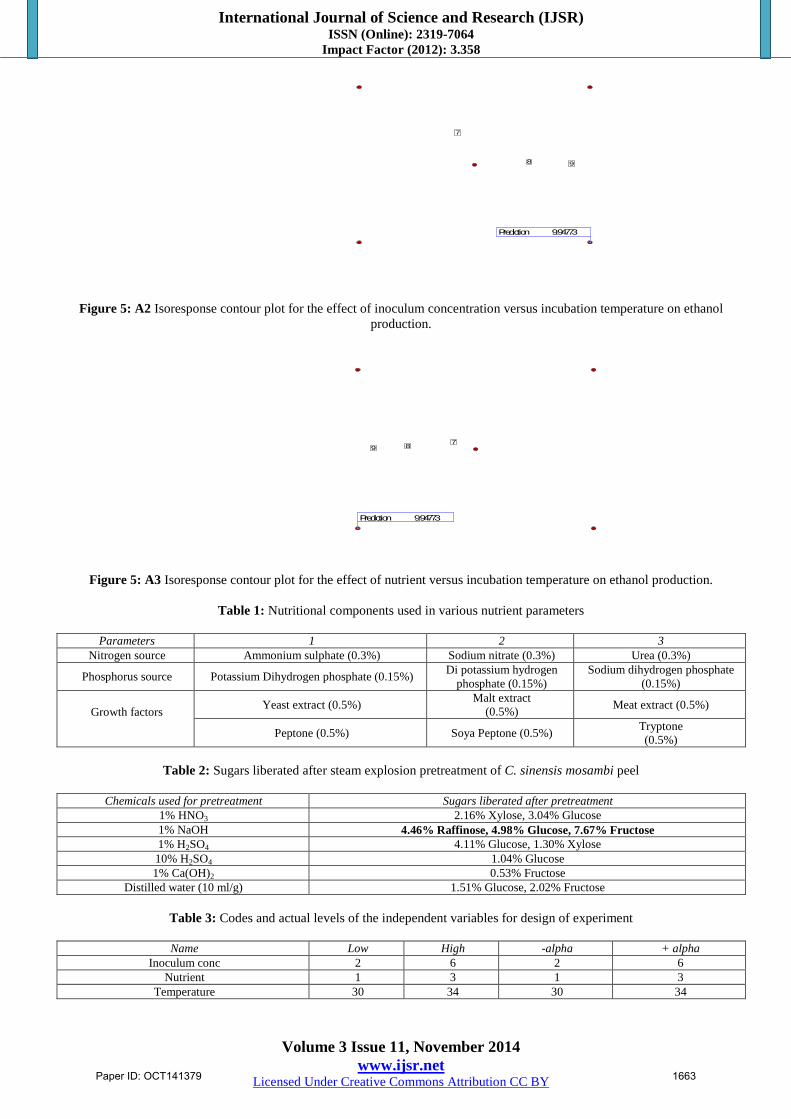
4.4 Optimization of process variables in ethanol fermentation Important process variables for ethanol production from pretreated substrates were optimized using Response Surface Methodology (RSM) based on central composite design (CCD) experiments. The experimental results associated to the processing set up of each independent variable are listed in Table 3. Three level central composite design matrix and the experimental responses of the dependent variable (ethanol conc.) are listed in Table 4. Besides the linear effect of the ethanol concentration, Y g/l, the response surface method also gives an insight about the parameters quadratic and combined effects. The analyses were done by using both Fisher's F- test and Student t-test statistical tools. The regression coefficient, t and P values for all the linear, quadratic and combined effects with a 95% significance level are given in the Table 5. Figures 4 (A-C) show the isoresponse contour plots of the interactive effect of incubation temperature, inoculum concentration and nutrient factor on ethanol production. The response values for the variables can be predicted from these plots. The effect of inoculum concentration and nutrient on ethanol production, while other variable (temperature) was fixed at central level, is shown in Fig. 4 (A). The effect of inoculum concentration and temperature on ethanol production, while other variable (nutrient) was fixed at central level, is shown in Fig. 4 (B). The effect of nutrient and temperature on ethanol production, while other variable (inoculum concentration) was fixed at central level, is shown in Fig. 4 (C). The results are as follow;
The Model F-value of 110.36 implies the model is significant. There is only a 0.01% chance that an F-value this large could occur due to noise. Values of "Prob > F" less than 0.0500 indicate model terms are significant. In this case A, B, C, AB, AC, BC, A^2, B^2 are significant model terms. Values greater than 0.1000 indicate the model terms are not significant (Table 5).
The regression equation obtained from the ANOVA shows (Table 5) that the R2 (coefficient of determination) was 0.9900 (a value > 0.75 indicates fitness of the model). This is an estimate of the fraction of overall variation in the data accounted by the model, and thus the model is capable of explaining 99.0% of the variation in the response. The ‘adjusted R2’ is 0.9811, which indicates that the model is good (for a good statistical model, the R2 value should be in the range of 0 to 1.0, and the nearer to 1.0 the value is, the more fit the model is deemed to be). The "Pred R-Squared" of 0.8417 is in reasonable agreement with the "Adj R-Squared" of 0.9811; i.e. the difference is less than 0.2. "Adeq Precision" measures the signal to noise ratio. A ratio greater than 4 is desirable. Ratio of 35.156 indicates an adequate signal. This model can be used to navigate the design space.
From equations derived by differentiating equation 1 (given in material and methods), the optimum values for the independent variables obtained were incubation temperature 30°C, inoculum concentration 6% and nutrient factor 1. Based on the model, the optimal working conditions were obtained to attain high ethanol yield. Response analysis revealed the maximum ethanol concentration (9.94773 g/l) by Saccharomyces cerevisiae could be achieved at the optimum process conditions Figs. 5 (A1-A3) 4.5 Ethanol fermentation Detoxified hemicellulosic hydrolysate and enzymatic hydrolysates were used for ethanol production using yeasts Saccharomyces cerevisiae under submerged culture cultivation. The processing parameters setup for reaching a maximum response for ethanol production was obtained when applying the optimum values for temperature (30°C), inoculum level (6%) and fermentation medium (composed of ammonium sulphate, KH2PO4, peptone and yeast extract) for Saccharomyces cerevisiae. Maximum ethanol concentration 9.5 g/l was obtained after 72 h from Saccharomyces cerevisiae at the optimized process conditions in anaerobic batch fermentation. 5. Discussions The holocellulosic (hemicellulose + cellulose) content of peels of C. sinensis var mosambi was found to be 57%. The presence of cellulose and hemicellulose together make the total carbohydrate content (TCC) of the substrate (53.0%). It can be fairly compared with the extensively explored lignocelluloses (corn stover, 58.29%; wheat straw, 54% and poplar 58.2%) for ethanol production [27]. The presence of lignin in cellulosic substrates and the crystalline nature of cellulose make it obscure to cellulase and their coordinated action [28]. Lignin may obstruct cellulose hydrolysis by inhibiting their function or by acting as an 'enzymatic trap', which leads to an unfruitful adsorption of the cellulases. The exposure of cellulose through structural alteration of the substrates is the crucial factor in hydrolysis of the remaining cellulosic fraction present in the cell wall. It is required to remove lignin for altering the structure of cellulosic biomass aiding the acquiescence of cellulolytic enzymes which in turn release the fermentable sugars [29, 30]. Therefore lignocellulosic biomass is pretreated prior to enzymatic hydrolysis. Alkaline treatment of NaOH (1% v/v) was found best suited for C. sinensis var mosambi peel which shows that the polymers are converted into monomer and trimers of sugars. Dilute NaOH treatment of lignocellulosic materials has been found to cause swelling, leading to an increase in internal surface area, a decrease in the degree of polymerization, separation of structural linkages between lignin and carbohydrates, and disruption of the lignin structure [31]. Hemicellulose fractions are also removed by alkaline treatments, reaching a maximum removal limit of approximately 96% using NaOH concentrations equal to 1% or higher. As a rule, considering the relative percentages of
Paper ID: OCT141379 1657

International Journal of Science and Research (IJSR) ISSN (Online): 2319-7064
Impact Factor (2012): 3.358
Volume 3 Issue 11, November 2014 www.ijsr.net
Licensed Under Creative Commons Attribution CC BY
the three lignocellulosic components, pretreatment conditions using NaOH concentrations lower than 1% seem to be more efficient for the purposes of this work. NaOH concentrations higher than 1% do not result in further removal of any of the lignocellulosic components, and their use is thus unnecessary and uneconomic. Specifically, the pretreatment using NaOH 1% results in maximum removal of hemicellulose and lignin, considering the experimental conditions used in this work [32]. Alkaline pretreatment of lignocelluloses with NaOH can remove or modify its lignin by fracturing the ester bonds that form cross-links between xylan and lignin, thereby increasing the porosity of the biomass [33]. Several reactive and nonreactive phenomenon are involved which makes the above process very complicated. These phenomenon includes dissolution of nondegraded polysaccharides, peeling-off reaction (referred to as formation of alkali-stable in end-groups), hydrolysis of glycosidic bonds and acetyl groups, and decomposition of dissolved polysaccharides [34]. Therefore the efficiency of NaOH pretreatment depends greatly on the process conditions like temperature, concentration of NaOH, treatment time, as well as the inherent characteristics of the lignocelluloses used [35, 36, 37]. Low-NaOH concentration process was applied in this work, in which C. sinensis var mosambi peels were treated with 1% NaOH at 121°C at 15 psi for 20 min under steam autoclaving. It is a reactive destruction of lignocelluloses, while NaOH at high temperature disintegrates the lignin and hemicelluloses and removes them from the solid phase. This property of NaOH is used in pulping processes. Since the NaOH concentration is very less in this activity, its economy and environmental impact may not be so critical. In contrast to the hydrolysates obtained after acid pretreatment, the hydrolysates obtained after alkali pretreatment does not require detoxification before fermentation further saving the time and money [38]. Hence we recommend the use of 1% NaOH for pretreating C. sinensis var mosambi peel. It has been reported that the cell wall structure and components are significantly different in plants, which may influence the biomass digestibility. Sunflower hulls hydrolyzed with T. reesei Rut C30 cellulase (25 FPU/g of substrate) showed 59.8% saccharification after pretreatment with sodium hydroxide 0.5% (w/v) at an autoclaving pressure of 15 psi for 1 h [39]. Chemical pretreatment not only removes lignin but also acts as a swelling agent, which enhances surface area of the substrate accessible for enzymatic action [40, 41]. Substrate concentration is one of the main factors that affect the yield and initial rate of enzymatic hydrolysis of cellulose. At low substrate levels, an increase of substrate concentration normally results in an increase of the yield and reaction rate of the hydrolysis [42]. However, high substrate concentration can cause substrate inhibition, which substantially lowers the rate of the hydrolysis, and the extent of substrate inhibition depends on the ratio of total substrate to total enzyme [43, 44]. Huang and Penner [43] found that the substrate inhibition occurred when the ratio of the microcrystalline substrate Avicel pH 10.1 to the cellulase
from T. reesei (grams of cellulase FPU [filter paper unit, defined as a micromole of reducing sugar as glucose produced by 1 ml of enzyme per minute] of enzyme) was greater than 5. Penner and Liaw [44] reported that the optimum substrate to enzyme ratio was 1.25 g of the microcrystalline substrate Avicel pH 10.5 per FPU of the cellulase from T. reesei. The amounts of enzymes required for hydrolysis of pretreated raw material depend upon the pretreatment applied to the substrate and the availability of carbohydrate content in the substrate [45]. Zheng et al. [46] observed that high enzyme loadings did not alter saccharification and yields. Enzyme loading of 5 FPU/g substrate was found sufficient to hydrolyze the cellulose present in pretreated C. sinensis var mosambi peel. Our results indicate that hemicellulose removal and the possible relocalization of lignin moieties during pretreatment could yield the desired amount of sugar toward the goal of developing an intensified and simplified process for cellulose saccharification. The obtained data agree that the range 3800–3000 cm-1 comprises bands related to the crystalline structure of cellulose [25]. The region is of great importance and is related to the sum of the valence vibrations of H-bonded OH and intramolecular and intermolecular hydrogen bonds. The absorption in 1733 cm-1 is attributed to a C=O unconjugated stretching of hemicelluloses but also with the contribution of lignin. Absorption around 1733 cm-1, indicates chemical changes in hemicellulose and/or lignin. The absorption around 1463 cm-1 refers to CH2 and CH3 deformation of lignin. Absorption around 1515 cm-1 is associated with C=C aromatic skeletal vibration [25, 47]. Since there is a great difference in CI of native and 1% NaOH treated peel, it appears that the pretreatment adversely affected the degree of cellulose crystallinity. For lignocellulosic biomass, crystallinity measures the relative amount of crystalline cellulose in the total solid. The crystallinity of the pretreated sample was increased due to removal of lignin and hemicellulose (both of which are amorphous). This result was consistent with another report [48]. These findings are also in agreement with the results of yield of glucose after the enzymatic hydrolysis of pretreated substrate with crude cellulase. Hydrolysate generated after pretreatment of peels of C. sinensis var mosambi and enzymatic hydrolysates of pretreated substrate were used for ethanol production using yeasts Saccharomyces cerevisiae under submerged batch culture cultivation. Our results are in agreement with some previous studies done on similar/ parallel substrates. 8.6 and 9.9 g/l ethanol production was reported from peels of sweet lemon using Saccharomyces cerevisiae in solid state fermentation after 24 and 72 hrs respectively [49]. In a parallel set of activity, same organism produced 10.3 g/l ethanol after 72 hrs of incubation in solid substrate fermentation. Wilkins et al. [50] reported the work done with two ethanologenic yeasts, S. cerevisiae and Kluyveromyces marxianus, that were used to ferment hydrolyzed sugars extracted from Valencia orange peel waste. In these conditions S. cerevisiae produced more
Paper ID: OCT141379 1658

International Journal of Science and Research (IJSR) ISSN (Online): 2319-7064
Impact Factor (2012): 3.358
Volume 3 Issue 11, November 2014 www.ijsr.net
Licensed Under Creative Commons Attribution CC BY
ethanol than K. marxianus at 24, 48, and 72 h of culture. With these results and for this reason, S. cerevisiae was preferred over K. marxianus to get more ethanol and higher growth rates than K. marxianus. The results reported showed that ethanol and cell mass yields were inhibited by the presence of limonene in orange peel waste. Ethanol production of 6.84 g/l was reported from citrus waste pulp using S. cerevisiae [51]. Bhatia and Paliwal [52] reported that ammonium sulphate and yeast extract are best suited for growth of P. tannophilus. However in our studies, the production of ethanol from peels of C. sinensis var mosambi was found comparatively better than the studies reported earlier. Economical and ecological aspects considered in each step of our work further adds a value to data obtained. Peel of C. sinensis var mosambi is a potential, renewable and low cost biomass for the production of ethanol by fermentation. 1% NaOH pretreated C. sinensis var mosambi peel showed the maximum saccharification. It is concluded that sweet orange waste might be used as a low-cost material for bioethanol production, thus representing the partial valorisation of sweet orange industrial residues. It can therefore be concluded that bioethanol can be extracted through Simultaneous Saccharification and Fermentation from the peelings of C. sinensis var mosambi using the yeast S. cerevisiae at the optimized process conditions in anaerobic batch fermentation. The researchers would recommend the people to not throw away their sweet orange peelings whenever they consume the fruit, and also the sweet orange-made product manufacturers to store the peelings of the sweet orange they make use of. The researchers would also recommend local waste management committees to collect sweet orange peelings from citizens and submit them to laboratories. Lastly, the researchers would like to recommend scientists to extract bioethanol from sweet orange peelings through the SSF process using S. cerevisiae and to conduct the experiments at optimum parameters for 72-hour fermentation period. Further research regarding other combinations and refinement of the different areas of this methodology for higher bioethanol yield, as well as the feasibility examinations and further studies about the economic technicalities of the study would as well be highly recommended. 6. Acknowledgements We are grateful to Hon’ble Vice Chancellor of Bilaspur University for his constant support and encouragement. We are grateful to the Department of Zoology, Dr. Hari Singh Gour Central University, Sagar, M.P., India, for help in HPLC analysis work. We are also thankful to Dr Suresh Thareja, Pharmacy department, Guru Ghasidas Central University, Bilaspur, C.G., India, for his help in FTIR analysis work. References [1] Krugman P (2008) Grains gone wild. International
Herald Tribune, New York. (April 7).
[2] Braddock RJ (1999) Handbook of citrus by-products and processing technology, John Wiley & Sons, Inc.
[3] Castello G, Garcia JL, Garrido JG, Lopez ADR (2006) Energetic comparison for leaching waste liquid from citric juice production using both reverse osmosis and multiple-effect evaporation. Desalination 191 : 178-185.
[4] Castello EG, Alcaraz N, Gras ML, Mayor L, Argüelles A, Brotons DV (2010) Pectinesterase extraction from orange juice solid wastes. Food INNOVA 1-4.
[5] Rani G, Yadav L, Kalidhar SB (2009) Chemical examination of Citrus sinensis Flavedo variety Pineapple. Indian J Pharm Sci. 71(6):677–679.
[6] Dharmawan J, Barlow PJ, Curran P (2006) Characterisation of volatile compounds in selected citrus fruits from Asia. Developments in Food Science 43:319-322.
[7] Dawson L, Boopathy R (2007) Use of post-harvest sugarcane residue for ethanol production. Biores Technol 98:1695–1699.
[8] Adsul MG, Ghule JE, Shaikh H, Singh R, Bastawde KB, Gokhale DV, Varma AJ (2005) Enzymatic hydrolysis of delignified bagasse polysaccharides. Carbohy Polym 62:6–10.
[9] Sasikumar E, Viruthagiri T (2010) Simultaneous saccharification and fermentation (SSF) of sugarcane bagasse - kinetics and modeling. Int J of Chemical and Biological Eng 3(2):57–64.
[10] Wyman CE (1994) Ethanol from lignocellulosic biomass: Technology, economics, and opportunities. Biores Technol 50:3–16.
[11] Tappi Test Methods (1992) Technical Association of the Pulp and Paper Institute (TAPPI), Atlanta, Georgia, USA.
[12] Szczodrak J, Fiedurek J (1996) Technology for conversion of lignocellulosic biomass to ethanol. Biomass Bioenerg 10:367–375.
[13] Kaar WE, Gutierrez CV, Kinoshita CM (1998) Steam explosion of sugarcane bagasse as a pretreatment for conversion to ethanol. Biomass Bioenerg 14 (3):277–287.
[14] Abdulla E, Feanov T, Costa S, Robra MK, Paulo CA, Gubitz MG (2000) Decolorization and detoxification of textile dyes with a laccase from Trametes hirsute. Applied and Environmental Microbiology 66:3357-3362.
[15] Miller GL (1959) Use of dinitrosalicylic acid reagent for determination of reducing sugar. Analytical Chemistry 31:426-428.
[16] Singhania RR, Skumaran RK, Pillai A, Prema P, Szakacs G, Pandey A (2006) Solid-state fermentation of lignocellulosic substrates for cellulase production by Trichoderma reesei NRRL 11460. Indian Journal of Biotechnology 5:332-336.
[17] Singh A, Abidi AB, Darmwal NS, Agarwal AK (1990) Saccharification of cellulosic substrates by Aspergillus niger cellulase. World Journal of Microbiology and Biotechnology 6:333-336.
[18] Pasha C, Valli N, Rao LV (2007) Lantana camara for fuel ethanol production using thermotolerant yeast. Lett Appl Microbiol 44:666–672.
[19] Smidsrod O, Skjak-Braek G (1990) Alginate as an immobilization matrix for cells. Trends in Biotechnology 8(3):71–78.
Paper ID: OCT141379 1659

International Journal of Science and Research (IJSR) ISSN (Online): 2319-7064
Impact Factor (2012): 3.358
Volume 3 Issue 11, November 2014 www.ijsr.net
Licensed Under Creative Commons Attribution CC BY
[20] Chandel AK, Narasu ML, Chandrasekhar G, Manikyam A, Rao LV (2009) Use of Saccharum spontaneum (wild sugarcane) as biomaterial for cell immobilization and modulated ethanol production by thermotolerant Saccharomyces cerevisiae VS3. Bioresource Technology 100: 2404–2410.
[21] Caputi A, Ueda JM, Brown T (1968) Spectrophotometric determination of chromic complex formed during oxidation of alcohol. American Journal of Ethanol Viticulture 19:160-165.
[22] Mirahmadi K, Kabir MM, Jeihanipour A, Karimi K, Taherzadeh MJ (2010) Alkaline pretreatment of spruce and birch to improve bioethanol and biogas production. Bioresources 5(2):928-938.
[23] Giovanni M, Response surface methodology and product optimization, J Food Technol, 37 (1983) 41–45.
[24] Oh SY, Yoo D, Shin Y, Kim HC, Kim HY, Chung YS, Park WH, Youk JH (2005) Crystalline structure analysis of cellulose treated with sodium hydroxide and carbon dioxide by means of X-ray diffraction and FTIR spectroscopy. Carbohyd Res 340:2376–2391.
[25] Colom X, Carrillo F, Nogues F, Garriga P (2003) Structural analysis of photodegraded wood by means of FTIR spectroscopy. Polym Degrad Stab 80:543–549.
[26] Elbeyli IF, Piskin S (2004) The effect of oxidation on the structure properties and calorific value of lignite. J of Eng and natural sciences 3:43-50.
[27] Chandel AK, Kapoor RK, Singh A, Kuhad RC (2007) Detoxification of sugarcane bagasse hydrolysate improves ethanol production by Candida shehatae NCIM 3501. Bioresource Technol 98:1947–1950.
[28] Berlin A, Maximenko V, Gilkes N, Saddler JN (2007) Optimization of enzyme complexes for lignocellulose hydrolysis. Biotechnol Bioeng 97:287–296.
[29] Taherzadeh MJ, Karimi K (2007) Acid based hydrolysis process for bioethanol production from lignocellulosic materials: a review. BioResources 2:472–499.
[30] Tu M, Chandra R, Saddler JN (2007) Evaluating the distribution of cellulases and recycling of free cellulases during the hydrolysis of lignocellulosic substrates. Biotechnol Prog 23:398–406.
[31] Fan LT, Gharpuray MM, Lee YH (1982) The nature of lignocellulosics and their pretreatments for enzymatic hydrolysis. Adv Biochem Eng 23:157-187.
[32] Rezende CA, de Lima MA, Maziero P, de Azevedo ER, Garcia W, Polikarpov I (2011) Chemical and morphological characterization of sugarcane bagasse submitted to a delignification process for enhanced enzymatic digestibility. Biotechnol Biofuels 4:54.
[33] Tarkow H, Feist W (1969) A mechanism of improving the digestibility of lignocellulosic material with dilute alkali and liquid ammonia. Adv Chem Ser 95:197-218.
[34] Fengel D, Wegener G (1989) Wood Chemistry, Ultrastructure, Reactions, Berlin: Walter de Gruyter.
[35] Zhao XB, Wang L, Liu DH (2008) Peracetic acid pretreatment of sugarcane bagasse for enzymatic hydrolysis: a continued work. J Chem Technol Biotechnol 83:950–6.
[36] Sharma K, Kuhar S, Kuhad R, Bhat P (2007) Combinatorial approaches to improve plant cell wall digestion: Possible solution for cattle feed problems In Lignocellulose Biotechnology: Future Prospects, Kuhad
RC ad Sigh A, IK international Publishing House Pvt Ltd New Delhi.
[37] Waapat M, Sudstol F, Garmo TH (1985) a comparison of alkali treatment methods to improve the nutritive value of straw. Digestibility and metabolizability. Anim Feed Sci Technol 12:295-309.
[38] Chandel AK, da Silva SS, Singh OV (2013) Detoxification of Lignocellulose Hydrolysates: Biochemical and Metabolic Engineering towards White Biotechnology Bioenerg Res 6:388-401.
[39] Sharma SK, Kalra KL, Kocher GS (2004) Fermentation of enzymatic hydrolysate of sunflower hulls for ethanol production and its scale-up. Biomass Bioenerg 27:392–402.
[40] Dien BS, Li XL, Iten LB, Jordan DB, Nichols NN, O’Bryan PJ, Cotta MA (2006) Enzymatic saccharification of hot-water pretreated corn fiber for production of monosaccharides. Enzyme Microb Technol 39:1137–1144.
[41] Kim TH, Taylor F, Hicks K (2008) Bioethanol production from barley hull using SAA (soaking in aqueous ammonia) pretreatment. Biores Technol 99:5694–5702.
[42] Cheung SW, Anderson BC (1997) Laboratory investigation of ethanol production from municipal primary wastewater. Bioresour Technol 59:81–96.
[43] Huang XL, Penner MH (1991) Apparent substrate inhibition of the Trichoderma reesei cellulase system. J Agric Food Chem 39:2096–2100.
[44] Penner MH, Liaw ET (1994) Kinetic consequences of high ratios of substrate to enzyme saccharification systems based on Trichoderma cellulase. In: Himmel ME, Baker JO, Overend, RP (Eds.), Enzymatic Conversion of Biomass for Fuels Production. American Chemical Society, Washington, DC, pp. 363–371.
[45] Saha BC, Iten LB, Cotta MA, Wu YV (2005) Dilute acid pretreatment, enzymatic saccharification and fermentation of wheat straw to ethanol. Proc Biochem 40:3693–3700.
[46] Zheng Y, Pan Z, Zhang R, Wang D (2009) Enzymatic saccharification of dilute acid pretreated saline crops for fermentable sugar production. Appl Ener 86:2459–2467.
[47] Pandey KK (1999) A study of chemical structure of soft and hardwood and wood polymers by FTIR spectroscopy. J Appl Polym Sci 12:1969–1975.
[48] Dwivedi P, Vivekanand V, Pareek N, Sharma A, Singh RP (2010) Bleach enhancement of mixed wood pulp by xylanase-laccase concoction derived through co-culture strategy. Appl Biochem Biotechnol 160:255–68.
[49] Mishra J, Kumar D, Samanta S, Vishwakarma MK (2012) A comparative study of ethanol production from various agro residues by using Saccharomyces cerevisiae and Candida albicans. Journal of Yeast and Fungal Research 3(2):12–17.
[50] Wilkins MR, Suryawati L, Maness NO, Chrz D (2007) Ethanol production by Saccharomyces cerevisiae and Kluyveromyces marxianus in the presence of orange-peel oil. World Journal of Microbiology & Biotechnology 23:1161-116
[51] Raposo S, Pardao JM, Diaz I, Costa MEL (2009) Kinetic modelling of bioethanol production using agro-industrial by-products. Int J of Energy Env 3(1):8.
Paper ID: OCT141379 1660

International Journal of Science and Research (IJSR) ISSN (Online): 2319-7064
Impact Factor (2012): 3.358
Volume 3 Issue 11, November 2014 www.ijsr.net
Licensed Under Creative Commons Attribution CC BY
[52] Bhatia L, Paliwal S (2011) Ethanol producing potential of Pachysolen tannophilus from sugarcane bagasse. Int J of Biotech and Bioeng Res 2 (2):271–276.
Figure 1: HPLC chromatogram of sugars liberated from C. sinensis var mosambi peel after 1% NaOH steam explosion
(G- glucose, R- Raffinose, F- Fructose, (G)n- starch)
Figure 2: Pulp collected after the centrifugation of
hydrolysate of pretreated peels of C. sinensis var mosambi
Paper ID: OCT141379 1661

International Journal of Science and Research (IJSR) ISSN (Online): 2319-7064
Impact Factor (2012): 3.358
Volume 3 Issue 11, November 2014 www.ijsr.net
Licensed Under Creative Commons Attribution CC BY
Figure 3: (a1-a3) Overlapped view of FTIR spectra of native (blue online) and NaOH treated (red online) C. sinensis var
mosambi peel
Figure 4 :Total crystallinity index of native and pretreated C. sinensis var mosambi peel
Figure 5: A1- Isoresponse contour plot for the effect of inoculum concentration versus nutrient on ethanol production.
4
5
6
7
89Prediction 9.94773
Paper ID: OCT141379 1662
International Journal of Science and Research (IJSR) ISSN (Online): 2319-7064
Impact Factor (2012): 3.358
Volume 3 Issue 11, November 2014 www.ijsr.net
Licensed Under Creative Commons Attribution CC BY
Figure 5: A2 Isoresponse contour plot for the effect of inoculum concentration versus incubation temperature on ethanol production.
Figure 5: A3 Isoresponse contour plot for the effect of nutrient versus incubation temperature on ethanol production.
Table 1: Nutritional components used in various nutrient parameters
Parameters 1 2 3
Nitrogen source Ammonium sulphate (0.3%) Sodium nitrate (0.3%) Urea (0.3%)
Phosphorus source Potassium Dihydrogen phosphate (0.15%) Di potassium hydrogen phosphate (0.15%)
Sodium dihydrogen phosphate (0.15%)
Growth factors
Yeast extract (0.5%) Malt extract (0.5%) Meat extract (0.5%)
Peptone (0.5%) Soya Peptone (0.5%) Tryptone (0.5%)
Table 2: Sugars liberated after steam explosion pretreatment of C. sinensis mosambi peel
Chemicals used for pretreatment Sugars liberated after pretreatment
1% HNO3 2.16% Xylose, 3.04% Glucose 1% NaOH 4.46% Raffinose, 4.98% Glucose, 7.67% Fructose 1% H2SO4 4.11% Glucose, 1.30% Xylose 10% H2SO4 1.04% Glucose 1% Ca(OH)2 0.53% Fructose
Distilled water (10 ml/g) 1.51% Glucose, 2.02% Fructose
Table 3: Codes and actual levels of the independent variables for design of experiment
Name Low High -alpha + alpha Inoculum conc 2 6 2 6
Nutrient 1 3 1 3 Temperature 30 34 30 34
7
8 9
Prediction 9.94773
789
Prediction 9.94773
Paper ID: OCT141379 1663

International Journal of Science and Research (IJSR) ISSN (Online): 2319-7064
Impact Factor (2012): 3.358
Volume 3 Issue 11, November 2014 www.ijsr.net
Licensed Under Creative Commons Attribution CC BY
Table 4: Three level CCD and the experimental responses of dependent variable, Y
Factor 1 Factor 2 Factor 3 Response 1 Predicted Values
Std Run A:Inoculum conc B:Nutrient C: Temperature Ethanol yield
mg/ml 18 1 4 2 32 4.5 4.47 2 2 6 1 30 10.3 9.95 3 3 2 3 30 4 3.83 11 4 4 1 32 6.9 7.11 17 5 4 2 32 4.5 4.47 9 6 2 2 32 4.4 4.25 5 7 2 1 34 7.4 7.25 14 8 4 2 34 5.2 5.05 1 9 2 1 30 6.5 6.65 16 10 4 2 32 4.5 4.47 20 11 4 2 32 4.5 4.47 19 12 4 2 32 4.5 4.47 4 13 6 3 30 6.1 6.23 13 14 4 2 30 4.2 4.45 8 15 6 3 34 7 6.83 10 16 6 2 32 6.4 6.65 15 17 4 2 32 4.5 4.47 7 18 2 3 34 5 5.33 12 19 4 3 32 4.4 4.29 6 20 6 1 34 9.5 9.65
Table 5: ANOVA for the quadratic polynomial model for ethanol production
Analysis of variance table [Partial sum of squares - Type III]
Sum of Mean F p-value Source Squares df Square Value Prob > F Model 60.20 9 6.69 110.36 < 0.0001 significant A-Inoculum conc 14.40 1 14.40 237.59 < 0.0001
B-Nutrient 19.88 1 19.88 328.02 < 0.0001 C-Temperature 0.90 1 0.90 14.85 0.0032 AB 0.40 1 0.40 6.68 0.0272 AC 0.40 1 0.40 6.68 0.0272 BC 0.41 1 0.41 6.68 0.0272 A^2 2.65 1 2.65 43.74 < 0.0001 B^2 4.17 1 4.17 68.85 < 0.0001 C^2 0.22 1 0.22 3.60 0.0869 Residual 0.61 10 0.061 Lack of Fit 0.61 5 0.12 Pure Error 0.000 5 0.000 Cor Total 60.81 19
Paper ID: OCT141379 1664