fortress global funds quarterly reports€¦ · fortress global funds quarterly reports ... europe...
TRANSCRIPT

Fortress Global Funds Quarterly Reports
Income Builder US Fund
Income Builder International Fund
US Equity Fund
International Equity Fund
Emerging Markets Fund
Global Opportunity Wealth Fund
December 31, 2016
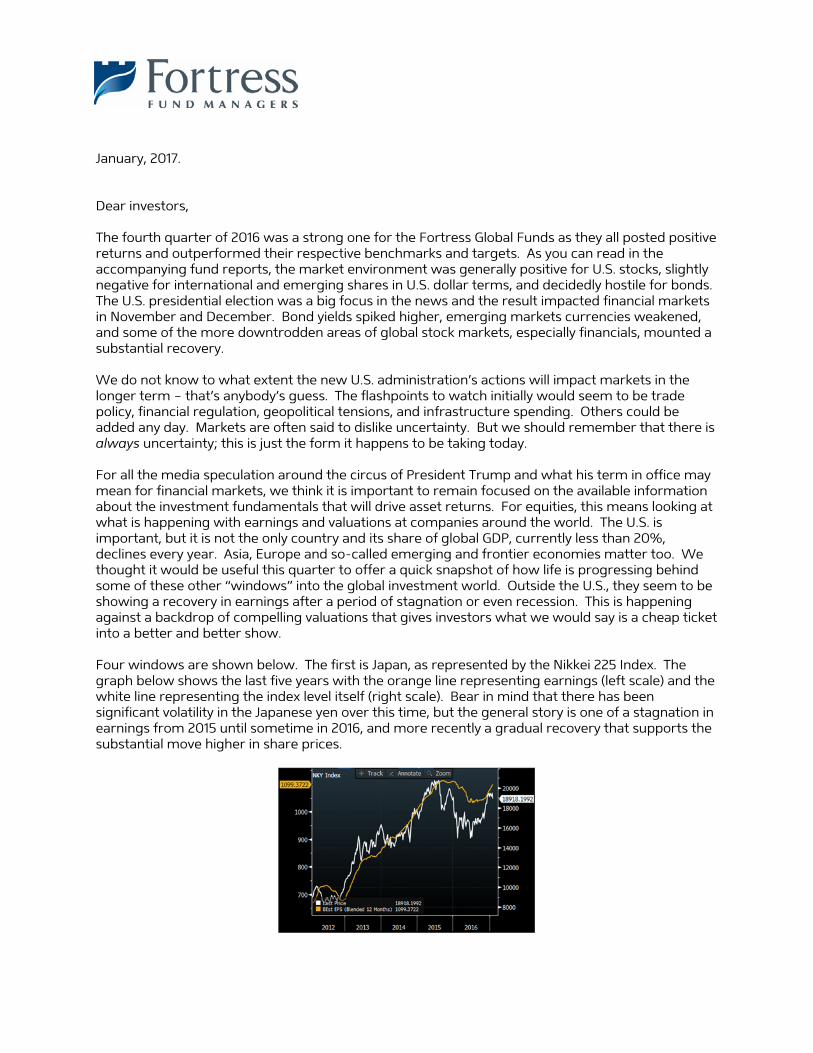
January, 2017. Dear investors, The fourth quarter of 2016 was a strong one for the Fortress Global Funds as they all posted positive returns and outperformed their respective benchmarks and targets. As you can read in the accompanying fund reports, the market environment was generally positive for U.S. stocks, slightly negative for international and emerging shares in U.S. dollar terms, and decidedly hostile for bonds. The U.S. presidential election was a big focus in the news and the result impacted financial markets in November and December. Bond yields spiked higher, emerging markets currencies weakened, and some of the more downtrodden areas of global stock markets, especially financials, mounted a substantial recovery. We do not know to what extent the new U.S. administration’s actions will impact markets in the longer term – that’s anybody’s guess. The flashpoints to watch initially would seem to be trade policy, financial regulation, geopolitical tensions, and infrastructure spending. Others could be added any day. Markets are often said to dislike uncertainty. But we should remember that there is always uncertainty; this is just the form it happens to be taking today. For all the media speculation around the circus of President Trump and what his term in office may mean for financial markets, we think it is important to remain focused on the available information about the investment fundamentals that will drive asset returns. For equities, this means looking at what is happening with earnings and valuations at companies around the world. The U.S. is important, but it is not the only country and its share of global GDP, currently less than 20%, declines every year. Asia, Europe and so-called emerging and frontier economies matter too. We thought it would be useful this quarter to offer a quick snapshot of how life is progressing behind some of these other “windows” into the global investment world. Outside the U.S., they seem to be showing a recovery in earnings after a period of stagnation or even recession. This is happening against a backdrop of compelling valuations that gives investors what we would say is a cheap ticket into a better and better show. Four windows are shown below. The first is Japan, as represented by the Nikkei 225 Index. The graph below shows the last five years with the orange line representing earnings (left scale) and the white line representing the index level itself (right scale). Bear in mind that there has been significant volatility in the Japanese yen over this time, but the general story is one of a stagnation in earnings from 2015 until sometime in 2016, and more recently a gradual recovery that supports the substantial move higher in share prices.
2
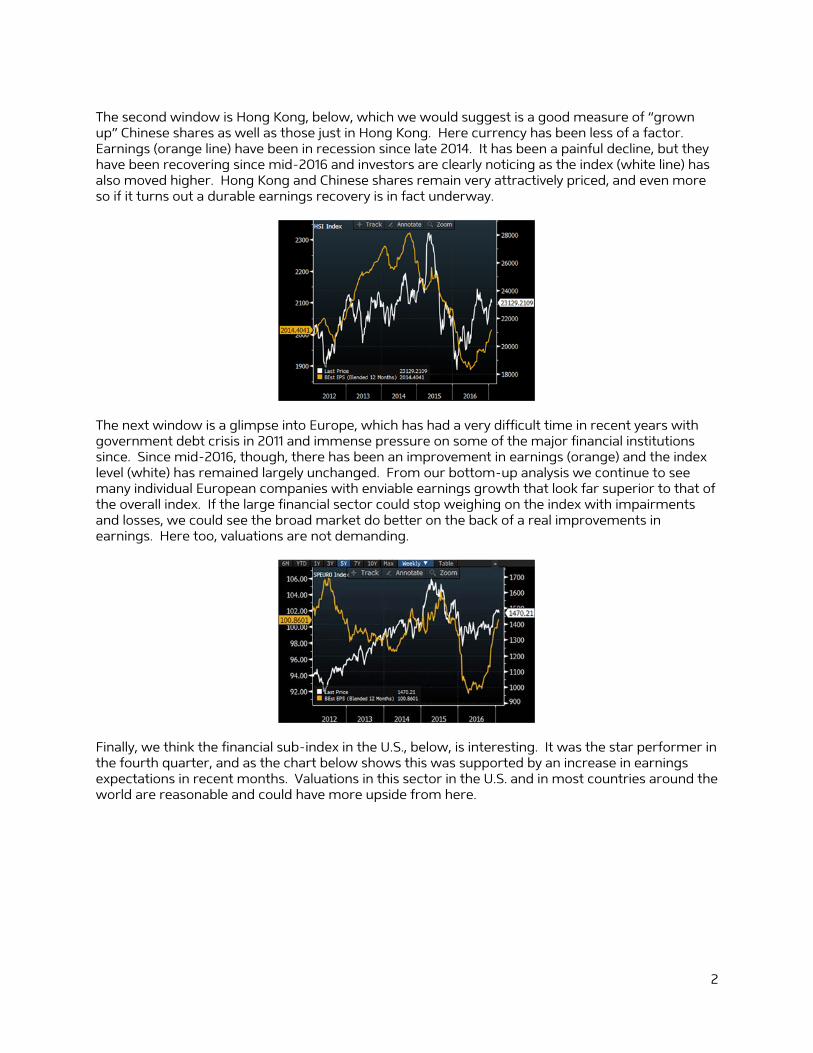
The second window is Hong Kong, below, which we would suggest is a good measure of “grown up” Chinese shares as well as those just in Hong Kong. Here currency has been less of a factor. Earnings (orange line) have been in recession since late 2014. It has been a painful decline, but they have been recovering since mid-2016 and investors are clearly noticing as the index (white line) has also moved higher. Hong Kong and Chinese shares remain very attractively priced, and even more so if it turns out a durable earnings recovery is in fact underway.
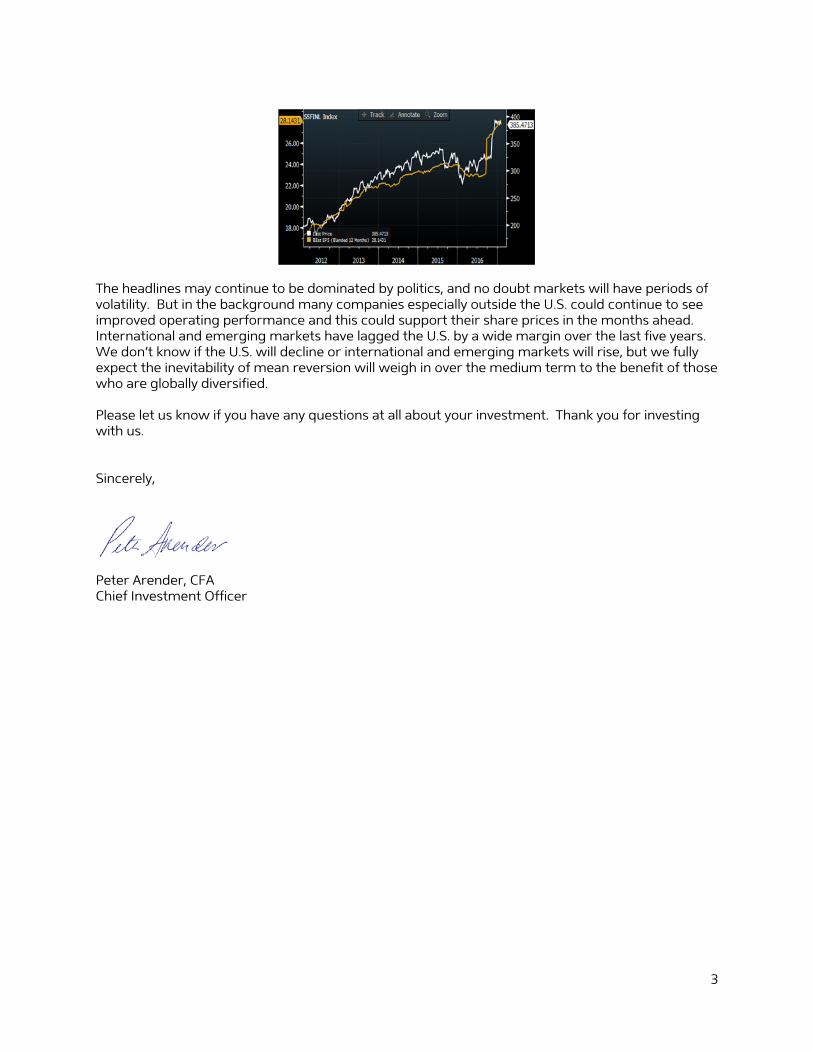
The next window is a glimpse into Europe, which has had a very difficult time in recent years with government debt crisis in 2011 and immense pressure on some of the major financial institutions since. Since mid-2016, though, there has been an improvement in earnings (orange) and the index level (white) has remained largely unchanged. From our bottom-up analysis we continue to see many individual European companies with enviable earnings growth that look far superior to that of the overall index. If the large financial sector could stop weighing on the index with impairments and losses, we could see the broad market do better on the back of a real improvements in earnings. Here too, valuations are not demanding.
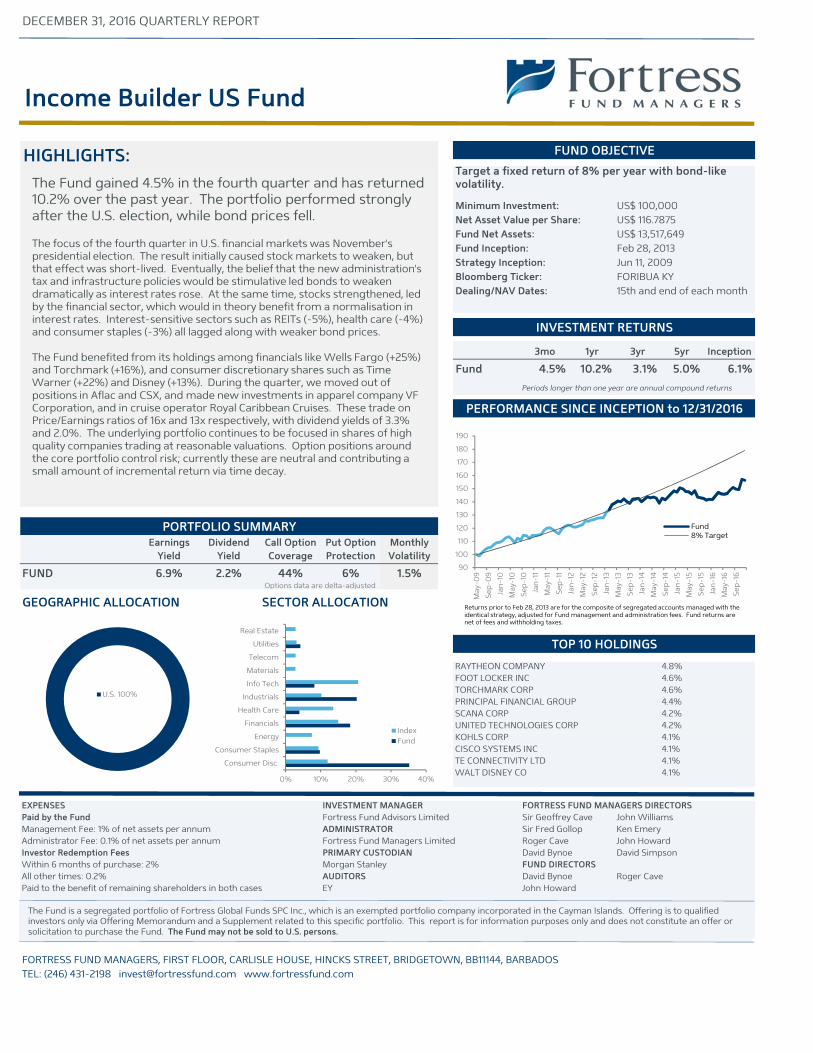
Finally, we think the financial sub-index in the U.S., below, is interesting. It was the star performer in the fourth quarter, and as the chart below shows this was supported by an increase in earnings expectations in recent months. Valuations in this sector in the U.S. and in most countries around the world are reasonable and could have more upside from here.
3
The headlines may continue to be dominated by politics, and no doubt markets will have periods of volatility. But in the background many companies especially outside the U.S. could continue to see improved operating performance and this could support their share prices in the months ahead. International and emerging markets have lagged the U.S. by a wide margin over the last five years. We don’t know if the U.S. will decline or international and emerging markets will rise, but we fully expect the inevitability of mean reversion will weigh in over the medium term to the benefit of those who are globally diversified. Please let us know if you have any questions at all about your investment. Thank you for investing with us. Sincerely,
Peter Arender, CFA Chief Investment Officer
DECEMBER 31, 2016 QUARTERLY REPORT
Income Builder US Fund
FUND OBJECTIVE
Target a fixed return of 8% per year with bond-likevolatility.
Minimum Investment: US$ 100,000
Net Asset Value per Share:
Fund Net Assets: US$ 13,517,649
Fund Inception: Feb 28, 2013
Strategy Inception: Jun 11, 2009
Bloomberg Ticker: FORIBUA KY
Dealing/NAV Dates: 15th and end of each month
INVESTMENT RETURNS
3mo 1yr 3yr 5yr Inception
Fund 4.5% 10.2% 3.1% 5.0% 6.1%
Periods longer than one year are annual compound returns
PERFORMANCE SINCE INCEPTION to 12/31/2016
PORTFOLIO SUMMARYEarnings Dividend Call Option Put Option Monthly
Yield Yield Coverage Protection Volatility
FUND 6.9% 2.2% 44% 6% 1.5%Options data are delta-adjusted
GEOGRAPHIC ALLOCATION SECTOR ALLOCATION
TOP 10 HOLDINGS
RAYTHEON COMPANY 4.8%
FOOT LOCKER INC 4.6%
TORCHMARK CORP 4.6%
PRINCIPAL FINANCIAL GROUP 4.4%
SCANA CORP 4.2%
UNITED TECHNOLOGIES CORP 4.2%
KOHLS CORP 4.1%
CISCO SYSTEMS INC 4.1%
TE CONNECTIVITY LTD 4.1%
WALT DISNEY CO 4.1%
EXPENSES INVESTMENT MANAGER FORTRESS FUND MANAGERS DIRECTORS
Paid by the Fund Fortress Fund Advisors Limited Sir Geoffrey Cave John Williams
Management Fee: 1% of net assets per annum ADMINISTRATOR Sir Fred Gollop Ken Emery
Administrator Fee: 0.1% of net assets per annum Fortress Fund Managers Limited Roger Cave John Howard
Investor Redemption Fees PRIMARY CUSTODIAN David Bynoe David Simpson
Within 6 months of purchase: 2% Morgan Stanley FUND DIRECTORS
All other times: 0.2% AUDITORS David Bynoe Roger Cave
Paid to the benefit of remaining shareholders in both cases EY John Howard
FORTRESS FUND MANAGERS, FIRST FLOOR, CARLISLE HOUSE, HINCKS STREET, BRIDGETOWN, BB11144, BARBADOS
TEL: (246) 431-2198 [email protected] www.fortressfund.com
HIGHLIGHTS:
US$ 116.7875
The Fund gained 4.5% in the fourth quarter and has returned 10.2% over the past year. The portfolio performed strongly after the U.S. election, while bond prices fell.
The focus of the fourth quarter in U.S. financial markets was November's presidential election. The result initially caused stock markets to weaken, but that effect was short-lived. Eventually, the belief that the new administration's tax and infrastructure policies would be stimulative led bonds to weaken dramatically as interest rates rose. At the same time, stocks strengthened, led by the financial sector, which would in theory benefit from a normalisation in interest rates. Interest-sensitive sectors such as REITs (-5%), health care (-4%) and consumer staples (-3%) all lagged along with weaker bond prices.
The Fund benefited from its holdings among financials like Wells Fargo (+25%) and Torchmark (+16%), and consumer discretionary shares such as Time Warner (+22%) and Disney (+13%). During the quarter, we moved out of positions in Aflac and CSX, and made new investments in apparel company VF Corporation, and in cruise operator Royal Caribbean Cruises. These trade on Price/Earnings ratios of 16x and 13x respectively, with dividend yields of 3.3% and 2.0%. The underlying portfolio continues to be focused in shares of high quality companies trading at reasonable valuations. Option positions around the core portfolio control risk; currently these are neutral and contributing a small amount of incremental return via time decay.
90
100
110
120
130
140
150
160
170
180
190
Ma
y-0
9
Se
p-0
9
Jan
-10
Ma
y-10
Se
p-1
0
Jan
-11
Ma
y-11
Se
p-1
1
Jan
-12
Ma
y-12
Se
p-1
2
Jan
-13
Ma
y-13
Se
p-1
3
Jan
-14
Ma
y-14
Se
p-1
4
Jan
-15
Ma
y-15
Se
p-1
5
Jan
-16
Ma
y-16
Se
p-1
6
Fund8% Target
0% 10% 20% 30% 40%
Consumer Disc.
Consumer Staples
Energy
Financials
Health Care
Industrials
Info Tech
Materials
Telecom
Utilities
Real Estate
Index
Fund
U.S. 100%
The Fund is a segregated portfolio of Fortress Global Funds SPC Inc., which is an exempted portfolio company incorporated in the Cayman Islands. Offering is to qualified investors only via Offering Memorandum and a Supplement related to this specific portfolio. This report is for information purposes only and does not constitute an offer or solicitation to purchase the Fund. The Fund may not be sold to U.S. persons.
Returns prior to Feb 28, 2013 are for the composite of segregated accounts managed with the identical strategy, adjusted for Fund management and administration fees. Fund returns are net of fees and withholding taxes.

DECEMBER 31, 2016 QUARTERLY REPORT
Income Builder International Fund
FUND OBJECTIVE
Target a fixed return of 8% per year with bond-likevolatility.
Minimum Investment: US$ 100,000
Net Asset Value per Share:
Fund Net Assets: US$ 13,226,901
Fund Inception: Feb 28, 2013
Strategy Inception: Jun 1, 2012
Bloomberg Ticker: FORIBIA KY
Dealing/NAV Dates: 15th and end of each month
INVESTMENT RETURNS
3mo 1yr 3yr 5yr Inception
Fund 3.8% 6.2% 0.3% n/a 3.7%
Periods longer than one year are annual compound returns
PERFORMANCE SINCE INCEPTION to 12/31/2016
PORTFOLIO SUMMARYEarnings Dividend Call Option Put Option Monthly
Yield Yield Coverage Protection Volatility
FUND 9.5% 3.4% 41% 15% 2.7%Options data are delta-adjusted
GEOGRAPHIC ALLOCATION SECTOR ALLOCATION
TOP 10 HOLDINGS
RANDSTAD HOLDING NV 4.3%
BANK OF NOVA SCOTIA 4.3%
MANULIFE FINANCIAL CORP 4.1%
PUBLICIS GROUPE 4.0%
VALEO SA 3.9%
HENKEL AG & CO KGAA 3.9%
BAYERISCHE MOTOREN WERKE AG 3.8%
AXA SA 3.8%
TOYOTA MOTOR CORP -SPON ADR 3.6%
BAYER AG-REG 3.5%
EXPENSES INVESTMENT MANAGER FORTRESS FUND MANAGERS DIRECTORS
Paid by the Fund Fortress Fund Advisors Limited Sir Geoffrey Cave John Williams
Management Fee: 1% of net assets per annum ADMINISTRATOR Sir Fred Gollop Ken Emery
Administrator Fee: 0.1% of net assets per annum Fortress Fund Managers Limited Roger Cave John Howard
Investor Redemption Fees PRIMARY CUSTODIAN David Bynoe David Simpson
Within 6 months of purchase: 2% Morgan Stanley FUND DIRECTORS
All other times: 0.2% AUDITORS David Bynoe Roger Cave
Paid to the benefit of remaining shareholders in both cases EY John Howard
FORTRESS FUND MANAGERS, FIRST FLOOR, CARLISLE HOUSE, HINCKS STREET, BRIDGETOWN, BB11144, BARBADOS
TEL: (246) 431-2198 [email protected] www.fortressfund.com
HIGHLIGHTS:
US$ 105.9826
The Fund gained 3.8% in the fourth quarter and has returned 6.2% over the past year. International shares benefited from a move higher in most global markets, but returns were reduced by currency weakness.
The U.S. election result unleashed a wave of buying in many stock markets around the world, and led to a decline in bond prices as interest rates rose. The Fund's holdings in financials and materials performed especially well. During the quarter we moved out of positions in Industrial and Commercial Bank of China and Yara International as they strengthened, and established new holdings in Japanese communications provider KDDI and German health care and chemical company Bayer AG. These two have Price/Earnings ratios of 13x and 14x respectively, and dividend yields of 2.5% and 2.4%. They also have solid balance sheets and healthy earnings growth.
The underlying portfolio remains well valued and priced for substantial long-term returns, especially given recent U.S. dollar strength. An average Price/Earnings yield of just over 10x provides a solid engine of growing earnings at a reasonable price, more than a third of which are paid as dividends to the Fund. Options positions around the portfolio reduce risk and are currently adding some incremental return.
90
100
110
120
130
140
150
May-12 Dec-12 Jul-13 Feb-14 Sep-14 Apr-15 Nov-15 Jun-16
Fund8% Target
0% 20% 40%
Consumer Disc.
Consumer Staples
Energy
Financials
Health Care
Industrials
Info Tech
Materials
Telecom
Utilities
Real Estate
Index
Fund
North America 11%
Japan 23%
Europe 59%
Asia Ex Japan 0%
Emerging Markets 7%
The Fund is a segregated portfolio of Fortress Global Funds SPC Inc., which is an exempted portfolio company incorporated in the Cayman Islands. Offering is to qualified investors only via Offering Memorandum and a Supplement related to this specific portfolio. This report is for information purposes only and does not constitute an offer or solicitation to purchase the Fund. The Fund may not be sold to U.S. persons.
Returns prior to Feb 28, 2013 are for the composite of segregated accounts managed with the identical strategy, adjusted for Fund management and administration fees. Fund returns are net of fees and withholding taxes.
DECEMBER 31, 2016 QUARTERLY REPORT
US Equity Fund
FUND OBJECTIVE
Long term growth with limited risk in U.S. largecap equities.
Minimum Investment: US$ 100,000
Net Asset Value per Share:
Fund Net Assets: US$ 6,509,645
Fund Inception: Feb 28, 2013
Strategy Inception: Feb 18, 2009
Bloomberg Ticker: FORUEFA KY
Dealing/NAV Dates: 15th and end of each month
INVESTMENT RETURNS
3mo 1yr 3yr 5yr Inception
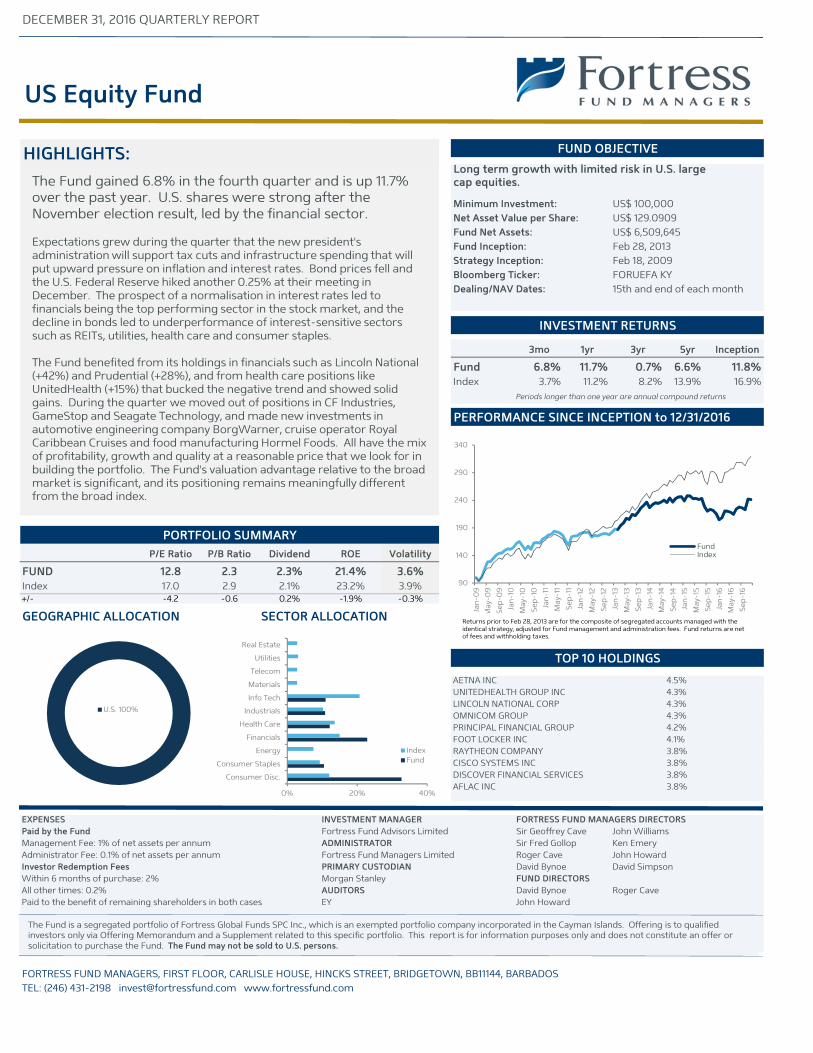
Fund 6.8% 11.7% 0.7% 6.6% 11.8%
Index 3.7% 11.2% 8.2% 13.9% 16.9%
Periods longer than one year are annual compound returns
PERFORMANCE SINCE INCEPTION to 12/31/2016
PORTFOLIO SUMMARY
P/E Ratio P/B Ratio Dividend ROE Volatility
FUND 12.8 2.3 2.3% 21.4% 3.6%
Index 17.0 2.9 2.1% 23.2% 3.9%+/- -4.2 -0.6 0.2% -1.9% -0.3%
GEOGRAPHIC ALLOCATION SECTOR ALLOCATION
TOP 10 HOLDINGS
AETNA INC 4.5%
UNITEDHEALTH GROUP INC 4.3%
LINCOLN NATIONAL CORP 4.3%
OMNICOM GROUP 4.3%
PRINCIPAL FINANCIAL GROUP 4.2%
FOOT LOCKER INC 4.1%
RAYTHEON COMPANY 3.8%
CISCO SYSTEMS INC 3.8%
DISCOVER FINANCIAL SERVICES 3.8%
AFLAC INC 3.8%
EXPENSES INVESTMENT MANAGER FORTRESS FUND MANAGERS DIRECTORS
Paid by the Fund Fortress Fund Advisors Limited Sir Geoffrey Cave John Williams
Management Fee: 1% of net assets per annum ADMINISTRATOR Sir Fred Gollop Ken Emery
Administrator Fee: 0.1% of net assets per annum Fortress Fund Managers Limited Roger Cave John Howard
Investor Redemption Fees PRIMARY CUSTODIAN David Bynoe David Simpson
Within 6 months of purchase: 2% Morgan Stanley FUND DIRECTORS
All other times: 0.2% AUDITORS David Bynoe Roger Cave
Paid to the benefit of remaining shareholders in both cases EY John Howard
FORTRESS FUND MANAGERS, FIRST FLOOR, CARLISLE HOUSE, HINCKS STREET, BRIDGETOWN, BB11144, BARBADOS
TEL: (246) 431-2198 [email protected] www.fortressfund.com
HIGHLIGHTS:
US$ 129.0909
The Fund gained 6.8% in the fourth quarter and is up 11.7% over the past year. U.S. shares were strong after the November election result, led by the financial sector.
Expectations grew during the quarter that the new president's administration will support tax cuts and infrastructure spending that will put upward pressure on inflation and interest rates. Bond prices fell and the U.S. Federal Reserve hiked another 0.25% at their meeting in December. The prospect of a normalisation in interest rates led to financials being the top performing sector in the stock market, and the decline in bonds led to underperformance of interest-sensitive sectors such as REITs, utilities, health care and consumer staples.
The Fund benefited from its holdings in financials such as Lincoln National (+42%) and Prudential (+28%), and from health care positions like UnitedHealth (+15%) that bucked the negative trend and showed solid gains. During the quarter we moved out of positions in CF Industries, GameStop and Seagate Technology, and made new investments in automotive engineering company BorgWarner, cruise operator Royal Caribbean Cruises and food manufacturing Hormel Foods. All have the mix of profitability, growth and quality at a reasonable price that we look for in building the portfolio. The Fund's valuation advantage relative to the broad market is significant, and its positioning remains meaningfully different from the broad index.
90
140
190
240
290
340
Jan
-09
Ma
y-0
9
Se
p-0
9
Jan
-10
Ma
y-10
Se
p-1
0
Jan
-11
Ma
y-11
Se
p-1
1
Jan
-12
Ma
y-12
Se
p-1
2
Jan
-13
Ma
y-13
Se
p-1
3
Jan
-14
Ma
y-14
Se
p-1
4
Jan
-15
Ma
y-15
Se
p-1
5
Jan
-16
Ma
y-16
Se
p-1
6
FundIndex
0% 20% 40%
Consumer Disc.
Consumer Staples
Energy
Financials
Health Care
Industrials
Info Tech
Materials
Telecom
Utilities
Real Estate
Index
Fund
U.S. 100%
The Fund is a segregated portfolio of Fortress Global Funds SPC Inc., which is an exempted portfolio company incorporated in the Cayman Islands. Offering is to qualified investors only via Offering Memorandum and a Supplement related to this specific portfolio. This report is for information purposes only and does not constitute an offer or solicitation to purchase the Fund. The Fund may not be sold to U.S. persons.
Returns prior to Feb 28, 2013 are for the composite of segregated accounts managed with the identical strategy, adjusted for Fund management and administration fees. Fund returns are net of fees and withholding taxes.
DECEMBER 31, 2016 QUARTERLY REPORT
International Equity Fund
FUND OBJECTIVE
Long term growth with limited risk in non-U.S. large cap equities.
Minimum Investment: US$ 100,000
Net Asset Value per Share:
Fund Net Assets: US$ 16,440,247
Fund Inception: Feb 28, 2013
Strategy Inception: Jun 30, 2009
Bloomberg Ticker: FORIEFA KY
Dealing/NAV Dates: 15th and end of each month
INVESTMENT RETURNS
3mo 1yr 3yr 5yr Inception
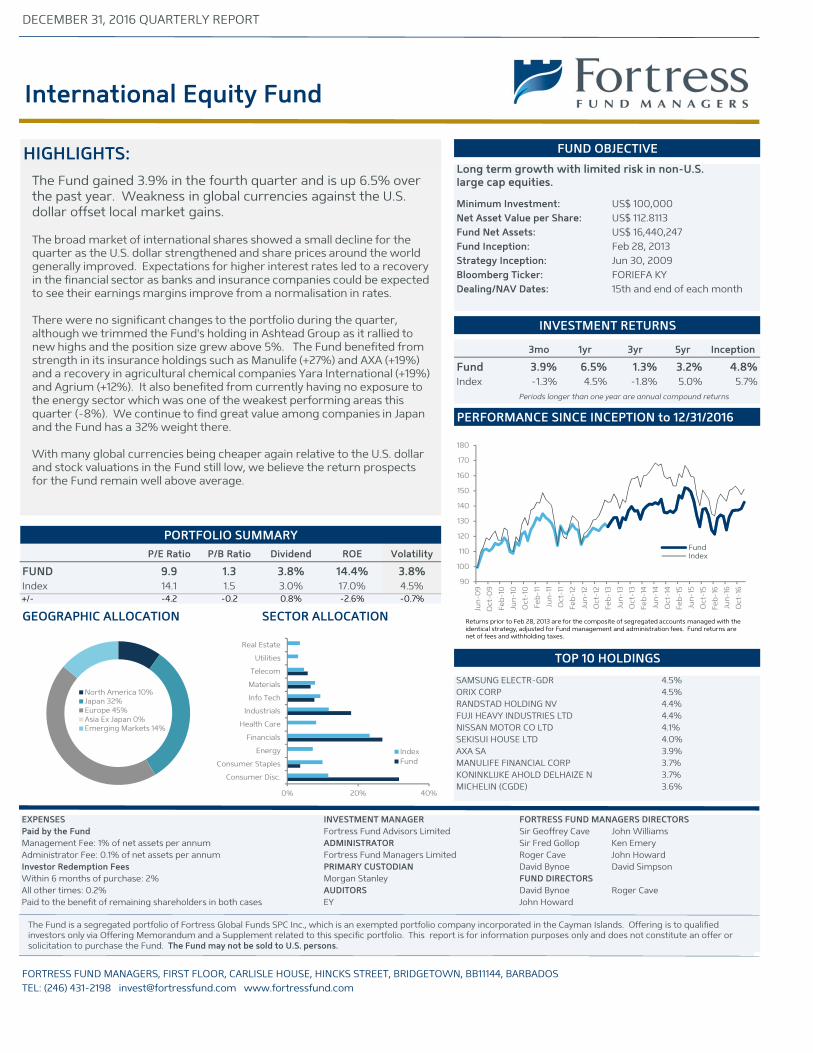
Fund 3.9% 6.5% 1.3% 3.2% 4.8%
Index -1.3% 4.5% -1.8% 5.0% 5.7%
Periods longer than one year are annual compound returns
PERFORMANCE SINCE INCEPTION to 12/31/2016
PORTFOLIO SUMMARY
P/E Ratio P/B Ratio Dividend ROE Volatility
FUND 9.9 1.3 3.8% 14.4% 3.8%
Index 14.1 1.5 3.0% 17.0% 4.5%+/- -4.2 -0.2 0.8% -2.6% -0.7%
GEOGRAPHIC ALLOCATION SECTOR ALLOCATION
TOP 10 HOLDINGS
SAMSUNG ELECTR-GDR 4.5%
ORIX CORP 4.5%
RANDSTAD HOLDING NV 4.4%
FUJI HEAVY INDUSTRIES LTD 4.4%
NISSAN MOTOR CO LTD 4.1%
SEKISUI HOUSE LTD 4.0%
AXA SA 3.9%
MANULIFE FINANCIAL CORP 3.7%
KONINKLIJKE AHOLD DELHAIZE N 3.7%
MICHELIN (CGDE) 3.6%
EXPENSES INVESTMENT MANAGER FORTRESS FUND MANAGERS DIRECTORS
Paid by the Fund Fortress Fund Advisors Limited Sir Geoffrey Cave John Williams
Management Fee: 1% of net assets per annum ADMINISTRATOR Sir Fred Gollop Ken Emery
Administrator Fee: 0.1% of net assets per annum Fortress Fund Managers Limited Roger Cave John Howard
Investor Redemption Fees PRIMARY CUSTODIAN David Bynoe David Simpson
Within 6 months of purchase: 2% Morgan Stanley FUND DIRECTORS
All other times: 0.2% AUDITORS David Bynoe Roger Cave
Paid to the benefit of remaining shareholders in both cases EY John Howard
FORTRESS FUND MANAGERS, FIRST FLOOR, CARLISLE HOUSE, HINCKS STREET, BRIDGETOWN, BB11144, BARBADOS
TEL: (246) 431-2198 [email protected] www.fortressfund.com
HIGHLIGHTS:
US$ 112.8113
The Fund gained 3.9% in the fourth quarter and is up 6.5% over the past year. Weakness in global currencies against the U.S. dollar offset local market gains.
The broad market of international shares showed a small decline for the quarter as the U.S. dollar strengthened and share prices around the world generally improved. Expectations for higher interest rates led to a recovery in the financial sector as banks and insurance companies could be expected to see their earnings margins improve from a normalisation in rates.
There were no significant changes to the portfolio during the quarter, although we trimmed the Fund's holding in Ashtead Group as it rallied to new highs and the position size grew above 5%. The Fund benefited from strength in its insurance holdings such as Manulife (+27%) and AXA (+19%) and a recovery in agricultural chemical companies Yara International (+19%) and Agrium (+12%). It also benefited from currently having no exposure to the energy sector which was one of the weakest performing areas this quarter (-8%). We continue to find great value among companies in Japan and the Fund has a 32% weight there.
With many global currencies being cheaper again relative to the U.S. dollar and stock valuations in the Fund still low, we believe the return prospects for the Fund remain well above average.
90
100
110
120
130
140
150
160
170
180
Jun
-09
Oc
t-0
9
Fe
b-1
0
Jun
-10
Oc
t-10
Fe
b-1
1
Jun
-11
Oc
t-11
Fe
b-1
2
Jun
-12
Oc
t-12
Fe
b-1
3
Jun
-13
Oc
t-13
Fe
b-1
4
Jun
-14
Oc
t-14
Fe
b-1
5
Jun
-15
Oc
t-15
Fe
b-1
6
Jun
-16
Oc
t-16
FundIndex
0% 20% 40%
Consumer Disc.
Consumer Staples
Energy
Financials
Health Care
Industrials
Info Tech
Materials
Telecom
Utilities
Real Estate
Index
Fund
North America 10%Japan 32%Europe 45%Asia Ex Japan 0%Emerging Markets 14%
The Fund is a segregated portfolio of Fortress Global Funds SPC Inc., which is an exempted portfolio company incorporated in the Cayman Islands. Offering is to qualified investors only via Offering Memorandum and a Supplement related to this specific portfolio. This report is for information purposes only and does not constitute an offer or solicitation to purchase the Fund. The Fund may not be sold to U.S. persons.
Returns prior to Feb 28, 2013 are for the composite of segregated accounts managed with the identical strategy, adjusted for Fund management and administration fees. Fund returns are net of fees and withholding taxes.

DECEMBER 31, 2016 QUARTERLY REPORT
Emerging Markets Fund
FUND OBJECTIVE
Long term growth with limited risk in emerging markets equities.
Minimum Investment: US$ 100,000
Net Asset Value per Share:
Fund Net Assets: US$ 15,566,058
Fund Inception: Feb 28, 2013
Strategy Inception: Dec 20, 2012
Bloomberg Ticker: FORTEMA KY
Dealing/NAV Dates: 15th and end of each month
INVESTMENT RETURNS
3mo 1yr 3yr 5yr Inception
Fund 2.7% 16.2% 0.2% n/a -0.4%
Index -4.2% 11.2% -2.6% 1.3% -2.5%
Periods longer than one year are annual compound returns
PERFORMANCE SINCE INCEPTION to 12/31/2016
PORTFOLIO SUMMARY
P/E Ratio P/B Ratio Dividend ROE Volatility
FUND 7.6 1.0 3.8% 14.1% 5.1%
Index 11.9 1.5 2.5% 16.7% 4.3%+/- -4.3 -0.5 1.3% -2.6% 0.8%
GEOGRAPHIC ALLOCATION SECTOR ALLOCATION
TOP 10 HOLDINGS
SAMSUNG ELECTR-GDR 4.8%
LUKOIL PJSC-SPON ADR 4.8%
BARCLAYS AFRICA GROUP LTD 4.8%
IND & COMM BK OF CHINA-H 4.7%
BANCO DO BRASIL SA-SPON ADR 4.7%
CHINA MERCHANTS BANK-H 4.4%
PICC PROPERTY & CASUALTY-H 4.3%
BARLOWORLD LTD 4.2%
TATNEFT PAO-SPONSORED ADR 4.2%
BANK OF COMMUNICATIONS CO-H 4.1%
EXPENSES INVESTMENT MANAGER FORTRESS FUND MANAGERS DIRECTORS
Paid by the Fund Fortress Fund Advisors Limited Sir Geoffrey Cave John Williams
Management Fee: 1% of net assets per annum ADMINISTRATOR Sir Fred Gollop Ken Emery
Administrator Fee: 0.1% of net assets per annum Fortress Fund Managers Limited Roger Cave John Howard
Investor Redemption Fees PRIMARY CUSTODIAN David Bynoe David Simpson
Within 6 months of purchase: 2% Morgan Stanley FUND DIRECTORS
All other times: 0.5% AUDITORS David Bynoe Roger Cave
Paid to the benefit of remaining shareholders in both cases EY John Howard
FORTRESS FUND MANAGERS, FIRST FLOOR, CARLISLE HOUSE, HINCKS STREET, BRIDGETOWN, BB11144, BARBADOS
TEL: (246) 431-2198 [email protected] www.fortressfund.com
HIGHLIGHTS:
US$ 97.7489
The Fund gained 2.7% in the fourth quarter and is up 16.2% over the past year. It outperformed a generally negative market this quarter as the U.S. election result weighed on emerging markets.
The U.S. election was generally seen as negative for emerging markets such as Mexico (-9%) but it supported some other areas and these included the Fund's holdings in Russian energy shares. Tatneft (+34%), Rosneft (+19%) and Gazprom (+20%) all surged ; it remains to be seen if they can hold onto their gains. With low single-digit Price/Earnings ratios and dividend yields of approximately 5% they certainly have value on their side. The Fund also saw gains this quarter from holdings in South African logistics and industrial company Barloworld which gained 42%, and still trades at a P/E of only 11x.
During the quarter we moved out of a position in Banco do Brasil and established a new holding in Chinese carmaker Guangzhou Automobile Group, a company with a great balance sheet, strong earnings growth and a P/E of 9x. We also added marginally to our holdings in Taiwan on weakness. The Fund's portfolio continues to have a significant valuation advantage compared to the broad market, which itself is reasonably valued. With an average P/E of less than 8x, a dividend yield of nearly 4%, and a number of currencies that are reasonably valued if not downright cheap, we still see significant long-term return potential for the Fund.
75
80
85
90
95
100
105
110
115
120
125
Fund
Index
0% 20% 40%
Consumer Disc.
Consumer Staples
Energy
Financials
Health Care
Industrials
Info Tech
Materials
Telecom
Utilities
Real Estate
Index
Fund
Taiwan 8%China/HK 43%Russia 16%Brazil 8%South Africa 16%Other 8%
The Fund is a segregated portfolio of Fortress Global Funds SPC Inc., which is an exempted portfolio company incorporated in the Cayman Islands. Offering is to qualified investors only via Offering Memorandum and a Supplement related to this specific portfolio. This report is for information purposes only and does not constitute an offer or solicitation to purchase the Fund. The Fund may not be sold to U.S. persons.
Returns prior to Feb 28, 2013 are for the composite of segregated accounts managed with the identical strategy, adjusted for Fund management and administration fees. Fund returns are net of fees and withholding taxes.
DECEMBER 31, 2016 QUARTERLY REPORT
Global Opportunity Wealth Fund
FUND OBJECTIVE
Long term wealth preservation and growth forthe whole portfolio.
Minimum Investment: US$ 100,000
Net Asset Value per Share:
Fund Net Assets: US$ 3,563,504
Fund Inception: May 31, 2013
Strategy Inception: May 31, 2013
Bloomberg Ticker: FORTGOW KY
Dealing/NAV Dates: 15th and end of each month
INVESTMENT RETURNS
3mo 1yr 3yr 5yr Inception
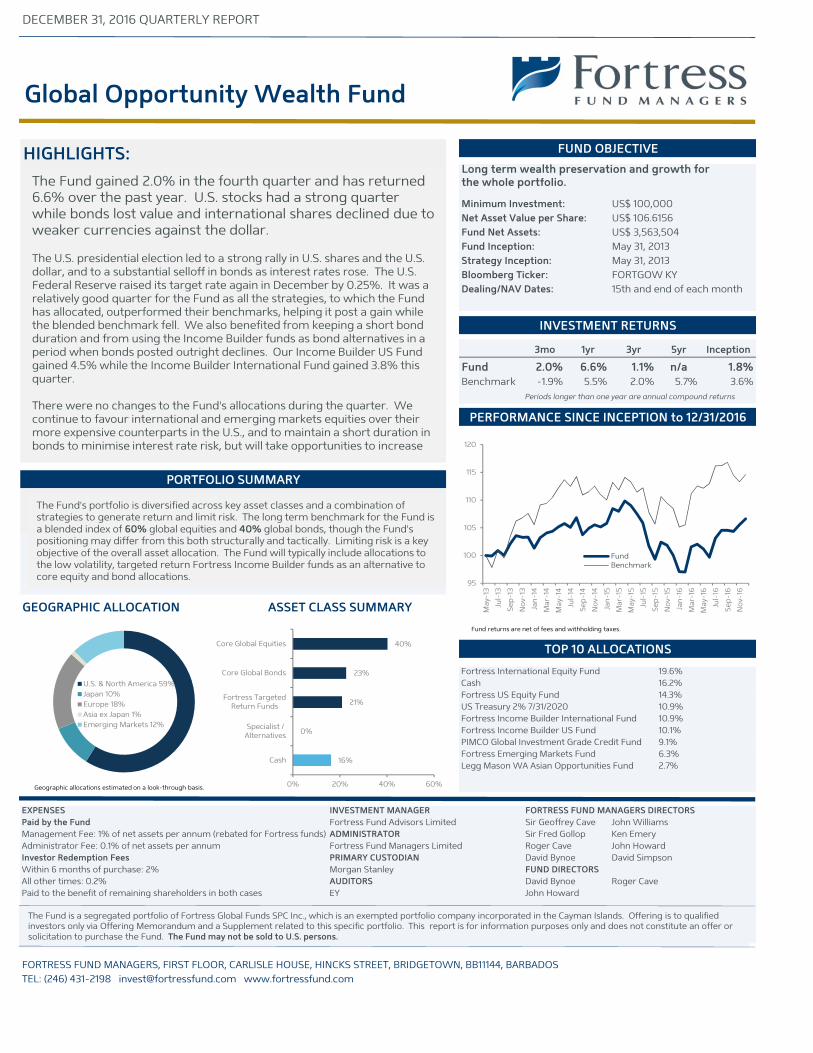
Fund 2.0% 6.6% 1.1% n/a 1.8%
Benchmark -1.9% 5.5% 2.0% 5.7% 3.6%
Periods longer than one year are annual compound returns
PERFORMANCE SINCE INCEPTION to 12/31/2016
PORTFOLIO SUMMARY
GEOGRAPHIC ALLOCATION ASSET CLASS SUMMARY
TOP 10 ALLOCATIONS
Fortress International Equity Fund 19.6%
Cash 16.2%
Fortress US Equity Fund 14.3%
US Treasury 2% 7/31/2020 10.9%
Fortress Income Builder International Fund 10.9%
Fortress Income Builder US Fund 10.1%
PIMCO Global Investment Grade Credit Fund 9.1%
Fortress Emerging Markets Fund 6.3%
Legg Mason WA Asian Opportunities Fund 2.7%
EXPENSES INVESTMENT MANAGER FORTRESS FUND MANAGERS DIRECTORS
Paid by the Fund Fortress Fund Advisors Limited Sir Geoffrey Cave John Williams
Management Fee: 1% of net assets per annum (rebated for Fortress funds) ADMINISTRATOR Sir Fred Gollop Ken Emery
Administrator Fee: 0.1% of net assets per annum Fortress Fund Managers Limited Roger Cave John Howard
Investor Redemption Fees PRIMARY CUSTODIAN David Bynoe David Simpson
Within 6 months of purchase: 2% Morgan Stanley FUND DIRECTORS
All other times: 0.2% AUDITORS David Bynoe Roger Cave
Paid to the benefit of remaining shareholders in both cases EY John Howard
FORTRESS FUND MANAGERS, FIRST FLOOR, CARLISLE HOUSE, HINCKS STREET, BRIDGETOWN, BB11144, BARBADOS
TEL: (246) 431-2198 [email protected] www.fortressfund.com
HIGHLIGHTS:
US$ 106.6156
The Fund gained 2.0% in the fourth quarter and has returned 6.6% over the past year. U.S. stocks had a strong quarter while bonds lost value and international shares declined due to weaker currencies against the dollar.
The U.S. presidential election led to a strong rally in U.S. shares and the U.S. dollar, and to a substantial selloff in bonds as interest rates rose. The U.S. Federal Reserve raised its target rate again in December by 0.25%. It was a relatively good quarter for the Fund as all the strategies, to which the Fund has allocated, outperformed their benchmarks, helping it post a gain while the blended benchmark fell. We also benefited from keeping a short bond duration and from using the Income Builder funds as bond alternatives in a period when bonds posted outright declines. Our Income Builder US Fund gained 4.5% while the Income Builder International Fund gained 3.8% this quarter.
There were no changes to the Fund's allocations during the quarter. We continue to favour international and emerging markets equities over their more expensive counterparts in the U.S., and to maintain a short duration in bonds to minimise interest rate risk, but will take opportunities to increase
95
100
105
110
115
120
Ma
y-13
Jul-
13
Se
p-1
3
No
v-13
Jan
-14
Ma
r-14
Ma
y-14
Jul-
14
Se
p-1
4
No
v-14
Jan
-15
Ma
r-15
Ma
y-15
Jul-
15
Se
p-1
5
No
v-15
Jan
-16
Ma
r-16
Ma
y-16
Jul-
16
Se
p-1
6
No
v-16
FundBenchmark
16%
0%
21%
23%
40%
0% 20% 40% 60%
Cash
Specialist /Alternatives
Fortress TargetedReturn Funds
Core Global Bonds
Core Global Equities
U.S. & North America 59%
Japan 10%
Europe 18%
Asia ex Japan 1%
Emerging Markets 12%
The Fund is a segregated portfolio of Fortress Global Funds SPC Inc., which is an exempted portfolio company incorporated in the Cayman Islands. Offering is to qualified investors only via Offering Memorandum and a Supplement related to this specific portfolio. This report is for information purposes only and does not constitute an offer or solicitation to purchase the Fund. The Fund may not be sold to U.S. persons.
Fund returns are net of fees and withholding taxes.
The Fund's portfolio is diversified across key asset classes and a combination of strategies to generate return and limit risk. The long term benchmark for the Fund is a blended index of 60% global equities and 40% global bonds, though the Fund's positioning may differ from this both structurally and tactically. Limiting risk is a key objective of the overall asset allocation. The Fund will typically include allocations to the low volatility, targeted return Fortress Income Builder funds as an alternative to core equity and bond allocations.
Geographic allocations estimated on a look-through basis.