formulation and investigation of gel-emulsions containing...
TRANSCRIPT
University of Szeged
Department of Pharmaceutical Technology
Formulation and Investigation of Gel-Emulsions Containing
Polymeric Emulsifiers
Summary of PhD Thesis
Mária Budai-Szűcs
Supervisor:
Prof. Dr. habil. István Erős DSc
Szeged
2008
1
1 INTRODUCTION
An emulsion is a heterogeneous preparation composed of two immiscible liquid (by
convention described as oil and water), one of which is dispersed as fine droplets uniformly
throughout the other. Emulsions have been used for centuries in various domains in the
pharmaceutical, cosmetic, food, paint and road industry.
Manufacturers of pharmaceutical and cosmetic products have recently shown
increasing preference for multifunctional products in which different active agents can be
incorporated, and for controlled drug delivery systems which decrease the usage frequency
(hence increase patient compliance) and can decrease side effects or toxicity due to a lower
active agent content. Emulsions are able to ensure these terms.
In pharmacy and medicine they are formulated for virtually all the major routes of
administration: dermatological, oral and parenteral. Although emulsions have several
advantages over other dosage forms (often improve bioavailability and/or reduce side effect)
they are not used as extensively as other dosage forms (mainly oral and parenteral) because of
emulsion instability, which results in unpredictable drug release profiles and possibly toxicity.
Therefore one of the most important tasks is to ensure the kinetic stability of these systems. In
addition to stability, other requirements also have to be satisfied by emulsions used in
cosmetic and pharmaceutical industries, e.g. appropriate consistence and safety of ingredients.
Gel-emulsions, besides microemulsion gels and creams, belong to coherent emulsions.
Possibilities to form a gel-emulsion are the following:
• gel formation of the water phase by hydrophilic or hydrophobic polymers such as
polysaccharides, carrageenan, gelatine acrylic acids or wax;
• in situ gelation of the polymer at the interface or in the continuous phase
during/after the emulsification procedure or after the application;
• using polymeric emulsifiers.
Polymeric emulsifiers are one of the most effective stabilizers as manifested by lower
usage concentration. Three different types of polymeric emulsifiers can be found in the
literature: i) linear block, ii) graft and iii) star copolymers. In this work formulation and
investigation of gel-emulsion containing polymeric emulsifiers is presented.
2
2 AIMS
The aims of my research were the follows:
1) To get to know the properties of the polymeric emulsifier (surface activity,
wetting, swelling).
2) To determine the effect of the pH on the gels prepared with polymeric emulsifier
and their oil loading capacity.
3) On the basis of the preformulation studies to define the formulation environment
of the emulsions containing polymeric emulsifier.
4) To investigate the structure and properties (rheological behaviour, droplet size
distribution, bounding of the water, gel structure) of emulsions and gels by: i)
direct methods: image analyser, confocal laser scanning microscopy; and ii)
indirect methods: rheology, thermogravimetry.
5) To study the stability of the emulsions using the methods mentioned above during
3-month storage (on 25°C).
6) To allocate the possible application fields of these systems by examining:
bioadhesive behaviour and drug release profile using lipophilic and hydrophilic
model drugs.
7) To determine the relationship between the formulation and the structure, the
formulation and the stability, the formulation and the applicability.
2 MATERIALS AND METHODS
2.1 Materials
Polymeric emulsifiers: Pemulen TR1 and TR2
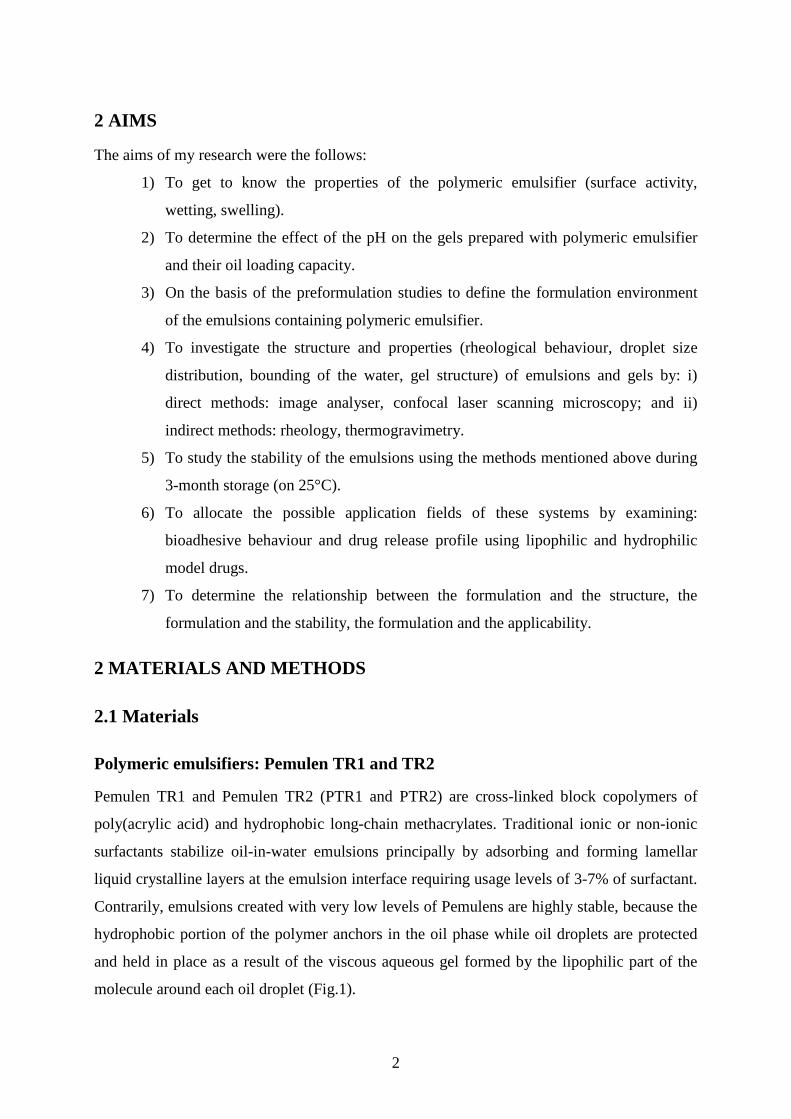
Pemulen TR1 and Pemulen TR2 (PTR1 and PTR2) are cross-linked block copolymers of
poly(acrylic acid) and hydrophobic long-chain methacrylates. Traditional ionic or non-ionic
surfactants stabilize oil-in-water emulsions principally by adsorbing and forming lamellar
liquid crystalline layers at the emulsion interface requiring usage levels of 3-7% of surfactant.
Contrarily, emulsions created with very low levels of Pemulens are highly stable, because the
hydrophobic portion of the polymer anchors in the oil phase while oil droplets are protected
and held in place as a result of the viscous aqueous gel formed by the lipophilic part of the
molecule around each oil droplet (Fig.1).
3
Other components
• Oil phase: Miglyol 812 (Fractioned coconut oil, Triglycerida saturata media,
Ph.Hg.VII.)
• Coemulsifier: Synperonic PE/L 31; 61; 62; 101 (Uniqema, UK) (ethylene oxide-
propylene oxide block copolymer) (S31; S61; S62; S101)
• Neutralizing agent: Trolamine (Ph.Hg.VII.)
• Hydrophilic model drug: Metronidazole (Ph.Hg.VII.)
• Lipophilic model drug: Lidocaine (Ph.Hg.VII.)
2.2 Methods
Emulsions preparation
The Pemulens were added to purified water containing trolamine. After 24 hours the oil was
added to this gel while the sample was stirred with mixer (MLW ER-10, 800 rpm) for 20
minutes. In the samples containing coemulsifiers, the mixture of the coemulsifier and oil was
added to the water phase.
Measurement of the surface tension
The measurement of the surface activity was carried out with Krüss tensiometer. The air-
liquid surface tension was detected.
Contact angle measurements
Dataphysics OCA20 was used to determine the wetting especially the contact angle between
the polymer probes and the water, and between them and the oil. The contact angle was
calculated from the Leplace-Young equation.
Fig.1 Structure of an emulsion containing Pemulens
4
Measurement of the Enslin number
The measurements were performed with Enslin instrument. The polymer was laid onto the
filter paper of the instrument. The swelling was followed for 10 min, and the loaded water
was determined.
Droplet size analysis
The particle size and the particle size distribution were measured with the Leica Q500MC
image analyser system. 500 droplets were analysed in each emulsion.
Thermogravimetric investigation
The measurements were carried out with a MOM Derivatograph-C (MOM GmbH, Hungary)
instrument. Samples were weighed (40-50 mg) in platinum pans (No.4). The reference was a
pan containing aluminium oxide. The samples were heated from 25 to 200 oC at 5 oC min-1 or
at 10 oC min-1. TG (weight loss % vs. temperature), DTG (derivative TG) and DTA curves
were plotted.
Rheological investigation
HAAKE RheoStress 1 Rheometer (HAAKE GmbH., Germany) with cone and plate geometry
was used to study the rheological profile of the samples. The flow curve and the viscosity
curve of the samples were determined by rotation tests controlled shear rate. The storage (G’),
the loss (G”) moduli and loss tangent (tanδ= G”/G’) were examined as function of frequency.
Tensile test
The mucoadhesive properties of the gel-emulsions were investigated by TA-XT2 Plus Texture
Analyser (Stable Micro Systems, Enco, Italy). The detachment force was determined and the
adhesive work was calculated from the area under the force-distance curve.
Confocal laser scanning microscopy
The visualization of the gel structure and the bioadhesive bond between the emulsion and the
mucin was carried out with Confocal Microscope System Leica TCS SP2 (Leica
Microsystems Heidelberg GmbH., Germany) interfaced with a Leica DMIRBE inverted
microscope. The gel structure was dyed with rhodamine B, and the bioadhesive bonds were
formed with mucin from porcine submaxillary glands.
5
Drug release test
In vitro drug release tests were carried out with Hanson SR8-PlusTM Dissolution Test Station
(Hanson Research Corporation, USA) using special ointments cells. The quantitative
determination of the drugs was performed by UV-VIS spectrophotometer (Unicam Heλios-α,
Spectronic Unicam, UK).
3 RESULTS AND DISCUSSION
3.1 Preformulation studies
In the course of the preformulation studies, it was established that the wetting of these
polymeric emulsifiers is very weak with purified water, but better with Miglyol. There is no
remarkable alteration between the values of different polymerization-degree polymers.
The swelling of the polymers takes long time, the amount of the water taken up is
quite low (low Enslin number). These two properties have to be considered for the preparation
of the gels or emulsions. This is the cause why the samples had been stored for 24h before the
emulsification procedure.
In the course of the surface tension measurements Pemulens like other polymeric
emulsifiers showed low surface activity, which suggests that the presence of a coemulsifier is
also required to facilitate the emulsification procedure.
When the pH was changed at low polymer content, constant value was detected;
contrarily, at high (1.00% w/w) concentration the pH affected the viscosity especially at PTR2
Adding Miglyol to the gel drop wise, the maximum oil concentration was determined.
The two different polymerization-degree polymers showed alteration . The gels containing the
lower polymerization-degree polymer could take up more oil than the higher one, which can
be explained by flexibility at the interface.
Rheological Investigation
Few pieces of information can be found in the literature about the Pemulen’s rheological
characteristics. An increase in viscosity was described with the polymeric emulsifier and the
concentration and the emulsions showed thixotropy or antithixotropy. In my studies initial
viscosity (η0), and the damping factor (tanδ) were used to characterize the rheological
properties of the gels and emulsions.
Initial viscosity was determined by the power law model:
η = η0 Dn (1)
6
where η is the viscosity, η0 is the initial viscosity, D is the shear rate and n is the power (shear
thinning) index. (In the further results viscosity means the initial viscosity.)
For the viscoelastic characterization of the emulsions tanδ (loss tangent or damping
factor), G’ (storage modulus) and G” loss modulus were used.
tanδ=G”/G’ (2)
Where G’ is the storage modulus, G” is the loss modulus. The smaller tanδ (or the greater G’)
is, the stronger the interaction is in the gel structure.
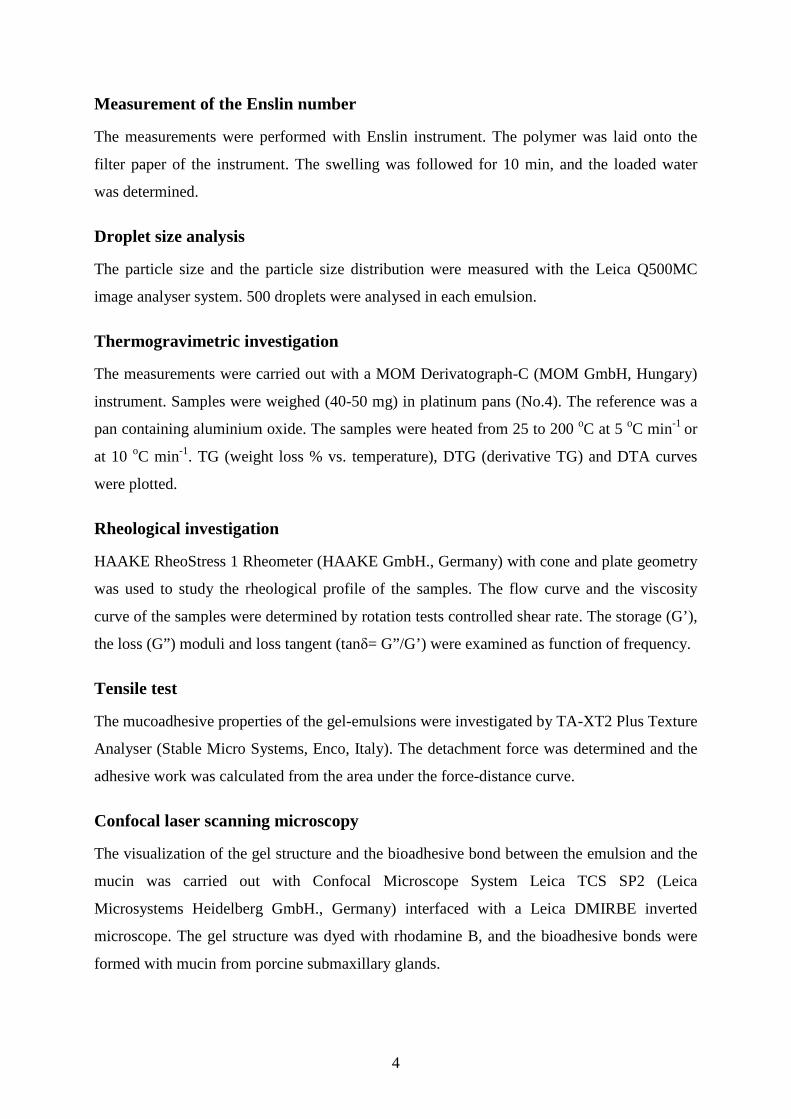
By correlating the viscosity values of the emulsions to one of the simple gels it can be
concluded that there is not a pregnant difference between the gels and emulsions with the
same polymer content for PTR1 samples (Fig.2A). Contrarily, for PTR2 ones the inner phase
increased the viscosity.
1
10
100
1000
0 0,2 0,4 0,6 0,8 1 1,2
PTR1 concentration (% w/w)
Vis
cosi
ty (P
a*s)
gel
emulsion
0
0,1
0,2
0,3
0,4
0,5
0,6
0 0,2 0,4 0,6 0,8 1 1,2
PTR1 concentration (% w/w)
tanδ
gel
emulsion
Fig.2 Viscosity (A) and damping factor (B) as function of the polymeric emulsifier concentration (emulsions oil concentration is 20%)
In the course of the oscillation measurement at low polymer content the emulsions
showed higher elasticity, while at high concentration the gels did (Fig.2B). It can be supposed
that the presence of the inner phase improves the formation of the gel structure and therefore
the elasticity at low concentration, but (relatively) decreases that at a high one.
Raising the amount of the oil increased the viscosity in case of the both of the
polymers. In turn damping factor showed an increase with the oil concentration in the PTR2
samples, while an decrease in the PTR1 samples, which indicates that the increase of the
volume fraction depresses the elasticity in these sample types.
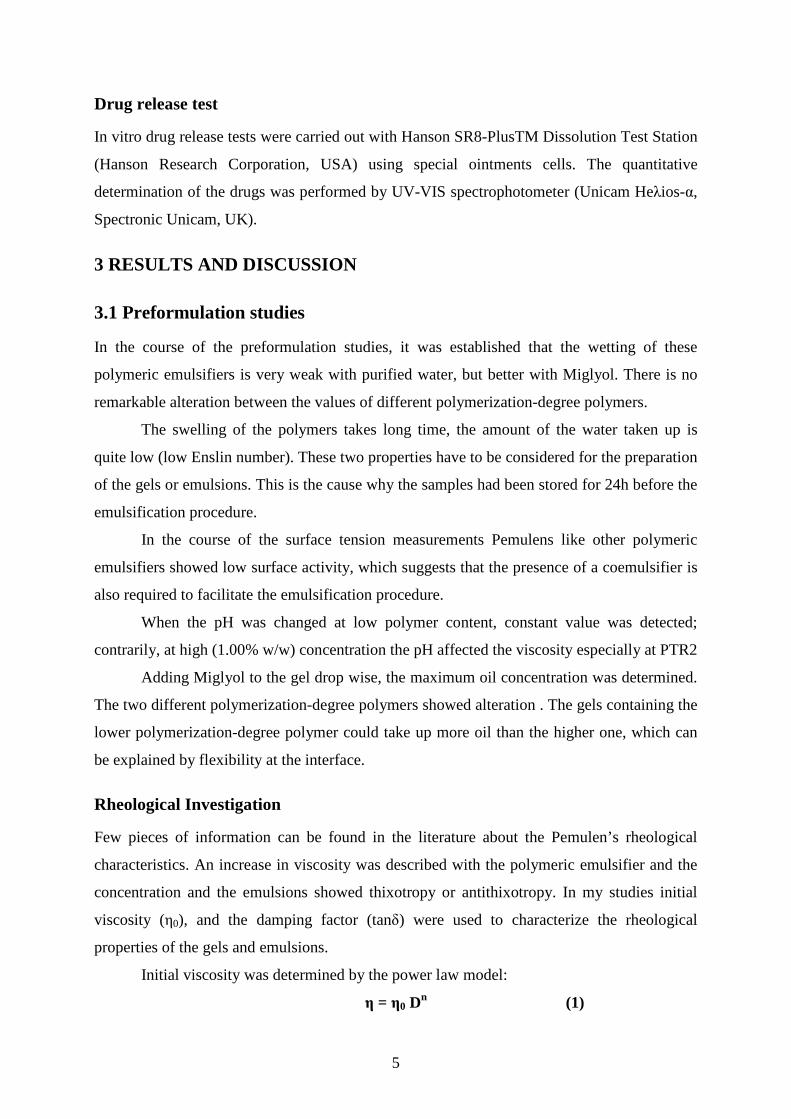
When coemulsifiers were used the viscosity usually increased with the cosurfactant
concentration, while the damping factor decreased. This tendency was most remarkable in the
case of S101 where those values changed extremely at high (1.00%) concentration (Fig.3).
A B
7
0
1
2
3
0,001 0,01 0,1 1
S101 concentration (% w/w)
Vis
cosi
ty (P
a*s)
0
0,1
0,2
0,3
0,4
0,5
0,6
0,001 0,01 0,1 1
S101 concentration (% w/w)
tanδ
Fig.3 Variation of the viscosity and the damping factor in function of the S101 concentration (PTR2 0.10%, oil 20%)
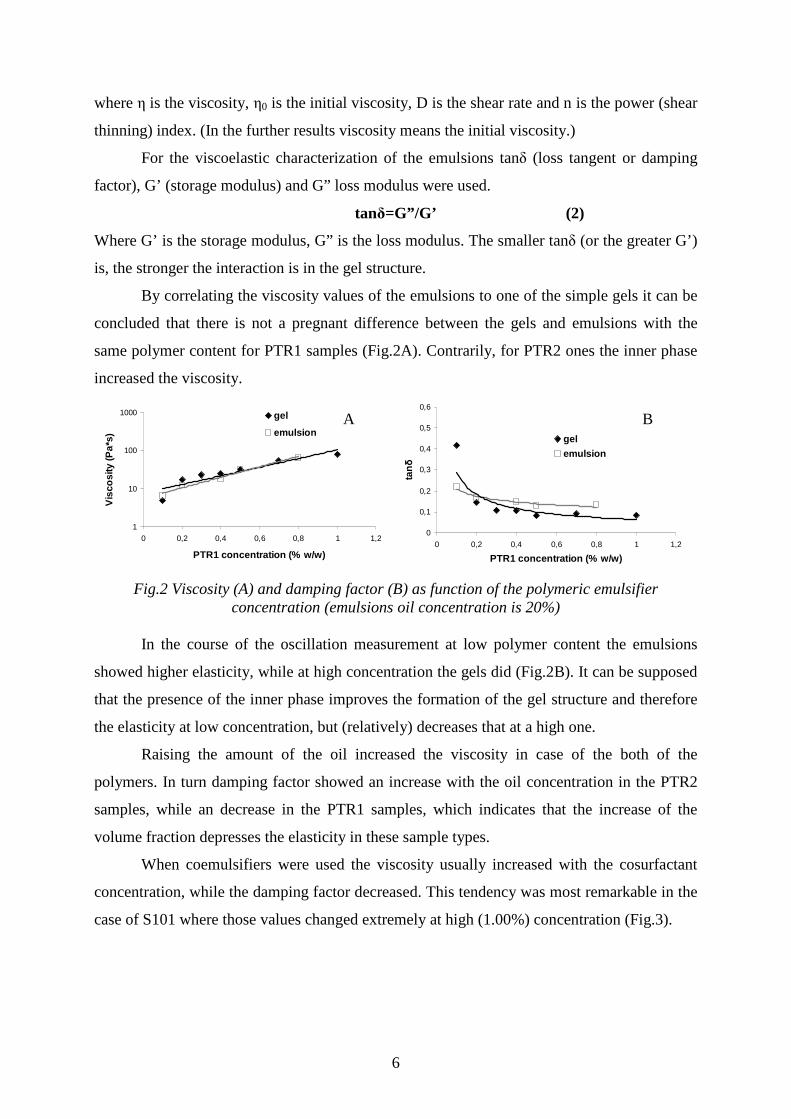
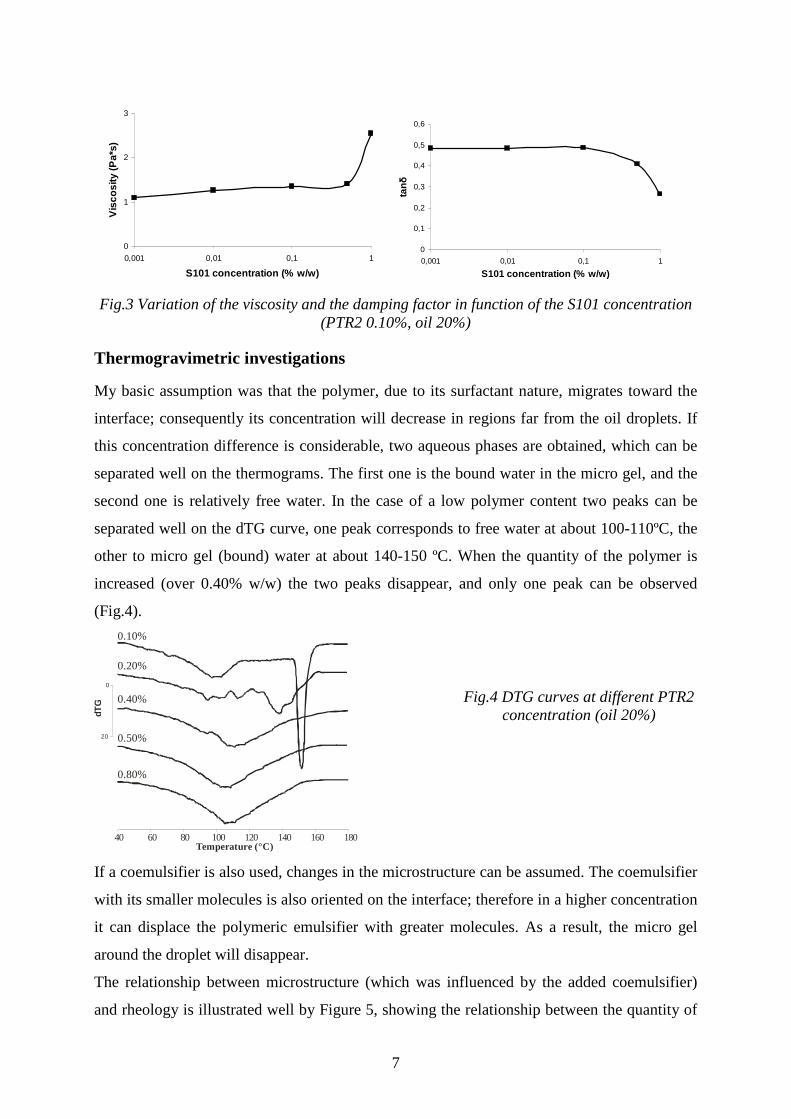
Thermogravimetric investigations
My basic assumption was that the polymer, due to its surfactant nature, migrates toward the
interface; consequently its concentration will decrease in regions far from the oil droplets. If
this concentration difference is considerable, two aqueous phases are obtained, which can be
separated well on the thermograms. The first one is the bound water in the micro gel, and the
second one is relatively free water. In the case of a low polymer content two peaks can be
separated well on the dTG curve, one peak corresponds to free water at about 100-110ºC, the
other to micro gel (bound) water at about 140-150 ºC. When the quantity of the polymer is
increased (over 0.40% w/w) the two peaks disappear, and only one peak can be observed
(Fig.4).
dTG
40 60 80 100 120 140 160 180
0.10%
Temperature (°C)
20
0
0.80%
0.20%
0.40%
0.50%
If a coemulsifier is also used, changes in the microstructure can be assumed. The coemulsifier
with its smaller molecules is also oriented on the interface; therefore in a higher concentration
it can displace the polymeric emulsifier with greater molecules. As a result, the micro gel
around the droplet will disappear.
The relationship between microstructure (which was influenced by the added coemulsifier)
and rheology is illustrated well by Figure 5, showing the relationship between the quantity of
Fig.4 DTG curves at different PTR2 concentration (oil 20%)
8
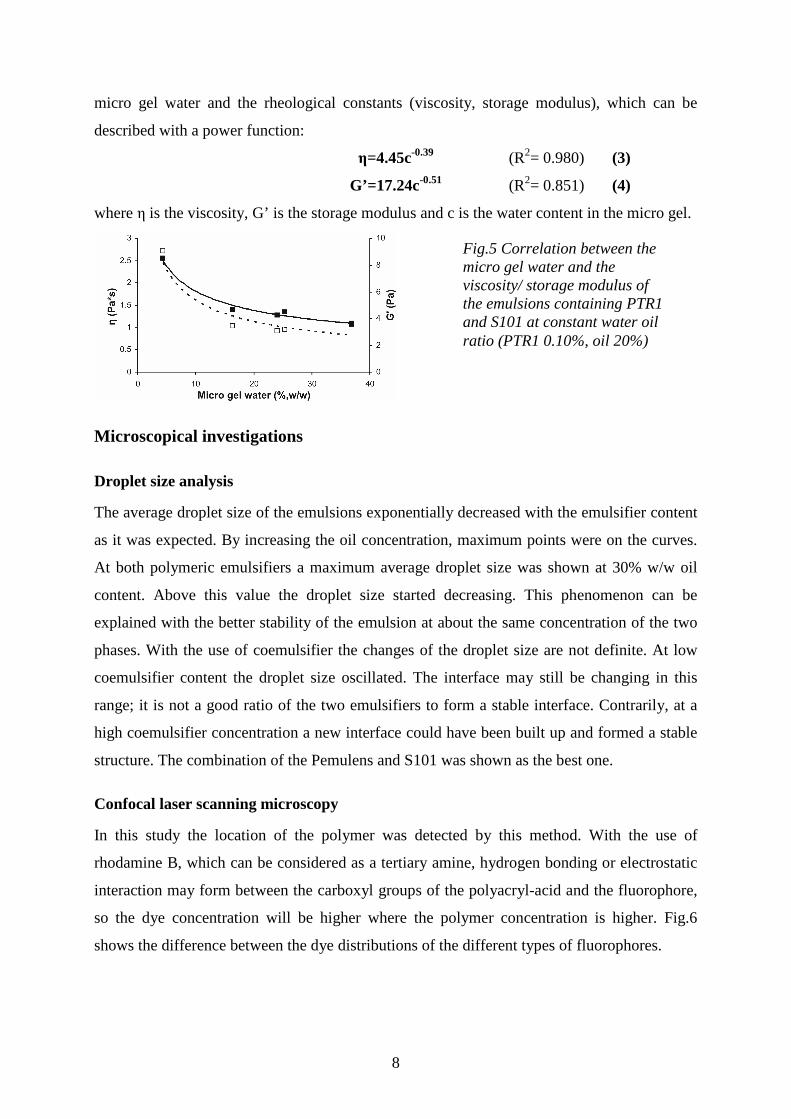
micro gel water and the rheological constants (viscosity, storage modulus), which can be
described with a power function:
η=4.45c-0.39 (R2= 0.980) (3)
G’=17.24c-0.51 (R2= 0.851) (4)
where η is the viscosity, G’ is the storage modulus and c is the water content in the micro gel.
Microscopical investigations
Droplet size analysis
The average droplet size of the emulsions exponentially decreased with the emulsifier content
as it was expected. By increasing the oil concentration, maximum points were on the curves.
At both polymeric emulsifiers a maximum average droplet size was shown at 30% w/w oil
content. Above this value the droplet size started decreasing. This phenomenon can be
explained with the better stability of the emulsion at about the same concentration of the two
phases. With the use of coemulsifier the changes of the droplet size are not definite. At low
coemulsifier content the droplet size oscillated. The interface may still be changing in this
range; it is not a good ratio of the two emulsifiers to form a stable interface. Contrarily, at a
high coemulsifier concentration a new interface could have been built up and formed a stable
structure. The combination of the Pemulens and S101 was shown as the best one.
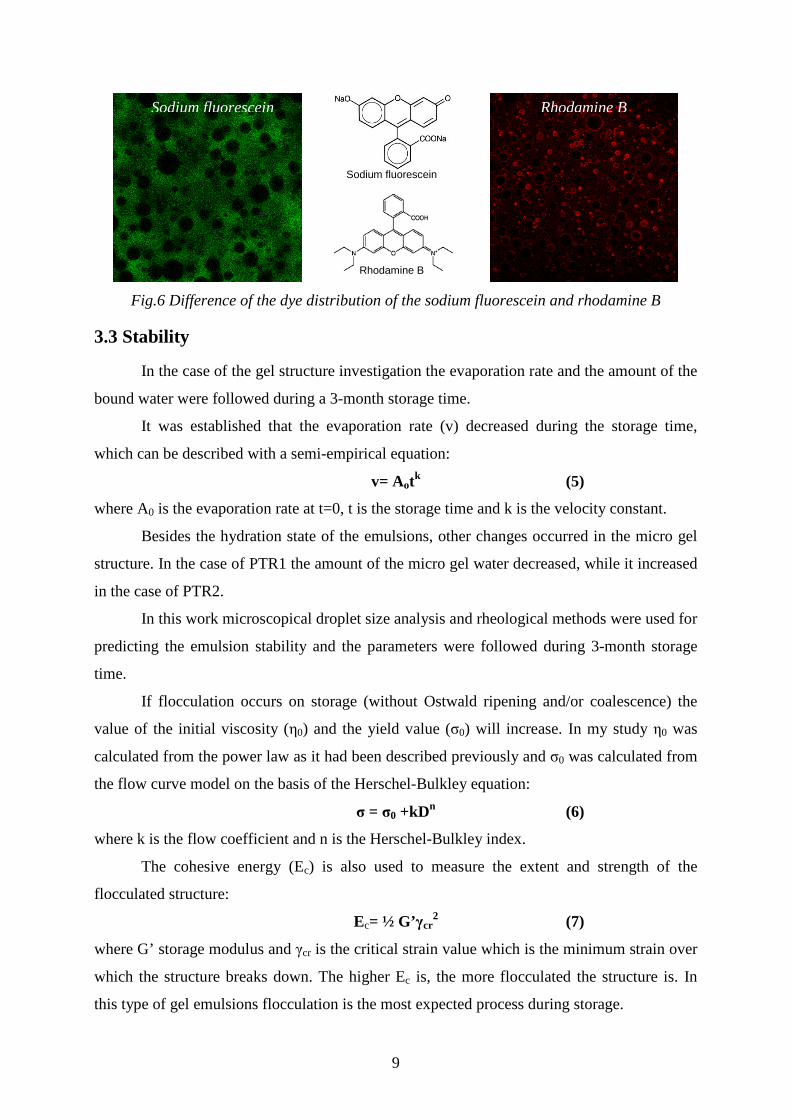
Confocal laser scanning microscopy
In this study the location of the polymer was detected by this method. With the use of
rhodamine B, which can be considered as a tertiary amine, hydrogen bonding or electrostatic
interaction may form between the carboxyl groups of the polyacryl-acid and the fluorophore,
so the dye concentration will be higher where the polymer concentration is higher. Fig.6
shows the difference between the dye distributions of the different types of fluorophores.
Fig.5 Correlation between the micro gel water and the viscosity/ storage modulus of the emulsions containing PTR1 and S101 at constant water oil ratio (PTR1 0.10%, oil 20%)
9
Fig.6 Difference of the dye distribution of the sodium fluorescein and rhodamine B
3.3 Stability
In the case of the gel structure investigation the evaporation rate and the amount of the
bound water were followed during a 3-month storage time.
It was established that the evaporation rate (v) decreased during the storage time,
which can be described with a semi-empirical equation:
v= Aotk (5)
where A0 is the evaporation rate at t=0, t is the storage time and k is the velocity constant.
Besides the hydration state of the emulsions, other changes occurred in the micro gel
structure. In the case of PTR1 the amount of the micro gel water decreased, while it increased
in the case of PTR2.
In this work microscopical droplet size analysis and rheological methods were used for
predicting the emulsion stability and the parameters were followed during 3-month storage
time.
If flocculation occurs on storage (without Ostwald ripening and/or coalescence) the
value of the initial viscosity (η0) and the yield value (σ0) will increase. In my study η0 was
calculated from the power law as it had been described previously and σ0 was calculated from
the flow curve model on the basis of the Herschel-Bulkley equation:
σ = σ0 +kDn (6)
where k is the flow coefficient and n is the Herschel-Bulkley index.
The cohesive energy (Ec) is also used to measure the extent and strength of the
flocculated structure:
Ec= ½ G’γcr2 (7)
where G’ storage modulus and γcr is the critical strain value which is the minimum strain over
which the structure breaks down. The higher Ec is, the more flocculated the structure is. In
this type of gel emulsions flocculation is the most expected process during storage.
Rhodamine B
Sodium fluorescein
Rhodamine B
Sodium fluorescein
10
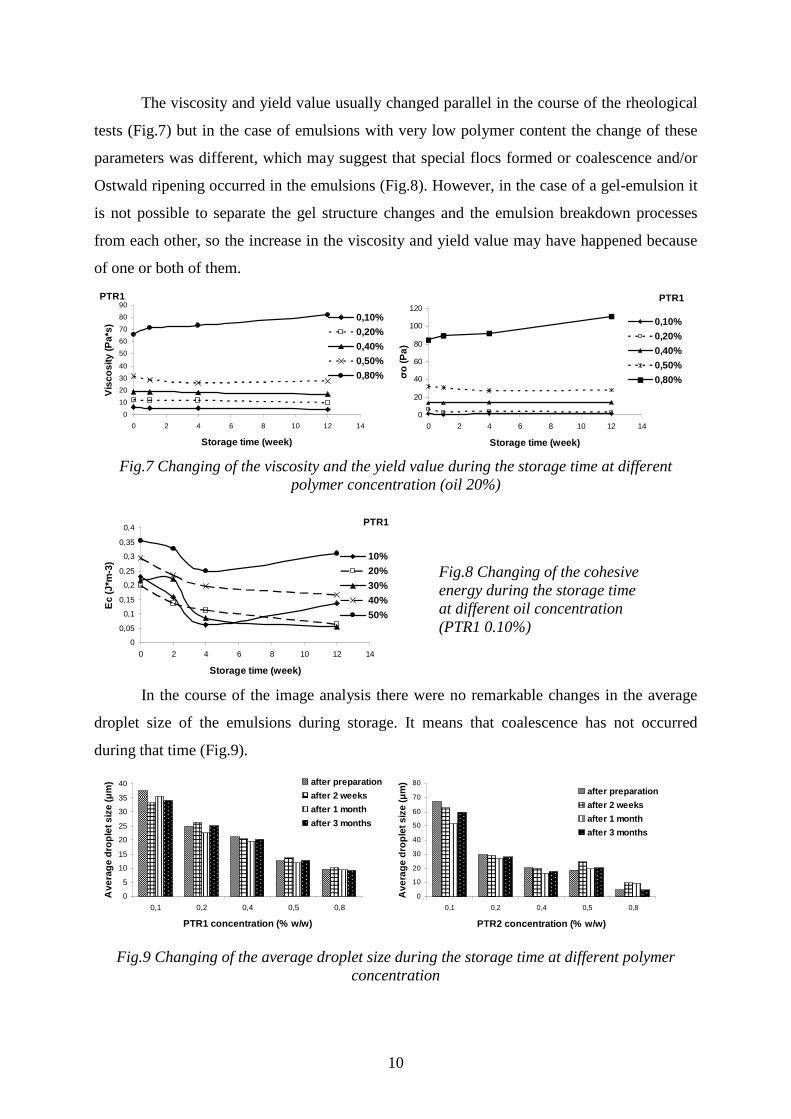
The viscosity and yield value usually changed parallel in the course of the rheological
tests (Fig.7) but in the case of emulsions with very low polymer content the change of these
parameters was different, which may suggest that special flocs formed or coalescence and/or
Ostwald ripening occurred in the emulsions (Fig.8). However, in the case of a gel-emulsion it
is not possible to separate the gel structure changes and the emulsion breakdown processes
from each other, so the increase in the viscosity and yield value may have happened because
of one or both of them.
0
10
20
30
40
50
60
70
80
90
0 2 4 6 8 10 12 14
Storage time (week)
Vis
cosi
ty (P
a*s)
0,10%
0,20%
0,40%
0,50%
0,80%
PTR1 PTR1
0
20
40
60
80
100
120
0 2 4 6 8 10 12 14
Storage time (week)
σo
(Pa)
0,10%
0,20%
0,40%
0,50%
0,80%
Fig.7 Changing of the viscosity and the yield value during the storage time at different
polymer concentration (oil 20%)
0
0,05
0,1
0,15
0,2
0,25
0,3
0,35
0,4
0 2 4 6 8 10 12 14
Storage time (week)
Ec
(J*m
-3) 10%
20%
30%
40%
50%
PTR1
In the course of the image analysis there were no remarkable changes in the average
droplet size of the emulsions during storage. It means that coalescence has not occurred
during that time (Fig.9).
0
5
10
15
20
25
30
35
40
0,1 0,2 0,4 0,5 0,8
PTR1 concentration (% w/w)
Ave
rag
e d
rop
let s
ize
(µm
) after preparation
after 2 weeks
after 1 month
after 3 months
0
10
20
30
40
50
60
70
80
0,1 0,2 0,4 0,5 0,8
PTR2 concentration (% w/w)
Ave
rag
e d
rop
let s
ize
(µm
)
after preparation
after 2 weeks
after 1 month
after 3 months
Fig.9 Changing of the average droplet size during the storage time at different polymer concentration
Fig.8 Changing of the cohesive energy during the storage time at different oil concentration (PTR1 0.10%)
11
3.4 Applicability
Bioadhesion
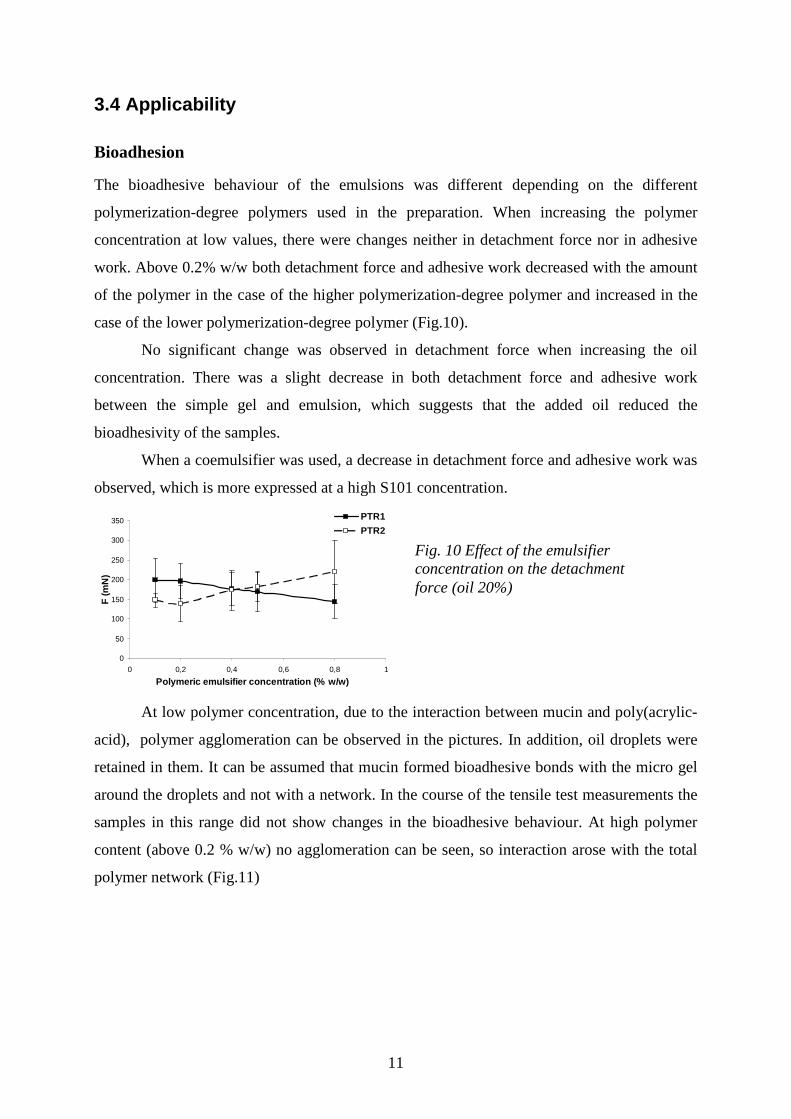
The bioadhesive behaviour of the emulsions was different depending on the different
polymerization-degree polymers used in the preparation. When increasing the polymer
concentration at low values, there were changes neither in detachment force nor in adhesive
work. Above 0.2% w/w both detachment force and adhesive work decreased with the amount
of the polymer in the case of the higher polymerization-degree polymer and increased in the
case of the lower polymerization-degree polymer (Fig.10).
No significant change was observed in detachment force when increasing the oil
concentration. There was a slight decrease in both detachment force and adhesive work
between the simple gel and emulsion, which suggests that the added oil reduced the
bioadhesivity of the samples.
When a coemulsifier was used, a decrease in detachment force and adhesive work was
observed, which is more expressed at a high S101 concentration.
0
50
100
150
200
250
300
350
0 0,2 0,4 0,6 0,8 1
Polymeric emulsifier concentration (% w/w)
F (m
N)
PTR1
PTR2
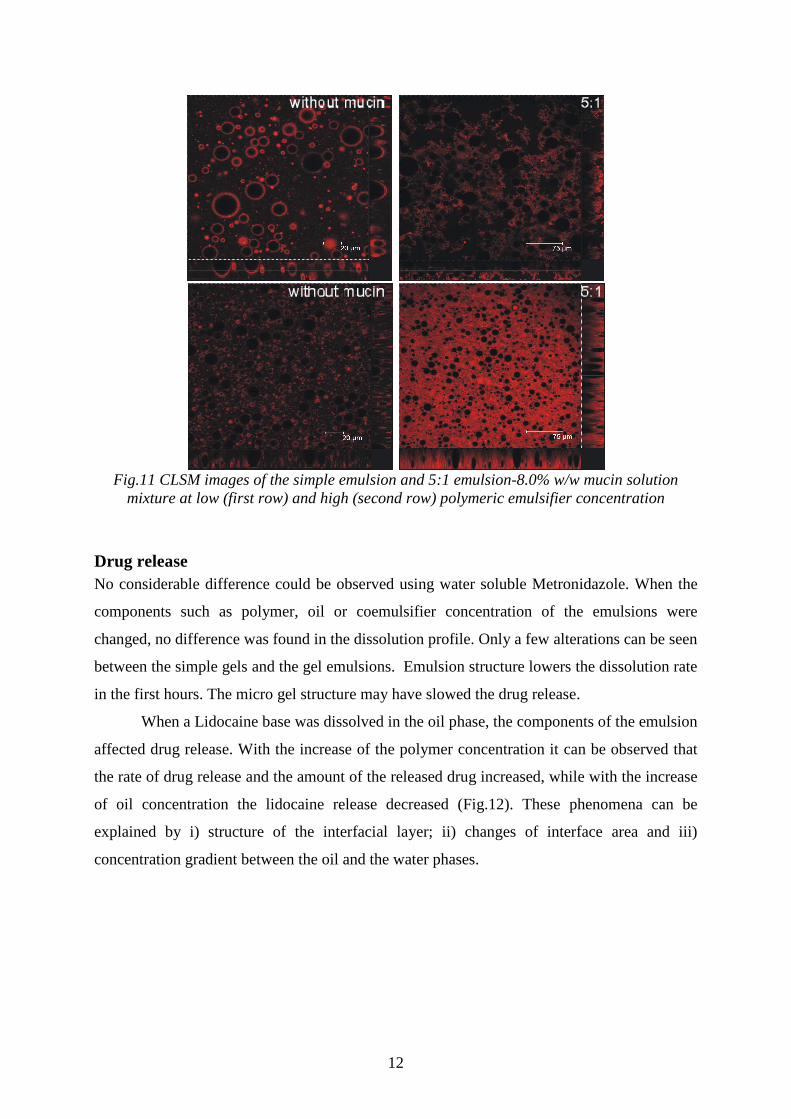
At low polymer concentration, due to the interaction between mucin and poly(acrylic-
acid), polymer agglomeration can be observed in the pictures. In addition, oil droplets were
retained in them. It can be assumed that mucin formed bioadhesive bonds with the micro gel
around the droplets and not with a network. In the course of the tensile test measurements the
samples in this range did not show changes in the bioadhesive behaviour. At high polymer
content (above 0.2 % w/w) no agglomeration can be seen, so interaction arose with the total
polymer network (Fig.11)
Fig. 10 Effect of the emulsifier concentration on the detachment force (oil 20%)
12
Fig.11 CLSM images of the simple emulsion and 5:1 emulsion-8.0% w/w mucin solution
mixture at low (first row) and high (second row) polymeric emulsifier concentration
Drug release No considerable difference could be observed using water soluble Metronidazole. When the
components such as polymer, oil or coemulsifier concentration of the emulsions were
changed, no difference was found in the dissolution profile. Only a few alterations can be seen
between the simple gels and the gel emulsions. Emulsion structure lowers the dissolution rate
in the first hours. The micro gel structure may have slowed the drug release.
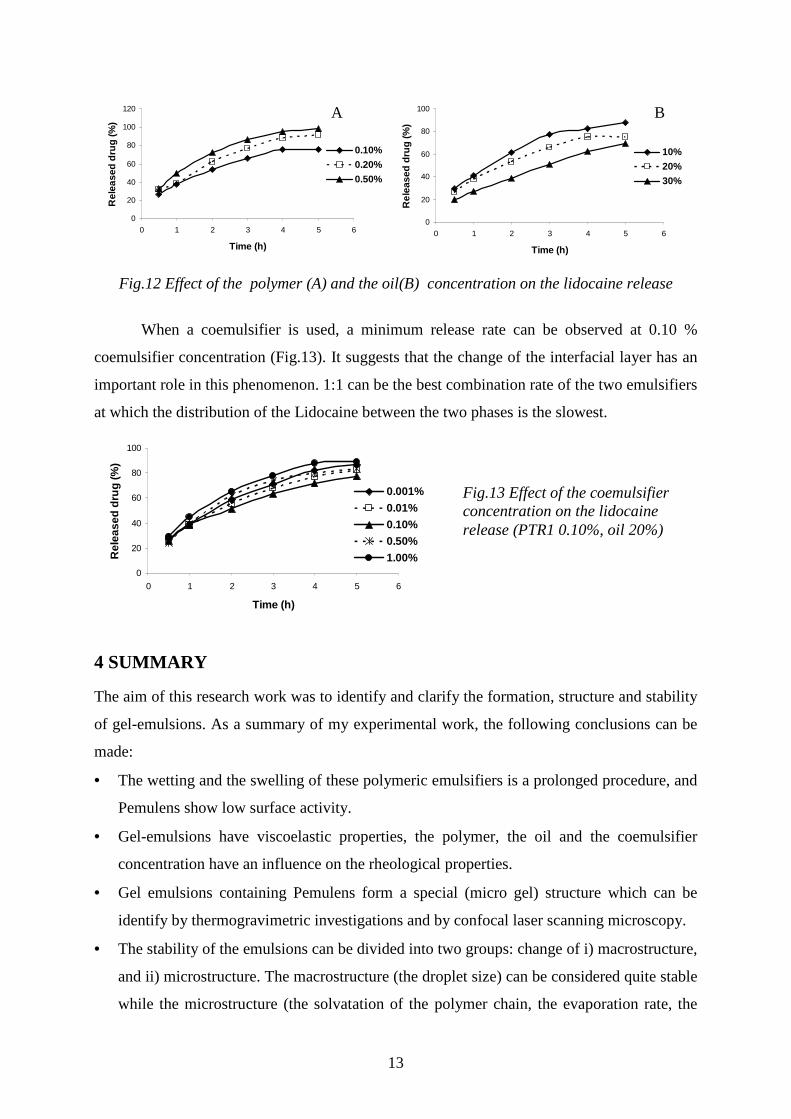
When a Lidocaine base was dissolved in the oil phase, the components of the emulsion
affected drug release. With the increase of the polymer concentration it can be observed that
the rate of drug release and the amount of the released drug increased, while with the increase
of oil concentration the lidocaine release decreased (Fig.12). These phenomena can be
explained by i) structure of the interfacial layer; ii) changes of interface area and iii)
concentration gradient between the oil and the water phases.
13
0
20
40
60
80
100
120
0 1 2 3 4 5 6
Time (h)
Rel
ease
d d
rug
(%)
0.10%
0.20%
0.50%
0
20
40
60
80
100
0 1 2 3 4 5 6
Time (h)
Rel
ease
d d
rug
(%)
10%
20%
30%
Fig.12 Effect of the polymer (A) and the oil(B) concentration on the lidocaine release
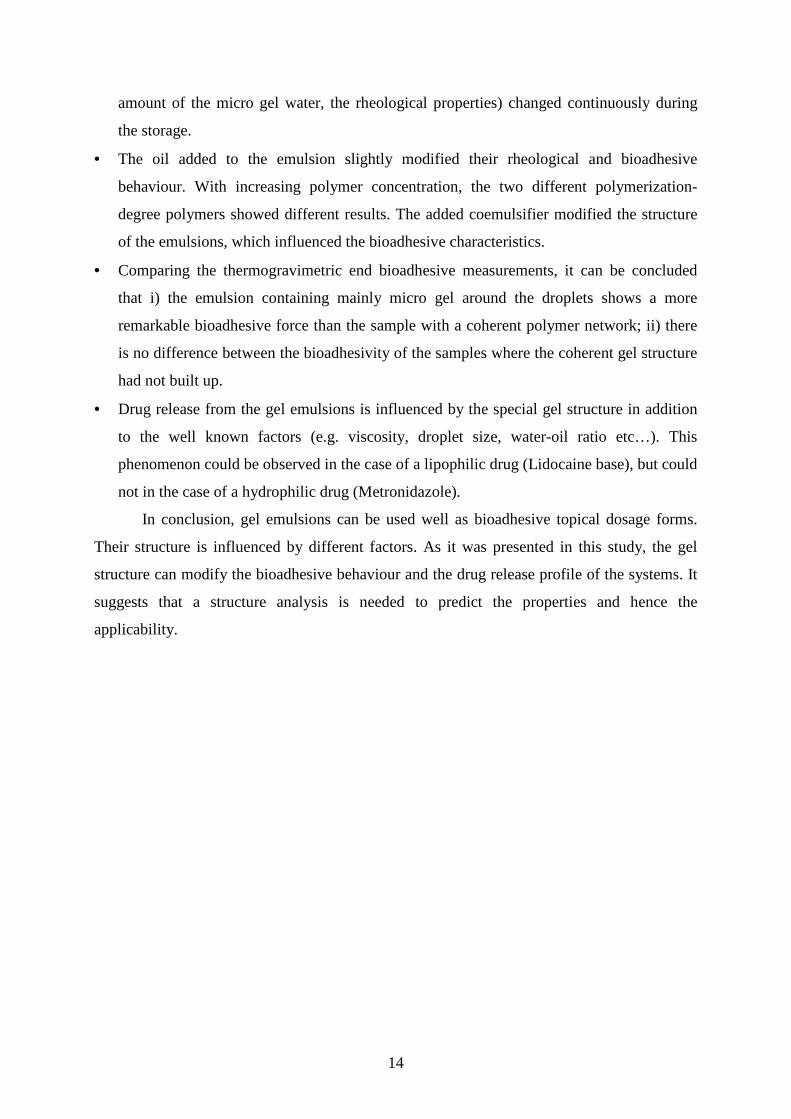
When a coemulsifier is used, a minimum release rate can be observed at 0.10 %
coemulsifier concentration (Fig.13). It suggests that the change of the interfacial layer has an
important role in this phenomenon. 1:1 can be the best combination rate of the two emulsifiers
at which the distribution of the Lidocaine between the two phases is the slowest.
0
20
40
60
80
100
0 1 2 3 4 5 6
Time (h)
Rel
ease
d d
rug
(%)
0.001%
0.01%
0.10%
0.50%
1.00%
4 SUMMARY
The aim of this research work was to identify and clarify the formation, structure and stability
of gel-emulsions. As a summary of my experimental work, the following conclusions can be
made:
• The wetting and the swelling of these polymeric emulsifiers is a prolonged procedure, and
Pemulens show low surface activity.
• Gel-emulsions have viscoelastic properties, the polymer, the oil and the coemulsifier
concentration have an influence on the rheological properties.
• Gel emulsions containing Pemulens form a special (micro gel) structure which can be
identify by thermogravimetric investigations and by confocal laser scanning microscopy.
• The stability of the emulsions can be divided into two groups: change of i) macrostructure,
and ii) microstructure. The macrostructure (the droplet size) can be considered quite stable
while the microstructure (the solvatation of the polymer chain, the evaporation rate, the
A B
Fig.13 Effect of the coemulsifier concentration on the lidocaine release (PTR1 0.10%, oil 20%)
14
amount of the micro gel water, the rheological properties) changed continuously during
the storage.
• The oil added to the emulsion slightly modified their rheological and bioadhesive
behaviour. With increasing polymer concentration, the two different polymerization-
degree polymers showed different results. The added coemulsifier modified the structure
of the emulsions, which influenced the bioadhesive characteristics.
• Comparing the thermogravimetric end bioadhesive measurements, it can be concluded
that i) the emulsion containing mainly micro gel around the droplets shows a more
remarkable bioadhesive force than the sample with a coherent polymer network; ii) there
is no difference between the bioadhesivity of the samples where the coherent gel structure
had not built up.
• Drug release from the gel emulsions is influenced by the special gel structure in addition
to the well known factors (e.g. viscosity, droplet size, water-oil ratio etc…). This
phenomenon could be observed in the case of a lipophilic drug (Lidocaine base), but could
not in the case of a hydrophilic drug (Metronidazole).
In conclusion, gel emulsions can be used well as bioadhesive topical dosage forms.
Their structure is influenced by different factors. As it was presented in this study, the gel
structure can modify the bioadhesive behaviour and the drug release profile of the systems. It
suggests that a structure analysis is needed to predict the properties and hence the
applicability.
15
5 ANNEX
Articles related to the Ph.D. Thesis
I. Szűcs Mária, Budai Szabolcs, Erős István, Gel-emulsion systems I: Physical-chemical
characterisation, Acta Pharmaceutica Hungarica 78 (2008) 11-21 IF: -
II. Budai Szabolcs, Szűcs Mária, Erős István, Gel-emulsion systems II: Stability, Acta
Pharmaceutica Hungarica 78 (2008) 23-30 IF: -
III. Mária Szűcs, Giuseppina Sandri, M. Cristina Bonferoni, Carla M. Caramella, Patrizia
Vaghi, Piroska Szabó-Révész, István Erős, Mucoadhesive behaviour of emulsion
containing polymeric emulsifier, European Journal of Pharmaceutical Science 34
(2008) 226-235 IF: 3.127
IV. Mária Szűcs, Patrizia Vaghi, Giuseppina Sandri, M. Cristina Bonferoni, Carla M.
Caramella, Piroska Szabó-Révész, István Erős: Thermoanalytical and microscopical
investigation of the microstructure of emulsions containing polymeric emulsifier,
Journal of Thermal Analysis and Calorimetry 94 (2008) 271-274 IF: 1.483
Other publication
I. Péter Sipos, Mária Szűcs, András Szabó, István Erős, Piroska Szabó-Révész, An
assessment of the interaction between diclofenac sodium and ammonio methacrylate
copolymer using thermal analysis and Raman spectroscopy, Journal of Pharmaceutical
and Biomedical Analysis 46 (2008) 288-294 IF: 2.761
Abstracts
I. Szűcs Mária: Polimer emulgensekkel stabilizált emulziók, Ph.D. Tudományos Nap,
Szegedi Akadémiai Bizottság Székháza, 2006. május 3.
II. István Erős, Mária Szűcs, Szabolcs Budai, Erzsébet Csányi, Zsolt Makai, Péter Sipos,
András Fehér and Piroska Szabó-Révész: Physico-chemical investigation of acrylate
based polymeric emulsifiers, 5th World Meeting on Pharmaceutics Biopharmaceutics
and Pharmaceutical Technology, Geneva, Switzerland, 27th to 30th March 2006
III. Szűcs Mária, Révész Piroska, Erős István: Polimer emulgensek fizikai-kémiai
vizsgálata, Congressus Pharmaceuticus Hungaricus XIII, Budapest, 2006. május 25-27.
16
IV. Szűcs Mária, Révész Piroska, Erős István: Polimer emulgenst tartalmazó emulziók
szerkezetvizsgálata, Gyógyszerkutatási Szimpózium, Debrecen, 2006. november 24-25.
V. Szűcs Mária: Polimer emulgensek bioadhéziója, Magyar Tudomány Ünnepe, Szegedi
Akadémiai Bizottság Székháza, 2007. november 6.
VI. Erős István, Szűcs Mária: Gél-emulziók tervezése és vizsgálata, Kozmetikai
Szimpózium 2007, Budapest, 2007. november 8.
VII. Szűcs Mária, Giuseppina Sandri, Carla Caramella, Szabóné Révész Piroska, Erős
István: Polimer emulgenseket tartalmazó rendszerek bioadhezív tulajdonságainak
jellemzése, Gyógyszerkutatási Szimpózium, Szeged, 2007. november 9-10.
VIII. Mária Szűcs, Giuseppina Sandri, M. Cristina Bonferoni, Carla M. Caramella, Patrizia
Vaghi, Piroska Szabó-Révész, István Erős, Bioadhesive study of gel-emulsions: effect
of the components and the microstructure, 6th World Metting on Pharmaceutics,
Biopharmaceutics and Pharmaceutical Technology, Barcelona, Spain, 7th to 10th April
2008