formation of artificial solid electrolyte interphase by grafting for improving li-ion intercalation...
TRANSCRIPT

C A R B O N 5 0 ( 2 0 1 2 ) 2 5 9 9 – 2 6 1 4
.sc ienced i rec t .com
Avai lab le a t wwwjournal homepage: www.elsevier .com/ locate /carbon
Formation of artificial solid electrolyte interphase by graftingfor improving Li-ion intercalation and preventing exfoliationof graphite
Pallavi Verma, Petr Novak *
Paul Scherrer Institut, Electrochemistry Laboratory, CH-5232 Villigen PSI, Switzerland
A R T I C L E I N F O
Article history:
Received 13 November 2011
Accepted 4 February 2012
Available online 15 February 2012
0008-6223/$ - see front matter � 2012 Elsevidoi:10.1016/j.carbon.2012.02.019
* Corresponding author: Fax: +41 56 310 4415E-mail address: [email protected] (P. Nov
A B S T R A C T
Various grafting methods for surface modification of graphite powder are reported.
p-Carboxylic benzene diazonium salt has been grafted on graphite powder using different
grafting methods namely electrochemical grafting, in situ grafting aqueous, in situ grafting
non-aqueous, and spontaneous grafting. Each grafting method results in a different load-
ing of the surface organic layer, which is quantified by X-ray photoelectron spectroscopy.
Grafted graphite powders exhibit controlled solid electrolyte interphase (SEI) morphology,
Li-ion intercalation, and averted exfoliation. Grafted graphite powders were further modi-
fied by transformation of the terminal functional group of the grafted surface layer by
chemical or electrochemical treatments. This step tunes the reactivity of grafted material
towards non-aqueous electrolyte, which is reflected in modified electrochemical properties
like formation of SEI, overall Li-ion intercalation/deintercalation kinetics, cyclability, prac-
tical specific charge, and eventual exfoliation of graphite. The morphology of the grafted
samples is retained after electrochemical cycling as well as after functional group transfor-
mation steps. The morphology of the SEI is also seen to be similar to that of the grafted
layer in all the cases. These methods offer a pathway for tuning SEI properties and prevent-
ing exfoliation of graphite in propylene carbonate based electrolyte.
� 2012 Elsevier Ltd. All rights reserved.
1. Introduction
Li-ion batteries are of vital importance due to their wide-
spread applications ranging from portable electronics to elec-
tric vehicles. State of the art Li-ion battery consists of
intercalation positive and negative electrode materials. Car-
bon materials including graphite are the most commonly
used negative electrode materials [1]. In particular, the sur-
face chemistry and morphology of carbon materials is impor-
tant for performance of Li-ion batteries [2]. Properties of
graphite such as surface chemistry [3] and morphology [4] af-
fect the characteristics of the solid electrolyte interphase (SEI)
[5] and hence the performance of a battery. SEI is a passive
layer formed by the reduction of the electrolyte during first
er Ltd. All rights reserved
.ak).
reduction of the graphite electrode. SEI comprises of organic
solvent reduction products like ROCO2Li and Li2CO3 [6] and
inorganic salt reduction products like LiF [7,8]. SEI formation
on graphite electrode is extensively studied [5,7,9–11] due to
its paramount significance with respect to irreversible charge
loss (ICL), self-discharge, cyclability, rate capability, energy
efficiency, and safety of the battery [12]. But most of the liter-
ature on SEI is focused on the analysis of the composition and
characteristics of the SEI [12]. SEI is also very critical for cy-
cling in propylene carbonate (PC) based electrolytes. Cycling
of graphite in PC would be of great advantage for low temper-
ature performance of a battery as PC freezes at �47 �C,
compared to +37 �C for ethylene carbonate (EC). PC based
electrolytes also have higher conductivity than EC. Naturally
.

Fig. 1 – Scheme of surface modification method of grafting
followed by end functional group transformation.
2600 C A R B O N 5 0 ( 2 0 1 2 ) 2 5 9 9 – 2 6 1 4
formed SEI (forming at �0.8 V vs. Li+/Li) is incapable of pre-
venting exfoliation of crystalline graphite in PC based electro-
lytes (which begins at �1 V vs. Li+/Li) and the result is endless
irreversible decomposition of the electrolyte. This is because
an effective SEI is not formed on graphite before the exfolia-
tion (via solvent co-intercalation [13]) begins. Note that most
methods used in literature try to improve performance of
graphite in PC by using additives [14,15], or by making com-
posites [15,16].
There are other additional limitations of the natural SEI
like irreversible charge loss (the charge consumed for electro-
lyte reduction for SEI formation during the first lithiation is
‘‘lost’’ irreversibly and cannot be retrieved in the consecutive
cycles), inhomogeneous and brittle nature, and dissolution
of SEI during cycling. In order to curtail these major draw-
backs of natural SEI, we prepare by chemical means an artifi-
cial SEI. The concept of this work is that we introduce in the
battery, instead of pristine graphite, graphite particles whose
surface has been modified with an organic layer, which has
properties of an SEI. This pre-formed SEI on graphite should
be wettable by electrolyte, allow Li-ion intercalation, and
would not allow electrolyte degradation and hence avoid irre-
versible charge loss. This artificial SEI, which is a redox inac-
tive layer, is expected to be thin, homogeneous, and stable.
In spite of the importance of the SEI, there is a dearth of
methods for controlling the SEI characteristics by elegant
chemistry. Due to a significant effect of surface properties of
graphite on SEI formation [17–21], researchers have mostly
employed surface pretreatment of graphite like chemical
[22,23], electrochemical [24], and thermal [25] for improved
performance. There have been relatively few reports on
modification of the surface with a defined control over the
surface chemistry and reactivity for ameliorating SEI forma-
tion and characteristics. One such report is on formation of
artificial SEI by electropainting and vacuum-insertion tech-
niques [26].
On the other hand, there is a huge amount of literature on
surface modification using grafting techniques for applica-
tions like sensors and electroanalysis. Various precursors like
alcohols, amines, carboxylates, diazonium salts, iodonium
salts, and sulfonium salts can be grafted electrochemically.
Out of these, diazonium salts [27] are most commonly used.
Diazonium salt undergoes one electron reduction, which re-
sults in N2 detachment from the molecule and the resulting
organic moiety radical attaches itself to the substrate via
covalent bond [28]. The method of grafting a part of the diazo-
nium salt onto a substrate by chemical covalent bond is one
of the most elegant method of functionalizing surfaces [29].
This method has a wide scope of expanding its zone of appli-
cation. Until now there are only a few reports on employing
this method for Li-ion battery applications, like those from
Pan et al. [30–32] and Martin et al. [33]. However, the main fo-
cus of these studies is to use grafting for improving cyclability
of silicon based negative electrodes. To the best of our knowl-
edge, this technique has not yet been used for tuning SEI
properties. This method of surface modification would partic-
ularly be useful for making an artificial SEI as the layer
formed by grafting is covalently attached to the surface and
is hence expected to be stable on graphite surface throughout
cycling (unlike the real SEI).
We have established in our previous publication [29], graft-
ing followed by functional group transformation as a method
for modifying glassy carbon (GC) surfaces with an organic
moiety and then tuning its reactivity by altering the chemical
nature of its terminal functional group. It was shown that the
two steps can be used in conjugation to obtain tailor made
surfaces. Here, we translate these methods of surface modifi-
cation established on GC (2D sp2) to graphite powders (stacks
of 2D sp2). The scheme of surface modification methods em-
ployed in this work is shown in Fig. 1. The core shaded part of
the concentric diagram is the grafting step. The consecutive
electrochemical/chemical reduction step is shown in the out-
er concentric circle. The goal is to establish these surface
modification methods for improved electrochemical proper-
ties of graphite material in Li-ion battery, especially for con-
trolled SEI formation, and prevention of exfoliation of
graphite in PC based electrolyte. The aim of this work is to
illustrate the effectiveness of grafting methods for improved
electrochemical properties. Hence, we have not elaborately
checked upon different grafting conditions possible (time,
concentration of the diazonium salt, etc.) within each meth-
od. The goal is to show that various possible routes can be
employed for grafting (as per specific experimental or mate-
rial needs (and/or constraints)), and to compare them with
each other to define which method would be suitable for
improving specific attributes of the material. For the second
step of tuning functionality, also we have only shown as
examples a couple of reducing methods (amongst the infinite
possibilities), to illustrate that this step indeed changes the
functional group of the terminus of the grafted layer (while
retaining the covalent nature of attachment of the grafted
layer), and can be hence adapted for obtaining tailor made
functionality for specific applications.
We have applied known methods of grafting namely elec-
trochemical grafting [27], in situ grafting [33], and another
method which we call spontaneous grafting (using isolated
diazonium salt) to micrometer size graphite powder (shown
in shaded part of Fig. 1). We show by X-ray photoelectron

C A R B O N 5 0 ( 2 0 1 2 ) 2 5 9 9 – 2 6 1 4 2601
spectroscopy (XPS) and scanning electron microscopy (SEM)
how the loading and surface morphology of the grafted layer
depend on the method of grafting.
The grafted moiety in these cases had to be p-carboxylic
benzene (due to the stability of its corresponding diazonium
salt). But for application in Li-ion batteries, an oxidized func-
tional group such as –COOH, would result in additional charge
consumption for reduction of the grafted group. Hence, it
would be desirable to reduce the grafted –COOH functional
group to the most reduced and lithiated state like –CH2OLi.
These groups at the terminal of the grafted layer would not
require additional charge for reduction and minimize H2 gas
evolution by side reactions of the proton. Hence, the end
functional group of grafted graphite powders has been re-
duced by chemical and electrochemical methods (shown in
the outer circle in Fig. 1).
Consequence of grafting and further chemical treatments
is studied on electrochemical properties like SEI formation
and Li-ion intercalation in 1 M LiPF6 in EC:dimethyl carbonate
(DMC) (1:1) electrolyte; and exfoliation of graphite in 1 M LiPF6
in EC:PC (15:85 w/w) electrolyte.
2. Experimental
The routes employed for surface modification of carbon sur-
faces are schematically shown in Fig. 2. Methods a–d refer to
electrochemical grafting, in situ non-aqueous grafting, in situ
aqueous grafting, and spontaneous grafting, respectively.
The diazonium salt used was p-carboxylic benzene diazonium
tetrafluoroborate (PCBD). This salt was chosen due its relative
stability and because carbonyl groups are among the most
commonly present on the graphite surface. It is also feasible
to transform carboxylic acid groups by various chemical
methods to other functional groups, like alkoxides or carbon-
ates. PCBD was synthesized from p-amino benzoic acid as per
the route described in literature [34]. Fourier transform infra-
red spectroscopy (FT-IR) spectrum of the product (PCBD) as
compared to the precursor (p-amino benzoic acid) showed
NN+
COOH COOH
NH2 COOH COOH
NH2 COOH COOH
NN+
COOH COOH
+
+ e-, - N2
-2.0 V vs. Ag wire
5 mM PCBD + 1 M Et4NBF4 in CH3CN
(a)
+ CH3CN
(b) t-butylnitrite
+ H2O
(c)NaNO2, conc. HCl
+CH3CN
(d)
Fig. 2 – Scheme of (a) electrochemical grafting; (b) in situ non-
aqueous grafting; (c) in situ aqueous grafting; and (d)
spontaneous grafting.
the loss of NH2 (3458, 3360 cm�1) and appearance of NBN+
(2304 cm�1) and BF�4 (1037 cm�1) vibrations. For precise
chemical analysis by XPS, model electrode viz. GC (HTW,
SIGRADUR-G disc, 15 · 1 mm) was grafted. And for morphol-
ogy and electrochemical characterization SFG6 powder graph-
ite (TIMCAL�, Switzerland) was used. It was used as received
(Brunauer–Emmett–Teller (BET) specific surface area 17 m2/g
and particle size 5.5–7.5 lm).
2.1. Electrochemical grafting
Electrochemical grafting was carried out in a specially de-
signed in-house built three-electrode cell, with Pt as counter
electrode and Ag wire as reference electrode. This cell allows
complete immersion of the working electrode (GC or compos-
ite graphite electrode) in the electrolyte and can be hermeti-
cally sealed. Reference potential of Ag wire was calibrated
from FeðCNÞ3�6 =FeðCNÞ4�6 aqueous system; it was found to be
+0.14 V vs. standard hydrogen electrode. For electrochemical
grafting of GC, the GC disc (as received) was used as the
working electrode. For electrochemical grafting of SFG6
graphite; the working electrode was prepared by casting a
slurry of SFG6 graphite with styrene–butadiene rubber (SBR)
binder (90:10 w/w) in hexane on a Ti current collector, and
drying at 80 �C under vacuum for a few hours. For electro-
chemical grafting, cyclic voltammetry (CV) was run from
�2.0 to 0.5 V vs. Ag wire at a scan rate of 5 mV/s. The grafting
bath was 0.1 M (C2H5)4NBF4 in CH3CN, H2O < 50 ppm, contain-
ing 5 mM PCBD. The cell was assembled and hermetically
sealed in an Ar filled glove box (O2 < 0.6 ppm, H2O < 3 ppm).
As is usually the case with diazonium grafting, the grafting
was mostly complete in the first cycle of the CV. But for por-
ous composite electrode made from SFG6 graphite powder,
grafting CV was run until five cycles, to ensure complete
grafting.
After washing with CH3CN and drying at room tempera-
ture, electrochemically grafted graphite electrode was re-
duced electrochemically in 1 M (C2H5)4NBF4 in acetonitrile
electrolyte using the experimental electrochemical set up
and conditions described in our previous publication [29].
After electrochemical reduction graphite electrode was
scraped off, and treated with 1.6 M n-butyl lithium (BuLi) in
hexane. The sample was washed with anhydrous hexane,
and dried inside the glove box.
2.2. In situ grafting (aqueous)
SFG6 graphite powder (without binder) was chemically
grafted by p-amino benzoic acid following the synthesis de-
scribed by Martin et al. [33].
2.3. In situ grafting (non-aqueous)
p-Amino benzoic acid (2.9 mmoles) was stirred in 50 mL
CH3CN. To this 400 mg SFG6 graphite powder was added.
Then, 6.2 mmoles tert-butyl nitrite was added drop wise un-
der constant and vigorous stirring. The mixture was stirred
for two hours. The powder was filtered and washed well with
CH3CN. The whole procedure was performed in the absence
of O2 and moisture.

2602 C A R B O N 5 0 ( 2 0 1 2 ) 2 5 9 9 – 2 6 1 4
2.4. Spontaneous grafting
Isolated PCBD was dissolved in CH3CN. To this SFG6 graphite
was added. The mixture was stirred for 2 h. The powder was
filtered and washed well with CH3CN. The whole procedure
was performed in the absence of O2 and moisture.
Each of the chemically grafted graphite powders (in situ
and spontaneously grafted) was further treated with 1.6 M
BuLi in hexane, and 2 M LiAlH4 in tetrahydrofuran in separate
experiments. Both these solutions were used as received from
Sigma–Aldrich. Chemically reduced samples were washed
well with anhydrous hexane, and dried inside the glove box.
All the modification procedures were carried out in an Ar
filled glove box (O2 < 0.6 ppm, H2O < 3 ppm), to avoid any reac-
tions of the air sensitive reagents and samples with air and
moisture. The resulting modified graphite’s were studied elec-
trochemically and by SEM.
Chemical analysis of modified GC model electrodes was
performed by XPS using ESCALAB 220iXL instrument using
AlKa (1486.6 eV) radiation. Apart from washing in acetonitrile
and drying in the glove box, no further sample preparation was
performed prior to XPS measurements. During the transfer to
the XPS chamber the samples were exposed to the air for a few
seconds. Data evaluation was done by CasaXPS software.
Ultra55 Field Emission SEM was used to visualize the sur-
face morphology of both modified (prior cycling) and electro-
chemically cycled samples. Pictures were taken using In Lens
detector at 3 keV accelerating voltage. An in-house built
transfer chamber was used for transferring the air-sensitive
and cycled samples from the glove box (where the electro-
chemical cells were disassembled) to the SEM measurement
chamber without exposure to air. This is necessary in order
to avoid any alterations/reactions of the air sensitive SEI with
O2 or H2O from air. All the grafted samples were washed with
DMC after 50 electrochemical cycles and dried inside the
glove box for post mortem SEM analysis.
For electrochemical cycling, standard test cells using Li
metal as counter cum reference electrode were used. To min-
imize the possible effect of the binder and solvent on the
chemical nature of the grafted layer, chemically inert binder
296 292 288 284
COOH
C-O
C-C
π->π* spontaneousin situ aqin situ non-aq
electrochemical pristine GCN
orm
aliz
ed in
tens
ity (a
.u)
Binding energy (eV)
Fig. 3 – XPS C 1s spectra of pristine GC, GC grafted by
electrochemical grafting, in situ non-aqueous grafting,
in situ aqueous grafting, and spontaneous grafting.
SBR and inert solvent hexane was used in slurry formulation
(10/90 SBR/graphite w/w). The slurry was applied onto Ti cur-
rent collector stubs and dried. Electrochemical cycling was
done galvanostatically (constant current) at C/10 rate in 1 M
LiPF6 in 1:1 (w/w) EC:DMC in the potential window 0.01 mV
to 1.0 V vs. Li+/Li. C/10 rate means that the current applied
is so that there is one charge (one Li+ insertion per C6) in
10 h. For SEI formation and Li-ion intercalation characteriza-
tions, cyclic voltammetry (CV) of the SFG6 electrodes vs. Li
metal was run at the potential sweep rate of 0.01 mV/s in
the potential window from 0.01 mV to 1.0 V vs. Li+/Li. For
exfoliation studies the graphite electrodes were cycled in
the electrolyte 1 M LiPF6 in EC:PC (15:85) at C/37 rate. All elec-
trochemical experiments were conducted at 25 �C (±1 �C).
3. Results and discussion
3.1. XPS analysis of GC samples after grafting step
For quantitative comparison of the chemical composition of
the grafted layers, GC was used as model for the surface of
the graphite powder. GC is used as model because it is chem-
ically similar to graphite sp2, and ensures that the XPS spectra
record information from the flat surface layer, without addi-
tional effects and attenuations occurring in powder samples.
Comparative XPS measurements on grafted GC sample and
grafted powder graphite sample showed that the spectral sig-
nals from the grafted layer were more predominant in GC
sample (results not shown). Chemical information from XPS
of grafted GC samples can then be translated and correlated
with properties of grafted graphite’s. GC samples were grafted
by electrochemical grafting, in situ aqueous grafting, in situ
non-aqueous grafting, and spontaneous grafting techniques
as per the schemes shown in Fig. 2. C 1s XPS spectra recorded
for pristine GC and grafted GC samples are shown in Fig. 3.
XPS C 1s spectra of all the grafted GC samples show a new
peak (at binding energy �289.1 eV) as compared to pristine
GC, it is attributed to the carbon of the carboxylic acid group
[29,35]. This is a direct evidence that the grafting of diazo-
nium salt PCBD has occurred in all the four cases. However,
the loading of grafting is not the same for all samples. In order
to quantify the content of carboxylic acid groups in the sur-
face layer each XPS C 1s spectrum was deconvoluted with
4–5 peaks and quantified. In the surface layer of electrochem-
ically grafted, in situ non-aqueous grafted, in situ aqueous
grafted, and spontaneously grafted GC samples 7.3%, 6.8%,
5.6%, and 4.8% of the carbon was that of carboxylic acid
group, respectively (percentage = C of –COOH/total C content).
The error range for this calculation is ±0.2%. The order of ex-
tent of grafting is hard to perceive from the C 1s envelope
shown in Fig. 3, but note that our calculations also take into
account different full width at half maxima of –COOH compo-
nents in various samples. The reason of different shapes of
the –COOH components, could be the different local chemical
environment of the –COOH group, which results from
different side reactions occurring during different grafting
procedures. Thus, loading of the grafting decreases in the
order electrochemical > in situ non-aqueous > in situ aque-
ous > spontaneous. This trend is in line with our expectation.
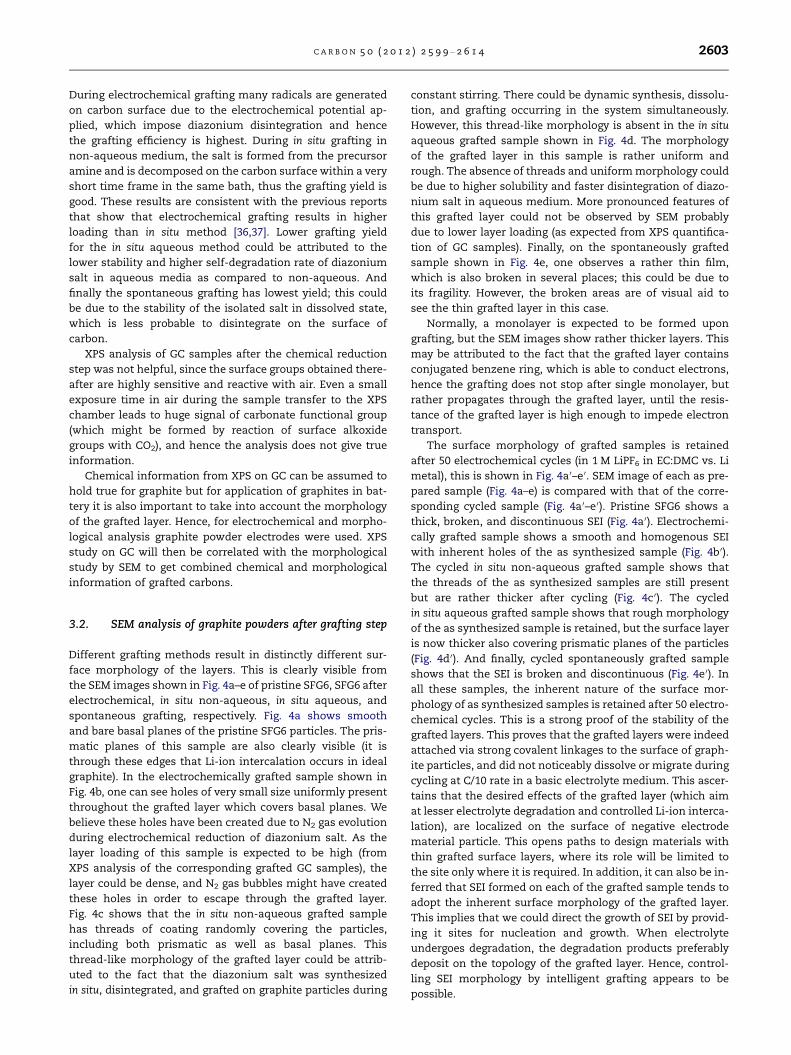
C A R B O N 5 0 ( 2 0 1 2 ) 2 5 9 9 – 2 6 1 4 2603
During electrochemical grafting many radicals are generated
on carbon surface due to the electrochemical potential ap-
plied, which impose diazonium disintegration and hence
the grafting efficiency is highest. During in situ grafting in
non-aqueous medium, the salt is formed from the precursor
amine and is decomposed on the carbon surface within a very
short time frame in the same bath, thus the grafting yield is
good. These results are consistent with the previous reports
that show that electrochemical grafting results in higher
loading than in situ method [36,37]. Lower grafting yield
for the in situ aqueous method could be attributed to the
lower stability and higher self-degradation rate of diazonium
salt in aqueous media as compared to non-aqueous. And
finally the spontaneous grafting has lowest yield; this could
be due to the stability of the isolated salt in dissolved state,
which is less probable to disintegrate on the surface of
carbon.
XPS analysis of GC samples after the chemical reduction
step was not helpful, since the surface groups obtained there-
after are highly sensitive and reactive with air. Even a small
exposure time in air during the sample transfer to the XPS
chamber leads to huge signal of carbonate functional group
(which might be formed by reaction of surface alkoxide
groups with CO2), and hence the analysis does not give true
information.
Chemical information from XPS on GC can be assumed to
hold true for graphite but for application of graphites in bat-
tery it is also important to take into account the morphology
of the grafted layer. Hence, for electrochemical and morpho-
logical analysis graphite powder electrodes were used. XPS
study on GC will then be correlated with the morphological
study by SEM to get combined chemical and morphological
information of grafted carbons.
3.2. SEM analysis of graphite powders after grafting step
Different grafting methods result in distinctly different sur-
face morphology of the layers. This is clearly visible from
the SEM images shown in Fig. 4a–e of pristine SFG6, SFG6 after
electrochemical, in situ non-aqueous, in situ aqueous, and
spontaneous grafting, respectively. Fig. 4a shows smooth
and bare basal planes of the pristine SFG6 particles. The pris-
matic planes of this sample are also clearly visible (it is
through these edges that Li-ion intercalation occurs in ideal
graphite). In the electrochemically grafted sample shown in
Fig. 4b, one can see holes of very small size uniformly present
throughout the grafted layer which covers basal planes. We
believe these holes have been created due to N2 gas evolution
during electrochemical reduction of diazonium salt. As the
layer loading of this sample is expected to be high (from
XPS analysis of the corresponding grafted GC samples), the
layer could be dense, and N2 gas bubbles might have created
these holes in order to escape through the grafted layer.
Fig. 4c shows that the in situ non-aqueous grafted sample
has threads of coating randomly covering the particles,
including both prismatic as well as basal planes. This
thread-like morphology of the grafted layer could be attrib-
uted to the fact that the diazonium salt was synthesized
in situ, disintegrated, and grafted on graphite particles during
constant stirring. There could be dynamic synthesis, dissolu-
tion, and grafting occurring in the system simultaneously.
However, this thread-like morphology is absent in the in situ
aqueous grafted sample shown in Fig. 4d. The morphology
of the grafted layer in this sample is rather uniform and
rough. The absence of threads and uniform morphology could
be due to higher solubility and faster disintegration of diazo-
nium salt in aqueous medium. More pronounced features of
this grafted layer could not be observed by SEM probably
due to lower layer loading (as expected from XPS quantifica-
tion of GC samples). Finally, on the spontaneously grafted
sample shown in Fig. 4e, one observes a rather thin film,
which is also broken in several places; this could be due to
its fragility. However, the broken areas are of visual aid to
see the thin grafted layer in this case.
Normally, a monolayer is expected to be formed upon
grafting, but the SEM images show rather thicker layers. This
may be attributed to the fact that the grafted layer contains
conjugated benzene ring, which is able to conduct electrons,
hence the grafting does not stop after single monolayer, but
rather propagates through the grafted layer, until the resis-
tance of the grafted layer is high enough to impede electron
transport.
The surface morphology of grafted samples is retained
after 50 electrochemical cycles (in 1 M LiPF6 in EC:DMC vs. Li
metal), this is shown in Fig. 4a 0–e 0. SEM image of each as pre-
pared sample (Fig. 4a–e) is compared with that of the corre-
sponding cycled sample (Fig. 4a 0–e 0). Pristine SFG6 shows a
thick, broken, and discontinuous SEI (Fig. 4a 0). Electrochemi-
cally grafted sample shows a smooth and homogenous SEI
with inherent holes of the as synthesized sample (Fig. 4b 0).
The cycled in situ non-aqueous grafted sample shows that
the threads of the as synthesized samples are still present
but are rather thicker after cycling (Fig. 4c 0). The cycled
in situ aqueous grafted sample shows that rough morphology
of the as synthesized sample is retained, but the surface layer
is now thicker also covering prismatic planes of the particles
(Fig. 4d 0). And finally, cycled spontaneously grafted sample
shows that the SEI is broken and discontinuous (Fig. 4e 0). In
all these samples, the inherent nature of the surface mor-
phology of as synthesized samples is retained after 50 electro-
chemical cycles. This is a strong proof of the stability of the
grafted layers. This proves that the grafted layers were indeed
attached via strong covalent linkages to the surface of graph-
ite particles, and did not noticeably dissolve or migrate during
cycling at C/10 rate in a basic electrolyte medium. This ascer-
tains that the desired effects of the grafted layer (which aim
at lesser electrolyte degradation and controlled Li-ion interca-
lation), are localized on the surface of negative electrode
material particle. This opens paths to design materials with
thin grafted surface layers, where its role will be limited to
the site only where it is required. In addition, it can also be in-
ferred that SEI formed on each of the grafted sample tends to
adopt the inherent surface morphology of the grafted layer.
This implies that we could direct the growth of SEI by provid-
ing it sites for nucleation and growth. When electrolyte
undergoes degradation, the degradation products preferably
deposit on the topology of the grafted layer. Hence, control-
ling SEI morphology by intelligent grafting appears to be
possible.

Fig. 4 – SEM images of (a) pristine; (b) electrochemically grafted; (c) in situ non-aqueous grafted; (d) in situ aqueous grafted; and
(e) spontaneously grafted SFG6 graphite powders. They are compared with the cycled in EC:DMC, 1 M LiPF6 (a 0) pristine; (b 0)
electrochemically grafted; (c 0) in situ non-aqueous grafted; (d 0) in situ aqueous grafted; and (e 0) spontaneously grafted SFG6
graphite powders.
2604 C A R B O N 5 0 ( 2 0 1 2 ) 2 5 9 9 – 2 6 1 4
3.3. SEM analysis of grafted graphite powders afterreduction step
SEM images of grafted graphite samples after chemical reduc-
tion are shown in Fig. 5. It is observed that surface morphol-
ogy of each grafted sample is retained after its chemical
reduction. Holes on the surface of electrochemically grafted
sample shown in Fig. 5b, are retained after its electrochemical
reduction (Fig. 5c). The thread-like morphology of the in situ
non-aqueous grafted sample shown in Fig. 5d is retained after
its chemical reductions with BuLi and LiAlH4 (shown in Fig. 5e
and f, respectively). Similarly, rough morphology of in situ
aqueous grafted sample shown in Fig. 5g is retained after its
chemical reductions with BuLi and LiAlH4 ( Fig. 5h and i,
respectively). And finally, the broken nature of surface film
on spontaneously grafted sample shown in Fig. 5j is also vis-
ible after its chemical reduction with BuLi and LiAlH4 (shown
in Fig. 5k and l, respectively). This is a direct proof that in all
cases, grafting occurs via sufficiently strong covalent bonding
and can therefore withstand harsh chemical treatments. We
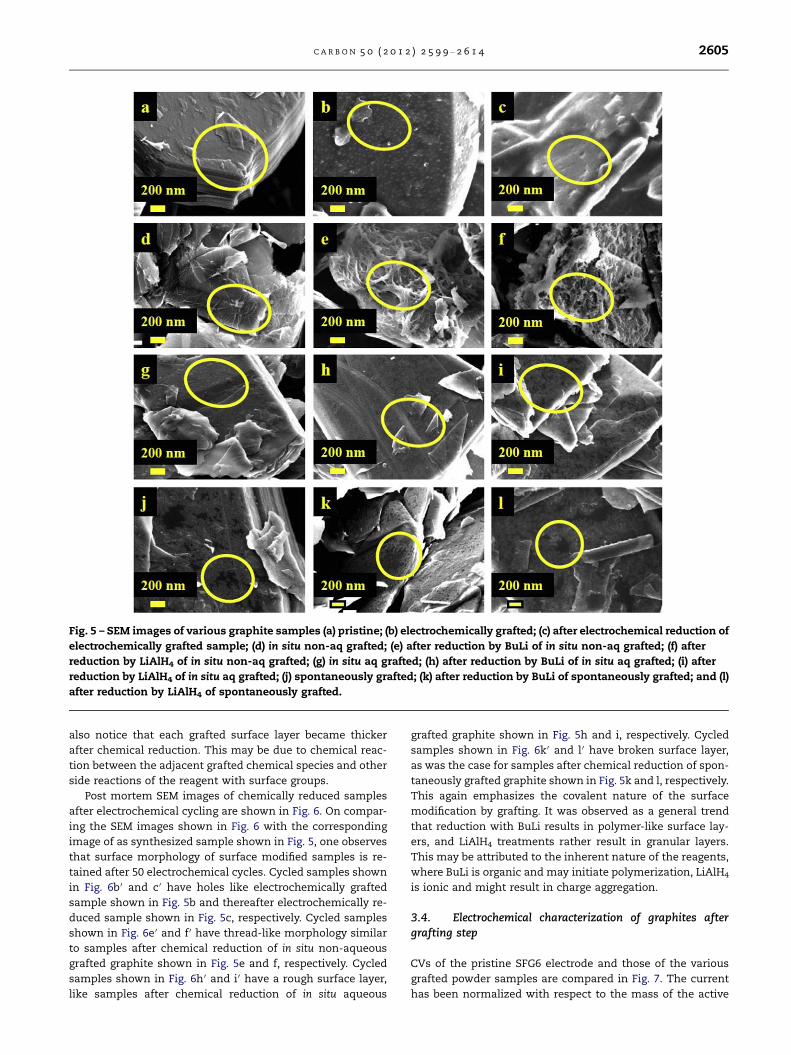
Fig. 5 – SEM images of various graphite samples (a) pristine; (b) electrochemically grafted; (c) after electrochemical reduction of
electrochemically grafted sample; (d) in situ non-aq grafted; (e) after reduction by BuLi of in situ non-aq grafted; (f) after
reduction by LiAlH4 of in situ non-aq grafted; (g) in situ aq grafted; (h) after reduction by BuLi of in situ aq grafted; (i) after
reduction by LiAlH4 of in situ aq grafted; (j) spontaneously grafted; (k) after reduction by BuLi of spontaneously grafted; and (l)
after reduction by LiAlH4 of spontaneously grafted.
C A R B O N 5 0 ( 2 0 1 2 ) 2 5 9 9 – 2 6 1 4 2605
also notice that each grafted surface layer became thicker
after chemical reduction. This may be due to chemical reac-
tion between the adjacent grafted chemical species and other
side reactions of the reagent with surface groups.
Post mortem SEM images of chemically reduced samples
after electrochemical cycling are shown in Fig. 6. On compar-
ing the SEM images shown in Fig. 6 with the corresponding
image of as synthesized sample shown in Fig. 5, one observes
that surface morphology of surface modified samples is re-
tained after 50 electrochemical cycles. Cycled samples shown
in Fig. 6b 0 and c 0 have holes like electrochemically grafted
sample shown in Fig. 5b and thereafter electrochemically re-
duced sample shown in Fig. 5c, respectively. Cycled samples
shown in Fig. 6e 0 and f 0 have thread-like morphology similar
to samples after chemical reduction of in situ non-aqueous
grafted graphite shown in Fig. 5e and f, respectively. Cycled
samples shown in Fig. 6h 0 and i 0 have a rough surface layer,
like samples after chemical reduction of in situ aqueous
grafted graphite shown in Fig. 5h and i, respectively. Cycled
samples shown in Fig. 6k 0 and l 0 have broken surface layer,
as was the case for samples after chemical reduction of spon-
taneously grafted graphite shown in Fig. 5k and l, respectively.
This again emphasizes the covalent nature of the surface
modification by grafting. It was observed as a general trend
that reduction with BuLi results in polymer-like surface lay-
ers, and LiAlH4 treatments rather result in granular layers.
This may be attributed to the inherent nature of the reagents,
where BuLi is organic and may initiate polymerization, LiAlH4
is ionic and might result in charge aggregation.
3.4. Electrochemical characterization of graphites aftergrafting step
CVs of the pristine SFG6 electrode and those of the various
grafted powder samples are compared in Fig. 7. The current
has been normalized with respect to the mass of the active

Fig. 6 – SEM images of graphite samples after 50 electrochemical cycles in 1 M LiPF6 in EC:DMC: (b 0). electrochemically grafted;
(c 0) after electrochemical reduction of electrochemically grafted sample; (e 0) after reduction by BuLi of in situ non-aq grafted; (f 0)
after reduction by LiAlH4 of in situ non-aq grafted; (h 0) after reduction by BuLi of in situ aq grafted; (i 0) after reduction by LiAlH4
of in situ aq grafted; (k 0) after reduction by BuLi of spontaneously grafted; and (l 0) after reduction by LiAlH4 of spontaneously
grafted.
2606 C A R B O N 5 0 ( 2 0 1 2 ) 2 5 9 9 – 2 6 1 4
material used. In Fig. 7a we see a zoom into the SEI formation
region. (SEI normally forms around 0.8 V vs. Li+/Li [9,38]). The
negative peak at this potential is associated with electro-
chemical reduction of the electrolyte. It is seen from Fig. 7a
that SEI formation peak current follows the order electro-
chemically grafted < in situ non-aqueous grafted < in situ
aqueous grafted < spontaneously grafted < pristine. This is
in opposite order as the extent of loading of grafting quanti-
fied for model GC electrodes by XPS in Section 3.1, and indi-
rectly visible in the morphological analysis by SEM shown in
Section 3.2. Hence, it implies that higher the loading of the
grafted layer, lesser is the current for SEI formation/electro-
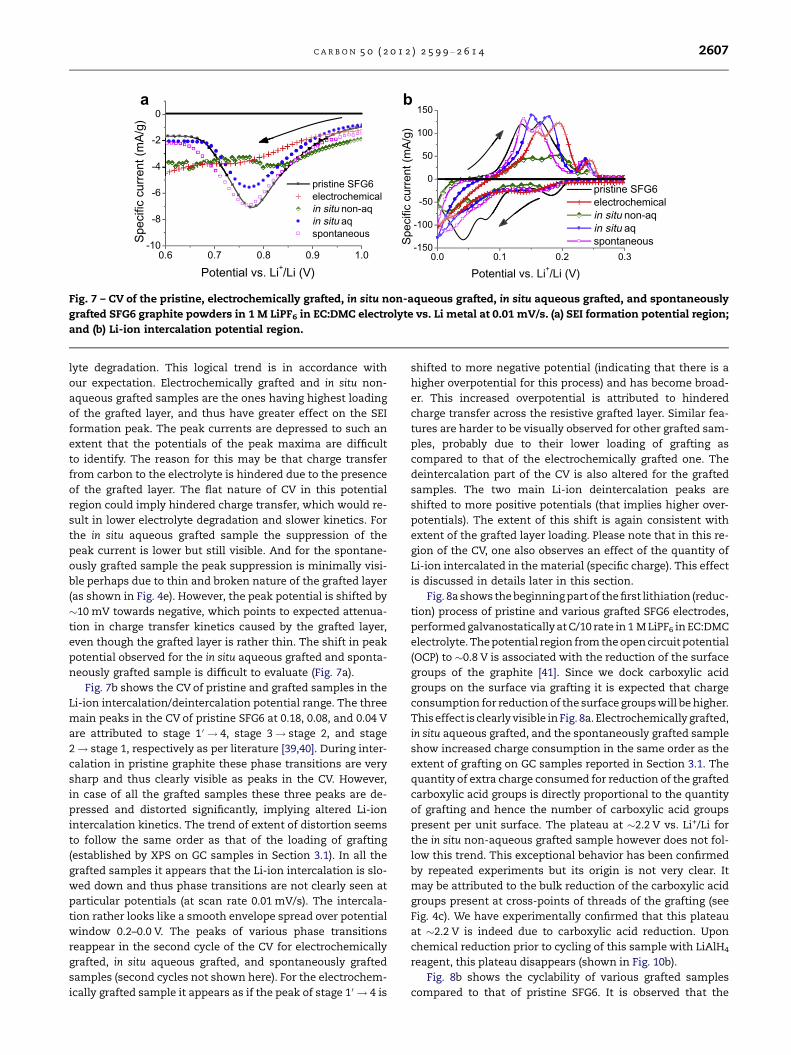
0.6 0.7 0.8 0.9 1.0-10
-8
-6
-4
-2
0
Spec
ific
curre
nt (m
A/g)
Potential vs. Li+/Li (V)
pristine SFG6 electrochemicalin situ non-aqin situ aq spontaneous
0.0 0.1 0.2 0.3-150
-100
-50
0
50
100
150
Spec
ific
curre
nt (m
A/g)
Potential vs. Li+/Li (V)
pristine SFG6 electrochemicalin situ non-aqin situ aq spontaneous
a b
Fig. 7 – CV of the pristine, electrochemically grafted, in situ non-aqueous grafted, in situ aqueous grafted, and spontaneously
grafted SFG6 graphite powders in 1 M LiPF6 in EC:DMC electrolyte vs. Li metal at 0.01 mV/s. (a) SEI formation potential region;
and (b) Li-ion intercalation potential region.
C A R B O N 5 0 ( 2 0 1 2 ) 2 5 9 9 – 2 6 1 4 2607
lyte degradation. This logical trend is in accordance with
our expectation. Electrochemically grafted and in situ non-
aqueous grafted samples are the ones having highest loading
of the grafted layer, and thus have greater effect on the SEI
formation peak. The peak currents are depressed to such an
extent that the potentials of the peak maxima are difficult
to identify. The reason for this may be that charge transfer
from carbon to the electrolyte is hindered due to the presence
of the grafted layer. The flat nature of CV in this potential
region could imply hindered charge transfer, which would re-
sult in lower electrolyte degradation and slower kinetics. For
the in situ aqueous grafted sample the suppression of the
peak current is lower but still visible. And for the spontane-
ously grafted sample the peak suppression is minimally visi-
ble perhaps due to thin and broken nature of the grafted layer
(as shown in Fig. 4e). However, the peak potential is shifted by
�10 mV towards negative, which points to expected attenua-
tion in charge transfer kinetics caused by the grafted layer,
even though the grafted layer is rather thin. The shift in peak
potential observed for the in situ aqueous grafted and sponta-
neously grafted sample is difficult to evaluate (Fig. 7a).
Fig. 7b shows the CV of pristine and grafted samples in the
Li-ion intercalation/deintercalation potential range. The three
main peaks in the CV of pristine SFG6 at 0.18, 0.08, and 0.04 V
are attributed to stage 1 0 ! 4, stage 3! stage 2, and stage
2! stage 1, respectively as per literature [39,40]. During inter-
calation in pristine graphite these phase transitions are very
sharp and thus clearly visible as peaks in the CV. However,
in case of all the grafted samples these three peaks are de-
pressed and distorted significantly, implying altered Li-ion
intercalation kinetics. The trend of extent of distortion seems
to follow the same order as that of the loading of grafting
(established by XPS on GC samples in Section 3.1). In all the
grafted samples it appears that the Li-ion intercalation is slo-
wed down and thus phase transitions are not clearly seen at
particular potentials (at scan rate 0.01 mV/s). The intercala-
tion rather looks like a smooth envelope spread over potential
window 0.2–0.0 V. The peaks of various phase transitions
reappear in the second cycle of the CV for electrochemically
grafted, in situ aqueous grafted, and spontaneously grafted
samples (second cycles not shown here). For the electrochem-
ically grafted sample it appears as if the peak of stage 1 0 ! 4 is
shifted to more negative potential (indicating that there is a
higher overpotential for this process) and has become broad-
er. This increased overpotential is attributed to hindered
charge transfer across the resistive grafted layer. Similar fea-
tures are harder to be visually observed for other grafted sam-
ples, probably due to their lower loading of grafting as
compared to that of the electrochemically grafted one. The
deintercalation part of the CV is also altered for the grafted
samples. The two main Li-ion deintercalation peaks are
shifted to more positive potentials (that implies higher over-
potentials). The extent of this shift is again consistent with
extent of the grafted layer loading. Please note that in this re-
gion of the CV, one also observes an effect of the quantity of
Li-ion intercalated in the material (specific charge). This effect
is discussed in details later in this section.
Fig. 8a shows the beginning part of the first lithiation (reduc-
tion) process of pristine and various grafted SFG6 electrodes,
performed galvanostatically at C/10 rate in 1 M LiPF6 in EC:DMC
electrolyte. The potential region from the open circuit potential
(OCP) to �0.8 V is associated with the reduction of the surface
groups of the graphite [41]. Since we dock carboxylic acid
groups on the surface via grafting it is expected that charge
consumption for reduction of the surface groups will be higher.
This effect is clearly visible in Fig. 8a. Electrochemically grafted,
in situ aqueous grafted, and the spontaneously grafted sample
show increased charge consumption in the same order as the
extent of grafting on GC samples reported in Section 3.1. The
quantity of extra charge consumed for reduction of the grafted
carboxylic acid groups is directly proportional to the quantity
of grafting and hence the number of carboxylic acid groups
present per unit surface. The plateau at �2.2 V vs. Li+/Li for
the in situ non-aqueous grafted sample however does not fol-
low this trend. This exceptional behavior has been confirmed
by repeated experiments but its origin is not very clear. It
may be attributed to the bulk reduction of the carboxylic acid
groups present at cross-points of threads of the grafting (see
Fig. 4c). We have experimentally confirmed that this plateau
at �2.2 V is indeed due to carboxylic acid reduction. Upon
chemical reduction prior to cycling of this sample with LiAlH4
reagent, this plateau disappears (shown in Fig. 10b).
Fig. 8b shows the cyclability of various grafted samples
compared to that of pristine SFG6. It is observed that the

0 5 10 15 20 250.5
1.0
1.5
2.0
2.5
3.0
Pot
entia
l vs.
Li+
/Li (
V)
Specific charge (mAh/g)
pristine SFG6 electrochemical in situ non-aq in situ aq spontaneous
0 10 20 30 40 500
100
200
300
400
Spe
cific
cha
rge
(mA
h/g)
Number of cycles
pristine SFG6 electrochemicalin situ non-aqin situ aq spontaneous
a b
Fig. 8 – (a) The beginning part of the first lithiation process of pristine, electrochemically grafted, in situ non-aqueous grafted,
in situ aqueous grafted, and spontaneously grafted SFG6 graphite powder samples, performed galvanostatically at C/10
discharge rate in 1 M LiPF6 in EC:DMC electrolyte. (b) The specific charge (during the charge/lithiation) vs. cycle number of
pristine, electrochemically grafted, in situ non-aqueous grafted, in situ aqueous grafted, and spontaneously grafted SFG6
graphite electrodes cycled galvanostatically at C/10 rate in 1 M LiPF6 in EC:DMC electrolyte.
2608 C A R B O N 5 0 ( 2 0 1 2 ) 2 5 9 9 – 2 6 1 4
practical specific charge retrieved reversibly at C/10 rate from
the electrochemically grafted and the in situ non-aqueous
grafted sample is much lower than that of the other samples
(cycling at slower rates was not tested). This is attributed to
the strongly hindered charge transfer and consequently hin-
dered Li-ion intercalation in these samples, due to heavy
loading of the grafted layer (as expected by XPS analysis of
grafted GC and SEM analysis of grafted graphite). It may also
be attributed to electrical isolation of some particles due to
their entire surface coverage by passive grafting. The heavily
grafted particles may be shielded from electronic conduction
pathways and may thus not be available for Li-ion intercala-
tion. However, we assume that electron transfer is not com-
pletely blocked by the grafted layer due to the presence of
the conjugated aromatic ring present in it. This delocalized
system could serve as electron conduction pathway, and
when thin enough it could allow the electrons as well as the
Li-ions to transfer through it [29]. Another reason for a low va-
lue of specific charge could be that we have not subtracted the
mass of the redox inactive layer from the total active mass for
the normalization of specific charge. The spontaneously
grafted and the in situ aqueous grafted samples have similar
practical specific charge as that of the pristine SFG6. This is
attributed to lower thickness of the grafted layer in these
samples, due to which particle blocking or isolation is less
prominent. This proves that if the grafted layer is thin en-
ough, it is capable of good cycling concomitantly with lower
electrolyte degradation and modified Li-ion intercalation
(shown in the CV in Fig. 7). Note that the cyclability of SFG6
pristine electrode is not optimum, due to difficult electrode
preparation process in the glove box, which was necessary
for this work.
3.5. Electrochemical characterization of grafted graphitesafter reduction step
CVs of grafted graphite electrodes after chemical reduction
step in 1 M LiPF6 in EC:DMC (50:50) at 0.01 mV/s are shown
in Fig. 9. The currents have been normalized by the total mass
of the active material (graphite + surface layer). Graphs in the
left column show the SEI formation potential region of the
CVs. Graphs on the right hand side column show the Li-ion
intercalation/deintercalation potential window of the CVs.
Here, CVs of pristine graphite (circles) and grafted graphites
(squares), are compared with corresponding chemically re-
duced grafted graphite (stars and triangles). Fig. 9a shows
the CV of electrochemically grafted sample, and thereafter
electrochemically reduced sample. It is evident that the
charge consumption in the potential range of SEI formation
(depicted by negative peak current) is lower for the electro-
chemically reduced sample. This trend also holds true for
in situ non-aqueous grafted (Fig. 9c), in situ aqueous grafted
(Fig. 9e), and spontaneously grafted (Fig. 9g) graphite samples.
However, in Fig. 9e, the grafted sample after reduction with
LiAlH4 shows a rather reversible reaction in the SEI formation
potential window. It also exhibits higher charge consumption
in the potential range of SEI formation. The redox couple(s)
involved are not understood, but increased peak current
may be attributed to enhanced ionic conductivity of the sur-
face layer due to ionic nature of LiAlH4. Similar feature is ob-
served in CV of spontaneously grafted sample reduced by
LiAlH4 shown in Fig. 9g.
The envelope shape of the Li-ion intercalation/deintercala-
tion is also changed after the reduction step (as seen in Fig. 9b
and d). From Fig. 9d, it is clear that after every consecutive
surface treatment step the amount of Li-ions intercalated into
the graphite under the given electrochemical protocol is low-
ered. Li-ion intercalation/deintercalation kinetics for the
chemically reduced samples (as seen also in Fig. 9f and h)
as compared to the grafted samples is also modified as seen
from changes in electrochemical overpotentials and envelope
shapes, but the changes are not so drastic, and do not seem to
follow a regular trend. Thus, chemical reduction of grafted
graphite results in lowered charge consumption in the poten-
tial range of SEI formation (except for some samples reduced
by LiAlH4) and altered Li-ion intercalation/deintercalation
kinetics.
Note: Electrochemical reduction method was selected for
the electrochemically grafted graphite, because we have
shown that when the grafted group is aryl then electrochem-
ical method is more feasible for reducing the end functional
group of the grafted layer [29]. But for the chemically grafted

0.6 0.7 0.8 0.9 1.0-10
-8
-6
-4
-2
0
Potential vs. Li+/Li (V)
Spec
ific
curre
nt (m
A/g)
pristine electrochemical electrochemically
reduced-150
-100
-50
0
50
100
150
Spec
ific
curre
nt (m
A/g)
Potential vs. Li+/Li (V)
pristine electrochemical electrochemically reduced
-10
-8
-6
-4
-2
0
Potential vs. Li+/Li (V)
Spec
ific
curre
nt (m
A/g)
pristinein situ non-aqin situ non-aq LiAlH4in situ non-aq BuLi
0.0 0.1 0.2 0.3 0.4 0.5-150
-100
-50
0
50
100
150
Spec
ific
curre
nt (m
A/g)
pristinein situ non-aqin situ non-aq LiAlH4in situ non-aq BuLi
Potential vs. Li+/Li (V)
-10
-5
0
5
Spec
ific
curre
nt (m
A/g)
Potential vs. Li+/Li (V)
pristinein situ aq in situ aq LiAlH4in situ aq BuLi
-150
-100
-50
0
50
100
150
Spec
ific
curre
nt (m
A/g)
Potential vs. Li+/Li (V)
pristinein situ aq in situ aq LiAlH4in situ aq BuLi
-10
-5
0
5
Spec
ific
curre
nt (m
A/g)
Potential vs. Li+/Li (V)
pristine spontaneous spontaneous LiAlH4 spontaneous BuLi
0.0 0.1 0.2 0.3 0.4 0.5
0.6 0.7 0.8 0.9 1.0
0.6 0.7 0.8 0.9 1.0 0.0 0.1 0.2 0.3 0.4 0.5
0.6 0.7 0.8 0.9 1.0 0.0 0.1 0.2 0.3 0.4 0.5-150
-100
-50
0
50
100
150
Potential vs. Li+/Li (V)
Spec
ific
curre
nt (m
A/g)
pristine spontaneous spontaneous LiAlH4 spontaneous BuLi
a b
dc
e f
hg
Fig. 9 – CVs of modified SFG6 graphites. (Left column) SEI formation potential region; (right column) Li-ion intercalation/
deintercalation potential region. (a and b) Electrochemically grafted; (c and d) in situ non-aqueous grafted; (e and f) in situ
aqueous grafted; and (g and h) spontaneously grafted.
C A R B O N 5 0 ( 2 0 1 2 ) 2 5 9 9 – 2 6 1 4 2609
samples chemical method of reduction was chosen instead,
because chemically grafted powder samples would be more
homogenously reduced by chemical reagents in a pot treat-
ment. In addition, electrochemical reduction of the chemi-
cally grafted samples in acetonitrile electrolyte might result
in contamination and side reactions, which could alter the
chemical nature of the grafted layer. But to compare chemical
reduction with electrochemical reduction of chemically
2610 C A R B O N 5 0 ( 2 0 1 2 ) 2 5 9 9 – 2 6 1 4
grafted graphite; we performed electrochemical reduction of
the in situ non-aqueous grafted sample in carbonate electro-
lyte (1 M LiPF6 in EC:DMC 1:1). Electrode of the grafted sample
was reduced until 1 V vs. Li+/Li (before beginning of SEI forma-
tion) in 1 M LiPF6 in EC:DMC 1:1. It was then relaxed at zero
current for 2 h. Then the electrode was charged (lithiated) gal-
vanostatically at C/10 rate (results not shown here). Following
which normal cycling at C/10 rate continued. It was seen that
first lithiation of the grafted sample is a sum of electrochem-
ical reduction (until 1 V vs. Li+/Li), relaxation (2 h), and contin-
ued lithiation at C/10. This implies that electrochemical
reduction of grafted sample until 1 V already occurs during
first charge (lithiation) of the grafted electrode, while cycling
at C/10 rate. This step does not offer any advantages with re-
spect to SEI formation, specific charge retrieved, or cyclability
(within experimental range of error). Hence, for the other
chemically grafted samples, chemical method of end func-
tional group reduction was selected.
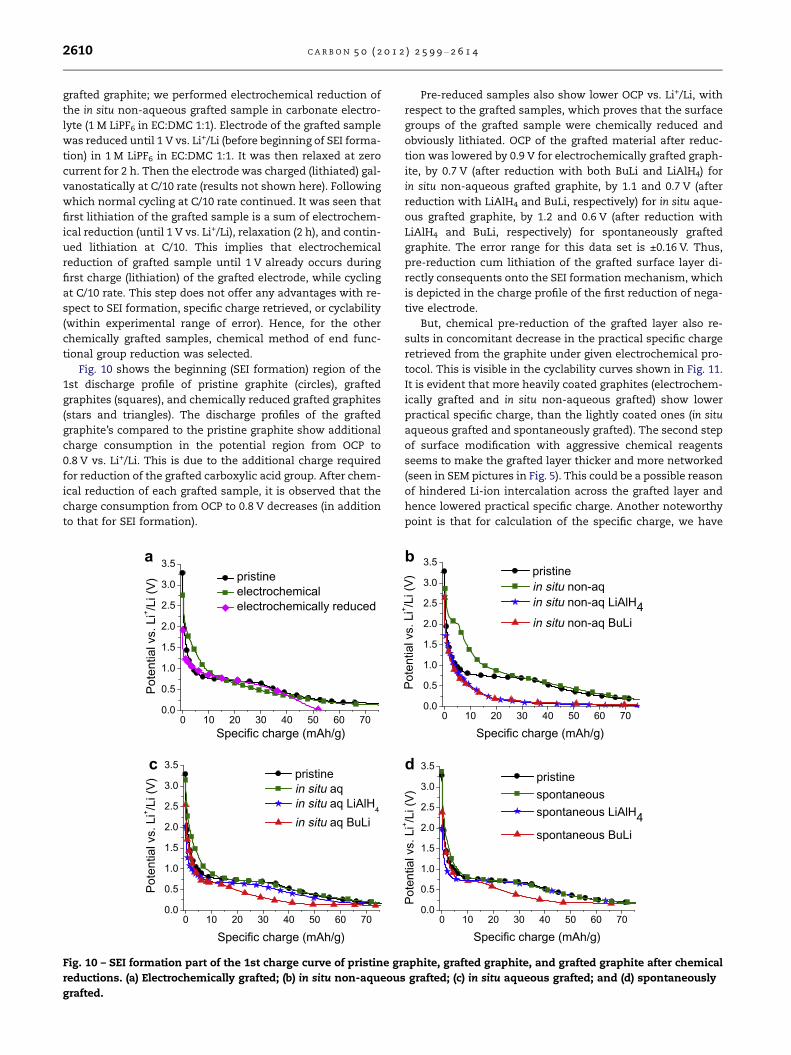
Fig. 10 shows the beginning (SEI formation) region of the
1st discharge profile of pristine graphite (circles), grafted
graphites (squares), and chemically reduced grafted graphites
(stars and triangles). The discharge profiles of the grafted
graphite’s compared to the pristine graphite show additional
charge consumption in the potential region from OCP to
0.8 V vs. Li+/Li. This is due to the additional charge required
for reduction of the grafted carboxylic acid group. After chem-
ical reduction of each grafted sample, it is observed that the
charge consumption from OCP to 0.8 V decreases (in addition
to that for SEI formation).
0 10 20 30 40 50 60 700.0
0.5
1.0
1.5
2.0
2.5
3.0
3.5
Specific charge (mAh/g)
Pote
ntia
l vs.
Li+ /L
i (V)
pristine electrochemical electrochemically reduced
0 10 20 30 40 50 60 700.0
0.5
1.0
1.5
2.0
2.5
3.0
3.5
Pote
ntia
l vs.
Li+ /L
i (V)
Specific charge (mAh/g)
pristinein situ aqin situ aq LiAlH4
in situ aq BuLi
a
c
Fig. 10 – SEI formation part of the 1st charge curve of pristine gr
reductions. (a) Electrochemically grafted; (b) in situ non-aqueous
grafted.
Pre-reduced samples also show lower OCP vs. Li+/Li, with
respect to the grafted samples, which proves that the surface
groups of the grafted sample were chemically reduced and
obviously lithiated. OCP of the grafted material after reduc-
tion was lowered by 0.9 V for electrochemically grafted graph-
ite, by 0.7 V (after reduction with both BuLi and LiAlH4) for
in situ non-aqueous grafted graphite, by 1.1 and 0.7 V (after
reduction with LiAlH4 and BuLi, respectively) for in situ aque-
ous grafted graphite, by 1.2 and 0.6 V (after reduction with
LiAlH4 and BuLi, respectively) for spontaneously grafted
graphite. The error range for this data set is ±0.16 V. Thus,
pre-reduction cum lithiation of the grafted surface layer di-
rectly consequents onto the SEI formation mechanism, which
is depicted in the charge profile of the first reduction of nega-
tive electrode.
But, chemical pre-reduction of the grafted layer also re-
sults in concomitant decrease in the practical specific charge
retrieved from the graphite under given electrochemical pro-
tocol. This is visible in the cyclability curves shown in Fig. 11.
It is evident that more heavily coated graphites (electrochem-
ically grafted and in situ non-aqueous grafted) show lower
practical specific charge, than the lightly coated ones (in situ
aqueous grafted and spontaneously grafted). The second step
of surface modification with aggressive chemical reagents
seems to make the grafted layer thicker and more networked
(seen in SEM pictures in Fig. 5). This could be a possible reason
of hindered Li-ion intercalation across the grafted layer and
hence lowered practical specific charge. Another noteworthy
point is that for calculation of the specific charge, we have
0 10 20 30 40 50 60 700.0
0.5
1.0
1.5
2.0
2.5
3.0
3.5
Pote
ntia
l vs.
Li+ /L
i (V)
Specific charge (mAh/g)
pristinein situ non-aqin situ non-aq LiAlH4in situ non-aq BuLi
0 10 20 30 40 50 60 700.0
0.5
1.0
1.5
2.0
2.5
3.0
3.5
Pote
ntia
l vs.
Li+ /L
i (V)
Specific charge (mAh/g)
pristine spontaneous spontaneous LiAlH4 spontaneous BuLi
b
d
aphite, grafted graphite, and grafted graphite after chemical
grafted; (c) in situ aqueous grafted; and (d) spontaneously
0 10 20 30 40 500
100
200
300
400
Spec
ific
char
ge (m
Ah/g
)
Cycle number
pristine in situ non-aq in situ non-aq LiAlH4
in situ non-aq BuLiin situ aqin situ aq LiAlH4
in situ aq BuLi spontaneous spontaneous BuLi spontaneous LiAlH4
electrochemical electrochemical
electrochemically reduced
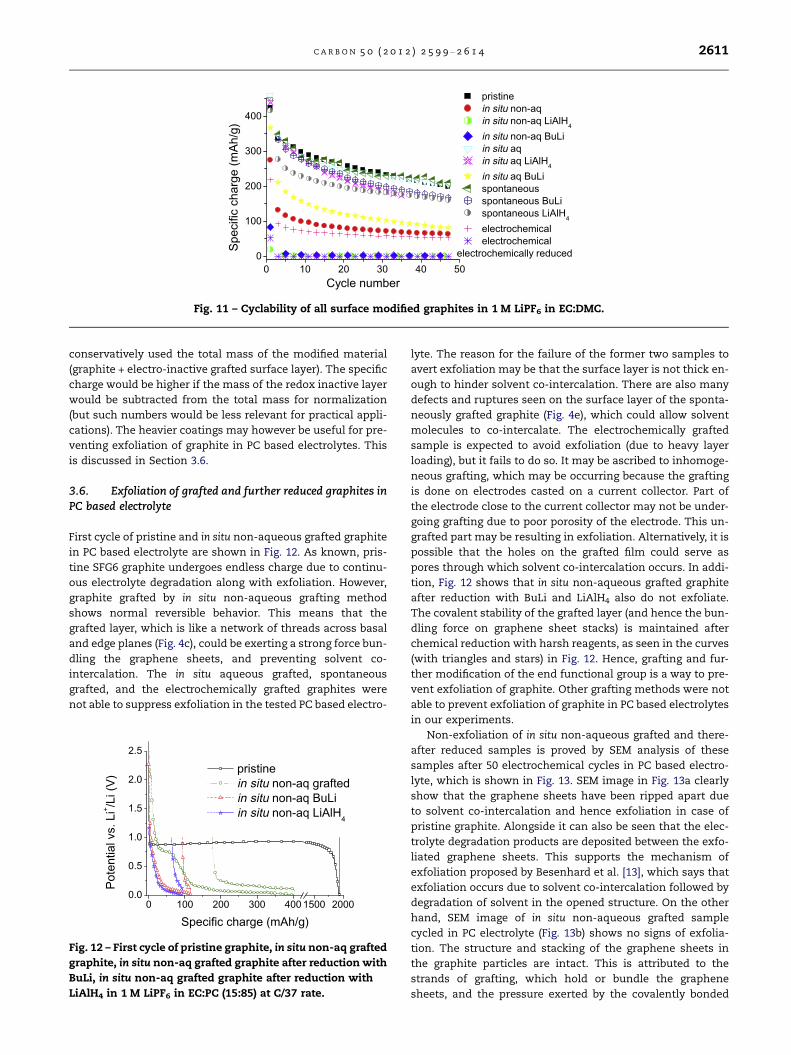
Fig. 11 – Cyclability of all surface modified graphites in 1 M LiPF6 in EC:DMC.
C A R B O N 5 0 ( 2 0 1 2 ) 2 5 9 9 – 2 6 1 4 2611
conservatively used the total mass of the modified material
(graphite + electro-inactive grafted surface layer). The specific
charge would be higher if the mass of the redox inactive layer
would be subtracted from the total mass for normalization
(but such numbers would be less relevant for practical appli-
cations). The heavier coatings may however be useful for pre-
venting exfoliation of graphite in PC based electrolytes. This
is discussed in Section 3.6.
3.6. Exfoliation of grafted and further reduced graphites inPC based electrolyte
First cycle of pristine and in situ non-aqueous grafted graphite
in PC based electrolyte are shown in Fig. 12. As known, pris-
tine SFG6 graphite undergoes endless charge due to continu-
ous electrolyte degradation along with exfoliation. However,
graphite grafted by in situ non-aqueous grafting method
shows normal reversible behavior. This means that the
grafted layer, which is like a network of threads across basal
and edge planes (Fig. 4c), could be exerting a strong force bun-
dling the graphene sheets, and preventing solvent co-
intercalation. The in situ aqueous grafted, spontaneous
grafted, and the electrochemically grafted graphites were
not able to suppress exfoliation in the tested PC based electro-
0 100 200 300 400 1500 20000.0
0.5
1.0
1.5
2.0
2.5
pristinein situ non-aq graftedin situ non-aq BuLiin situ non-aq LiAlH4
Pote
ntia
l vs.
Li+ /L
i (V)
Specific charge (mAh/g)
Fig. 12 – First cycle of pristine graphite, in situ non-aq grafted
graphite, in situ non-aq grafted graphite after reduction with
BuLi, in situ non-aq grafted graphite after reduction with
LiAlH4 in 1 M LiPF6 in EC:PC (15:85) at C/37 rate.
lyte. The reason for the failure of the former two samples to
avert exfoliation may be that the surface layer is not thick en-
ough to hinder solvent co-intercalation. There are also many
defects and ruptures seen on the surface layer of the sponta-
neously grafted graphite (Fig. 4e), which could allow solvent
molecules to co-intercalate. The electrochemically grafted
sample is expected to avoid exfoliation (due to heavy layer
loading), but it fails to do so. It may be ascribed to inhomoge-
neous grafting, which may be occurring because the grafting
is done on electrodes casted on a current collector. Part of
the electrode close to the current collector may not be under-
going grafting due to poor porosity of the electrode. This un-
grafted part may be resulting in exfoliation. Alternatively, it is
possible that the holes on the grafted film could serve as
pores through which solvent co-intercalation occurs. In addi-
tion, Fig. 12 shows that in situ non-aqueous grafted graphite
after reduction with BuLi and LiAlH4 also do not exfoliate.
The covalent stability of the grafted layer (and hence the bun-
dling force on graphene sheet stacks) is maintained after
chemical reduction with harsh reagents, as seen in the curves
(with triangles and stars) in Fig. 12. Hence, grafting and fur-
ther modification of the end functional group is a way to pre-
vent exfoliation of graphite. Other grafting methods were not
able to prevent exfoliation of graphite in PC based electrolytes
in our experiments.
Non-exfoliation of in situ non-aqueous grafted and there-
after reduced samples is proved by SEM analysis of these
samples after 50 electrochemical cycles in PC based electro-
lyte, which is shown in Fig. 13. SEM image in Fig. 13a clearly
show that the graphene sheets have been ripped apart due
to solvent co-intercalation and hence exfoliation in case of
pristine graphite. Alongside it can also be seen that the elec-
trolyte degradation products are deposited between the exfo-
liated graphene sheets. This supports the mechanism of
exfoliation proposed by Besenhard et al. [13], which says that
exfoliation occurs due to solvent co-intercalation followed by
degradation of solvent in the opened structure. On the other
hand, SEM image of in situ non-aqueous grafted sample
cycled in PC electrolyte (Fig. 13b) shows no signs of exfolia-
tion. The structure and stacking of the graphene sheets in
the graphite particles are intact. This is attributed to the
strands of grafting, which hold or bundle the graphene
sheets, and the pressure exerted by the covalently bonded

Fig. 13 – SEM images of graphite electrodes after 50 electrochemical cycles in 1 M LiPF6 in EC:PC (15:85) at C/37 rate. (a)
Pristine; (b) in situ non-aqueous grafted; (c) in situ non-aqueous grafted after reduction with BuLi; and (d) in situ non-aqueous
grafted after reduction with LiAlH4.
2612 C A R B O N 5 0 ( 2 0 1 2 ) 2 5 9 9 – 2 6 1 4
surface layer limits solvent co-intercalation. This is visually
clear from Fig. 13b, where the grafting strand stretches from
the basal plane across the prismatic plane. Thus, post mor-
tem SEM images verify the results and hypothesis reported
before in this section. Similarly images of in situ non-aqueous
grafted samples after chemical reduction and thereafter cy-
cling in PC electrolyte also do not show any signs of exfolia-
tion. This is clear from images in Fig. 13c and d. Non-
exfoliation of these samples has also been confirmed by Ra-
man spectroscopy (spectra not shown). Cycled pristine sam-
ple shows larger D band compared to G band, whereas it is
the reverse case for in situ non-aqueous grafted sample and
its successor samples.
4. Conclusions
We have established grafting of graphite powders for control-
ling its electrochemical properties for applications in lithium-
ion batteries. The loading of the grafted layer (on GC) was
found to follow the order electrochemically grafted > in situ
non-aqueous grafted > in situ aqueous grafted > spontaneous
grafted. The samples grafted by different methods also result
in different morphology. These differences are attributed to
different mechanisms of diazonium reduction occurring dur-
ing these processes. The extent of loading was found to con-
sequent in SEI formation/electrolyte degradation, first Li-ion
intercalation/deintercalation kinetics, and reversible specific
charge. Very thick layers may result in particle isolation and
the specific charge retrieved is lowered, while thin layers al-
low good cyclability along with tuned SEI formation and Li-
ion intercalation. Surface morphology of the grafted samples
is retained after fifty electrochemical cycles, which proves
that the grafted layer is indeed covalently bonded. In addition,
SEI may adopt the morphology of the grafted layer.
Chemical reduction with lithiated reagents of grafted
graphite was performed as the second step of functional
group modification. This step modified the reactivity of the
grafted material towards non-aqueous carbonate based elec-
trolytes. This was clearly depicted in the electrochemistry of
SEI formation and Li-ion intercalation. From the SEM images
it was inferred that the surface layer on the grafted material
retains its surface morphology after reduction step as well
as after cycling. The second step of modifying the grafted
samples resulted in thickening of the layers, which intern
lead to decreased practical specific charge. Thus, for im-
proved performance while retaining good specific charge
and cyclability, surface modification with minimum consecu-
tive steps should be selected.
Exfoliation of graphite in PC based electrolyte could be pre-
vented if the morphology of the grafted material is so that it
binds, wraps, or brackets the graphene sheets together (to
prevent solvent co-intercalation), as was the case for in situ
non-aqueous grafted material. It was also found that exfolia-
tion prevention property of the grafted layer is retained after
the functional group transformation step.
In a nut shell, we have shown that grafted layer loading
and surface morphology can be tuned by various grafting
techniques, which results in tuned SEI formation, Li-ion inter-
calation, and exfoliation prevention of graphite. The second
step of functionality transformation of grafted graphite tunes
the reactivity of the grafted layer towards the electrolyte
while retaining control over surface morphology, SEI forma-
tion, and exfoliation prevention.
Acknowledgments
We thank Swiss National Science Foundation for the funding.
We thank Mr. Hermann Kaiser for developing the grafting

C A R B O N 5 0 ( 2 0 1 2 ) 2 5 9 9 – 2 6 1 4 2613
cells and the transfer chamber for SEM. We thank Dr. Annette
Foelske-Schmitz for XPS training.
R E F E R E N C E S
[1] Endo M, Kim C, Nishimura K, Fujino T, Miyashita K. Recentdevelopment of carbon materials for Li ion batteries. Carbon2000;38(2):183–97.
[2] Tarascon JM, Guyomard D. The Li1+xMn2O4/c rocking-chairsystem – a review. Electrochim Acta 1993;38(9):1221–31.
[3] Spahr ME, Wilhelm H, Palladino T, Dupont-Pavlovsky N,Goers D, Joho F, et al. The role of graphite surface groupchemistry on graphite exfoliation during electrochemicallithium insertion. J Power Sources 2003;119(1):543–9.
[4] Zheng T, Gozdz AS, Amatucci GG. Reactivity of the solidelectrolyte interface on carbon electrodes at elevatedtemperatures. J Electrochem Soc 1999;146(11):4014–8.
[5] Peled E. The electrochemical-behavior of alkali and alkaline-earth metals in non-aqueous battery systems – the solidelectrolyte interphase model. J Electrochem Soc1979;126(12):2047–51.
[6] Aurbach D, Markovsky B, Shechter A, Ein-Eli Y, Cohen H. Acomparative study of synthetic graphite and Li electrodes inelectrolyte solutions based on ethylene carbonate dimethylcarbonate mixtures. J Electrochem Soc 1996;143(12):3809–20.
[7] Peled E, Bar Tow D, Merson A, Gladkich A, Burstein L,Golodnitsky D. Composition, depth profiles and lateraldistribution of materials in the SEI built on HOPG-TOF SIMSand XPS studies. J Power Sources 2001;97–98(1):52–7.
[8] Peled E, Golodnitsky D, Menachem C, Bar-Tow D. Anadvanced tool for the selection of electrolyte components forrechargeable lithium batteries. J Electrochem Soc1998;145(10):3482–6.
[9] Edstrom K, Herstedt M, Abraham DP. A new look at the solidelectrolyte interphase on graphite anodes in Li-ion batteries. JPower Sources 2006;153(2):380–4.
[10] Ely YE, Aurbach D. Identification of surface-films formed onactive metals and nonactive metal-electrodes at lowpotentials in methyl formate solutions. Langmuir1992;8(7):1845–50.
[11] Jeong SK, Inaba M, Mogi R, Iriyama Y, Abe T, Ogumi Z. Surfacefilm formation on a graphite negative electrode in lithium-ion batteries: atomic force microscopy study on the effects offilm-forming additives in propylene carbonate solutions.Langmuir 2001;17(26):8281–6.
[12] Verma P, Maire P, Novak P. A review of the features andanalyses of the solid electrolyte interphase in Li-ionbatteries. Electrochim Acta 2010;55(22):6332–41.
[13] Besenhard JO, Winter M, Yang J, Biberacher W. Filmingmechanism of lithium–carbon anodes in organic andinorganic electrolytes. J Power Sources 1995;54(2):228–31.
[14] Zheng HH, Liu G, Battaglia V. Film-forming properties ofpropylene carbonate in the presence of a quaternaryammonium ionic liquid on natural graphite anode. J PhysChem C 2010;114(13):6182–9.
[15] Walkowiak M. Siloxane-impregnated graphite anode for Li-ion cells with PC-based electrolytes. Int J Electrochem Sci2011;6(3):684–90.
[16] Komaba S, Ozeki T, Okushi K. Functional interface of polymermodified graphite anode. J Power Sources2009;189(1):197–203.
[17] Peled E, Golodnitsky D, Ulus A, Yufit V. Effect of carbonsubstrate on SEI composition and morphology. ElectrochimActa 2004;50(2–3):391–5.
[18] Spahr ME, Buqa H, Wursig A, Goers D, Hardwick L, Novak P,et al. Surface reactivity of graphite materials and theirsurface passivation during the first electrochemical lithiuminsertion. J Power Sources 2006;153(2):300–11.
[19] Winter M, Novak P, Monnier A. Graphites for lithium-ioncells: the correlation of the first-cycle charge loss with theBrunauer–Emmett–Teller surface area. J Electrochem Soc1998;145(2):428–36.
[20] Ng SH, Vix-Guterl C, Bernardo P, Tran N, Ufheil J, Buqa H,et al. Correlations between surface properties of graphiteand the first cycle specific charge loss in lithium-ionbatteries. Carbon 2009;47(3):705–12.
[21] Novak P, Ufheil J, Buqa H, Krumeich F, Spahr ME, Goers D,et al. The importance of the active surface area of graphitematerials in the first lithium intercalation. J Power Sources2007;174(2):1082–5.
[22] Scott MG, Whitehead AH, Owen JR. Chemical formation of asolid electrolyte interface on the carbon electrode of a Li-ioncell. J Electrochem Soc 1998;145(5):1506–10.
[23] Ein-Eli Y, Koch VR. Chemical oxidation: a route to enhancedcapacity in Li-ion graphite anodes. J Electrochem Soc1997;144(9):2968–73.
[24] Liu Z, Yu A, Lee JY. Modifications of synthetic graphite forsecondary lithium-ion battery applications. J Power Sources1999;81–82(1):187–91.
[25] Zheng T, Liu YH, Fuller EW, Tseng S, Vonsacken U, Dahn JR.Lithium insertion in high-capacity carbonaceousmaterilithium insertion in high-capacity carbonaceousmaterials. J Electrochem Soc 1995;142(8):2581–90.
[26] Menkin S, Golodnitsky D, Peled E. Artificial solid-electrolyteinterphase (SEI) for improved cycleability and safety oflithium-ion cells for EV applications. Electrochem Commun2009;11(9):1789–91.
[27] Pinson J, Podvorica F. Attachment of organic layers toconductive or semiconductive surfaces by reduction ofdiazonium salts. Chem Soc Rev 2005;34(5):429–39.
[28] Downard AJ. Electrochemically assisted covalentmodification of carbon electrodes. Electroanalysis2000;12(14):1085–96.
[29] Verma P, Maire P, Novak P. Concatenation of electrochemicalgrafting with chemical or electrochemical modification forpreparing electrodes with specific surface functionality.Electrochim Acta 2011;56(10):3555–61.
[30] Pan Q, Wang H, Jiang Y. Natural graphite modified withnitrophenyl multilayers as anode materials for lithium ionbatteries. J Mater Chem 2007;17(4):329–34.
[31] Pan Q, Wang H, Jiang Y. Covalent modification of naturalgraphite with lithium benzoate multilayers via diazoniumchemistry and their application in lithium ion batteries.Electrochem Commun 2007;9(4):754–60.
[32] Yang SN, Pan QM, Liu J. Improving the cycleability of Sianodes by covalently grafting with 4-carboxyphenyl groups.Electrochem Commun 2010;12(3):479–82.
[33] Martin C, Alias M, Christien F, Crosnier O, Belanger D, BrousseT. Graphite-grafted silicon nanocomposite as a negativeelectrode for lithium-ion batteries. Adv Mater2009;21(46):4735–41.
[34] Doyle MP, Bryker WJ. Alkyl nitrite–metal halide deaminationreactions. 6. Direct synthesis of arenediazoniumtetrafluoroborate salts from aromatic-amines, tert-butylnitrite, and boron-trifluoride etherate in anhydrous media. JOrg Chem 1979;44(9):1572–4.
[35] Moreno-Castilla C, Lopez-Ramon MV, Carrasco-Marın F.Changes in surface chemistry of activated carbons by wetoxidation. Carbon 2000;38(14):1995–2001.
[36] Combellas C, Kanoufi F, Pinson J, Podvorica FI. Time-of-flightsecondary ion mass spectroscopy characterization of the

2614 C A R B O N 5 0 ( 2 0 1 2 ) 2 5 9 9 – 2 6 1 4
covalent bonding between a carbon surface and aryl groups.Langmuir 2005;21(1):280–6.
[37] Saby C, Ortiz B, Champagne GY, Belanger D. Electrochemicalmodification of glassy carbon electrode using aromaticdiazonium salts. 1. Blocking effect of 4-nitrophenyl and 4-carboxyphenyl groups. Langmuir 1997;13(25):6805–13.
[38] Bryngelsson H, Stjerndahl M, Gustafsson T, Edstrom K. Howdynamic is the SEI? J Power Sources 2007;174(2):970–5.
[39] Dahn JR. Phase-diagram of LixC6. Phys Rev B1991;44(17):9170–7.
[40] Winter M, Besenhard JO, Spahr ME, Novak P. Insertionelectrode materials for rechargeable lithium batteries. AdvMater 1998;10(10):725–63.
[41] Novak P, Joho F, Lanz M, Rykart B, Panitz J-C, Alliata D, et al.The complex electrochemistry of graphite electrodes inlithium-ion batteries. J Power Sources 2001;97:9839–46.