formation and transport of oxidized reactive nitrogen, ozone, and … · 2020-02-28 ·...
TRANSCRIPT
UC IrvineUC Irvine Previously Published Works
TitleFormation and transport of oxidized reactive nitrogen, ozone, and secondary organic aerosol in Tokyo
Permalinkhttps://escholarship.org/uc/item/5h53g8z1
JournalJournal of Geophysical Research, 113(D21)
ISSN0148-0227
AuthorsKondo, YMorino, YFukuda, Met al.
Publication Date2008-11-13
DOI10.1029/2008jd010134
Licensehttps://creativecommons.org/licenses/by/4.0/ 4.0 Peer reviewed
eScholarship.org Powered by the California Digital LibraryUniversity of California
Formation and transport of oxidized reactive nitrogen, ozone,
and secondary organic aerosol in Tokyo
Y. Kondo,1 Y. Morino,2 M. Fukuda,1 Y. Kanaya,3 Y. Miyazaki,1,4 N. Takegawa,1
H. Tanimoto,2 R. McKenzie,5 P. Johnston,5 D. R. Blake,6 T. Murayama,7 and M. Koike8
Received 16 March 2008; revised 30 July 2008; accepted 7 August 2008; published 13 November 2008.
[1] Measurements of the major reactive nitrogen species (NOy)i (NOx, peroxyacylnitrates, HNO3, and particulate nitrate (NO3
�)), total reactive nitrogen (NOy), volatileorganic compounds, OH and HO2, and organic aerosol were made near the urban center ofTokyo in different seasons of 2003–2004 to study the processes involving oxidized formsof reactive nitrogen and O3. Generally, NOx constituted the dominant fraction of NOy
throughout the seasons. The NOx/NOy and HNO3/NOy ratios were lowest and highest,respectively, in summer, owing to the seasonally high OH concentration. The fraction ofNOy that remained in the atmosphere after emission (RNOy) decreased with the decrease inthe NOx/NOy ratio in summer and fall. It is likely that the median seasonal-diurnalvariations of Ox = O3 + NO2 were controlled by those of the background O3 levels,photochemical O3 formation, and vertical transport. Ox showed large increases duringmidday under stagnant conditions in mid-August 2004. Their in situ production ratescalculated by a box model were too slow to explain the observed increases. The high Ox
was likely due to the accumulation of Ox from previous days in the upper part of theboundary layer (BL) followed by transport down to near the surface by mixing aftersunrise. Considering the tight correlation between Ox and secondary organic aerosol(SOA), it is likely that SOA also accumulated during the course of sea-land breezecirculation in the BL.
Citation: Kondo, Y., et al. (2008), Formation and transport of oxidized reactive nitrogen, ozone, and secondary organic aerosol in
Tokyo, J. Geophys. Res., 113, D21310, doi:10.1029/2008JD010134.
1. Introduction
[2] Large amounts of reactive gases, in particular NOx
and volatile organic carbons (VOCs), are emitted fromurban areas. Megacities, including the Tokyo MetropolitanArea (TMA) are very large concentrated sources of thesespecies, affecting local, regional, and global O3 and aerosollevels [Guttikunda et al., 2005; Ramanathan et al., 2007].In urban areas, O3 is mainly produced by reactions betweenNO and peroxy radicals generated from oxidation of carbon
monoxide (CO) and VOCs initiated by reaction with OH[e.g., Thornton et al., 2002; Kleinman et al., 2005]. Theoxidation of NOx can lead to the formation of nitric acid(HNO3), nitrate aerosol (NO3
�), and peroxyacyl nitrates(PANs). Oxidation of VOCs also leads to the formation ofsecondary organic aerosol (SOA) [e.g., de Gouw et al.,2005; Sullivan et al., 2006; Takegawa et al., 2006b],although the chemical species contributing to the O3 andSOA formation are different [e.g., Odum et al., 1997;Hoffmann et al., 1997; Griffin et al., 1999]. SOA generallyconstitutes the major fraction of fine-mode aerosol massconcentration. Reactive nitrogen, O3, and SOA play impor-tant roles in the atmospheric environment, including aciddeposition, effects on human health, visibility, and climate.In order to assess the impacts of NOx and VOCs emittedfrom local sources on surrounding areas, we need tounderstand quantitatively the key processes involved intheir oxidation and the fate of the oxidized species nearthe source regions.[3] The abundance of NOx is controlled by its emission,
oxidation, and transport. During daytime, NOx is oxidizedto HNO3 via oxidation of nitrogen dioxide (NO2) by thehydroxyl radical (OH):
NO2 þ OHþM ! HNO3 þM;ðR1Þ
JOURNAL OF GEOPHYSICAL RESEARCH, VOL. 113, D21310, doi:10.1029/2008JD010134, 2008
1Research Center for Advanced Science and Technology, University ofTokyo, Tokyo, Japan.
2Asian Environment ResearchGroup, National Institute for EnvironmentalStudies, Ibaraki, Japan.
3Frontier Research Center for Global Change, Japan Agency forMarine-Earth Science and Technology, Kanagawa, Japan.
4Now at Institute of Low Temperature Science, Hokkaido University,Sapporo, Japan.
5National Institute of Water and Atmospheric Research, Lauder, NewZealand.
6Department of Chemistry, University of California, Irvine, California,USA.
7Faculty of Marine Technology, Tokyo University of Marine Scienceand Technology, Tokyo, Japan.
8Department of Earth and Planetary Science, Graduate School ofScience, University of Tokyo, Tokyo, Japan.
Copyright 2008 by the American Geophysical Union.0148-0227/08/2008JD010134
D21310 1 of 23
where M represents a third body (usually N2 or O2). Duringthe nighttime, HNO3 is formed via oxidation of NO2
followed by hydrolysis of N2O5 in aqueous-phase H2O(H2O (aq)) [e.g., Tie et al., 2003; Takegawa et al., 2004]:
N2O5 þ H2OðaqÞ ! 2HNO3:ðR2Þ
HNO3 reacts with gas-phase NH3 to form ammonium nitrate(NH4NO3) aerosol:
HNO3ðgÞ þ NH3ðgÞ Ð NO�3 ðaerosolÞ þ NHþ
4 ðaerosolÞ:ðR3Þ
[4] HNO3 and NO3� are lost through wet and dry depo-
sition. The deposition velocity of NO3� is an order of
magnitude smaller than that of HNO3 [e.g., Morino et al.,2006, and references therein].[5] NO2 is also oxidized by peroxyacyl radicals
(RC(O)O2) to form PANs (RC(O)O2NO2 = peroxyacetylnitrate (PAN) + peroxypropionyl nitrate (PPN) + peroxy-n-butyryl nitrate (PnBN) + peroxy-i-butyryl nitrate (PiBN) +peroxyacrylic nitric anhydride (APAN) + peroxymethacry-loyl nitrate (MPAN)) [e.g., Tanimoto et al., 1999; Tanimotoand Akimoto, 2001; Roberts et al., 2001]:
RCðOÞO2 þ NO2 Ð RCðOÞO2NO2:ðR4Þ
RC(O)O2 is produced by oxidation of VOCs by OH. Acylradicals formed from aldehydes and alcohols quickly addoxygen to form peroxyacyl radicals. PANs are thermallyunstable and decompose back to NO2 quickly at hightemperatures. In addition, alkyl nitrates (RONO2) have beenobserved to constitute a significant portion of oxidizedreactive nitrogen [Day et al., 2003].[6] Chemical processes of reactive nitrogen inside meg-
acities control fluxes of NOx and oxidized reactive nitrogento surrounding regions. A number of studies have beenmade to understand oxidation processes of NOx and theresulting partitioning of total reactive nitrogen, NOy (=NO +NO2 + PANs + HNO3 + HONO + HO2NO2 + NO3 + N2O5
+ organic nitrate + NO3�), in urban and suburban air through
field observations at various locations, mainly over the U.S.and Europe [e.g., Fahey et al., 1986; Singh et al., 1986;Parrish et al., 1993, 1998, 2002; O’Brien et al., 1997;Ridley et al., 1998; Neuman et al., 2002; Day et al., 2003].These observations identified NOx, HNO3, and PANs to bedominant components of NOy, although their fractionsshowed large temporal and spatial variations. However,quantitative understanding of the reactions involving thesespecies is still limited partly because of the difficulty indeploying a suite of instruments for accurate and time-resolved measurements of relevant parameters throughoutthe seasons. On the other hand, the rate-limiting reactionsfor O3 formation are
HO2 þ NO ! OHþ NO2;ðR5Þ
RO2 þ NO ! ROþ NO2:ðR6Þ
[7] The processes of oxidation of NOx andVOCs via OH areclosely coupled with the O3 formation processes via formation
of HO2 and RO2, as can be seen from reactions (R1)–(R6)[e.g., Kanaya et al., 2007, 2008]. Therefore, it is useful toelucidate the relationships of the reactive nitrogen, HOx (OHand HO2) radicals, and O3 for an improved understanding ofO3 formation, especially near urban areas, where reactionsleading to its formation are active. In addition, SOA havebeen observed to correlate well with O3 in summertime inthe TMA [Takegawa et al., 2006a; Miyakawa et al., 2008].O3, together with OH and NO3, oxidize VOCs, initiating anumber of chemical and physical processes leading to SOAformation [e.g., Kalberer et al., 2000]. Therefore, SOA-O3
correlations should also be useful in understanding thechemistry of these species.[8] In addition to the chemical processes, the levels of
reactive nitrogen and O3 are subject to transport processes.In the TMA, it has been suggested that accumulation offormed O3 in the boundary layer (BL) plays an importantrole in elevating surface O3 levels under stagnant conditionsin summer [Wakamatsu et al., 1983, 1996, 1999]. However,these studies are limited to O3 variations. Simultaneousmeasurements of oxidized reactive nitrogen and SOA willgive us further insights on transport processes of theoxidized species in this area.[9] Intensive measurements of reactive nitrogen, together
with other precursors of O3 and PM1 aerosol (aerosol withdiameters smaller than 1 mm) chemical composition weremade for the first time in Tokyo, Japan, in 2003–2004, as apart of the series of the Integrated Measurement Program forAerosol and Oxidant Chemistry in Tokyo (IMPACT) cam-paigns, which were conducted within the framework of theInternational Global Atmospheric Chemistry Project(IGAC), Mega-Cities: Asia. Using these data, we investi-gate the seasonal and diurnal variations of reactive nitrogenspecies, especially in relation to HOx radicals and O3 nearthe urban center of Tokyo. The relationship between O3 andSOA in summer is also discussed.
2. Observations
2.1. Location and NOx Sources
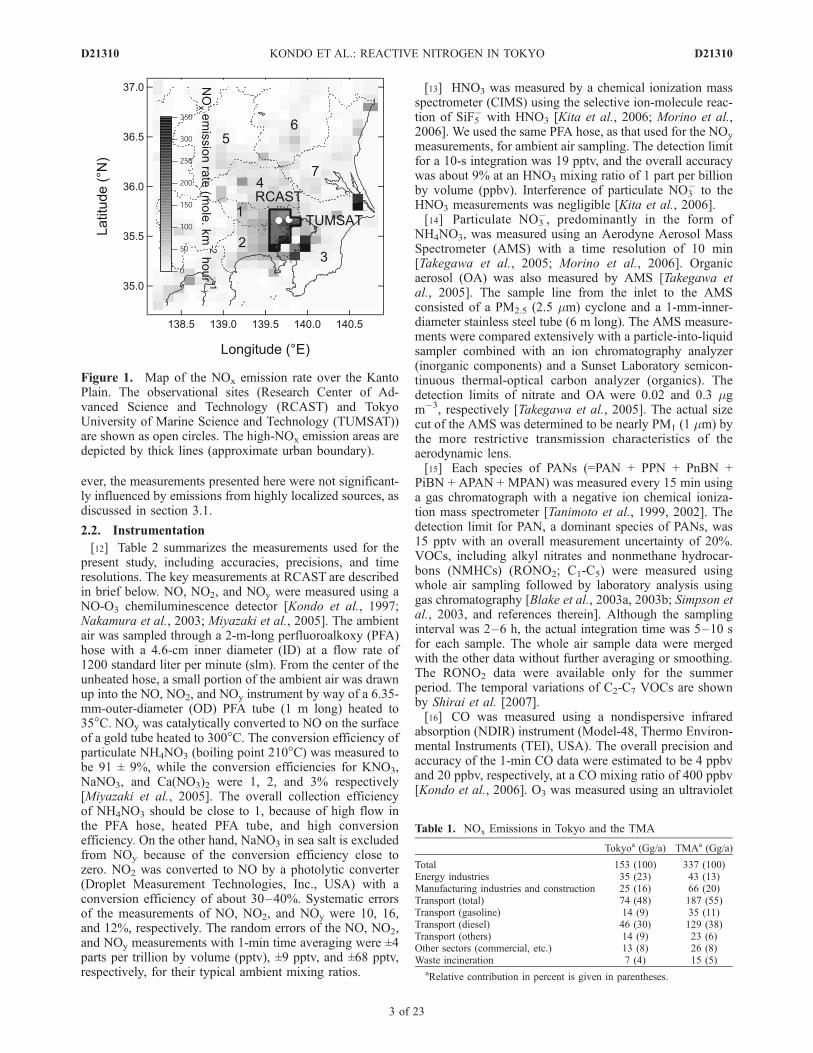
[10] NOy, individual NOy compounds, and PM1 aerosolwere measured near the urban center of Tokyo during theperiods of 24 July to 13 August and 1–15 October in 2003and 20 January to 6 February, 16 June to 7 July, and 26 Julyto 14 August in 2004. Air samplings were made about 20 mabove ground level from a building on the Research Centerof Advanced Science and Technology (RCAST) campus ofthe University of Tokyo (Komaba; 35.66�N, 139.66�E) inJapan. RCAST is located 57 m above sea level and about2 km from major roads or highways, near the southeasternedge of the Kanto Plain, about 20 km from Tokyo Bay[Kondo et al., 2006; Takegawa et al., 2006a; Morino et al.,2006], as shown in Figure 1.[11] Figure 1 also shows the distribution of NOx emis-
sions in the TMA estimated by Kannari et al. [2004]. TheTMA is defined as the area over seven prefectures labeled inFigure 1. The relative contributions of different sources aresummarized in Table 1. Motor vehicles are estimated to bethe dominant contribution (55%) to NOx emissions in theTMA. Emissions from diesel vehicles are estimated to beparticularly important to NOx emissions in the TMA (38%).RCAST is located within a high-NOx emission area. How-
D21310 KONDO ET AL.: REACTIVE NITROGEN IN TOKYO
2 of 23
D21310
ever, the measurements presented here were not significant-ly influenced by emissions from highly localized sources, asdiscussed in section 3.1.
2.2. Instrumentation
[12] Table 2 summarizes the measurements used for thepresent study, including accuracies, precisions, and timeresolutions. The key measurements at RCAST are describedin brief below. NO, NO2, and NOy were measured using aNO-O3 chemiluminescence detector [Kondo et al., 1997;Nakamura et al., 2003; Miyazaki et al., 2005]. The ambientair was sampled through a 2-m-long perfluoroalkoxy (PFA)hose with a 4.6-cm inner diameter (ID) at a flow rate of1200 standard liter per minute (slm). From the center of theunheated hose, a small portion of the ambient air was drawnup into the NO, NO2, and NOy instrument by way of a 6.35-mm-outer-diameter (OD) PFA tube (1 m long) heated to35�C. NOy was catalytically converted to NO on the surfaceof a gold tube heated to 300�C. The conversion efficiency ofparticulate NH4NO3 (boiling point 210�C) was measured tobe 91 ± 9%, while the conversion efficiencies for KNO3,NaNO3, and Ca(NO3)2 were 1, 2, and 3% respectively[Miyazaki et al., 2005]. The overall collection efficiencyof NH4NO3 should be close to 1, because of high flow inthe PFA hose, heated PFA tube, and high conversionefficiency. On the other hand, NaNO3 in sea salt is excludedfrom NOy because of the conversion efficiency close tozero. NO2 was converted to NO by a photolytic converter(Droplet Measurement Technologies, Inc., USA) with aconversion efficiency of about 30–40%. Systematic errorsof the measurements of NO, NO2, and NOy were 10, 16,and 12%, respectively. The random errors of the NO, NO2,and NOy measurements with 1-min time averaging were ±4parts per trillion by volume (pptv), ±9 pptv, and ±68 pptv,respectively, for their typical ambient mixing ratios.
[13] HNO3 was measured by a chemical ionization massspectrometer (CIMS) using the selective ion-molecule reac-tion of SiF5
� with HNO3 [Kita et al., 2006; Morino et al.,2006]. We used the same PFA hose, as that used for the NOy
measurements, for ambient air sampling. The detection limitfor a 10-s integration was 19 pptv, and the overall accuracywas about 9% at an HNO3 mixing ratio of 1 part per billionby volume (ppbv). Interference of particulate NO3
� to theHNO3 measurements was negligible [Kita et al., 2006].[14] Particulate NO3
�, predominantly in the form ofNH4NO3, was measured using an Aerodyne Aerosol MassSpectrometer (AMS) with a time resolution of 10 min[Takegawa et al., 2005; Morino et al., 2006]. Organicaerosol (OA) was also measured by AMS [Takegawa etal., 2005]. The sample line from the inlet to the AMSconsisted of a PM2.5 (2.5 mm) cyclone and a 1-mm-inner-diameter stainless steel tube (6 m long). The AMS measure-ments were compared extensively with a particle-into-liquidsampler combined with an ion chromatography analyzer(inorganic components) and a Sunset Laboratory semicon-tinuous thermal-optical carbon analyzer (organics). Thedetection limits of nitrate and OA were 0.02 and 0.3 mgm�3, respectively [Takegawa et al., 2005]. The actual sizecut of the AMS was determined to be nearly PM1 (1 mm) bythe more restrictive transmission characteristics of theaerodynamic lens.[15] Each species of PANs (=PAN + PPN + PnBN +
PiBN + APAN + MPAN) was measured every 15 min usinga gas chromatograph with a negative ion chemical ioniza-tion mass spectrometer [Tanimoto et al., 1999, 2002]. Thedetection limit for PAN, a dominant species of PANs, was15 pptv with an overall measurement uncertainty of 20%.VOCs, including alkyl nitrates and nonmethane hydrocar-bons (NMHCs) (RONO2; C1-C5) were measured usingwhole air sampling followed by laboratory analysis usinggas chromatography [Blake et al., 2003a, 2003b; Simpson etal., 2003, and references therein]. Although the samplinginterval was 2–6 h, the actual integration time was 5–10 sfor each sample. The whole air sample data were mergedwith the other data without further averaging or smoothing.The RONO2 data were available only for the summerperiod. The temporal variations of C2-C7 VOCs are shownby Shirai et al. [2007].[16] CO was measured using a nondispersive infrared
absorption (NDIR) instrument (Model-48, Thermo Environ-mental Instruments (TEI), USA). The overall precision andaccuracy of the 1-min CO data were estimated to be 4 ppbvand 20 ppbv, respectively, at a CO mixing ratio of 400 ppbv[Kondo et al., 2006]. O3 was measured using an ultraviolet
Figure 1. Map of the NOx emission rate over the KantoPlain. The observational sites (Research Center of Ad-vanced Science and Technology (RCAST) and TokyoUniversity of Marine Science and Technology (TUMSAT))are shown as open circles. The high-NOx emission areas aredepicted by thick lines (approximate urban boundary).
Table 1. NOx Emissions in Tokyo and the TMA
Tokyoa (Gg/a) TMAa (Gg/a)
Total 153 (100) 337 (100)Energy industries 35 (23) 43 (13)Manufacturing industries and construction 25 (16) 66 (20)Transport (total) 74 (48) 187 (55)Transport (gasoline) 14 (9) 35 (11)Transport (diesel) 46 (30) 129 (38)Transport (others) 14 (9) 23 (6)Other sectors (commercial, etc.) 13 (8) 26 (8)Waste incineration 7 (4) 15 (5)
aRelative contribution in percent is given in parentheses.
D21310 KONDO ET AL.: REACTIVE NITROGEN IN TOKYO
3 of 23
D21310
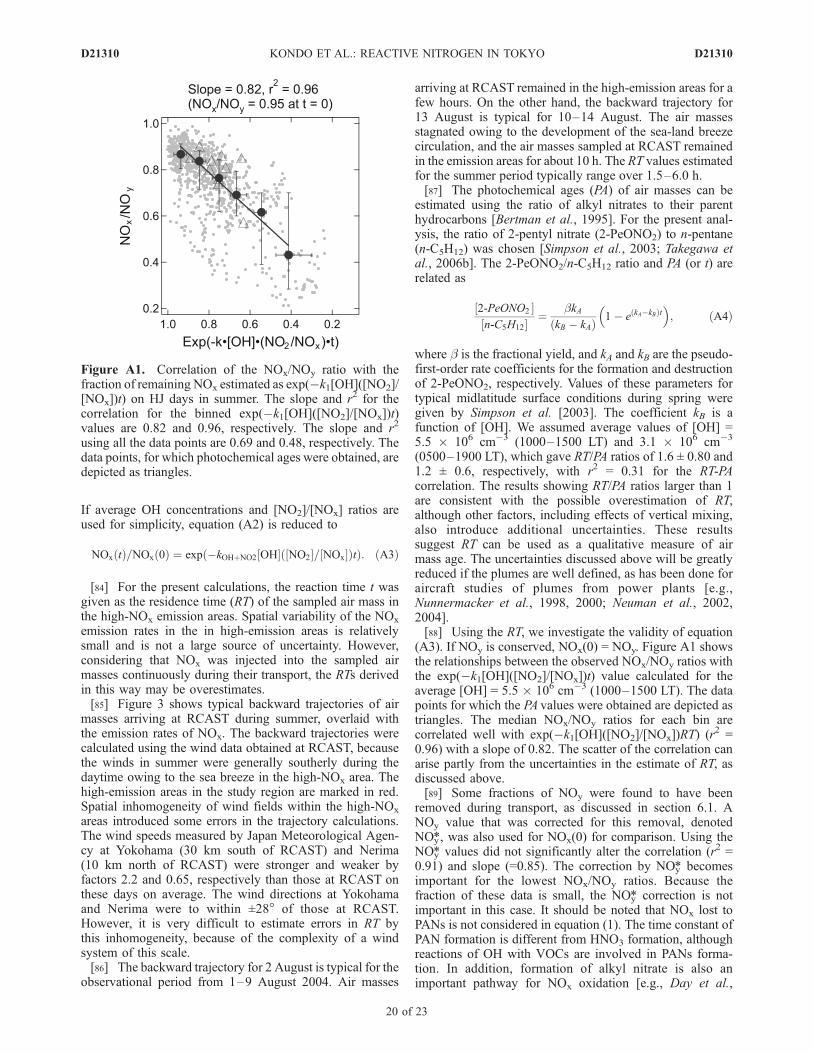
(UV) absorption instrument (Model 1101, Dylec, Japan).The instrument was calibrated with a standard O3 generator(Thermo Electron Inc., Model 49PS, USA). The precisionwas 0.3 ppbv, defined as a standard deviation (1s) of thedifference between the 1-min values of the O3 instrumentand those measured by the calibration instrument at O3
concentrations of about 50 ppbv. The accuracy of the O3
data was estimated to be about 5%, equal to the accuracy ofthe standard O3 generator. This O3 generator is traceable toa National Institute of Standards and Technology (NIST)standard.[17] OH and HO2 were measured using a laser-induced
fluorescence (LIF) technique [Kanaya et al., 2001a, 2001b,2007]. The overall uncertainties in OH and HO2 measure-ments were estimated to be ±24% for OH and ±26% forHO2 (1s). The detection limit for the 10-min data was 1.3 �105 cm�3 for nighttime and 5.2 � 105 cm�3 for daytime.Formaldehyde (HCHO) and acetaldehyde (CH3CHO) weremeasured by a proton-transfer-reaction mass spectrometry(PTR-MS) technique only during the winter campaign[Kanaya et al., 2007]. The signals were integrated for 10 sand 1 s for HCHO and CH3CHO, respectively. HONO wasmeasured using diffusion scrubber/ion chromatography,also in winter.[18] Photolysis frequencies of O3 (J(O1D)) and NO2
(J(NO2)) were derived from actinic flux measurements froma spectroradiometer that was developed by New Zealand’sNational Institute of Water and Atmospheric Research(NIWA) [McKenzie et al., 2002]. The instrument scannedthe spectral region between 285 and 450 nm with asampling interval of 0.2 nm and a spectral resolution ofapproximately 0.65 nm. Radiometric calibration was madewith respect to the NIST standard, with a total uncertainty ofapproximately ±6%. Additional uncertainties arose fromuncertainties in the absorption cross sections and quantumyields that were used to convert these actinic fluxes tophotolysis rates. For J(O1D) and J(NO2) we used absorptioncross sections by Molina and Molina [1986] and Harder etal. [1997], respectively, and quantum yields recommendedby JPL [DeMore et al., 1997]. The instrument measuresonly the downwelling component of the actinic flux. ForUV observations near the surface, the lack of the upwellingcomponent results in only a small error because of the lowsurface albedo at these wavelengths. Local horizon obscu-rations limited the instrument field of view to approximately90% of the full hemisphere, resulting in an underestimationof approximately 10% in the diffuse component of theradiation field. The direct sun was sometimes blocked inthe morning up to solar elevations of 20�. However, at thosesolar elevations, the actinic flux is dominated by the diffuseskylight component, and the overall reduction in actinicfluxes due to horizon obscurations was generally less than10%. Taking all of the above uncertainties into consider-ation, we estimate the overall uncertainty in the derivedphotolysis rates to be ±20%. Most of the data describedabove (gases, aerosols, and actinic flux) were merged intotime intervals of 10 min for the present analysis.[19] In addition to the measurements at RCAST, concen-
trations of inorganic aerosol were measured by collectingaerosol particles on quartz fiber filters using a high-volumefilter sampler (Model 130, Kimoto, Osaka, Japan), followedby analysis using an ion chromatography analyzer at theT
able
2.System
atic
andRandom
Errors
intheMixingRatiosofMeasuredTrace
Gases,Aerosols,andMeteorological
Param
eters
Species
Technique
Accuracy
(%)
1sPrecision
Tim
eResolution
IntegrationTim
eReference
NO
chem
iluminescence
(CL)
10(at2ppbv)
4pptv
(at2ppbv)
1min
10s
Kondoet
al.[1997]
NO2
CLwithphotolysisconverter
16(at13ppbv)
9pptv
(at13ppbv)
1min
10s
Nakamura
etal.[2003]
NOy
CLwithheatedgold
converter
12(at21ppbv)
68pptv
(at21ppbv)
1min
10s
Kondoet
al.[1997]
HNO3
chem
ical
ionizationmassspectrometer
9(at1ppbv)
19(at50pptv)
23pptv
1min
1min
Kitaet
al.[2006]
PANs
gas
chromatographywithnegativeion
chem
ical
ionizationmass
spectrometer
20forPAN
25forPPN
LOD:15pptv
forPA
Nand
26pptv
forPPN
15min
1min
Tanimoto
etal.[1999]
NO3�,OA
aerosolmassspectrometer
2625
0.01mgm
�3(N
O3�),0.1
mgm
�3(O
A)
10min
10min
Takegawaet
al.[2005]and
Kondoet
al.[2007]
Alkylnitrates
airsamplingandgas
chromatography
withelectroncapture
detection
2–6h
5–10s
Blake
etal.[2003a,
2003b]and
Simpsonet
al.[2003]
OH
laser-inducedfluorescence
20
LOD:5.2
�105cm
�3fordaytime
and1.3
�105cm
�3fornighttim
e10min
Kanaya
etal.[2001a,
2001b,2007]
HCHO,CH3CHO
protontransfer
reactionmass
spectrometry
0.81ppbvforHCHO
and
0.12ppbvforCH3CHO
10s
1s
1min
Kanaya
etal.[2007]
HONO
diffusionscrubber/ion
chromatography
20pptv
30min
30min
Kanaya
etal.[2007]
CO
IRabsorption
5(at400ppbv)
4ppbv(at400ppbv)
1min
1min
Kondoet
al.[2006]
O3
UVabsorption
51ppbv
1min
1min
J(O1D),J(NO2)
spectroradiometer
20
2min
McK
enzieet
al.[2002]
Wind,temperature,
andRH
10min
Kondoet
al.[2006]
D21310 KONDO ET AL.: REACTIVE NITROGEN IN TOKYO
4 of 23
D21310
Etchujima campus (35.66�N, 139.80�E) of the Tokyo Uni-versity of Marine Science and Technology (TUMSAT).TUMSAT is located 10 km east of RCAST (Figure 1).The sampling of aerosol particles was made in two sizeranges using an impactor with diameters larger than 2 mm(coarse mode) and smaller than 2 mm (PM2) [Murayama etal., 1999].
2.3. Box Model
[20] In this work we used a photochemical box model tocalculate RO2 (organic peroxy) radical concentrations toderive ozone formation (F(O3)), destruction (D(O3)), andnet formation (P(O3)) rates. The O3 formation processesinclude reactions (R5) and (R6). F(O3) and D(O3) areexpressed as
FðO3Þ ¼�kHO2þNO½HO2 þ S kRO2þNO8½RO2
�½NO; ð1Þ
where [ ] denotes the number density of the indicatedspecies, k is the reaction rate coefficient of the correspond-ing reaction indicated by the suffix, and 8 is the yield ofNO2 from reaction (R6):
DðO3Þ ¼ kO1DþH2O½O1D½H2O þ ðkOHþO3½OH þ kHO2þO3½HO2þ S kolefinþO3½olefinÞ½O3 þ kOHþNO2½NO2½OH; ð2Þ
PðO3Þ ¼ FðO3Þ � DðO3Þ: ð3Þ
Observed HO2 concentrations and model-calculated RO2
were used in equations (1) and (2). Briefly, the box modeltakes into account the Regional Atmospheric ChemistryMechanism (RACM) [Stockwell et al., 1997] with updatedkinetic parameters. The heterogeneous loss of HO2 is nottaken into account in the standard runs. For constraining themodel, we used the observed concentrations and parameters(O3, CO, H2O, SO2, NO, NO2, CH4, NMHCs, PANs,temperature, ambient pressure, and J values) in the analysisof the winter and summer data. In total, 54 NMHCs weretaken into account in the 11 model categories, as describedby Kanaya et al. [2007]. For winter, the measuredconcentrations of HONO, HCHO, and CH3CHO were alsoused to constrain the model. Summertime concentrations ofHONO were calculated by the model. HCHO and CH3CHOconcentrations estimated empirically from CO and (O3 +NO2) concentrations were used for the summer period. Allof the other oxygenated species were calculated in themodel, with an assumption that dilution occurred with atime constant of 6 h to represent horizontal advection of airmasses influenced by urban emissions.[21] We compared the model-calculated HO2 values with
the observed values to check the reliability of the calculatedRO2 used in calculating P(O3). For winter, the model-calculated OH and HO2 levels during the daytime agreedbetter with observations when the concentrations of internalolefin (OLI in RACM) and reactive alkanes (HC8) wereincreased by factors of 3 and 5, respectively (run 2), abovethe standard-run hydrocarbon levels. Therefore, the calcu-lated RO2 from run 2 and the observed HO2 were used tocalculate P(O3).
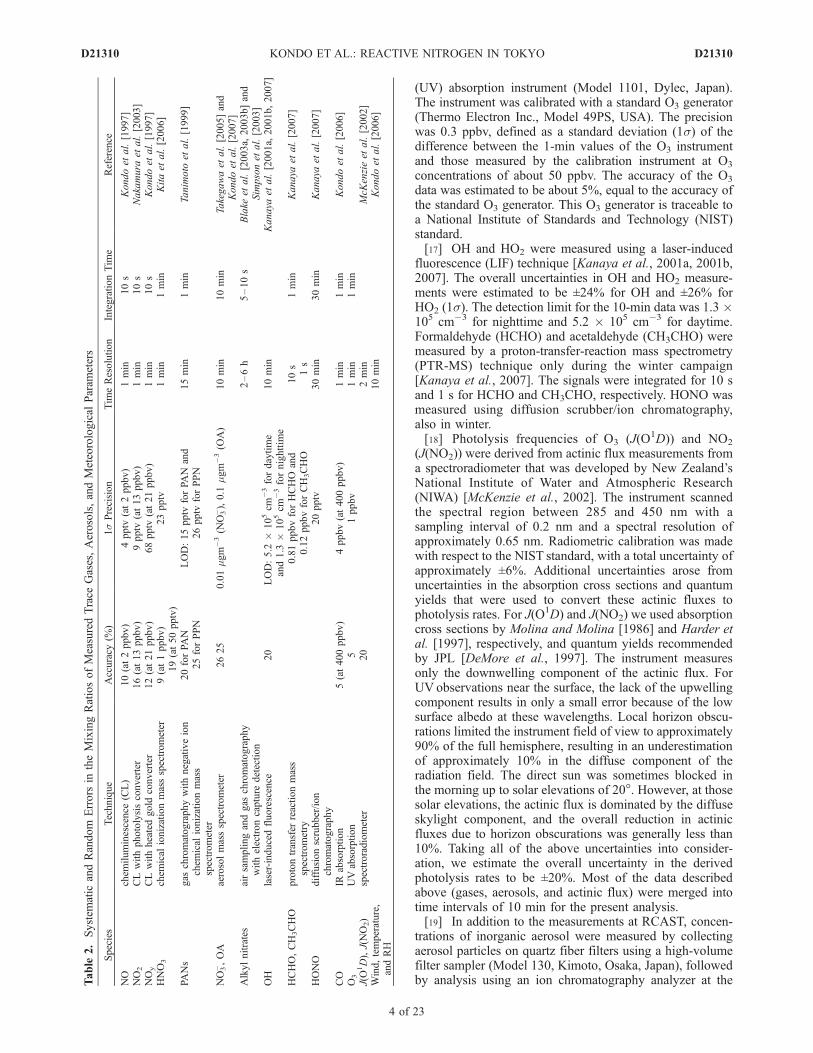
Figure 2. (a) Temporal variations of the 1-h averagevalues of NOx, NOx*, O3, Ox = O3 + NO2, NOy, HNO3,NO3
�, and peroxyacyl nitrates (PANs) for 1 week (8–14 August) in the summer of 2004. (b) Temporalvariations of the 10-min-averaged values of NO, HO2, andP(O3) and 1-h-averaged NO/NOx and NOx/NOy ratios for1 week (8–14 August) in the summer of 2004.
D21310 KONDO ET AL.: REACTIVE NITROGEN IN TOKYO
5 of 23
D21310
[22] For summer, increased OLI and HC8 concentrationslead to a significant overestimation of HO2 by the model.Therefore the calculated RO2 from the standard run and theobserved HO2 were used for the P(O3) calculations, al-though the effect of using the different levels of RO2 onP(O3) was not significant. More detailed descriptions of themodel and the comparisons between calculated and ob-served OH and HO2 radical concentrations have been givenby Kanaya et al. [2007].[23] The same box model was used to simulate temporal
variations of PAN in summer, with slightly different set-tings. In this case, the constraint on PAN concentrations wasremoved and its concentrations were predicted consideringphotochemical processes included in RACM, a depositionterm with a velocity of 0.2 cm s�1, and a dilution term witha time constant of 6 h. The BL height was assumed to be1000 m in the daytime and 100 m in the nighttime tocalculate the loss rate owing to surface deposition. Themodel-calculated PAN concentrations are compared withthose observed in section 6.1.
3. Temporal Variations of Reactive Nitrogenand Oxidants
3.1. Spatial Uniformity of the Observational Data
[24] Figure 2a shows a 1-h resolution time series of NOx, O3,and Ox measured at RCAST and of NOx* and O3 at routinemonitoring stations of the Atmospheric Environmental Region-al Observation System (AEROS) (http://soramame.taiki.go.jp/)at Setagaya (5 km southwest of RCAST) and at a sitevery close to TUMSAT during the summertime period toillustrate the spatial uniformity of these species near the
urban center of Tokyo. Here Ox represents oxidants O3 +NO2, taking into account conversion of O3 to NO2 (O3-NO titration). The nighttime decrease of Ox was signif-icantly smaller than that of O3, because Ox is betterconserved than O3. Figure 2a also shows time series ofHNO3, NO3
�, PANs, and NOy. NOx* represents reactivenitrogen measured using molybdenum converters withparticulate filters mounted upstream of chemilumines-cence NO detectors. The conversion efficiencies of mo-lybdenum converter for NO2, HNO3, and PAN wereobserved to be close to those for gold catalytic converter[Fehsenfeld et al., 1987]. However, the unheated filterand metal plumbing parts removed HNO3 and particulatenitrate, although the removal efficiencies were not quan-tified. The NOx* levels measured at RCAST during adifferent period were found to be between the NOx andNOy levels (not shown). It is likely that NOx* representsNOx + organic nitrates. Temporal variations of NOx andNOx* measured at RCAST and Setagaya were similar,indicating that the air masses observed at RCAST werenot significantly affected by localized sources. The differ-ences in the NOx* variations between Setagaya andTUMSAT were larger than those between RCAST andSetagaya, although the average NOx* levels were similar.It is likely that the larger differences between Setagayaand TUMSAT reflect the relatively short lifetime of NOx
(about 8 h) and differences in the accumulated amountsof NOx along trajectories of air masses sampled at thesesites, as discussed in detail in Appendix A. The temporalvariations of the O3 concentration at the three sites werevery similar. These features of NOx and O3 were basi-cally the same for other seasons, suggesting their spatial
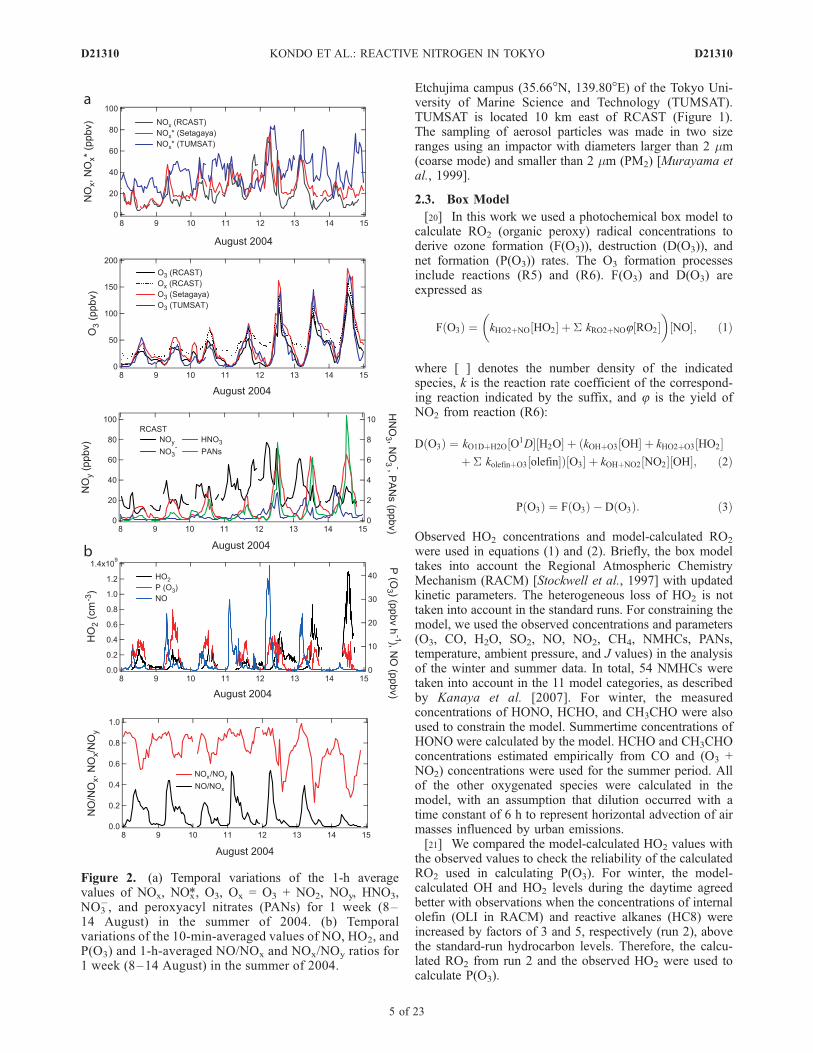
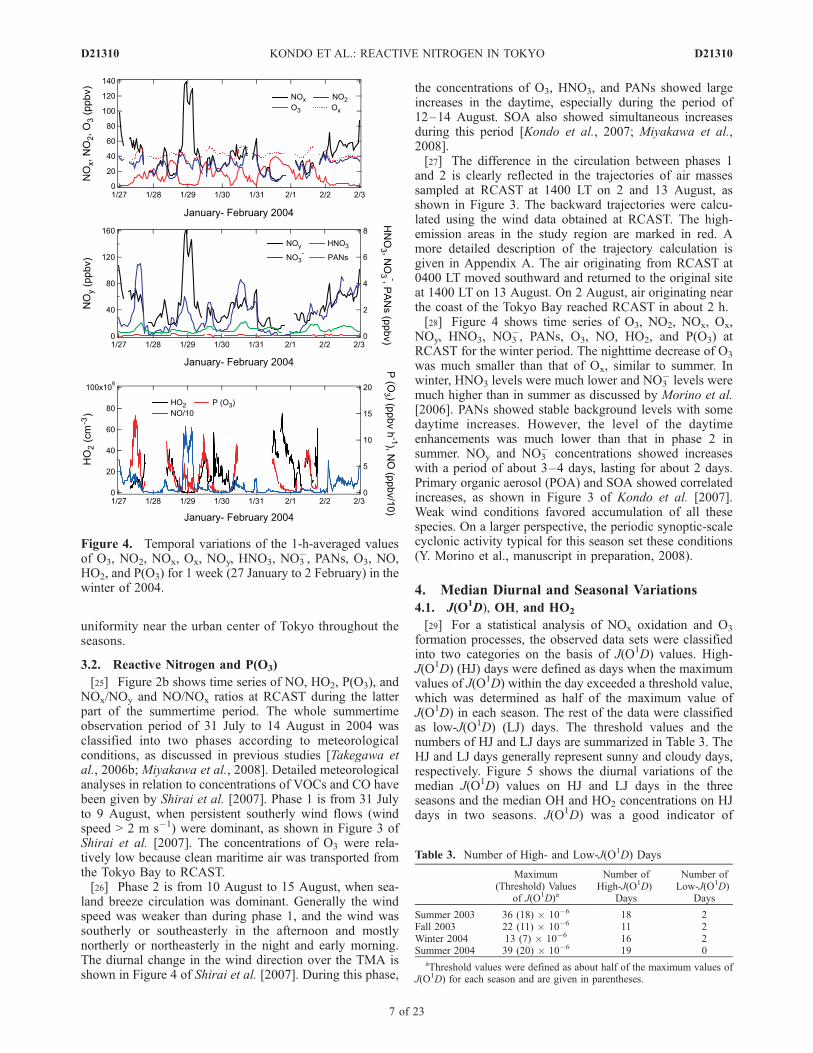
Figure 3. Trajectories of air masses sampled at RCAST at 1400 LT on 2 and 13 August 2004. The high-NOx emission areas (urban boundary) are marked in red. The locations of air masses are color-codedaccording to the residence time in the high-NOx emission areas (blue to red).
D21310 KONDO ET AL.: REACTIVE NITROGEN IN TOKYO
6 of 23
D21310
uniformity near the urban center of Tokyo throughout theseasons.
3.2. Reactive Nitrogen and P(O3)
[25] Figure 2b shows time series of NO, HO2, P(O3), andNOx/NOy and NO/NOx ratios at RCAST during the latterpart of the summertime period. The whole summertimeobservation period of 31 July to 14 August in 2004 wasclassified into two phases according to meteorologicalconditions, as discussed in previous studies [Takegawa etal., 2006b; Miyakawa et al., 2008]. Detailed meteorologicalanalyses in relation to concentrations of VOCs and CO havebeen given by Shirai et al. [2007]. Phase 1 is from 31 Julyto 9 August, when persistent southerly wind flows (windspeed > 2 m s�1) were dominant, as shown in Figure 3 ofShirai et al. [2007]. The concentrations of O3 were rela-tively low because clean maritime air was transported fromthe Tokyo Bay to RCAST.[26] Phase 2 is from 10 August to 15 August, when sea-
land breeze circulation was dominant. Generally the windspeed was weaker than during phase 1, and the wind wassoutherly or southeasterly in the afternoon and mostlynortherly or northeasterly in the night and early morning.The diurnal change in the wind direction over the TMA isshown in Figure 4 of Shirai et al. [2007]. During this phase,
the concentrations of O3, HNO3, and PANs showed largeincreases in the daytime, especially during the period of12–14 August. SOA also showed simultaneous increasesduring this period [Kondo et al., 2007; Miyakawa et al.,2008].[27] The difference in the circulation between phases 1
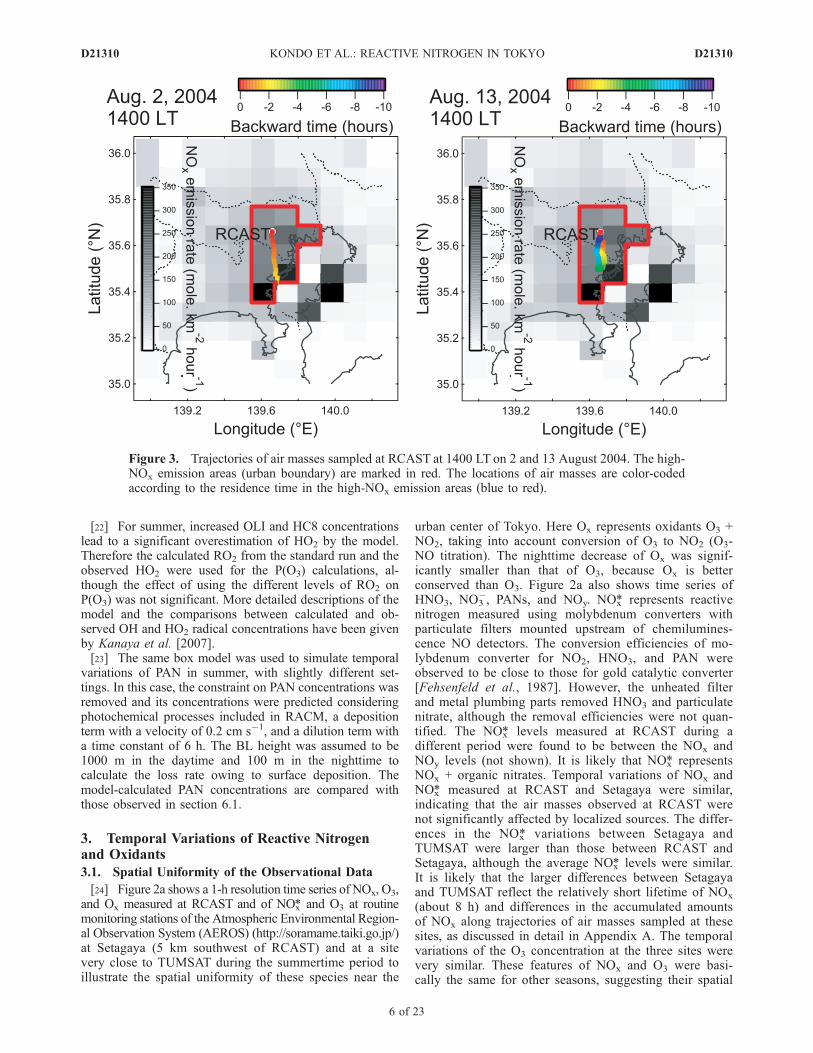
and 2 is clearly reflected in the trajectories of air massessampled at RCAST at 1400 LT on 2 and 13 August, asshown in Figure 3. The backward trajectories were calcu-lated using the wind data obtained at RCAST. The high-emission areas in the study region are marked in red. Amore detailed description of the trajectory calculation isgiven in Appendix A. The air originating from RCAST at0400 LT moved southward and returned to the original siteat 1400 LT on 13 August. On 2 August, air originating nearthe coast of the Tokyo Bay reached RCAST in about 2 h.[28] Figure 4 shows time series of O3, NO2, NOx, Ox,
NOy, HNO3, NO3�, PANs, O3, NO, HO2, and P(O3) at
RCAST for the winter period. The nighttime decrease of O3
was much smaller than that of Ox, similar to summer. Inwinter, HNO3 levels were much lower and NO3
� levels weremuch higher than in summer as discussed by Morino et al.[2006]. PANs showed stable background levels with somedaytime increases. However, the level of the daytimeenhancements was much lower than that in phase 2 insummer. NOy and NO3
� concentrations showed increaseswith a period of about 3–4 days, lasting for about 2 days.Primary organic aerosol (POA) and SOA showed correlatedincreases, as shown in Figure 3 of Kondo et al. [2007].Weak wind conditions favored accumulation of all thesespecies. On a larger perspective, the periodic synoptic-scalecyclonic activity typical for this season set these conditions(Y. Morino et al., manuscript in preparation, 2008).
4. Median Diurnal and Seasonal Variations
4.1. J(O1D), OH, and HO2
[29] For a statistical analysis of NOx oxidation and O3
formation processes, the observed data sets were classifiedinto two categories on the basis of J(O1D) values. High-J(O1D) (HJ) days were defined as days when the maximumvalues of J(O1D) within the day exceeded a threshold value,which was determined as half of the maximum value ofJ(O1D) in each season. The rest of the data were classifiedas low-J(O1D) (LJ) days. The threshold values and thenumbers of HJ and LJ days are summarized in Table 3. TheHJ and LJ days generally represent sunny and cloudy days,respectively. Figure 5 shows the diurnal variations of themedian J(O1D) values on HJ and LJ days in the threeseasons and the median OH and HO2 concentrations on HJdays in two seasons. J(O1D) was a good indicator of
Figure 4. Temporal variations of the 1-h-averaged valuesof O3, NO2, NOx, Ox, NOy, HNO3, NO3
�, PANs, O3, NO,HO2, and P(O3) for 1 week (27 January to 2 February) in thewinter of 2004.
Table 3. Number of High- and Low-J(O1D) Days
Maximum(Threshold) Values
of J(O1D)a
Number ofHigh-J(O1D)
Days
Number ofLow-J(O1D)
Days
Summer 2003 36 (18) � 10�6 18 2Fall 2003 22 (11) � 10�6 11 2Winter 2004 13 (7) � 10�6 16 2Summer 2004 39 (20) � 10�6 19 0
aThreshold values were defined as about half of the maximum values ofJ(O1D) for each season and are given in parentheses.
D21310 KONDO ET AL.: REACTIVE NITROGEN IN TOKYO
7 of 23
D21310
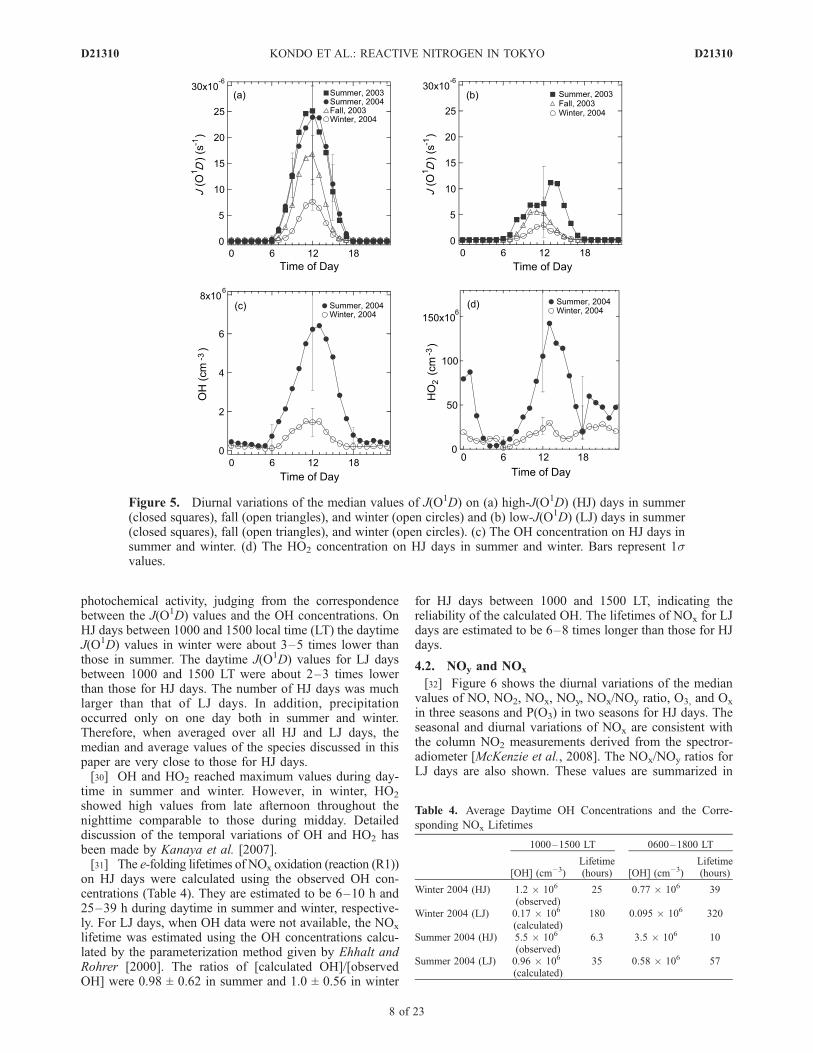
photochemical activity, judging from the correspondencebetween the J(O1D) values and the OH concentrations. OnHJ days between 1000 and 1500 local time (LT) the daytimeJ(O1D) values in winter were about 3–5 times lower thanthose in summer. The daytime J(O1D) values for LJ daysbetween 1000 and 1500 LT were about 2–3 times lowerthan those for HJ days. The number of HJ days was muchlarger than that of LJ days. In addition, precipitationoccurred only on one day both in summer and winter.Therefore, when averaged over all HJ and LJ days, themedian and average values of the species discussed in thispaper are very close to those for HJ days.[30] OH and HO2 reached maximum values during day-
time in summer and winter. However, in winter, HO2
showed high values from late afternoon throughout thenighttime comparable to those during midday. Detaileddiscussion of the temporal variations of OH and HO2 hasbeen made by Kanaya et al. [2007].[31] The e-folding lifetimes of NOx oxidation (reaction (R1))
on HJ days were calculated using the observed OH con-centrations (Table 4). They are estimated to be 6–10 h and25–39 h during daytime in summer and winter, respective-ly. For LJ days, when OH data were not available, the NOx
lifetime was estimated using the OH concentrations calcu-lated by the parameterization method given by Ehhalt andRohrer [2000]. The ratios of [calculated OH]/[observedOH] were 0.98 ± 0.62 in summer and 1.0 ± 0.56 in winter
for HJ days between 1000 and 1500 LT, indicating thereliability of the calculated OH. The lifetimes of NOx for LJdays are estimated to be 6–8 times longer than those for HJdays.
4.2. NOy and NOx
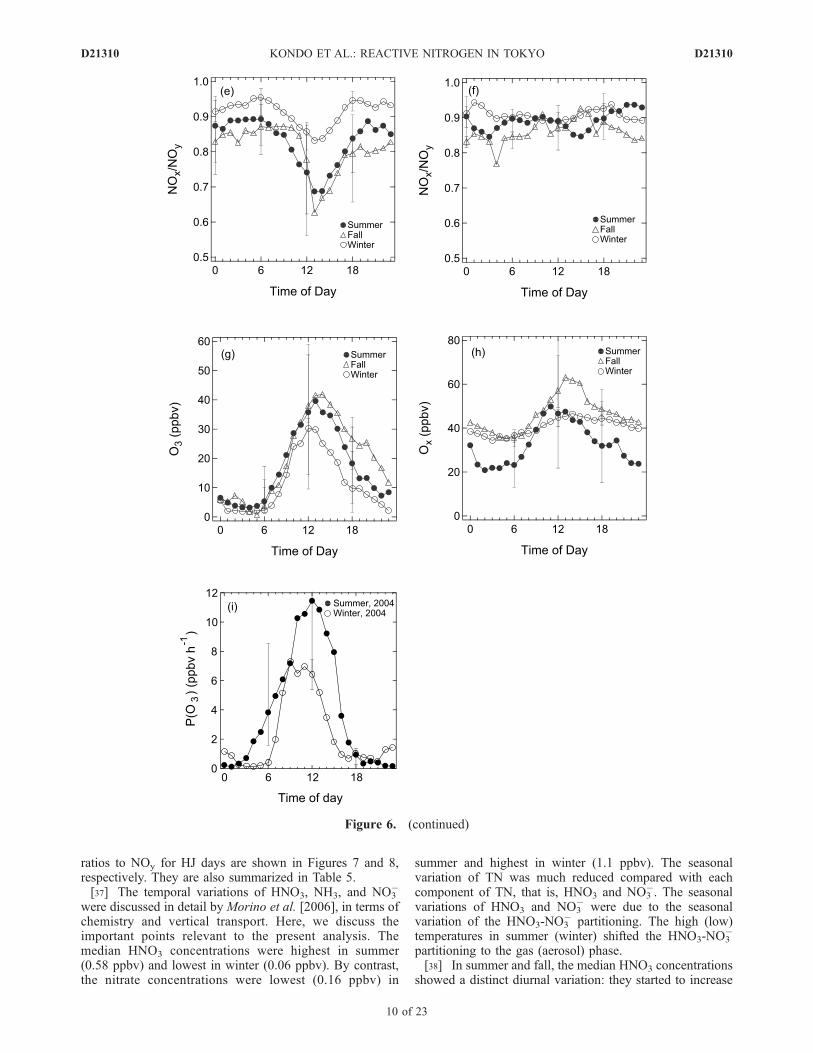
[32] Figure 6 shows the diurnal variations of the medianvalues of NO, NO2, NOx, NOy, NOx/NOy ratio, O3, and Ox
in three seasons and P(O3) in two seasons for HJ days. Theseasonal and diurnal variations of NOx are consistent withthe column NO2 measurements derived from the spectror-adiometer [McKenzie et al., 2008]. The NOx/NOy ratios forLJ days are also shown. These values are summarized in
Figure 5. Diurnal variations of the median values of J(O1D) on (a) high-J(O1D) (HJ) days in summer(closed squares), fall (open triangles), and winter (open circles) and (b) low-J(O1D) (LJ) days in summer(closed squares), fall (open triangles), and winter (open circles). (c) The OH concentration on HJ days insummer and winter. (d) The HO2 concentration on HJ days in summer and winter. Bars represent 1svalues.
Table 4. Average Daytime OH Concentrations and the Corre-
sponding NOx Lifetimes
1000–1500 LT 0600–1800 LT
[OH] (cm�3)Lifetime(hours) [OH] (cm�3)
Lifetime(hours)
Winter 2004 (HJ) 1.2 � 106
(observed)25 0.77 � 106 39
Winter 2004 (LJ) 0.17 � 106
(calculated)180 0.095 � 106 320
Summer 2004 (HJ) 5.5 � 106
(observed)6.3 3.5 � 106 10
Summer 2004 (LJ) 0.96 � 106
(calculated)35 0.58 � 106 57
D21310 KONDO ET AL.: REACTIVE NITROGEN IN TOKYO
8 of 23
D21310
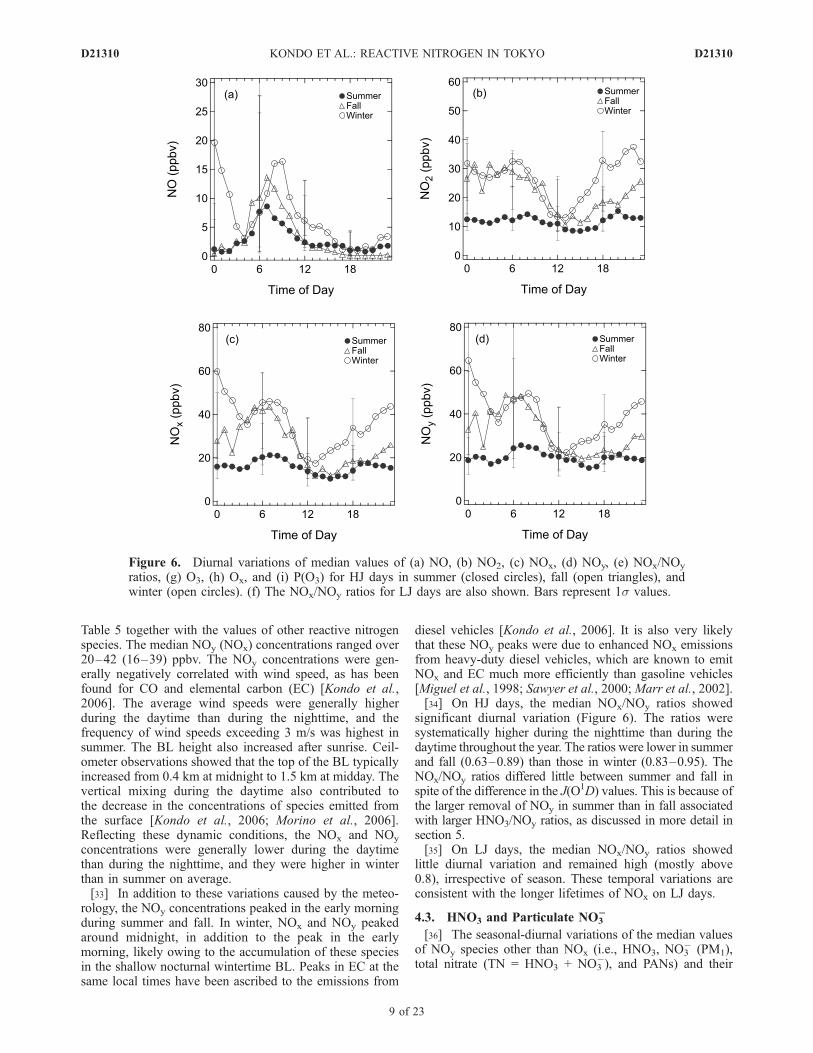
Table 5 together with the values of other reactive nitrogenspecies. The median NOy (NOx) concentrations ranged over20–42 (16–39) ppbv. The NOy concentrations were gen-erally negatively correlated with wind speed, as has beenfound for CO and elemental carbon (EC) [Kondo et al.,2006]. The average wind speeds were generally higherduring the daytime than during the nighttime, and thefrequency of wind speeds exceeding 3 m/s was highest insummer. The BL height also increased after sunrise. Ceil-ometer observations showed that the top of the BL typicallyincreased from 0.4 km at midnight to 1.5 km at midday. Thevertical mixing during the daytime also contributed tothe decrease in the concentrations of species emitted fromthe surface [Kondo et al., 2006; Morino et al., 2006].Reflecting these dynamic conditions, the NOx and NOy
concentrations were generally lower during the daytimethan during the nighttime, and they were higher in winterthan in summer on average.[33] In addition to these variations caused by the meteo-
rology, the NOy concentrations peaked in the early morningduring summer and fall. In winter, NOx and NOy peakedaround midnight, in addition to the peak in the earlymorning, likely owing to the accumulation of these speciesin the shallow nocturnal wintertime BL. Peaks in EC at thesame local times have been ascribed to the emissions from
diesel vehicles [Kondo et al., 2006]. It is also very likelythat these NOy peaks were due to enhanced NOx emissionsfrom heavy-duty diesel vehicles, which are known to emitNOx and EC much more efficiently than gasoline vehicles[Miguel et al., 1998; Sawyer et al., 2000; Marr et al., 2002].[34] On HJ days, the median NOx/NOy ratios showed
significant diurnal variation (Figure 6). The ratios weresystematically higher during the nighttime than during thedaytime throughout the year. The ratios were lower in summerand fall (0.63–0.89) than those in winter (0.83–0.95). TheNOx/NOy ratios differed little between summer and fall inspite of the difference in the J(O1D) values. This is because ofthe larger removal of NOy in summer than in fall associatedwith larger HNO3/NOy ratios, as discussed in more detail insection 5.[35] On LJ days, the median NOx/NOy ratios showed
little diurnal variation and remained high (mostly above0.8), irrespective of season. These temporal variations areconsistent with the longer lifetimes of NOx on LJ days.
4.3. HNO3 and Particulate NO3��
[36] The seasonal-diurnal variations of the median valuesof NOy species other than NOx (i.e., HNO3, NO3
� (PM1),total nitrate (TN = HNO3 + NO3
�), and PANs) and their
Figure 6. Diurnal variations of median values of (a) NO, (b) NO2, (c) NOx, (d) NOy, (e) NOx/NOy
ratios, (g) O3, (h) Ox, and (i) P(O3) for HJ days in summer (closed circles), fall (open triangles), andwinter (open circles). (f) The NOx/NOy ratios for LJ days are also shown. Bars represent 1s values.
D21310 KONDO ET AL.: REACTIVE NITROGEN IN TOKYO
9 of 23
D21310
ratios to NOy for HJ days are shown in Figures 7 and 8,respectively. They are also summarized in Table 5.[37] The temporal variations of HNO3, NH3, and NO3
�
were discussed in detail by Morino et al. [2006], in terms ofchemistry and vertical transport. Here, we discuss theimportant points relevant to the present analysis. Themedian HNO3 concentrations were highest in summer(0.58 ppbv) and lowest in winter (0.06 ppbv). By contrast,the nitrate concentrations were lowest (0.16 ppbv) in
summer and highest in winter (1.1 ppbv). The seasonalvariation of TN was much reduced compared with eachcomponent of TN, that is, HNO3 and NO3
�. The seasonalvariations of HNO3 and NO3
� were due to the seasonalvariation of the HNO3-NO3
� partitioning. The high (low)temperatures in summer (winter) shifted the HNO3-NO3
�
partitioning to the gas (aerosol) phase.[38] In summer and fall, the median HNO3 concentrations
showed a distinct diurnal variation: they started to increase
Figure 6. (continued)
D21310 KONDO ET AL.: REACTIVE NITROGEN IN TOKYO
10 of 23
D21310
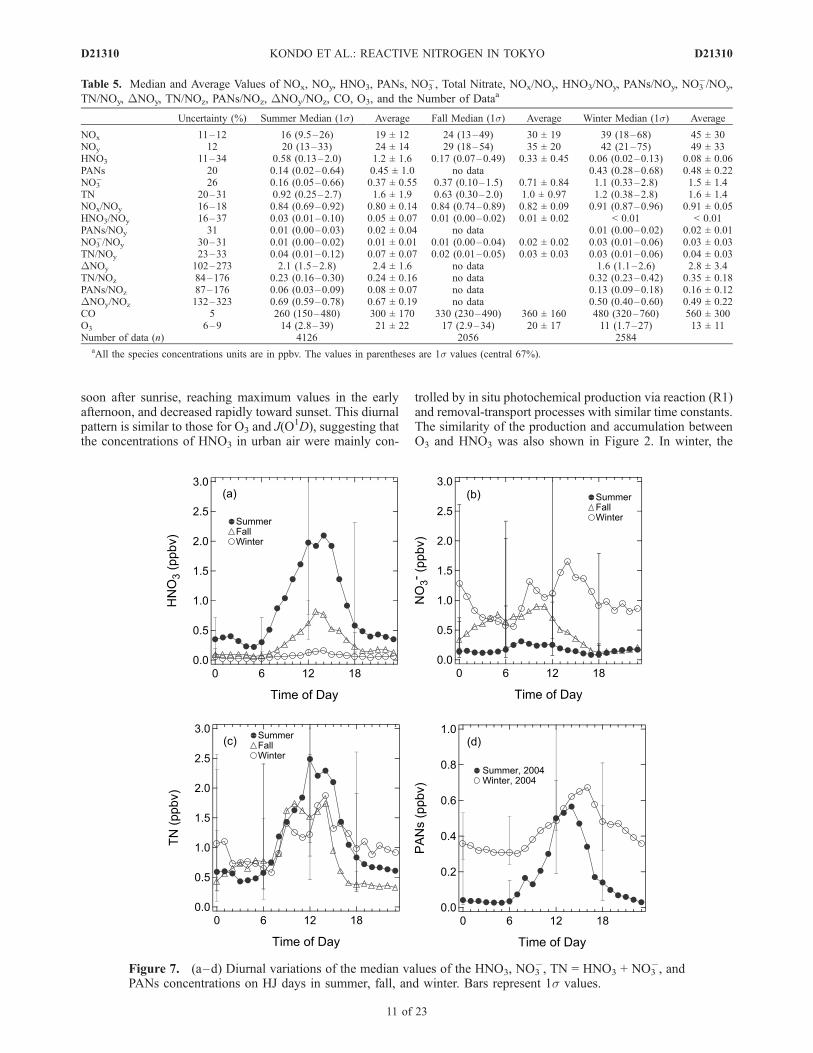
soon after sunrise, reaching maximum values in the earlyafternoon, and decreased rapidly toward sunset. This diurnalpattern is similar to those for O3 and J(O
1D), suggesting thatthe concentrations of HNO3 in urban air were mainly con-
trolled by in situ photochemical production via reaction (R1)and removal-transport processes with similar time constants.The similarity of the production and accumulation betweenO3 and HNO3 was also shown in Figure 2. In winter, the
Table 5. Median and Average Values of NOx, NOy, HNO3, PANs, NO3�, Total Nitrate, NOx/NOy, HNO3/NOy, PANs/NOy, NO3
�/NOy,
TN/NOy, DNOy, TN/NOz, PANs/NOz, DNOy/NOz, CO, O3, and the Number of Dataa
Uncertainty (%) Summer Median (1s) Average Fall Median (1s) Average Winter Median (1s) Average
NOx 11–12 16 (9.5–26) 19 ± 12 24 (13–49) 30 ± 19 39 (18–68) 45 ± 30NOy 12 20 (13–33) 24 ± 14 29 (18–54) 35 ± 20 42 (21–75) 49 ± 33HNO3 11–34 0.58 (0.13–2.0) 1.2 ± 1.6 0.17 (0.07–0.49) 0.33 ± 0.45 0.06 (0.02–0.13) 0.08 ± 0.06PANs 20 0.14 (0.02–0.64) 0.45 ± 1.0 no data 0.43 (0.28–0.68) 0.48 ± 0.22NO3
� 26 0.16 (0.05–0.66) 0.37 ± 0.55 0.37 (0.10–1.5) 0.71 ± 0.84 1.1 (0.33–2.8) 1.5 ± 1.4TN 20–31 0.92 (0.25–2.7) 1.6 ± 1.9 0.63 (0.30–2.0) 1.0 ± 0.97 1.2 (0.38–2.8) 1.6 ± 1.4NOx/NOy 16–18 0.84 (0.69–0.92) 0.80 ± 0.14 0.84 (0.74–0.89) 0.82 ± 0.09 0.91 (0.87–0.96) 0.91 ± 0.05HNO3/NOy 16–37 0.03 (0.01–0.10) 0.05 ± 0.07 0.01 (0.00–0.02) 0.01 ± 0.02 < 0.01 < 0.01PANs/NOy 31 0.01 (0.00–0.03) 0.02 ± 0.04 no data 0.01 (0.00–0.02) 0.02 ± 0.01NO3
�/NOy 30–31 0.01 (0.00–0.02) 0.01 ± 0.01 0.01 (0.00–0.04) 0.02 ± 0.02 0.03 (0.01–0.06) 0.03 ± 0.03TN/NOy 23–33 0.04 (0.01–0.12) 0.07 ± 0.07 0.02 (0.01–0.05) 0.03 ± 0.03 0.03 (0.01–0.06) 0.04 ± 0.03DNOy 102–273 2.1 (1.5–2.8) 2.4 ± 1.6 no data 1.6 (1.1–2.6) 2.8 ± 3.4TN/NOz 84–176 0.23 (0.16–0.30) 0.24 ± 0.16 no data 0.32 (0.23–0.42) 0.35 ± 0.18PANs/NOz 87–176 0.06 (0.03–0.09) 0.08 ± 0.07 no data 0.13 (0.09–0.18) 0.16 ± 0.12DNOy/NOz 132–323 0.69 (0.59–0.78) 0.67 ± 0.19 no data 0.50 (0.40–0.60) 0.49 ± 0.22CO 5 260 (150–480) 300 ± 170 330 (230–490) 360 ± 160 480 (320–760) 560 ± 300O3 6–9 14 (2.8–39) 21 ± 22 17 (2.9–34) 20 ± 17 11 (1.7–27) 13 ± 11Number of data (n) 4126 2056 2584
aAll the species concentrations units are in ppbv. The values in parentheses are 1s values (central 67%).
Figure 7. (a–d) Diurnal variations of the median values of the HNO3, NO3�, TN = HNO3 + NO3
�, andPANs concentrations on HJ days in summer, fall, and winter. Bars represent 1s values.
D21310 KONDO ET AL.: REACTIVE NITROGEN IN TOKYO
11 of 23
D21310
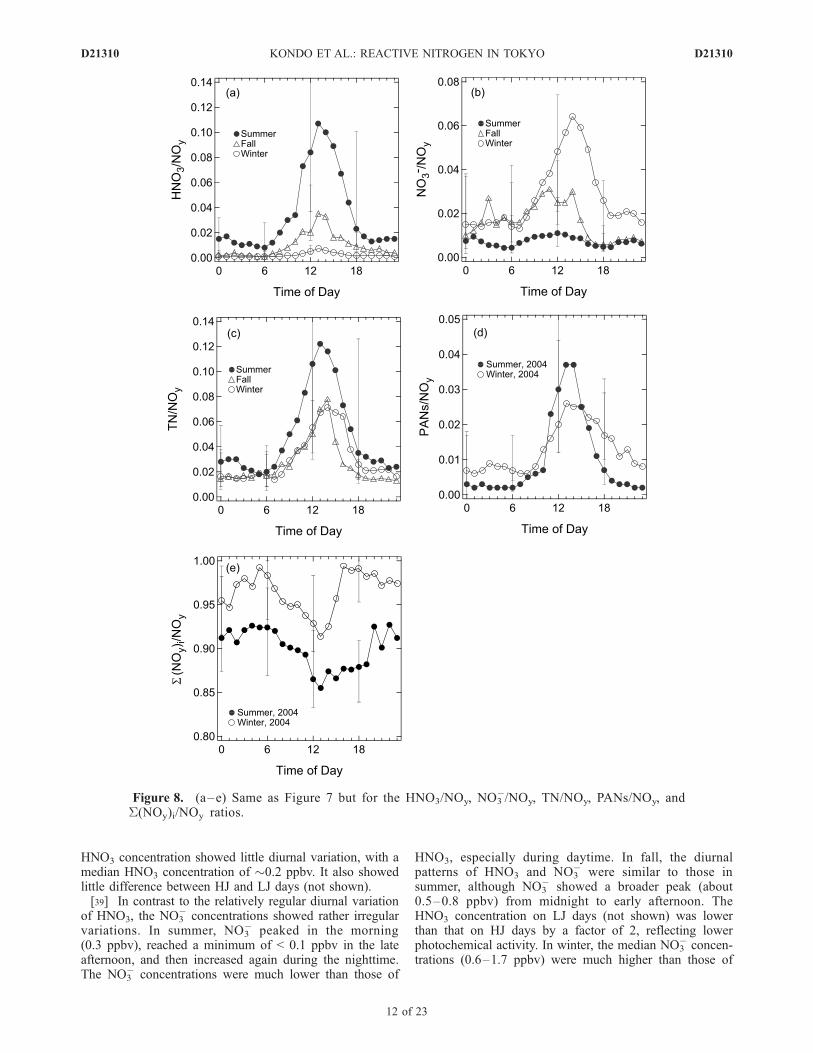
HNO3 concentration showed little diurnal variation, with amedian HNO3 concentration of �0.2 ppbv. It also showedlittle difference between HJ and LJ days (not shown).[39] In contrast to the relatively regular diurnal variation
of HNO3, the NO3� concentrations showed rather irregular
variations. In summer, NO3� peaked in the morning
(0.3 ppbv), reached a minimum of < 0.1 ppbv in the lateafternoon, and then increased again during the nighttime.The NO3
� concentrations were much lower than those of
HNO3, especially during daytime. In fall, the diurnalpatterns of HNO3 and NO3
� were similar to those insummer, although NO3
� showed a broader peak (about0.5–0.8 ppbv) from midnight to early afternoon. TheHNO3 concentration on LJ days (not shown) was lowerthan that on HJ days by a factor of 2, reflecting lowerphotochemical activity. In winter, the median NO3
� concen-trations (0.6–1.7 ppbv) were much higher than those of
Figure 8. (a–e) Same as Figure 7 but for the HNO3/NOy, NO3�/NOy, TN/NOy, PANs/NOy, and
S(NOy)i/NOy ratios.
D21310 KONDO ET AL.: REACTIVE NITROGEN IN TOKYO
12 of 23
D21310
HNO3 (�0.2 ppbv). The NO3� concentrations on LJ days
were comparable to or higher than that on HJ days.[40] On HJ days, the HNO3/NOy and NO3
�/NOy ratiosshowed diurnal and seasonal variations similar to those forHNO3, NO3
�, and TN, as discussed above. Here we defineNOz = NOy � NOx to represents the oxidized form of NOx.As discussed in section 4.2, NOx constituted a dominantfraction of NOy. The uncertainty of NOz is estimated to beas large as 82–174% owing to the subtraction of the twolarge terms. The median TN/NOz ratios for summer andwinter are shown in Table 5, together with their uncertain-ties. The median TN/NOz ratios in winter were higher thanthose in summer. In summer HNO3 > NO3
�, and the medianHNO3/NOz � TN/NOz = 0.23. In winter, NO3
� � HNO3
and the median NO3�/NOz � TN/NOz = 0.32.
4.4. NO3�� in Sea-Salt Particles
[41] Uptake of HNO3 onto sea-salt particles (NaCl) hasbeen suggested to be an important pathway of NOy removalin marine and coastal areas [e.g., Davies and Cox, 1998;Spokes et al., 2000]:
HNO3ðgÞ þ NaClðs; aqÞ ! NaNO3ðs; aqÞ þ HClðgÞ:ðR7Þ
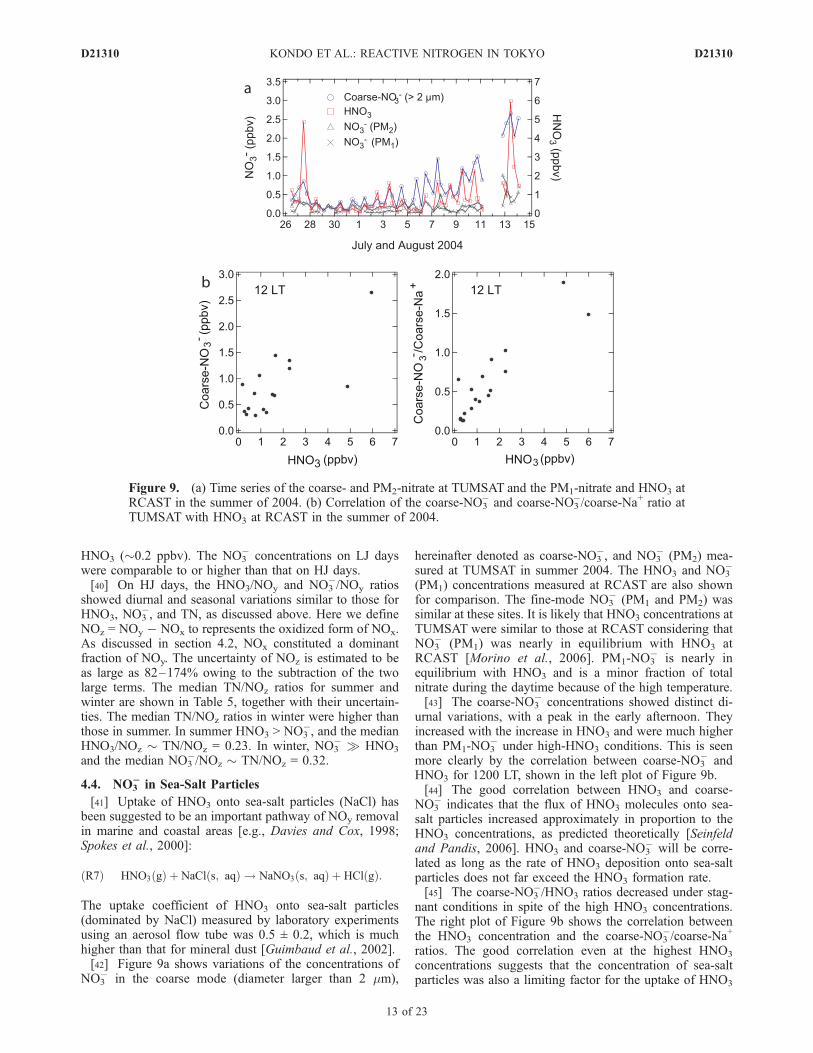
The uptake coefficient of HNO3 onto sea-salt particles(dominated by NaCl) measured by laboratory experimentsusing an aerosol flow tube was 0.5 ± 0.2, which is muchhigher than that for mineral dust [Guimbaud et al., 2002].[42] Figure 9a shows variations of the concentrations of
NO3� in the coarse mode (diameter larger than 2 mm),
hereinafter denoted as coarse-NO3�, and NO3
� (PM2) mea-sured at TUMSAT in summer 2004. The HNO3 and NO3
�
(PM1) concentrations measured at RCAST are also shownfor comparison. The fine-mode NO3
� (PM1 and PM2) wassimilar at these sites. It is likely that HNO3 concentrations atTUMSAT were similar to those at RCAST considering thatNO3
� (PM1) was nearly in equilibrium with HNO3 atRCAST [Morino et al., 2006]. PM1-NO3
� is nearly inequilibrium with HNO3 and is a minor fraction of totalnitrate during the daytime because of the high temperature.[43] The coarse-NO3
� concentrations showed distinct di-urnal variations, with a peak in the early afternoon. Theyincreased with the increase in HNO3 and were much higherthan PM1-NO3
� under high-HNO3 conditions. This is seenmore clearly by the correlation between coarse-NO3
� andHNO3 for 1200 LT, shown in the left plot of Figure 9b.[44] The good correlation between HNO3 and coarse-
NO3� indicates that the flux of HNO3 molecules onto sea-
salt particles increased approximately in proportion to theHNO3 concentrations, as predicted theoretically [Seinfeldand Pandis, 2006]. HNO3 and coarse-NO3
� will be corre-lated as long as the rate of HNO3 deposition onto sea-saltparticles does not far exceed the HNO3 formation rate.[45] The coarse-NO3
�/HNO3 ratios decreased under stag-nant conditions in spite of the high HNO3 concentrations.The right plot of Figure 9b shows the correlation betweenthe HNO3 concentration and the coarse-NO3
�/coarse-Na+
ratios. The good correlation even at the highest HNO3
concentrations suggests that the concentration of sea-saltparticles was also a limiting factor for the uptake of HNO3
Figure 9. (a) Time series of the coarse- and PM2-nitrate at TUMSAT and the PM1-nitrate and HNO3 atRCAST in the summer of 2004. (b) Correlation of the coarse-NO3
� and coarse-NO3�/coarse-Na+ ratio at
TUMSAT with HNO3 at RCAST in the summer of 2004.
D21310 KONDO ET AL.: REACTIVE NITROGEN IN TOKYO
13 of 23
D21310
on sea-salt particles, especially at low-wind conditions.Except for these periods, the median coarse-NO3
�/HNO3
ratios were about 0.83 (1s = 0.41–1.3), indicating signif-icant removal of HNO3 by uptake onto sea-salt particles. Alarge removal of HNO3 by sea-salt particles was alsosuggested by a modeling study for Appledore Island,Maine, USA [Fischer et al., 2006]. The uptake of HNO3
onto sea-salt particles led to net NOy removal, becausecoarse-NO3
� was not included in NOy, as discussed insection 2.2.
4.5. PANs
[46] The PANs concentrations and PANs/NOy ratios un-derwent diurnal variations reaching maximum values in theafternoon on HJ days in summer and winter, as shown inFigures 7 and 8. The maximum median PANs/NOy ratiowas lower in winter (0.025) than in summer (0.04). Theproduction rate of PANs is considered to have been higherin summer than in winter. However, the lifetime of PANsdue to decomposition was shorter in summer (35 min) thanin winter (14 h) for typical afternoon conditions. Thesecompensating effects led to reduced seasonal variations ofPANs. This point is discussed in more detail in section 5.[47] The median PANs/NOz ratios for summer and winter
are shown in Table 5. The median PANs/NOz ratios inwinter (0.13) were higher than those in summer (0.06),opposite to the PANs/NOy ratio.
4.6. S(NOy)i[48] Here we compare the sum of the measured individual
NOy species ((NOy)i) with the directly measured total NOy
to understand pathways of NOx oxidation in some moredetail. The sum is defined as
SðNOyÞi ¼ NOx þ HNO3 þ NO�3 þ PANs; ð4Þ
and unmeasured NOy (DNOy) (or ‘‘missing NOy’’) isdefined as
DNOy ¼ NOy � SðNOyÞi: ð5Þ
The uncertainties of S(NOy)i and DNOy in the threeseasons were estimated to be about 13% and 103–273%,respectively, by combining possible errors of the individualmeasurements. The uncertainty of S(NOy)i was derived as aroot-sum-square of the uncertainty of each (NOy)i species,weighted by its relative abundance. The much largeruncertainty of DNOy is due to the subtraction of the twolarge terms in equation (5), similar to NOz.[49] S(NOy)i was found to be highly correlated with NOy,
with linear regression slopes of 0.94 and 0.90 for the winterand summer periods, respectively. The average medianS(NOy)i/NOy ratios were 0.89 ± 0.03 and 0.96 ± 0.02(Figure 8). The S(NOy)i/NOy ratios showed a decreaseduring the daytime, and the minimum ratio was lowerduring summer than in winter. The seasonal variations ofthe median DNOy and DNOy/NOz ratios are summarizedin Table 5. The ratios of the sum of RONO2 identifiedby gas chromatography (S(RONO2)i) to NOy were lessthan 0.44%. The good correlation between DNOy andNOz (r2 = 0.64) (not shown) suggests that DNOy wasproduced photochemically. Both TN/NOz and PANs/NOz
ratios were lower in summer than those in winters (Table 5),suggesting higher fraction of oxidized reactive nitrogenother than TN and PANs in summer. However, it shouldbe stressed that the uncertainties of the DNOy/NOz ratiosare very large (>100%), and quantitative discussion ofDNOy is not feasible.[50] Total alkyl nitrates (SANs) have been measured
using thermal dissociation followed by laser-induced fluo-rescence detection of NO2 at rural and suburban sites inCalifornia and an urban site in Houston, Texas [Day et al.,2002, 2003; Rosen et al., 2004; Cleary et al., 2005]. At thesuburban and urban sites, the SANs/NOy ratios were 0.1–0.25 in summer. The observed SANs were generally muchhigher than the sum of identified alkyl nitrates (S(RONO2)i)observed previously [e.g., O’Brien et al., 1997] constitutinga large fraction of the missing NOy. Considering this, it ispossible that SANs constituted a significant fraction ofDNOy also in the present observations.[51] The oxidation of NOx to SANs can significantly
reduce NOx lifetimes as compared with those estimated byconsidering only reaction (R1). In fact, lifetimes of NOx inpower plant and urban plumes were derived to be 2–5 h fromthe decay of NOx in the plumes [Ryerson et al., 1998, 2003;Nunnermacker et al., 2000].
4.7. O3 and P(O3)
[52] According to the analysis by Kanaya et al. [2008],the predominant term in F(O3) is kHO2 + NO[NO][HO2] ingeneral. The HO2 concentration has been observed to berelatively stable at NO lower than 300 pptv decreasing withNO at higher NO as predicted for steady state conditions[Kanaya et al., 2007] and predicted theoretically [Seinfeldand Pandis, 2006]. The observed dependence of HO2 onNO also agreed with that predicted by the box model for thesummer period. Because of this relationship, the depen-dence of kHO2 + NO[NO][HO2] on NO is much reduced witha broad maximum at NO mixing ratios of a few ppbv[Kanaya et al., 2008]. However, for winter, the modelunderestimated the observed HO2 at high NO. ThereforeP(O3) estimated using the model-calculated HO2 under-estimated that derived using the observed HO2, especiallyat NO mixing ratios larger than 10 ppbv. The P(O3) valuesshown in Figures 5 and 6 are those calculated using theobserved HO2.[53] The O3 concentrations showed maximum values in
the early afternoon reaching close to zero just before sunrisein three seasons. However, the amplitudes of the diurnalvariations of Ox were significantly smaller than that of O3,because most of O3 was converted to NO2 during thenighttime, as seen from Figure 6. The importance ofnighttime O3 loss by NOx titration in urban centers is wellunderstood [e.g., Sillman, 1999]. It is likely that the sea-sonal variation of the regional background in O3, whichshould be close to Ox, contributed to the seasonally differentlevels of the nighttime Ox. The surface O3 at remote siteslocated at similar latitudes in Japan were reported to beabout 40–50 ppbv in fall and winter and reach minimumvalues of about 25–35 ppbv [e.g., Tanimoto et al., 2005;Kondo et al., 2008]. In fall and winter, the background O3 inthe BL over Japan is strongly influenced by the Asianoutflow and in summer it is influenced by inflow of cleanermaritime air. The daytime-nighttime difference in Ox is
D21310 KONDO ET AL.: REACTIVE NITROGEN IN TOKYO
14 of 23
D21310
largest in summer (about 30 ppbv) and smallest in winter(about 5 ppbv). Photochemical O3 production during thedaytime significantly contributed to the daytime increase inOx, particularly in summer, as detailed below.[54] The median of the daily peak P(O3) in winter was
smaller than that in summer by only a factor 1.5 (about 12ppbv h�1 versus 8 ppbv h�1) despite the difference in HO2
by about a factor of 6. This difference is due to thedifference in NO by a factor of 3 around midday betweenwinter and summer. The steady state [NO]/[NOy] ratio isexpressed to a good approximation as
½NO=½NOy ¼ ð½NO=½NOxÞð½NOx=½NOyÞ¼ ðJ ðNO2Þ=ðJðNO2Þ þ kNOþO3½O3ÞÞð½NOx=½NOyÞ:
ð6Þ
In winter, NOy and the NOx/NOy ratio were higher than insummer while O3 was lower, leading to higher NO. Itshould be noted that if model-calculated HO2 for winter isused, the compensating effect is much smaller and P(O3)has a more pronounced seasonal variation.[55] In winter, the median P(O3) of about 5–6 ppbv h�1
at 0800–1300 LT is sufficient to cause the observedincrease in Ox of about 5 ppbv over 0600–1300 LT onaverage. This does not exclude possible effects of drydeposition of O3 during the daytime and transport in verticaland horizontal directions. In summer, the median P(O3) isalso apparently sufficient to produce the median increase inOx by about 30 ppbv from 0600 to 1200 LT. However,supply of larger Ox mixing ratios from above by convective
mixing should also play a role, especially on stagnantconditions, as discussed in more detail in section 6.1.
5. NOx Oxidation and NOy Removal
5.1. Estimate of NOy Removal
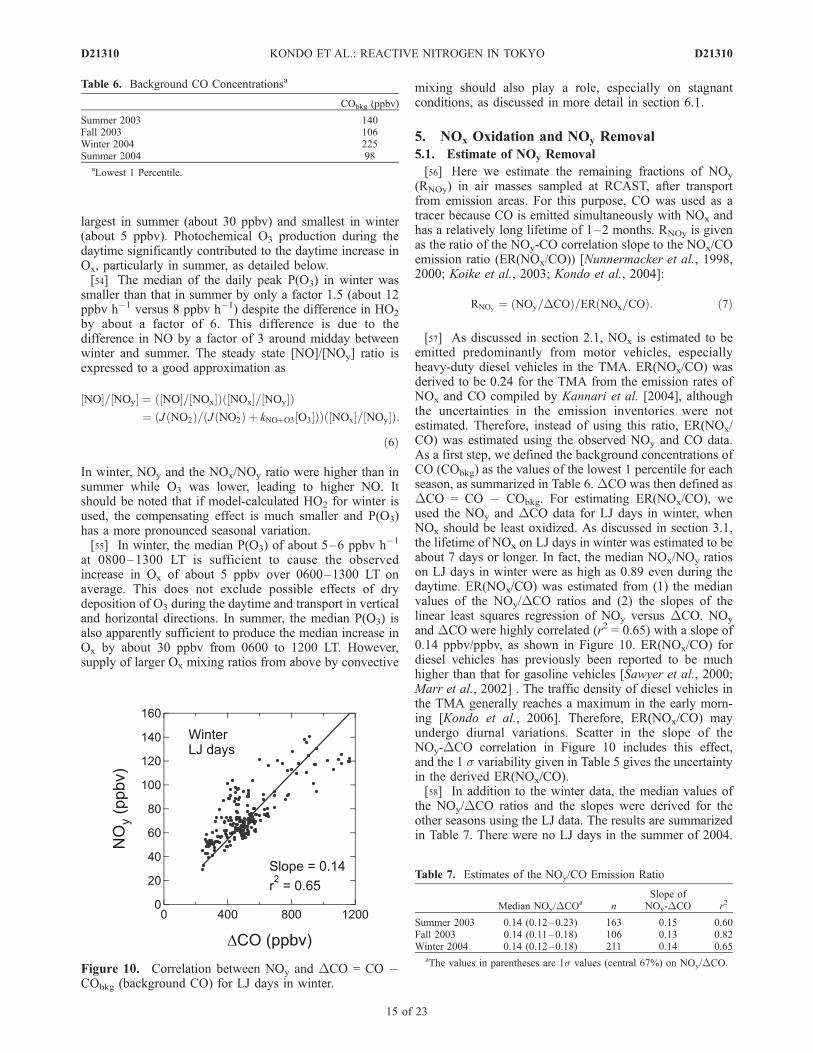
[56] Here we estimate the remaining fractions of NOy
(RNOy) in air masses sampled at RCAST, after transportfrom emission areas. For this purpose, CO was used as atracer because CO is emitted simultaneously with NOx andhas a relatively long lifetime of 1–2 months. RNOy is givenas the ratio of the NOy-CO correlation slope to the NOx/COemission ratio (ER(NOx/CO)) [Nunnermacker et al., 1998,2000; Koike et al., 2003; Kondo et al., 2004]:
RNOy¼ ðNOy=DCOÞ=ERðNOx=COÞ: ð7Þ
[57] As discussed in section 2.1, NOx is estimated to beemitted predominantly from motor vehicles, especiallyheavy-duty diesel vehicles in the TMA. ER(NOx/CO) wasderived to be 0.24 for the TMA from the emission rates ofNOx and CO compiled by Kannari et al. [2004], althoughthe uncertainties in the emission inventories were notestimated. Therefore, instead of using this ratio, ER(NOx/CO) was estimated using the observed NOy and CO data.As a first step, we defined the background concentrations ofCO (CObkg) as the values of the lowest 1 percentile for eachseason, as summarized in Table 6.DCO was then defined asDCO = CO � CObkg. For estimating ER(NOx/CO), weused the NOy and DCO data for LJ days in winter, whenNOx should be least oxidized. As discussed in section 3.1,the lifetime of NOx on LJ days in winter was estimated to beabout 7 days or longer. In fact, the median NOx/NOy ratioson LJ days in winter were as high as 0.89 even during thedaytime. ER(NOx/CO) was estimated from (1) the medianvalues of the NOy/DCO ratios and (2) the slopes of thelinear least squares regression of NOy versus DCO. NOy
and DCO were highly correlated (r2 = 0.65) with a slope of0.14 ppbv/ppbv, as shown in Figure 10. ER(NOx/CO) fordiesel vehicles has previously been reported to be muchhigher than that for gasoline vehicles [Sawyer et al., 2000;Marr et al., 2002] . The traffic density of diesel vehicles inthe TMA generally reaches a maximum in the early morn-ing [Kondo et al., 2006]. Therefore, ER(NOx/CO) mayundergo diurnal variations. Scatter in the slope of theNOy-DCO correlation in Figure 10 includes this effect,and the 1 s variability given in Table 5 gives the uncertaintyin the derived ER(NOx/CO).[58] In addition to the winter data, the median values of
the NOy/DCO ratios and the slopes were derived for theother seasons using the LJ data. The results are summarizedin Table 7. There were no LJ days in the summer of 2004.
Table 6. Background CO Concentrationsa
CObkg (ppbv)
Summer 2003 140Fall 2003 106Winter 2004 225Summer 2004 98
aLowest 1 Percentile.
Figure 10. Correlation between NOy and DCO = CO �CObkg (background CO) for LJ days in winter.
Table 7. Estimates of the NOy/CO Emission Ratio
Median NOy/DCOa nSlope ofNOy-DCO r2
Summer 2003 0.14 (0.12–0.23) 163 0.15 0.60Fall 2003 0.14 (0.11–0.18) 106 0.13 0.82Winter 2004 0.14 (0.12–0.18) 211 0.14 0.65
aThe values in parentheses are 1s values (central 67%) on NOy/DCO.
D21310 KONDO ET AL.: REACTIVE NITROGEN IN TOKYO
15 of 23
D21310
All the values are nearly identical irrespective of season,indicating that the value of 0.14 ppbv/ppbv is a validestimate for ER(NOx/CO).[59] It was found that DEC/DCO ratios were lower by a
factor 2 during the Bon holiday period of 12–14 August2004, than those for the rest of the summer 2004 period. Alikely explanation is that the ratio of diesel trucks to totalvehicles in Tokyo was much lower during this period, whenthere was generally much less traffic. As stated above,emissions from diesel trucks are important sources of NOy
and EC in the TMA. A correction to ER(NOx/EC) wasmade using the change in the diesel trucks/total vehiclesratio estimated from the changes in the DEC/DCO ratio, ina similar way to that described by Kondo et al. [2006]. Thecorrection amounted to about 12%.[60] The RNOy estimated from equation (7) is plotted as a
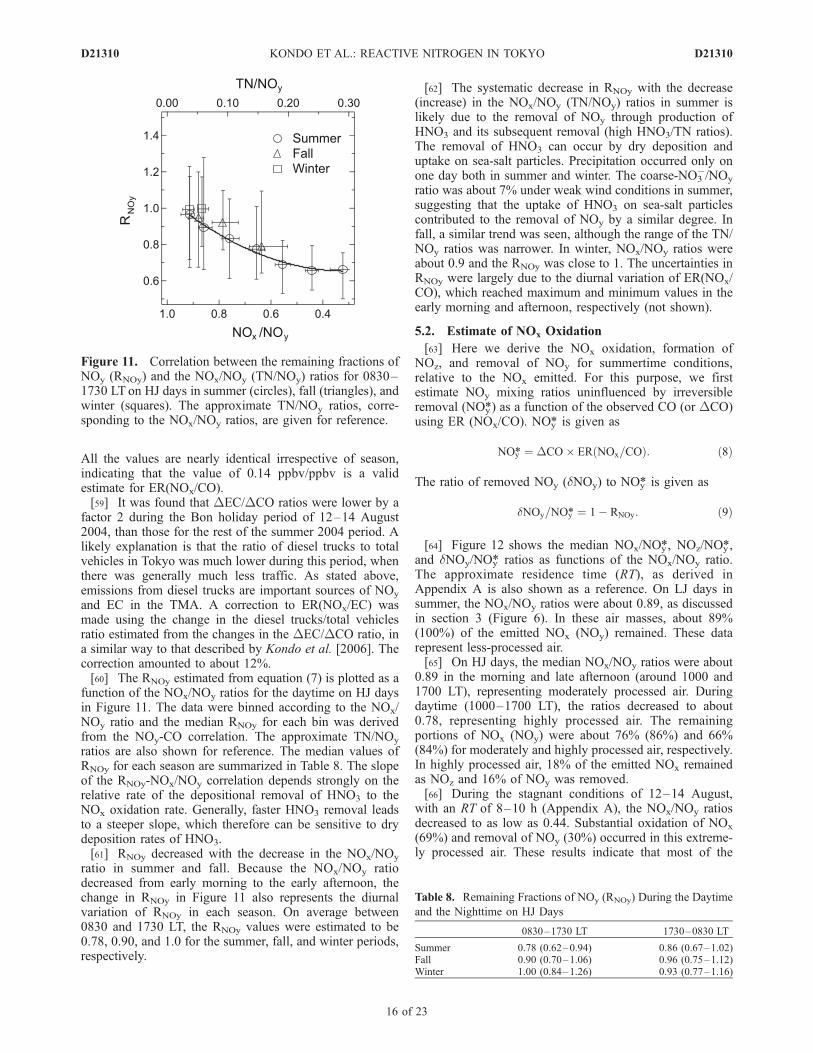
function of the NOx/NOy ratios for the daytime on HJ daysin Figure 11. The data were binned according to the NOx/NOy ratio and the median RNOy for each bin was derivedfrom the NOy-CO correlation. The approximate TN/NOy
ratios are also shown for reference. The median values ofRNOy for each season are summarized in Table 8. The slopeof the RNOy-NOx/NOy correlation depends strongly on therelative rate of the depositional removal of HNO3 to theNOx oxidation rate. Generally, faster HNO3 removal leadsto a steeper slope, which therefore can be sensitive to drydeposition rates of HNO3.[61] RNOy decreased with the decrease in the NOx/NOy
ratio in summer and fall. Because the NOx/NOy ratiodecreased from early morning to the early afternoon, thechange in RNOy in Figure 11 also represents the diurnalvariation of RNOy in each season. On average between0830 and 1730 LT, the RNOy values were estimated to be0.78, 0.90, and 1.0 for the summer, fall, and winter periods,respectively.
[62] The systematic decrease in RNOy with the decrease(increase) in the NOx/NOy (TN/NOy) ratios in summer islikely due to the removal of NOy through production ofHNO3 and its subsequent removal (high HNO3/TN ratios).The removal of HNO3 can occur by dry deposition anduptake on sea-salt particles. Precipitation occurred only onone day both in summer and winter. The coarse-NO3
�/NOy
ratio was about 7% under weak wind conditions in summer,suggesting that the uptake of HNO3 on sea-salt particlescontributed to the removal of NOy by a similar degree. Infall, a similar trend was seen, although the range of the TN/NOy ratios was narrower. In winter, NOx/NOy ratios wereabout 0.9 and the RNOy was close to 1. The uncertainties inRNOy were largely due to the diurnal variation of ER(NOx/CO), which reached maximum and minimum values in theearly morning and afternoon, respectively (not shown).
5.2. Estimate of NOx Oxidation
[63] Here we derive the NOx oxidation, formation ofNOz, and removal of NOy for summertime conditions,relative to the NOx emitted. For this purpose, we firstestimate NOy mixing ratios uninfluenced by irreversibleremoval (NOy*) as a function of the observed CO (or DCO)using ER (NOx/CO). NOy* is given as
NOy* ¼ DCO� ERðNOx=COÞ: ð8Þ
The ratio of removed NOy (dNOy) to NOy* is given as
dNOy=NOy* ¼ 1� RNOy: ð9Þ
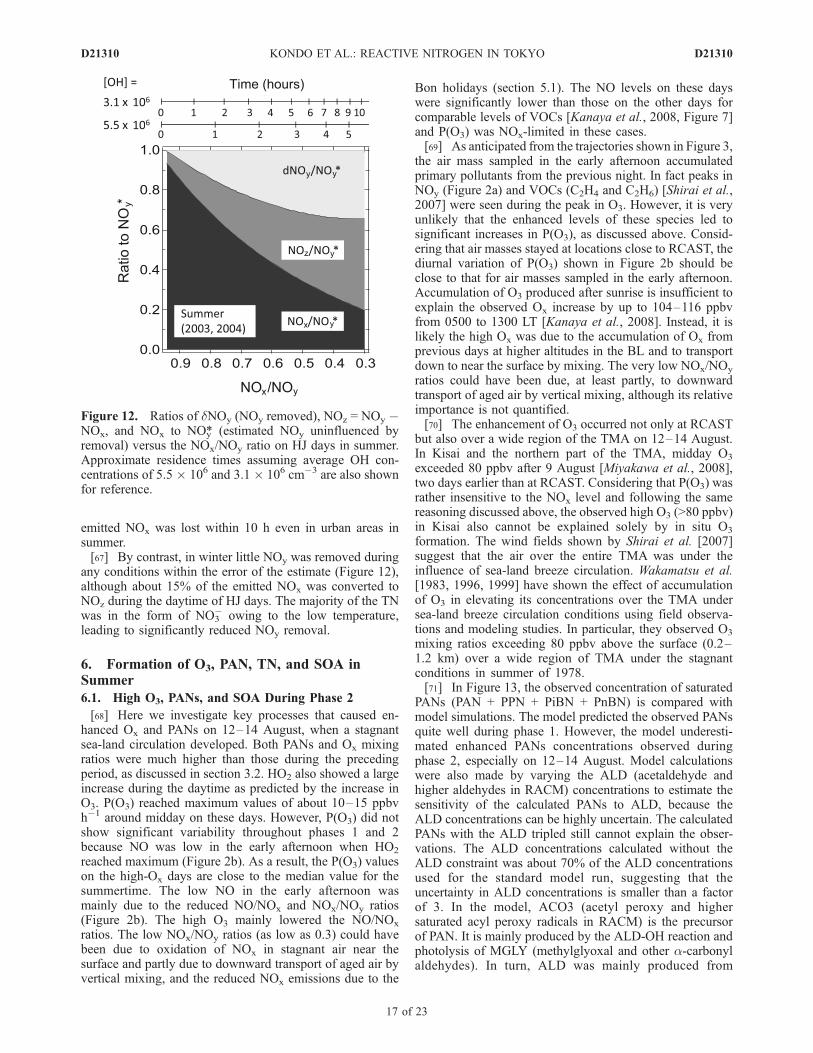
[64] Figure 12 shows the median NOx/NOy*, NOz/NOy*,and dNOy/NOy* ratios as functions of the NOx/NOy ratio.The approximate residence time (RT), as derived inAppendix A is also shown as a reference. On LJ days insummer, the NOx/NOy ratios were about 0.89, as discussedin section 3 (Figure 6). In these air masses, about 89%(100%) of the emitted NOx (NOy) remained. These datarepresent less-processed air.[65] On HJ days, the median NOx/NOy ratios were about
0.89 in the morning and late afternoon (around 1000 and1700 LT), representing moderately processed air. Duringdaytime (1000–1700 LT), the ratios decreased to about0.78, representing highly processed air. The remainingportions of NOx (NOy) were about 76% (86%) and 66%(84%) for moderately and highly processed air, respectively.In highly processed air, 18% of the emitted NOx remainedas NOz and 16% of NOy was removed.[66] During the stagnant conditions of 12–14 August,
with an RT of 8–10 h (Appendix A), the NOx/NOy ratiosdecreased to as low as 0.44. Substantial oxidation of NOx
(69%) and removal of NOy (30%) occurred in this extreme-ly processed air. These results indicate that most of the
Figure 11. Correlation between the remaining fractions ofNOy (RNOy) and the NOx/NOy (TN/NOy) ratios for 0830–1730 LT on HJ days in summer (circles), fall (triangles), andwinter (squares). The approximate TN/NOy ratios, corre-sponding to the NOx/NOy ratios, are given for reference.
Table 8. Remaining Fractions of NOy (RNOy) During the Daytime
and the Nighttime on HJ Days
0830–1730 LT 1730–0830 LT
Summer 0.78 (0.62–0.94) 0.86 (0.67–1.02)Fall 0.90 (0.70–1.06) 0.96 (0.75–1.12)Winter 1.00 (0.84–1.26) 0.93 (0.77–1.16)
D21310 KONDO ET AL.: REACTIVE NITROGEN IN TOKYO
16 of 23
D21310
emitted NOx was lost within 10 h even in urban areas insummer.[67] By contrast, in winter little NOy was removed during
any conditions within the error of the estimate (Figure 12),although about 15% of the emitted NOx was converted toNOz during the daytime of HJ days. The majority of the TNwas in the form of NO3
� owing to the low temperature,leading to significantly reduced NOy removal.
6. Formation of O3, PAN, TN, and SOA inSummer
6.1. High O3, PANs, and SOA During Phase 2
[68] Here we investigate key processes that caused en-hanced Ox and PANs on 12–14 August, when a stagnantsea-land circulation developed. Both PANs and Ox mixingratios were much higher than those during the precedingperiod, as discussed in section 3.2. HO2 also showed a largeincrease during the daytime as predicted by the increase inO3. P(O3) reached maximum values of about 10–15 ppbvh�1 around midday on these days. However, P(O3) did notshow significant variability throughout phases 1 and 2because NO was low in the early afternoon when HO2
reached maximum (Figure 2b). As a result, the P(O3) valueson the high-Ox days are close to the median value for thesummertime. The low NO in the early afternoon wasmainly due to the reduced NO/NOx and NOx/NOy ratios(Figure 2b). The high O3 mainly lowered the NO/NOx
ratios. The low NOx/NOy ratios (as low as 0.3) could havebeen due to oxidation of NOx in stagnant air near thesurface and partly due to downward transport of aged air byvertical mixing, and the reduced NOx emissions due to the
Bon holidays (section 5.1). The NO levels on these dayswere significantly lower than those on the other days forcomparable levels of VOCs [Kanaya et al., 2008, Figure 7]and P(O3) was NOx-limited in these cases.[69] As anticipated from the trajectories shown in Figure 3,
the air mass sampled in the early afternoon accumulatedprimary pollutants from the previous night. In fact peaks inNOy (Figure 2a) and VOCs (C2H4 and C2H6) [Shirai et al.,2007] were seen during the peak in O3. However, it is veryunlikely that the enhanced levels of these species led tosignificant increases in P(O3), as discussed above. Consid-ering that air masses stayed at locations close to RCAST, thediurnal variation of P(O3) shown in Figure 2b should beclose to that for air masses sampled in the early afternoon.Accumulation of O3 produced after sunrise is insufficient toexplain the observed Ox increase by up to 104–116 ppbvfrom 0500 to 1300 LT [Kanaya et al., 2008]. Instead, it islikely the high Ox was due to the accumulation of Ox fromprevious days at higher altitudes in the BL and to transportdown to near the surface by mixing. The very low NOx/NOy
ratios could have been due, at least partly, to downwardtransport of aged air by vertical mixing, although its relativeimportance is not quantified.[70] The enhancement of O3 occurred not only at RCAST
but also over a wide region of the TMA on 12–14 August.In Kisai and the northern part of the TMA, midday O3
exceeded 80 ppbv after 9 August [Miyakawa et al., 2008],two days earlier than at RCAST. Considering that P(O3) wasrather insensitive to the NOx level and following the samereasoning discussed above, the observed high O3 (>80 ppbv)in Kisai also cannot be explained solely by in situ O3
formation. The wind fields shown by Shirai et al. [2007]suggest that the air over the entire TMA was under theinfluence of sea-land breeze circulation. Wakamatsu et al.[1983, 1996, 1999] have shown the effect of accumulationof O3 in elevating its concentrations over the TMA undersea-land breeze circulation conditions using field observa-tions and modeling studies. In particular, they observed O3
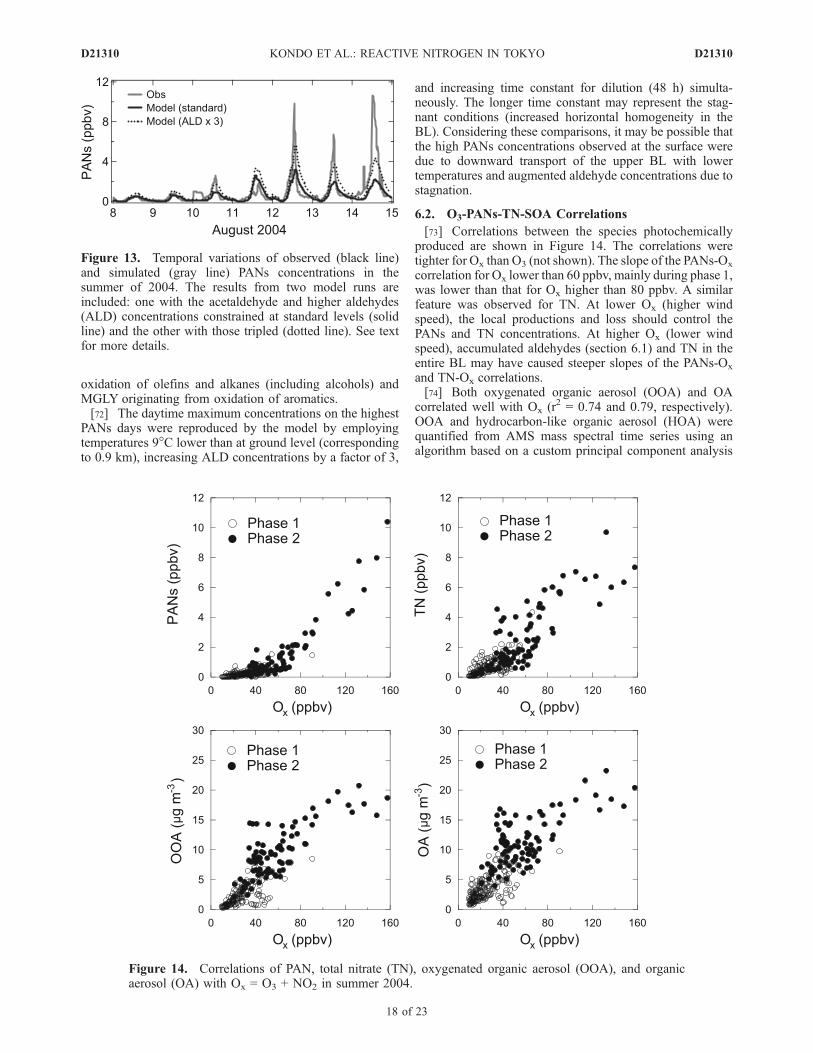
mixing ratios exceeding 80 ppbv above the surface (0.2–1.2 km) over a wide region of TMA under the stagnantconditions in summer of 1978.[71] In Figure 13, the observed concentration of saturated
PANs (PAN + PPN + PiBN + PnBN) is compared withmodel simulations. The model predicted the observed PANsquite well during phase 1. However, the model underesti-mated enhanced PANs concentrations observed duringphase 2, especially on 12–14 August. Model calculationswere also made by varying the ALD (acetaldehyde andhigher aldehydes in RACM) concentrations to estimate thesensitivity of the calculated PANs to ALD, because theALD concentrations can be highly uncertain. The calculatedPANs with the ALD tripled still cannot explain the obser-vations. The ALD concentrations calculated without theALD constraint was about 70% of the ALD concentrationsused for the standard model run, suggesting that theuncertainty in ALD concentrations is smaller than a factorof 3. In the model, ACO3 (acetyl peroxy and highersaturated acyl peroxy radicals in RACM) is the precursorof PAN. It is mainly produced by the ALD-OH reaction andphotolysis of MGLY (methylglyoxal and other a-carbonylaldehydes). In turn, ALD was mainly produced from
Figure 12. Ratios of dNOy (NOy removed), NOz = NOy �NOx, and NOx to NOy* (estimated NOy uninfluenced byremoval) versus the NOx/NOy ratio on HJ days in summer.Approximate residence times assuming average OH con-centrations of 5.5 � 106 and 3.1 � 106 cm�3 are also shownfor reference.
D21310 KONDO ET AL.: REACTIVE NITROGEN IN TOKYO
17 of 23
D21310
oxidation of olefins and alkanes (including alcohols) andMGLY originating from oxidation of aromatics.[72] The daytime maximum concentrations on the highest
PANs days were reproduced by the model by employingtemperatures 9�C lower than at ground level (correspondingto 0.9 km), increasing ALD concentrations by a factor of 3,
and increasing time constant for dilution (48 h) simulta-neously. The longer time constant may represent the stag-nant conditions (increased horizontal homogeneity in theBL). Considering these comparisons, it may be possible thatthe high PANs concentrations observed at the surface weredue to downward transport of the upper BL with lowertemperatures and augmented aldehyde concentrations due tostagnation.
6.2. O3-PANs-TN-SOA Correlations
[73] Correlations between the species photochemicallyproduced are shown in Figure 14. The correlations weretighter for Ox than O3 (not shown). The slope of the PANs-Ox
correlation for Ox lower than 60 ppbv, mainly during phase 1,was lower than that for Ox higher than 80 ppbv. A similarfeature was observed for TN. At lower Ox (higher windspeed), the local productions and loss should control thePANs and TN concentrations. At higher Ox (lower windspeed), accumulated aldehydes (section 6.1) and TN in theentire BL may have caused steeper slopes of the PANs-Ox
and TN-Ox correlations.[74] Both oxygenated organic aerosol (OOA) and OA
correlated well with Ox (r2 = 0.74 and 0.79, respectively).OOA and hydrocarbon-like organic aerosol (HOA) werequantified from AMS mass spectral time series using analgorithm based on a custom principal component analysis
Figure 13. Temporal variations of observed (black line)and simulated (gray line) PANs concentrations in thesummer of 2004. The results from two model runs areincluded: one with the acetaldehyde and higher aldehydes(ALD) concentrations constrained at standard levels (solidline) and the other with those tripled (dotted line). See textfor more details.
Figure 14. Correlations of PAN, total nitrate (TN), oxygenated organic aerosol (OOA), and organicaerosol (OA) with Ox = O3 + NO2 in summer 2004.
D21310 KONDO ET AL.: REACTIVE NITROGEN IN TOKYO
18 of 23
D21310
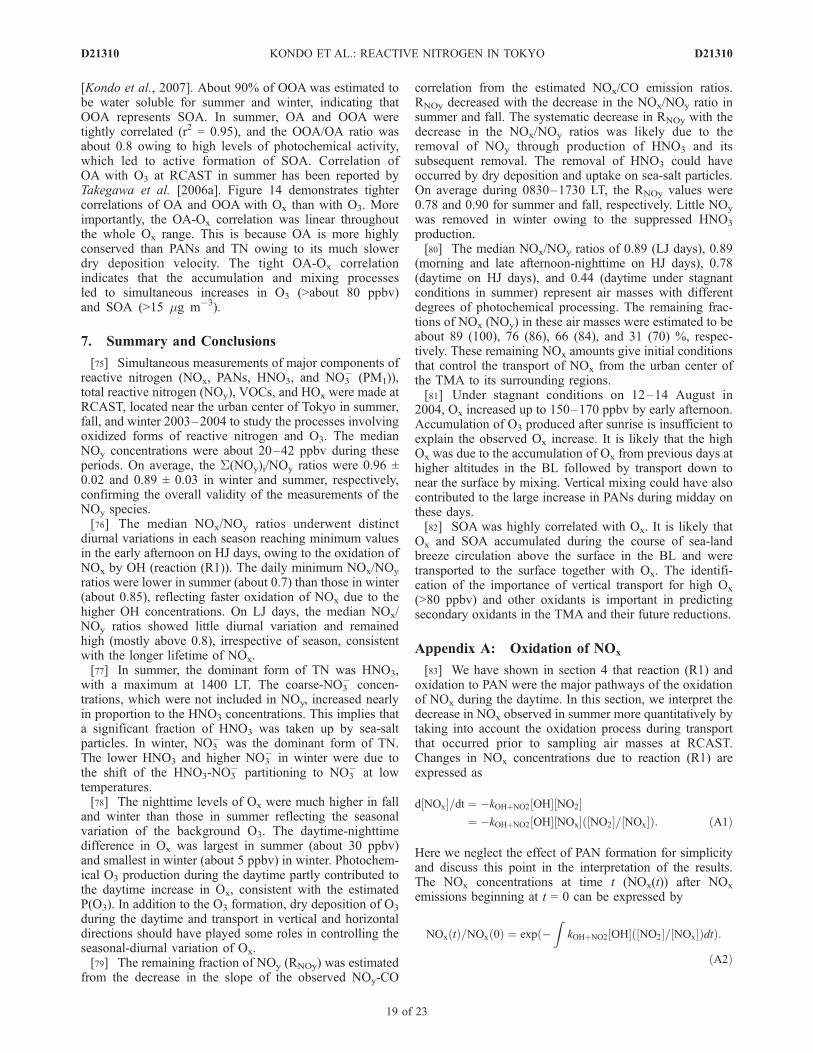
[Kondo et al., 2007]. About 90% of OOA was estimated tobe water soluble for summer and winter, indicating thatOOA represents SOA. In summer, OA and OOA weretightly correlated (r2 = 0.95), and the OOA/OA ratio wasabout 0.8 owing to high levels of photochemical activity,which led to active formation of SOA. Correlation ofOA with O3 at RCAST in summer has been reported byTakegawa et al. [2006a]. Figure 14 demonstrates tightercorrelations of OA and OOA with Ox than with O3. Moreimportantly, the OA-Ox correlation was linear throughoutthe whole Ox range. This is because OA is more highlyconserved than PANs and TN owing to its much slowerdry deposition velocity. The tight OA-Ox correlationindicates that the accumulation and mixing processesled to simultaneous increases in O3 (>about 80 ppbv)and SOA (>15 mg m�3).
7. Summary and Conclusions
[75] Simultaneous measurements of major components ofreactive nitrogen (NOx, PANs, HNO3, and NO3
� (PM1)),total reactive nitrogen (NOy), VOCs, and HOx were made atRCAST, located near the urban center of Tokyo in summer,fall, and winter 2003–2004 to study the processes involvingoxidized forms of reactive nitrogen and O3. The medianNOy concentrations were about 20–42 ppbv during theseperiods. On average, the S(NOy)i/NOy ratios were 0.96 ±0.02 and 0.89 ± 0.03 in winter and summer, respectively,confirming the overall validity of the measurements of theNOy species.[76] The median NOx/NOy ratios underwent distinct
diurnal variations in each season reaching minimum valuesin the early afternoon on HJ days, owing to the oxidation ofNOx by OH (reaction (R1)). The daily minimum NOx/NOy
ratios were lower in summer (about 0.7) than those in winter(about 0.85), reflecting faster oxidation of NOx due to thehigher OH concentrations. On LJ days, the median NOx/NOy ratios showed little diurnal variation and remainedhigh (mostly above 0.8), irrespective of season, consistentwith the longer lifetime of NOx.[77] In summer, the dominant form of TN was HNO3,
with a maximum at 1400 LT. The coarse-NO3� concen-
trations, which were not included in NOy, increased nearlyin proportion to the HNO3 concentrations. This implies thata significant fraction of HNO3 was taken up by sea-saltparticles. In winter, NO3
� was the dominant form of TN.The lower HNO3 and higher NO3
� in winter were due tothe shift of the HNO3-NO3
� partitioning to NO3� at low
temperatures.[78] The nighttime levels of Ox were much higher in fall
and winter than those in summer reflecting the seasonalvariation of the background O3. The daytime-nighttimedifference in Ox was largest in summer (about 30 ppbv)and smallest in winter (about 5 ppbv) in winter. Photochem-ical O3 production during the daytime partly contributed tothe daytime increase in Ox, consistent with the estimatedP(O3). In addition to the O3 formation, dry deposition of O3
during the daytime and transport in vertical and horizontaldirections should have played some roles in controlling theseasonal-diurnal variation of Ox.[79] The remaining fraction of NOy (RNOy) was estimated
from the decrease in the slope of the observed NOy-CO
correlation from the estimated NOx/CO emission ratios.RNOy decreased with the decrease in the NOx/NOy ratio insummer and fall. The systematic decrease in RNOy with thedecrease in the NOx/NOy ratios was likely due to theremoval of NOy through production of HNO3 and itssubsequent removal. The removal of HNO3 could haveoccurred by dry deposition and uptake on sea-salt particles.On average during 0830–1730 LT, the RNOy values were0.78 and 0.90 for summer and fall, respectively. Little NOy
was removed in winter owing to the suppressed HNO3
production.[80] The median NOx/NOy ratios of 0.89 (LJ days), 0.89
(morning and late afternoon-nighttime on HJ days), 0.78(daytime on HJ days), and 0.44 (daytime under stagnantconditions in summer) represent air masses with differentdegrees of photochemical processing. The remaining frac-tions of NOx (NOy) in these air masses were estimated to beabout 89 (100), 76 (86), 66 (84), and 31 (70) %, respec-tively. These remaining NOx amounts give initial conditionsthat control the transport of NOx from the urban center ofthe TMA to its surrounding regions.[81] Under stagnant conditions on 12–14 August in
2004, Ox increased up to 150–170 ppbv by early afternoon.Accumulation of O3 produced after sunrise is insufficient toexplain the observed Ox increase. It is likely that the highOx was due to the accumulation of Ox from previous days athigher altitudes in the BL followed by transport down tonear the surface by mixing. Vertical mixing could have alsocontributed to the large increase in PANs during midday onthese days.[82] SOA was highly correlated with Ox. It is likely that
Ox and SOA accumulated during the course of sea-landbreeze circulation above the surface in the BL and weretransported to the surface together with Ox. The identifi-cation of the importance of vertical transport for high Ox
(>80 ppbv) and other oxidants is important in predictingsecondary oxidants in the TMA and their future reductions.
Appendix A: Oxidation of NOx
[83] We have shown in section 4 that reaction (R1) andoxidation to PAN were the major pathways of the oxidationof NOx during the daytime. In this section, we interpret thedecrease in NOx observed in summer more quantitatively bytaking into account the oxidation process during transportthat occurred prior to sampling air masses at RCAST.Changes in NOx concentrations due to reaction (R1) areexpressed as
d½NOx=dt ¼ �kOHþNO2½OH½NO2¼ �kOHþNO2½OH½NOxð½NO2=½NOxÞ: ðA1Þ
Here we neglect the effect of PAN formation for simplicityand discuss this point in the interpretation of the results.The NOx concentrations at time t (NOx(t)) after NOx
emissions beginning at t = 0 can be expressed by
NOxðtÞ=NOxð0Þ ¼ expð�Z
kOHþNO2½OHð½NO2=½NOxÞdtÞ:
ðA2Þ
D21310 KONDO ET AL.: REACTIVE NITROGEN IN TOKYO
19 of 23
D21310
If average OH concentrations and [NO2]/[NOx] ratios areused for simplicity, equation (A2) is reduced to
NOxðtÞ=NOxð0Þ ¼ expð�kOHþNO2½OHð½NO2=½NOxÞtÞ: ðA3Þ
[84] For the present calculations, the reaction time t wasgiven as the residence time (RT) of the sampled air mass inthe high-NOx emission areas. Spatial variability of the NOx
emission rates in the in high-emission areas is relativelysmall and is not a large source of uncertainty. However,considering that NOx was injected into the sampled airmasses continuously during their transport, the RTs derivedin this way may be overestimates.[85] Figure 3 shows typical backward trajectories of air
masses arriving at RCAST during summer, overlaid withthe emission rates of NOx. The backward trajectories werecalculated using the wind data obtained at RCAST, becausethe winds in summer were generally southerly during thedaytime owing to the sea breeze in the high-NOx area. Thehigh-emission areas in the study region are marked in red.Spatial inhomogeneity of wind fields within the high-NOx
areas introduced some errors in the trajectory calculations.The wind speeds measured by Japan Meteorological Agen-cy at Yokohama (30 km south of RCAST) and Nerima(10 km north of RCAST) were stronger and weaker byfactors 2.2 and 0.65, respectively than those at RCAST onthese days on average. The wind directions at Yokohamaand Nerima were to within ±28� of those at RCAST.However, it is very difficult to estimate errors in RT bythis inhomogeneity, because of the complexity of a windsystem of this scale.[86] The backward trajectory for 2 August is typical for the
observational period from 1–9 August 2004. Air masses
arriving at RCAST remained in the high-emission areas for afew hours. On the other hand, the backward trajectory for13 August is typical for 10–14 August. The air massesstagnated owing to the development of the sea-land breezecirculation, and the air masses sampled at RCAST remainedin the emission areas for about 10 h. The RT values estimatedfor the summer period typically range over 1.5–6.0 h.[87] The photochemical ages (PA) of air masses can be
estimated using the ratio of alkyl nitrates to their parenthydrocarbons [Bertman et al., 1995]. For the present anal-ysis, the ratio of 2-pentyl nitrate (2-PeONO2) to n-pentane(n-C5H12) was chosen [Simpson et al., 2003; Takegawa etal., 2006b]. The 2-PeONO2/n-C5H12 ratio and PA (or t) arerelated as
2-PeONO2½ n-C5H12½ ¼ bkA
ðkB � kAÞ1� eðkA�kBÞt
� �; ðA4Þ
where b is the fractional yield, and kA and kB are the pseudo-first-order rate coefficients for the formation and destructionof 2-PeONO2, respectively. Values of these parameters fortypical midlatitude surface conditions during spring weregiven by Simpson et al. [2003]. The coefficient kB is afunction of [OH]. We assumed average values of [OH] =5.5 � 106 cm�3 (1000–1500 LT) and 3.1 � 106 cm�3
(0500–1900 LT), which gave RT/PA ratios of 1.6 ± 0.80 and1.2 ± 0.6, respectively, with r2 = 0.31 for the RT-PAcorrelation. The results showing RT/PA ratios larger than 1are consistent with the possible overestimation of RT,although other factors, including effects of vertical mixing,also introduce additional uncertainties. These resultssuggest RT can be used as a qualitative measure of airmass age. The uncertainties discussed above will be greatlyreduced if the plumes are well defined, as has been done foraircraft studies of plumes from power plants [e.g.,Nunnermacker et al., 1998, 2000; Neuman et al., 2002,2004].[88] Using the RT, we investigate the validity of equation
(A3). If NOy is conserved, NOx(0) = NOy. Figure A1 showsthe relationships between the observed NOx/NOy ratios withthe exp(�k1[OH]([NO2]/[NOx])t) value calculated for theaverage [OH] = 5.5 � 106 cm�3 (1000–1500 LT). The datapoints for which the PA values were obtained are depicted astriangles. The median NOx/NOy ratios for each bin arecorrelated well with exp(�k1[OH]([NO2]/[NOx])RT) (r
2 =0.96) with a slope of 0.82. The scatter of the correlation canarise partly from the uncertainties in the estimate of RT, asdiscussed above.[89] Some fractions of NOy were found to have been
removed during transport, as discussed in section 6.1. ANOy value that was corrected for this removal, denotedNOy*, was also used for NOx(0) for comparison. Using theNOy* values did not significantly alter the correlation (r2 =0.91) and slope (=0.85). The correction by NOy* becomesimportant for the lowest NOx/NOy ratios. Because thefraction of these data is small, the NOy* correction is notimportant in this case. It should be noted that NOx lost toPANs is not considered in equation (1). The time constant ofPAN formation is different from HNO3 formation, althoughreactions of OH with VOCs are involved in PANs forma-tion. In addition, formation of alkyl nitrate is also animportant pathway for NOx oxidation [e.g., Day et al.,
Figure A1. Correlation of the NOx/NOy ratio with thefraction of remaining NOx estimated as exp(�k1[OH]([NO2]/[NOx])t) on HJ days in summer. The slope and r2 for thecorrelation for the binned exp(�k1[OH]([NO2]/[NOx])t)values are 0.82 and 0.96, respectively. The slope and r2
using all the data points are 0.69 and 0.48, respectively. Thedata points, for which photochemical ages were obtained, aredepicted as triangles.
D21310 KONDO ET AL.: REACTIVE NITROGEN IN TOKYO
20 of 23
D21310
2003], as discussed in section 4.6. Therefore, the termexp(�kOH + NO2 [OH]([NO2]/[NOx])t) should be consideredto represent a qualitative measure of chemical aging of NOx,rather than a quantitative measure of NOx oxidation. Inpractice, the reasonably good correlation of this term withthe NOx/NOy ratios and the slope of 0.82 suggests that theNOx/NOy ratios approximately represent air mass ages dueto oxidation along trajectories.
[90] Acknowledgments. This work was supported by the Ministry ofEducation, Culture, Sports, Science, and Technology (MEXT), the globalenvironment research fund of the Japanese Ministry of the Environment(B-083), and the Japanese Science and Technology Agency (J. S. T.). Wethank I. J. Simpson for providing critical comments on this paper. We alsothank Y. Komazaki for assistance in the field experiments.
ReferencesBertman, S. B., J. M. Roberts, D. D. Parrish, M. P. Buhr, P. D. Goldan,W. C. Kuster, and F. C. Fehsenfeld (1995), Evolution of alkyl nitrateswith air mass age, J. Geophys. Res., 100, 22,805–22,813.
Blake, N. J., D. R. Blake, A. L. Swanson, E. Atlas, F. Flocke, and F. S.Rowland (2003a), Latitudinal, vertical, and seasonal variations of C1�C4
alkyl nitrates in the troposphere over the Pacific Ocean during PEM-Tropics A and B: Oceanic and continental sources, J. Geophys. Res.,108(D2), 8242, doi:10.1029/2001JD001444.
Blake, N. J., D. R. Blake, B. C. Sive, A. S. Katzenstein, S. Meinardi, O. W.Wingenter, E. L. Atlas, F. Flocke, B. A. Ridley, and F. S. Rowland(2003b), The seasonal evolution of NMHCs and light alkyl nitrates atmiddle to high northern latitudes during TOPSE, J. Geophys. Res.,108(D4), 8359, doi:10.1029/2001JD001467.
Cleary, P. A., J. G. Murphy, P. J. Wooldridge, D. A. Day, D. B. Millet, M.McKay, A. H. Goldstein, and R. C. Cohen (2005), Observations of totalalkyl nitrates within the Sacramento urban plume, Atmos. Chem. Phys.Disc., 5, 4801–4843.
Davies, J. A., and R. A. Cox (1998), Kinetics of the heterogeneous reactionof HNO3 with NaCl: Effect of water vapor, J. Phys. Chem. A, 102, 7631–7642, doi:10.1021/jp982134t.
Day, D. A., P. J. Wooldridge, M. B. Dillon, J. A. Thornton, and R. C. Cohen(2002), A thermal dissociation laser-induced fluorescence instrument forin situ detection of NO2, peroxy nitrates, alkyl nitrates, and HNO3,J. Geophys. Res., 107(D6), 4046, doi:10.1029/2001JD000779.
Day, D. A., M. B. Dillon, P. J. Wooldridge, J. A. Thornton, R. S. Rosen,E. C. Wood, and R. C. Cohen (2003), On alkyl nitrates, O3, and the‘‘missing NOy’’, J. Geophys. Res., 108(D16), 4501, doi:10.1029/2003JD003685.
de Gouw, J. A., et al. (2005), Budget of organic carbon in a pollutedatmosphere: Results from the New England Air Quality Study in 2002,J. Geophys. Res., 110, D16305, doi:10.1029/2004JD005623.
DeMore, W. B., S. P. Sander, C. J. Howard, A. R. Ravishankara, D. M.Golden, C. E. Kolb, R. F. Hampson, M. J. Kurylo, and M. J. Molina(1997), Chemical kinetics and photochemical data for use in strato-spheric modeling, Eval. 12, Jet Propul. Lab., Calif. Inst. of Technol.,Pasadena.
Ehhalt, D. H., and F. Rohrer (2000), Dependence of the OH concentrationon solar UV, J. Geophys. Res., 105, 3565–3571.
Fahey, D. W., G. Hubler, D. D. Parrish, E. J. Williams, R. B. Norton, B. A.Ridley, H. B. Singh, S. C. Liu, and F. C. Fehsenfeld (1986), Reactivenitrogen species in the troposphere: Measurements of NO, NO2, HNO3,particulate nitrate, peroxyacetyl nitrate (PAN), O3, and total reactive oddnitrogen (NOy) at Niwot Ridge, J. Geophys. Res., 91, 9781–9793.
Fehsenfeld, F. C., et al. (1987), A ground-based intercomparison of NO,NOx, and NOy measurement techniques, J. Geophys. Res., 92, 14,710–14,722.
Fischer, E., A. Pszenny, W. Keene, J. Maben, A. Smith, A. Stohl, and R.Talbot (2006), Nitric acid phase partitioning and cycling in the NewEngland coastal atmosphere, J. Geophys. Res., 111, D23S09,doi:10.1029/2006JD007328.
Griffin, R. J., D. R. Cocker III, R. C. Flagan, and J. H. Seinfeld (1999),Organic aerosol formation from the oxidation of biogenic hydrocarbons,J. Geophys. Res., 104, 3555–3567.
Guimbaud, C., F. Arens, L. Gutzwiller, H. W. Gaggeler, and M. Ammann(2002), Uptake of HNO3 to deliquescent sea-salt particles, Atmos. Chem.Phys. Disc., 2, 739–763.
Guttikunda, S. K., Y. Tang, G. R. Carmichael, G. Kurata, L. Pan, D. G.Streets, J. H. Woo, N. Thongboonchoo, and A. Fried (2005), Impacts ofAsian megacity emissions on regional air quality during spring 2001,J. Geophys. Res., 110, D20301, doi:10.1029/2004JD004921.
Harder, J. W., J. W. Brault, P. V. Johnston, and G. H. Mount (1997),Temperature dependent NO2 cross sections at high spectral resolution,J. Geophys. Res., 102(D3), 3861–3879.
Hoffmann, T., J. R. Odum, F. Bowman, D. Collins, D. Klockow, R. C.Flagan, and J. H. Seinfeld (1997), Formation of organic aerosols from theoxidation of biogenic hydrocarbons, J. Atmos. Chem., 26, 189–222,doi:10.1023/A:1005734301837.
Kalberer, M., J. Yu, D. R. Cocker, R. C. Flagan, and J. H. Seinfeld (2000),Aerosol formation in the cyclohexene-ozone system, Environ. Sci. Tech-nol., 34, 4894–4901, doi:10.1021/es001180f.
Kanaya, Y., Y. Sadanaga, J. Hirokawa, Y. Kajii, and H. Akimoto (2001a),Development of a ground-based LIF instrument for measuring HOx ra-dicals: Instrumentation and calibrations, J. Atmos. Chem., 38, 73–110,doi:10.1023/A:1026559321911.
Kanaya, Y., Y. Sadanaga, K. Nakamura, and H. Akimoto (2001b), Behaviorof OH and HO2 radicals during the observations at a Remote Island ofOkinawa (ORION99) field campaign: 1. Observation using a laser-inducedfluorescence instrument, J. Geophys. Res., 106, 24,197–24,208.
Kanaya, Y., R. Cao, H. Akimoto, M. Fukuda, Y. Komazaki, Y. Yokouchi,M. Koike, H. Tanimoto, N. Takegawa, and Y. Kondo (2007), Urbanphotochemistry in central Tokyo: 1. Observed and modeled OH andHO2 radical concentrations during the winter and summer of 2004,J. Geophys. Res., 112, D21312, doi:10.1029/2007JD008670.
Kanaya, Y., M. Fukuda, H. Akimoto, N. Takegawa, Y. Komazaki,Y. Yokouchi, M. Koike, and Y. Kondo (2008), Urban photochemistryin central Tokyo: 2. Rate and regimes of oxidant (O3 + NO2) produc-tion, J. Geophys. Res., 113, D06301, doi:10.1029/2007JD008671.
Kannari, A., T. Baba, H. Ueda, Y. Tonooka, and K. Matsuda (2004), Devel-opment of a grid database on atmospheric pollutants emissions in Japan(in Japanese), J. Jpn. Soc. Atmos. Environ., 39(6), 257–271.
Kita, K., et al. (2006), A chemical ionization mass spectrometer for ground-based measurement of nitric acid, J. Atmos. Oceanic Technol., 23, 1104–1113, doi:10.1175/JTECH1900.1.
Kleinman, L. I., P. H. Daum,Y.-N. Lee, L. J. Nunnermacker, S. R. Springston,J. W. Weinstein-Lloyd, and J. Rudolph (2005), A comparative study ofozone production in five U.S. metropolitan areas, J. Geophys. Res., 110,D02301, doi:10.1029/2004JD005096.
Koike, M., et al. (2003), Export of anthropogenic reactive nitrogen andsulfur compounds from the East Asia region in spring, J. Geophys.Res., 108(D20), 8789, doi:10.1029/2002JD003284.
Kondo, Y., et al. (1997), Profiles and partitioning of reactive nitrogen overthe Pacific Ocean in winter and early spring, J. Geophys. Res., 102,28,405–28,424.
Kondo, Y., et al. (2004), Impact of biomass burning in Southeast Asia onozone and reactive nitrogen over the western Pacific in spring, J. Geo-phys. Res., 109, D15S12, doi:10.1029/2003JD004203.
Kondo, Y., et al. (2006), Temporal variations of elemental carbon in Tokyo,J. Geophys. Res., 111, D12205, doi:10.1029/2005JD006257.
Kondo, Y., Y. Miyazaki, N. Takegawa, T. Miyakawa, R. J. Weber, J. L.Jimenez, Q. Zhang, and D. R. Worsnop (2007), Oxygenated and water-soluble organic aerosols in Tokyo, J. Geophys. Res., 112, D01203,doi:10.1029/2006JD007056.
Kondo, Y., et al. (2008), Mechanisms that influence the formation of high-ozone regions in the boundary layer downwind of the Asian continent inwinter and spring, J. Geophys. Res., 113, D15304, doi:10.1029/2007JD008978.
Marr, L. C., D. R. Black, and R. A. Harley (2002), Formation of photo-chemical air pollution in central California: 1. Development of a revisedmotor vehicle emission inventory, J. Geophys. Res., 107(D6), 4047,doi:10.1029/2001JD000689.
McKenzie, R., P. Johnston, A. Hofzumahaus, A. Kraus, S. Madronich,C. Cantrell, J. Calvert, and R. Shetter (2002), Relationship betweenphotolysis frequencies derived from spectroscopic measurement of acti-nic fluxes and irradiances during the IPMMI campaign, J. Geophys. Res.,107(D5), 4042, doi:10.1029/2001JD000601.
McKenzie, R. L., C. Weinreis, P. V. Johnston, B. Liley, H. Shiona,M. Kotkamp, D. Smale, N. Takegawa, and Y. Kondo (2008), Effects ofurban pollution on UV spectral irradiance, Atmos. Chem. Phys., 8,5683–5697.
Miguel, A. H., T. W. Kirchstetter, and R. A. Harley (1998), On-road emis-sions of particulate polycyclic aromatic hydrocarbons and black carbonfrom gasoline and diesel vehicles, Environ. Sci. Technol., 32, 450–455,doi:10.1021/es970566w.
Miyakawa, T., N. Takegawa, and Y. Kondo (2008), Photochemical evolu-tion of submicron aerosol chemical composition in the Tokyo megacityregion in summer, J. Geophys. Res., 113, D14304, doi:10.1029/2007JD009493.
Miyazaki, Y., et al. (2005), Contribution of particulate nitrate to airbornemeasurements of total reactive nitrogen, J. Geophys. Res., 110, D15304,doi:10.1029/2004JD005502.
D21310 KONDO ET AL.: REACTIVE NITROGEN IN TOKYO
21 of 23
D21310
Molina, L. T., and M. J. Molina (1986), Absolute absorption cross-sectionsof ozone in the 185 to 350 nm wavelength range, J. Geophys. Res.,91(D13), 14,501–14,508.
Morino, Y., Y. Kondo, N. Takegawa, Y. Miyazaki, K. Kita, Y. Komazaki,M. Fukuda, T. Miyakawa, N. Moteki, and D. R. Worsnop (2006), Parti-tioning of HNO3 and particulate nitrate over Tokyo: Effect of verticalmixing, J. Geophys. Res., 111, D15215, doi:10.1029/2005JD006887.
Murayama, T., H. Okamoto, N. Kaneyasu, H. Kamataki, and K. Miura(1999), Application of lidar depolarization measurement in the atmo-spheric boundary layer: Effects of dust and sea-salt particles, J. Geophys.Res., 104, 31,781–31,792.
Nakamura, K., et al. (2003), Measurement of NO2 by photolysis conversiontechnique during TRACE-P, J. Geophys. Res., 108(D24), 4752,doi:10.1029/2003JD003712.
Neuman, J. A., et al. (2002), Fast-response airborne in situ measurements ofHNO3 during the Texas 2000 Air Quality Study, J. Geophys. Res.,107(D20), 4436, doi:10.1029/2001JD001437.
Neuman, J. A., D. D. Parrish, T. B. Ryerson, C. A. Brock, C. Wiedinmyer,G. J. Frost, J. S. Holloway, and F. C. Fehsenfeld (2004), Nitric acid lossrates measured in power plant plumes, J. Geophys. Res., 109, D23304,doi:10.1029/2004JD005092.
Nunnermacker, L. J., et al. (1998), Characterization of the Nashville urbanplume on July 3 and July 18, 1995, J. Geophys. Res., 103(D21), 28,129–28,148.
Nunnermacker, L. J., K. I. Kleinman, D. Imre, P. H. Daum, Y.-N. Lee, J. H.Lee, S. R. Springston, and L. Newman (2000), NOy lifetimes and O3
production efficiencies in urban and power plant plumes: Analysis offield data, J. Geophys. Res., 105, 9165–9176.
O’Brien, J. M., P. B. Shepson, Q. Wu, T. Biesenthal, J. W. Bottenheim,H. A. Wiebe, K. G. Anlauf, and P. Brickell (1997), Production anddistribution of organic nitrates, and their relationship to carbonyl compoundsin an urban environment, Atmos. Environ., 31, 2059–2069, doi:10.1016/S1352-2310(97)80002-7.
Odum, J. R., T. P. W. Jungkamp, R. J. Griffin, R. C. Flagan, and J. H.Seinfeld (1997), The atmospheric aerosol-forming potential of wholegasoline vapor, Science, 276, 96–99, doi:10.1126/science.276.5309.96.
Parrish, D. D., et al. (1993), The total reactive oxidized nitrogen levels andthe partitioning between the individual species at six rural sites in easternNorth America, J. Geophys. Res., 98, 2927–2939.
Parrish, D. D., M. Trainer, J. S. Holloway, J. E. Yee, M. S. Warshawsky,and F. C. Fehsenfeld (1998), Relationships between ozone and carbonmonoxide at surface sites in the North Atlantic region, J. Geophys. Res.,103, 13,357–13,376.
Parrish, D. D., M. Trainer, D. Hereid, E. J. Williams, K. J. Olszyna, R. A.Harley, J. F. Meagher, and F. C. Fehsenfeld (2002), Decadal change incarbon monoxide to nitrogen oxide ratio in U.S. vehicular emissions,J. Geophys. Res., 107(D12), 4140, doi:10.1029/2001JD000720.
Ramanathan, V., et al. (2007), Atmospheric brown clouds: Hemisphericaland regional variations in long-range transport, absorption, and radiativeforcing, J. Geophys. Res., 112, D22S21, doi:10.1029/2006JD008124.
Ridley, B. A., J. G. Walega, J.-F. Lamarque, F. E. Grahek, M. Trainer, G.Hubler, X. Lin, and F. C. Fehsenfeld (1998), Measurements of reactivenitrogen and ozone to 5-km altitude in June 1990 over the southeasternUnited States, J. Geophys. Res., 103, 8369–8388.
Roberts, J. M., et al. (2001), Observations of APAN during TexAQS 2000,Geophys. Res. Lett., 28, 4195–4198.
Rosen, R. S., E. C. Wood, P. J. Wooldridge, J. A. Thornton, D. A. Day,W. Kuster, E. J. Williams, B. T. Jobson, and R. C. Cohen (2004),Observations of total alkyl nitrates during Texas Air Quality Study2000: Implications for O3 and alkyl nitrate photochemistry, J. Geophys.Res., 109, D07303, doi:10.1029/2003JD004227.
Ryerson, T. R., et al. (1998), Emission lifetimes and ozone formation inpower plant plumes, J. Geophys. Res., 103, 22,569–22,583.
Ryerson, T. R., et al. (2003), Effect of photochemical industrial emissionsof reactive alkenes and NOx on tropospheric ozone formation in Houston,Texas, J. Geophys. Res., 108(D8), 4249, doi:10.1029/2002JD003070.
Sawyer, R. F., R. A. Harley, S. H. Cadle, J. M. Norbeck, R. Slott, and H. A.Bravo (2000), Mobile sources critical review: 1998 NARSTO assess-ment, Atmos. Environ. , 34 , 2161 – 2181, doi:10.1016/S1352-2310(99)00463-X.
Seinfeld, J. H., and S. N. Pandis (2006), Atmospheric Chemistry andPhysics: From Air Pollution to Climate Change, 1203 pp., John Wiley,New York.
Shirai, T., Y. Yokouchi, D. R. Blake, K. Kita, K. Izumi, M. Koike,Y. Komazaki, Y. Miyazaki, M. Fukuda, and Y. Kondo (2007), Seasonalvariations of atmospheric C2-C7 nonmethane hydrocarbons in Tokyo,J. Geophys. Res., 112, D24305, doi:10.1029/2006JD008163.
Sillman, S. (1999), The relation between ozone, NOx, and hydrocarbons inurban and polluted rural environments, Atmos. Environ., 33, 1821–1845,doi:10.1016/S1352-2310(98)00345-8.
Simpson, I. J., et al. (2003), Photochemical production and evolution ofselected C2�C5 alkyl nitrates in tropospheric air influenced by Asianoutflow, J. Geophys. Res., 108(D20), 8808, doi:10.1029/2002JD002830.
Singh, H. B., L. J. Salas, and W. Viezee (1986), Global distribution ofperoxyacetyl nitrate, Nature, 321, 588–591, doi:10.1038/321588a0.
Spokes, L. J., S. G. Yeatman, S. E. Cornell, and T. D. Jickells (2000),Nitrogen deposition to the eastern Atlantic Ocean: The importance ofsouth-easterly flow, Tellus, Ser. B, 52, 37 – 49, doi:10.1034/j.1600-0889.2000.00062.x.
Stockwell, W. R., F. Kirchner, M. Kuhn, and S. Seefeld (1997), A newmechanism for regional atmospheric chemistry modeling, J. Geophys.Res., 102, 25,847–25,879.
Sullivan, A. P., R. E. Peltier, C. A. Brock, J. A. de Gouw, J. S. Holloway,C. Warneke, A. G. Wollny, and R. J. Weber (2006), Airborne measure-ments of carbonaceous aerosol soluble in water over northeastern Uni-ted States: Method development and an investigation into water-solubleorganic carbon sources, J. Geophys. Res., 111, D23S46, doi:10.1029/2006JD007072.
Takegawa, N., et al. (2004), Removal of NOx and NOy in Asian outflowplumes: Aircraft measurements over the western Pacific in January 2002,J. Geophys. Res., 109, D23S04, doi:10.1029/2004JD004866.
Takegawa, N., Y. Miyazaki, Y. Kondo, Y. Komazaki, T. Miyakawa, J. L.Jimenez, J. T. Jayne, D. R. Worsnop, J. D. Allan, and R. J. Weber (2005),Characterization of an Aerodyne Aerosol Mass Spectrometer (AMS):Intercomparison with other aerosol instruments, Aerosol Sci. Technol.,39, 760–770.
Takegawa, N., T. Miyakawa, Y. Kondo, J. L. Jimenez, D. R. Worsnop,and M. Fukuda (2006a), Seasonal and diurnal variations of submicronorganic aerosols in Tokyo observed using the Aerodyne aerosol massspectrometer, J. Geophys. Res., 111, D11206, doi:10.1029/2005JD006515.
Takegawa, N., et al. (2006b), Evolution of submicron organic aerosol inpolluted air exported from Tokyo, Geophys. Res. Lett., 33, L15814,doi:10.1029/2006GL025815.
Tanimoto, A., and H. Akimoto (2001), A new peroxycarboxylic nitricanhydride identified in the atmosphere: CH2 = CHC (O)OONO2 (APAN),Geophys. Res. Lett., 28, 2831–2834.
Tanimoto, H., J. Hirokawa, Y. Kajii, and H. Akimoto (1999), A new mea-surement technique of peroxyacetyl nitrate at parts per trillion by volumelevels: Gas chromatography/negative ion chemical ionization mass spec-trometry, J. Geophys. Res., 104, 21,343–21,354.
Tanimoto, H., H. Furutani, S. Kato, J. Matsumoto, Y. Makide, andH. Akimoto (2002), Seasonal cycles of ozone and oxidized nitrogen speciesin Northeast Asia: 1. Impact of regional climatology and photochemistryobserved during RISOTTO 1999–2000, J. Geophys. Res., 107(D24),4747, doi:10.1029/2001JD001496.
Tanimoto, H., Y. Sawa, H. Matsueda, I. Uno, T. Ohara, K. Yamaji, andS. Yonemura (2005), Significant latitudinal gradient in the surface ozonespring maximum over East Asia, Geophys. Res. Lett., 32, L21805,doi:10.1029/2005GL023514.
Thornton, J. A., et al. (2002), Ozone production rates as a function of NOx
abundances and HOx production rates in the Nashville urban plume,J. Geophys. Res., 107(D12), 4146, doi:10.1029/2001JD000932.
Tie, X., et al. (2003), Effect of sulfate aerosol on tropospheric NOx andozone budgets: Model simulations and TOPSE evidence, J. Geophys.Res., 108(D4), 8364, doi:10.1029/2001JD001508.
Wakamatsu, S., Y. Ogawa, K. Murano, K. Goi, and Y. Aburamoto (1983),Aircraft survey of the secondary photochemical pollutants covering theTokyo metropolitan area, Atmos. Environ., 17(4), 827–835, doi:10.1016/0004-6981(83)90434-1.
Wakamatsu, S., T. Ohara, and I. Uno (1996), Recent trends in precursorconcentrations and oxidant distributions in the Tokyo and Osakaareas, Atmos. Environ., 30(5), 715–721, doi:10.1016/1352-2310(95)00274-X.
Wakamatsu, S., I. Uno, T. Ohara, and K. L. Schere (1999), A study ofthe relationship between photochemical ozone and its precursor emis-sions of nitrogen oxides and hydrocarbons in Tokyo and surroundingareas, Atmos. Environ., 33(19), 3097 – 3108, doi:10.1016/S1352-2310(97)00493-7.
�����������������������D. R. Blake, Department of Chemistry, University of California, Irvine,
Irvine, CA 92697-2025, USA. ([email protected])M. Fukuda, Y. Kondo (corresponding author), and N. Takegawa,
Research Center for Advanced Science and Technology, University ofTokyo, 4-6-1 Komaba, Meguro-ku, Tokyo 153-8904, Japan. ([email protected]; [email protected])P. Johnston and R.McKenzie, National Institute ofWater and Atmospheric
Research, Lauder, Central Otago, New Zealand. ([email protected];[email protected])
D21310 KONDO ET AL.: REACTIVE NITROGEN IN TOKYO
22 of 23
D21310

Y. Kanaya, Frontier Research Center for Global Change, Japan Agencyfor Marine-Earth Science and Technology, 3173-25 Showa-machi,Kanazawa-ku, Yokohama, Kanagawa 236-0001, Japan. ([email protected])M. Koike, Department of Earth and Planetary Science, Graduate School
of Science, University of Tokyo, Hongo 7-3-1, Bunkyo-ku, Tokyo 113-0033, Japan. ([email protected])
Y. Miyazaki, Institute of Low Temperature Science, Hokkaido University,Kita-19, Nishi-8, Kita-ku, Sapporo 060-0819, Japan. ([email protected])Y. Morino and H. Tanimoto, Asian Environment Research Group,
National Institute for Environmental Studies, Tsukuba, Ibaraki 305-8506,Japan. ([email protected]; [email protected])T. Murayama, Faculty of Marine Technology, Tokyo University of
Marine Science and Technology, 2-1-6 Etchujima, Koto, Tokyo 135-8533,Japan. ([email protected])
D21310 KONDO ET AL.: REACTIVE NITROGEN IN TOKYO
23 of 23
D21310