formalizing the concepts: simple random sampling
TRANSCRIPT

Formalizing the Concepts:Formalizing the Concepts:Simple Random SamplingSimple Random Sampling

Purpose of samplingPurpose of sampling
To study a sample of the population to To study a sample of the population to acquire knowledge –by observing the units acquire knowledge –by observing the units selected typified by households, persons, selected typified by households, persons,
institutions, or physical objects – and making institutions, or physical objects – and making quantitative statements about the entire quantitative statements about the entire
populationpopulation


Purpose of samplingPurpose of sampling
Why sampling?Why sampling?
Saves Saves costcost compared to full enumeration compared to full enumeration
Easier to control Easier to control qualityquality of sample of sample
More More timelytimely results from sample data results from sample data
Measurement can be destructiveMeasurement can be destructive

Unit of analysisUnit of analysis
An object on which a measurement is takenAn object on which a measurement is taken
Most common units of analysis are persons, Most common units of analysis are persons, households, farms, and economic households, farms, and economic establishmentsestablishments
Some concepts used in SamplingSome concepts used in Sampling

Target population or universeTarget population or universe
The complete collection of The complete collection of all the units of all the units of analysisanalysis to study. to study.
Examples: population living in households Examples: population living in households in a country; students in primary schoolsin a country; students in primary schools
Some concepts used in SamplingSome concepts used in Sampling

Sampling frameSampling frame
List of all the units of analysis whose List of all the units of analysis whose characteristics are to be measuredcharacteristics are to be measured
Comprehensive, non-overlappingComprehensive, non-overlapping and and must not contain irrelevant elementsmust not contain irrelevant elements
Should be updated to ensure complete Should be updated to ensure complete coveragecoverage
Examples: list of establishments; census; Examples: list of establishments; census; civil registrationcivil registration
Some concepts used in SamplingSome concepts used in Sampling

ParameterParameter
Quantity computed from all N values in a Quantity computed from all N values in a population setpopulation set
Typically, a descriptive measure of a Typically, a descriptive measure of a population, such as mean, variancepopulation, such as mean, variance Poverty rate, average income, etc. Poverty rate, average income, etc.
Objective of sampling is to estimate Objective of sampling is to estimate parameters of a populationparameters of a population
Some concepts used in SamplingSome concepts used in Sampling

EstimatorEstimator - - mathematical formula or function using mathematical formula or function using sample results to produce an estimate for the entire sample results to produce an estimate for the entire populationpopulation
EstimateEstimate - - numerical quantity computed from sample numerical quantity computed from sample observations of a characteristic and intended to provide observations of a characteristic and intended to provide information about an unknown population value information about an unknown population value ((parameterparameter). ).
Examples: Examples: mean (average), total, proportion, ratiomean (average), total, proportion, ratio
),...,,( 21 nXXX
EstimationEstimation
Some concepts used in SamplingSome concepts used in Sampling
),...,,(ˆ21 nxxx
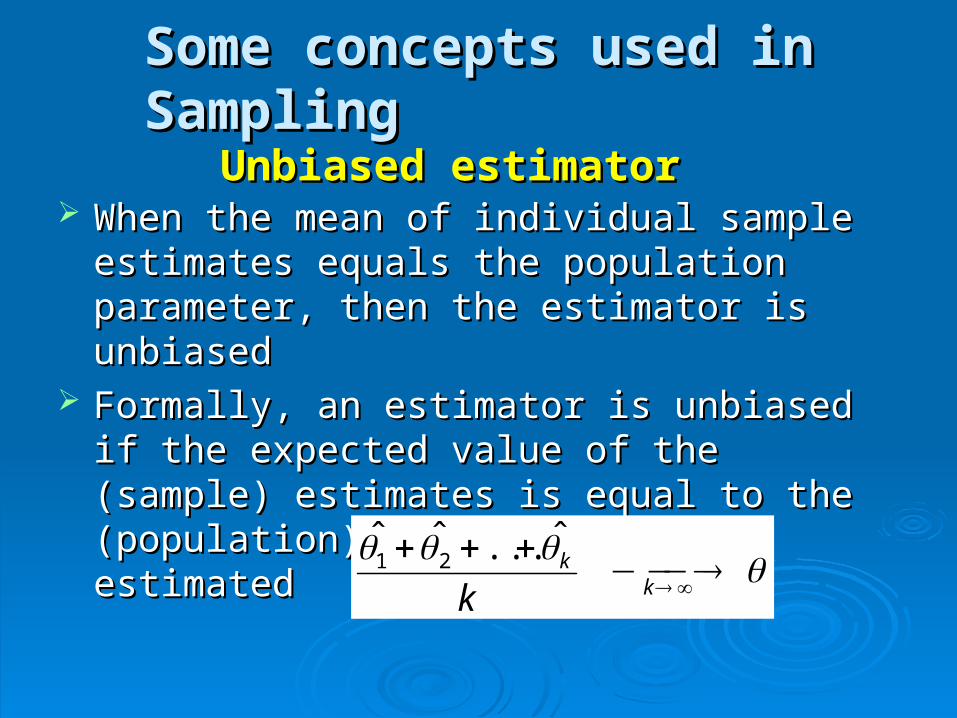
When the mean of individual sample estimates When the mean of individual sample estimates equals the population parameter, then the equals the population parameter, then the estimator is unbiasedestimator is unbiased
Formally, an estimator is unbiased if the Formally, an estimator is unbiased if the expected value of the (sample) estimates is expected value of the (sample) estimates is equal to the (population) parameter being equal to the (population) parameter being estimatedestimated
Unbiased estimator Unbiased estimator
Some concepts used in SamplingSome concepts used in Sampling
k
k
k
ˆ...ˆˆ21

Random samplingRandom sampling
Also known as scientific sampling or probability Also known as scientific sampling or probability samplingsampling
Each unit has a non-zero and known probability Each unit has a non-zero and known probability of selectionof selection
Mathematical theory is available to assess the Mathematical theory is available to assess the sampling errorsampling error ( (the error caused by observing a the error caused by observing a sample instead of the whole populationsample instead of the whole population). ).

Random sampling techniquesRandom sampling techniques
Single stage, equal probability sampling Single stage, equal probability sampling Simple Random Sampling (SRS)Simple Random Sampling (SRS) Systematic sampling with equal probabilitySystematic sampling with equal probability
Stratified samplingStratified sampling
Multi-stages samplingMulti-stages sampling
In real life those techniques are usually In real life those techniques are usually combined in various ways – most sampling combined in various ways – most sampling
designs are designs are complexcomplex

Single stage, equal probability samplingSingle stage, equal probability sampling
Random selection of n “units” from a population of Random selection of n “units” from a population of N units, so that each unit has an equal probability N units, so that each unit has an equal probability of selectionof selection N (population ) → n (sample)N (population ) → n (sample) Probability of selection (sampling fraction) = fProbability of selection (sampling fraction) = f = n/N = n/N
Is the most basic form of probability sampling Is the most basic form of probability sampling and provides the theoretical basis for more and provides the theoretical basis for more
complicated techniquescomplicated techniques
Random sampling techniquesRandom sampling techniques

Single stage, equal probability sampling Single stage, equal probability sampling (continued)(continued)
1.1. Simple Random SamplingSimple Random Sampling. The investigator . The investigator mixes up the whole target population before mixes up the whole target population before grabbing “n” units. grabbing “n” units.
2.2. Systematic Random Sampling.Systematic Random Sampling. The N units in The N units in the population are ranked 1 to N in some order the population are ranked 1 to N in some order (e.g., alphabetic). To select a sample of n units, (e.g., alphabetic). To select a sample of n units, calculate the step calculate the step kk ( k= N/n) and take a unit at ( k= N/n) and take a unit at random, from the 1st k units and then take every random, from the 1st k units and then take every kkthth unit. unit.
Random sampling techniquesRandom sampling techniques

AdvantageAdvantage self-weighting (simplifies the calculation of self-weighting (simplifies the calculation of
estimates and variances)estimates and variances) DisadvantagesDisadvantages
Sample frame may not be availableSample frame may not be available May entail high transportation costsMay entail high transportation costs
Single stage, equal probability sampling Single stage, equal probability sampling (continued)(continued)
Random sampling techniquesRandom sampling techniques

Stratified samplingStratified sampling
The population is divided into mutually The population is divided into mutually
exclusive subgroups called strata. exclusive subgroups called strata.
Then a random sample is selected from each Then a random sample is selected from each
stratum. stratum.
Random sampling techniquesRandom sampling techniques

Two-stage samplingTwo-stage sampling
Units of analysis are divided into groups Units of analysis are divided into groups called Primary Sampling Units (PSUs)called Primary Sampling Units (PSUs)
A sample of PSUs is selected firstA sample of PSUs is selected first Then a sample of units is chosen in each Then a sample of units is chosen in each
of the selected PSUsof the selected PSUs
Random sampling techniquesRandom sampling techniques
This technique can be generalized (multi-This technique can be generalized (multi-stage sampling) stage sampling)

Random samplingRandom sampling
Estimates obtained from random samples can Estimates obtained from random samples can be accompanied by measures of the uncertainty be accompanied by measures of the uncertainty associated with the estimate. associated with the estimate.
The uncertainty is measured by the The uncertainty is measured by the standard standard error. error. Confidence intervals around the estimate Confidence intervals around the estimate can be calculated taking advantage of the can be calculated taking advantage of the Central Limit TheoremCentral Limit Theorem..

The central limit theorem states that given a The central limit theorem states that given a parameterparameter with mean μ and variance σ², the sampling distribution of with mean μ and variance σ², the sampling distribution of the mean approaches a the mean approaches a normal distributionnormal distribution with mean μ with mean μ and variance and variance σσ²/n²/n
This is true even when the distribution of the parameter is This is true even when the distribution of the parameter is not normal. not normal.
The normal distribution is widely used. Part of its appeal is The normal distribution is widely used. Part of its appeal is that it is well behaved and mathematically tractable.that it is well behaved and mathematically tractable.
Central limit theorem Central limit theorem

Sample variance and standard errorSample variance and standard error Variance of the sample mean of an SRS of ‘n’ units for a population Variance of the sample mean of an SRS of ‘n’ units for a population
of size ‘N’:of size ‘N’:
e = standard errore = standard error Measure of sampling error. Depends on 3 factors:Measure of sampling error. Depends on 3 factors:
( 1 - ( 1 - n/Nn/N ) = ) = Finite Population Correction (fpc)Finite Population Correction (fpc) nn = sample size = sample size Var(X)Var(X) = = Population variance. Unknown, but can be estimated Population variance. Unknown, but can be estimated
without bias by:without bias by:
n
XVar
N
n
n
XVar
N
nNxVare
)(1
)(
1)(2
n
i
ix n
xxs
1
22
1
)(

ProportionsProportions
A proportion P (or prevalence) is equal to the A proportion P (or prevalence) is equal to the
mean of a dummy variable.mean of a dummy variable.
In this case Var(P) = P(1-P), and In this case Var(P) = P(1-P), and
1
)ˆ1(ˆ)ˆ(
n
pppVar

It is not sufficient to simple report the It is not sufficient to simple report the sample proportionsample proportion obtained by Mr Green in the sample survey, we also need obtained by Mr Green in the sample survey, we also need to give an indication of how accurate the estimate is. to give an indication of how accurate the estimate is.
Confidence intervals are used to indicate the accuracy of an Confidence intervals are used to indicate the accuracy of an estimate.estimate.
In other words, instead of estimating the parameter of In other words, instead of estimating the parameter of interest by a single value, an interval of likely estimates is interest by a single value, an interval of likely estimates is given. given.
Confidence intervalsConfidence intervals

Confidence intervals (continued)Confidence intervals (continued)
where:where:
ttαα = 1.28 for confidence level = 1.28 for confidence level αα = = 80%80%
ttαα = 1.64 for confidence level = 1.64 for confidence level αα = = 90%90%
ttαα = 1.96 for confidence level = 1.96 for confidence level αα = = 95%95%
ttαα = 2.58 for confidence level = 2.58 for confidence level αα = = 99%99%
)(xetx

Confidence intervalsConfidence intervalsIn a sample of 1,000 electors, 280 of them (28
percent) say they will vote Green.
0142.0000,1
72.028.0
e
Standard error is 1.42 percent.

Confidence intervalsConfidence intervals
24 25 26 27 28 29 30 31 32
In a sample of 1,000 electors, 280 of them (28 percent) say they will vote Green. Standard
error is 1.42 percent.
Standard error
95 percent confidence interval:28 ± 1.42 • 1.96
99 percent confidence interval: 28 ± 1.42 • 2.58

The required The required sample size sample size nn is determined by is determined by
The variability of the parameter The variability of the parameter Var(X)Var(X)• But we don’t know it!But we don’t know it!
The maximum margin of error The maximum margin of error EE we are willing to accept we are willing to accept How confident we want to be in that the error of our estimation will not How confident we want to be in that the error of our estimation will not
exceed that maximumexceed that maximum
For each confidence level For each confidence level αα there is a coefficient there is a coefficient ttαα
The size of the populationThe size of the population• But this is not very important!But this is not very important!
2
2 )(
E
XVartn
2
2 )1(
E
PPtn
Nn
nnN
1
For a proportion