form nl-1-b-ra name of the insurer: tata aig general ... · pdf fileform nl-1-b-ra name of the...
TRANSCRIPT

FORM NL-1-B-RA
Name of the Insurer: TATA AIG GENERAL INSURANCE COMPANY LIMITED IRDA Registration No. 108, dated January 22, 2001
REVENUE ACCOUNT FOR THE YEAR ENDED MARCH 31, 2016(Rs. in '000s)
Particulars Schedule
Fire Marine Miscellaneous Total Fire Marine Miscellaneous Total1 Premium earned (Net) NL-4-
Premium Schedule
267,636 2,258,174 18,101,562 20,627,372 242,346 2,108,778 15,671,323 18,022,447
2 Profit/ Loss on sale/redemption of Investments
29,552 37,577 427,651 494,780 18,406 31,019 315,962 365,387
3 Others 585 1,575 13,189 15,349 386 1,180 9,156 10,722 Co-insurance Administration income 5,798 2,564 6,966 15,328 3,375 426 4,409 8,210
Amortisation of Investments (2,642) (3,359) (38,230) (44,231) (1,447) (2,438) (24,834) (28,719)
4 Interest, Dividend & Rent – Gross 178,946 141,288 1,607,987 1,928,221 147,866 143,234 1,458,949 1,750,049
TOTAL (A) 479,875 2,437,819 20,119,125 23,036,819 410,932 2,282,199 17,434,965 20,128,096
1 Claims Incurred (Net) NL-5-Claims Schedule
255,510 1,824,771 13,822,355 15,902,636 203,191 1,545,828 11,012,560 12,761,579
2 Commission NL-6-Commission Schedule
(546,403) 251,877 1,082,066 787,540 (578,535) 276,478 688,281 386,224
3 Operating Expenses related to Insurance Business
NL-7-Operating Expenses Schedule
573,219 436,891 5,895,142 6,905,252 412,896 349,392 4,954,155 5,716,443
Contribution towards Solatium Fund - - 5,267 5,267 - - 4,449 4,449
4 Premium Deficiency - - - - - - - - Co-insurance Administration Fees 9,177 722 6,910 16,809 10,335 768 2,730 13,833
Motor pool Administration Fees - - 2,168 2,168 - - TOTAL (B) 291,503 2,514,261 20,813,908 23,619,672 47,887 2,172,466 16,662,175 18,882,528 Operating Profit/(Loss) from Fire/Marine/Miscellaneous Business C= (A - B)
188,372 (76,442) (694,783) (582,853) 363,045 109,733 772,790 1,245,568
APPROPRIATIONS
Transfer to Shareholders’ Account 188,372 (76,442) (694,783) (582,853) 363,045 109,733 772,790 1,245,568
Transfer to Catastrophe ReserveTransfer to Other Reserves (to be specified)TOTAL (C) 188,372 (76,442) (694,783) (582,853) 363,045 109,733 772,790 1,245,568
For the YEAR ENDED MARCH 31, 2016
For the YEAR ENDED MARCH 31, 2015

FORM NL-1-B-RA
Name of the Insurer: TATA AIG GENERAL INSURANCE COMPANY LIMITED IRDA Registration No. 108, dated January 22, 2001
REVENUE ACCOUNT FOR THE QUARTER ENDED MARCH 31, 2016(Rs. in '000s)
Particulars Schedule
Fire Marine Miscellaneous Total Fire Marine Miscellaneous Total1 Premium earned (Net) NL-4-
Premium Schedule
63,848 630,378 4,541,660 5,235,886 53,943 593,897 4,030,968 4,678,808
2 Profit/ Loss on sale/redemption of Investments
13,244 14,458 187,254 214,956 2,349 1,997 44,814 49,160
3 Others 205 489 4,382 5,076 172 480 4,129 4,781 Co-insurance Administration income 240 1,300 (228) 1,312 793 239 553 1,585
Amortisation of Investments (787) (729) (10,879) (12,395) (377) (504) (6,761) (7,642)
4 Interest, Dividend & Rent – Gross 47,009 26,565 415,036 488,610 37,209 27,067 373,633 437,909
TOTAL (A) 123,759 672,461 5,137,225 5,933,445 94,089 623,176 4,447,336 5,164,601
1 Claims Incurred (Net) NL-5-Claims Schedule
59,803 403,902 4,016,449 4,480,154 (21,094) 335,528 2,832,612 3,147,046
2 Commission NL-6-Commission Schedule
(61,529) 54,287 321,800 314,558 (125,447) 52,910 192,859 120,322
3 Operating Expenses related to Insurance Business
NL-7-Operating Expenses Schedule
122,357 107,360 1,634,308 1,864,025 136,914 81,550 1,427,463 1,645,927
Contribution towards Solatium Fund - - 1,497 1,497 - - 1,377 1,377
4 Premium Deficiency - - - - - - - - Co-insurance Administration Fees 2,986 79 1,149 4,214 4,281 72 327 4,680
Motor pool Administration Fees - - 2,168 2,168 - - TOTAL (B) 123,617 565,628 5,977,371 6,666,616 (5,346) 470,060 4,454,638 4,919,352 Operating Profit/(Loss) from Fire/Marine/Miscellaneous Business C= (A - B)
142 106,833 (840,146) (733,171) 99,435 153,116 (7,302) 245,249
APPROPRIATIONS
Transfer to Shareholders’ Account 142 106,833 (840,146) (733,171) 99,435 153,116 (7,302) 245,249
Transfer to Catastrophe ReserveTransfer to Other Reserves (to be specified)TOTAL (C) 142 106,833 (840,146) (733,171) 99,435 153,116 (7,302) 245,249
Quarter Ended MARCH 31, 2016
Quarter Ended MARCH 31, 2015

FORM NL-2-B-PL
Name of the Insurer: TATA AIG GENERAL INSURANCE COMPANY LIMITED
IRDA Registration No. 108, dated January 22, 2001
PROFIT AND LOSS ACCOUNT FOR THE Year ENDED MARCH 31, 2016Particulars Schedule For the Year Ended
MARCH 31, 2016Quarter Ended
MARCH 31, 2016For the Year Ended
MARCH 31, 2015Quarter Ended
MARCH 31, 2015(Rs.’000) (Rs.’000) (Rs.’000) (Rs.’000)
1 OPERATING PROFIT/(LOSS)(a) Fire Insurance 188,372 142 363,045 99,435 (b) Marine Insurance (76,442) 106,833 109,733 153,116 (c ) Miscellaneous Insurance (694,783) (840,146) 772,790 (7,302)
2 INCOME FROM INVESTMENTS(a) Interest, Dividend & Rent – Gross 727,682 201,348 698,072 171,802 (b) Profit on sale of investments 217,796 88,470 160,809 25,548 Less: Loss on sale of investments (24,265) (1,003) (9,629) (5,848)(c) Amortization of Debt Securities (17,301) (5,234) (11,883) (3,119)
3 OTHER INCOME (To be specified)Claims Service Fees 7,061 2,410 2,268 231 Miscellaneous 50,757 (273) 75,115 929 TOTAL (A) 378,877 (447,453) 2,160,320 434,792
4 PROVISIONS (Other than taxation)(a) For diminution in the value of investments - - - - (b) For doubtful debts 10,297 10,154 (15,103) 4,738
5 OTHER EXPENSES(a) Expenses other than those related to Insurance Business
Employee's remuneration 50,533 27,520 22,561 22,561 Donation 417 - 805 (6,310) CSR Expenditure 33,096 8,711 23,233 23,233 (Profit) / Loss on Sale / Write off of Fixed Assets (Net) (1,734) (1,585) (100) 12 (b) Bad debts written off - - 19,841 - (c) Wealth Tax - - 111 111 (d) Directors Commission 2,000 2,000 7,500 7,500 TOTAL (B) 94,609 46,800 58,848 51,845
Profit Before Tax 284,268 (494,253) 2,101,472 382,947
Provision for Taxation (a) Current tax - (114,000) 606,074 145,074 (b) Deferred tax 84,477 119,167 (45,300) (62,916)(c) Wealth Tax - - - - (d) Adjustment for earlier years - - - -
Profit / (Loss) After Tax 199,791 (499,420) 1,540,698 300,789
APPROPRIATIONS(a) Interim dividends paid during the year - - - - (b) Proposed final dividend - - 378,750 378,750 (c) Dividend distribution tax - - 77,105 77,105 (d) Transfer to any Reserves or Other Accounts (to be specified)
- -
-
-
- Contingency reserve for Unexpired Risks - - - - Balance of profit/ loss brought forward from prior period
3,146,681 3,845,890 2,061,838 3,301,686
Balance carried forward to Balance Sheet 3,346,472 3,346,470 3,146,681 3,146,620

FORM NL-3-B-BS
Name of the Insurer: Tata AIG General Insurance Co. Ltd. IRDA Registration No. 108, dated January 22, 2001
BALANCE SHEET AS AT MARCH 31, 2016
Schedule As at MARCH 31, 2016
As at MARCH 31, 2015
(Rs.’000) (Rs.’000)SOURCES OF FUNDS
SHARE CAPITAL NL-8-Share Capital Schedule
6,325,000 5,050,000
SHARE APPLICATION MONEY PENDING ALLOTMENT - -
RESERVES AND SURPLUS NL-10-Reserves and Surplus Schedule
4,322,709 3,297,918
FAIR VALUE CHANGE ACCOUNT (174,520) 123,099
BORROWINGS NL-11-Borrowings Schedule
- -
TOTAL 10,473,189 8,471,017
APPLICATION OF FUNDS
INVESTMENTS NL-12-Investment Schedule 36,844,037 30,282,425
LOANS NL-13-Loans Schedule - -
FIXED ASSETS NL-14-Fixed Assets Schedule
980,812 968,287
DEFERRED TAX ASSET - 84,477
CURRENT ASSETSCash and Bank Balances NL-15-Cash and bank
balance Schedule 1,162,601 1,747,346
Advances and Other Assets NL-16-Advances and Other Assets Schedule
4,459,100 4,341,378
Sub-Total (A) 5,621,701 6,088,724
CURRENT LIABILITIES NL-17-Current Liabilities Schedule
21,609,198 18,339,676
PROVISIONS NL-18-Provisions Schedule 11,364,163 10,613,220
Sub-Total (B) 32,973,361 28,952,896
NET CURRENT ASSETS (C) = (A - B) (27,351,660) (22,864,172)
MISCELLANEOUS EXPENDITURE (to the extent not written off or adjusted)
NL-19-Miscellaneous Expenditure Schedule
- -
DEBIT BALANCE IN PROFIT AND LOSS ACCOUNT - -
TOTAL 10,473,189 8,471,017
0.23 -
CONTINGENT LIABILITIES
Particulars As at MARCH 31, 2016
As at MARCH 31, 2015
(Rs.’000) (Rs.’000)1 Partly paid-up investments - - 2 Claims, other than against policies, not acknowledged as debts by
the company - -
3 Underwriting commitments outstanding (in respect of shares and securities)
- -
4 Guarantees given by or on behalf of the Company - - 5 Statutory demands/ liabilities in dispute, not provided for 133,181 108,023
6 Reinsurance obligations to the extent not provided for in accounts - -
7 Others (Insurance Claims disputed by the company, to the extent not provided/reserved)
170,618 96,570
TOTAL 303,799 204,593

FORM NL-4-PREMIUM SCHEDULEPREMIUM EARNED [NET]
(Rs. in '000s)Particulars FIRE MARINE For the Year Ended
MARCH 31, 2016
Motor-OD Motor-TP Motor Total Workmen's Compensation Personal Accident Health
Insurance Liability Engineering Trade Credit Aviation Others Total Grand Total
Premium from direct business written 3,849,420 2,654,326 8,974,706 5,138,908 14,113,614 268,272 1,292,116 2,691,895 2,487,911 790,111 183,300 21,314 1,233,316 23,081,849 29,585,595 Service Tax - - - - - - - - - - - - - - - Adjustment for change in reserve for unexpired risks (434,594) (36,752) (288,686) (292,062) (580,749) (29,805) 78,080 (112,512) (148,670) (27,695) (23,841) 1,435 83,588 (760,169) (1,231,516)
Gross Earned Premium 3,414,826 2,617,574 8,686,020 4,846,846 13,532,865 238,467 1,370,196 2,579,383 2,339,241 762,416 159,459 22,749 1,316,904 22,321,680 28,354,079 Add: Premium on reinsurance accepted 910,235 51,841 - (864) (864) - - 132,196 197,374 70,958 - - 44 399,708 1,361,784 Less : Premium on reinsurance ceded 4,047,887 455,379 542,891 292,849 835,740 17,460 133,686 228,000 1,517,679 797,802 82,451 21,243 1,026,430 4,660,491 9,163,757 Net Premium 711,768 2,250,788 8,431,815 4,845,195 13,277,010 250,812 1,158,430 2,596,091 1,167,606 63,267 100,849 71 206,930 18,821,066 21,783,622 Adjustment for change in reserve for unexpired risks (444,132) 7,386 (271,894) (277,810) (549,704) (27,578) 74,060 (102,767) (142,067) 19 (7,420) (6) 35,959 (719,504) (1,156,250)
Premium Earned (Net) 267,636 2,258,174 8,159,921 4,567,385 12,727,306 223,234 1,232,490 2,493,324 1,025,539 63,286 93,429 65 242,889 18,101,562 20,627,372
(Rs. in '000s)Particulars FIRE MARINE MISCELLANEOUS For the Year Ended
MARCH 31, 2015
Motor-OD Motor-TP Motor Total Workmen's Compensation Personal Accident Health
Insurance Liability Engineering Trade Credit Aviation Others Total Grand Total
Premium from direct business written 3,486,274 2,490,504 7,905,364 4,340,419 12,245,783 217,865 1,414,606 2,378,197 2,234,654 723,922 128,834 22,048 1,798,688 21,164,597 27,141,375 Service Tax - - - - - - - - - - - - - Adjustment for change in reserve for unexpired risks (477,856) (58,135) (571,513) (572,069) (1,143,582) (9,896) 32,975 (121,892) (33,081) (41,677) 471 (3,652) (192,209) (1,512,544) (2,048,534)
Gross Earned Premium 3,008,418 2,432,369 7,333,851 3,768,350 11,102,201 207,969 1,447,581 2,256,305 2,201,573 682,245 129,305 18,396 1,606,479 19,652,053 25,092,841 Add: Premium on reinsurance accepted 678,995 52,684 - (2,313) (2,313) 1,761 - 86,975 178,238 96,653 - - 11 361,325 1,093,004 Less : Premium on reinsurance ceded 3,551,812 358,336 444,708 256,982 701,690 35,492 105,756 129,398 1,390,546 757,204 53,686 22,038 1,472,207 4,668,017 8,578,165 Net Premium 613,457 2,184,852 7,460,656 4,081,124 11,541,780 184,134 1,308,850 2,335,774 1,022,346 63,371 75,148 10 326,492 16,857,905 19,656,214 Adjustment for change in reserve for unexpired risks (371,111) (76,074) (554,739) (511,313) (1,066,052) (10,149) 30,876 (116,413) (33,744) (4,574) (747) 7 14,214 (1,186,582) (1,633,767)
Premium Earned (Net) 242,346 2,108,778 6,905,917 3,569,811 10,475,728 173,985 1,339,726 2,219,361 988,602 58,797 74,401 17 340,706 15,671,323 18,022,447
(Rs. in '000s)Particulars FIRE MARINE MISCELLANEOUS Quarter Ended
MARCH 31, 2016
Motor-OD Motor-TP Motor Workmen's Compensation Personal Accident Health
Insurance Liability Engineering Trade Credit Aviation Others Total Grand Total
Premium from direct business written 893,808 630,698 2,423,943 1,460,950 3,884,893 73,979 286,177 527,676 502,815 134,511 37,431 5,809 380,273 5,833,564 7,358,070 Service Tax - - - - - - - - - - - - - Adjustment for change in reserve for unexpired risks (5,357) 135,860 (186,485) (203,731) (390,216) (7,817) 64,092 92,314 103,417 86,669 8,183 (1,977) (21,063) (66,398) 64,105
Gross Earned Premium 888,451 766,558 2,237,458 1,257,219 3,494,677 66,162 350,269 619,990 606,232 221,180 45,614 3,832 359,210 5,767,166 7,422,175 Add: Premium on reinsurance accepted 187,719 12,732 - (864) (864) - - - 3,565 17,992 - - 23 20,716 221,167 Less : Premium on reinsurance ceded 892,667 178,227 160,246 80,729 240,975 5,063 48,881 94,694 373,754 133,453 11,279 5,807 321,080 1,234,986 2,305,880 Net Premium 188,860 465,203 2,263,697 1,379,357 3,643,054 68,916 237,296 432,982 132,626 19,050 26,152 2 59,216 4,619,294 5,273,357 Adjustment for change in reserve for unexpired risks (125,012) 165,175 (177,169) (193,544) (370,713) (7,432) 52,062 97,015 127,394 4,085 4,655 10 15,290 (77,634) (37,471)
Premium Earned (Net) 63,848 630,378 2,086,528 1,185,813 3,272,341 61,484 289,358 529,997 260,020 23,135 30,807 12 74,506 4,541,660 5,235,886
(Rs. in '000s)Particulars FIRE MARINE MISCELLANEOUS Quarter Ended
MARCH 31, 2015
Motor-OD Motor-TP Motor Workmen's Compensation Personal Accident Health
Insurance Liability Engineering Trade Credit Aviation Others Total Grand Total
Premium from direct business written 921,080 551,262 2,474,649 1,343,316 3,817,964 54,788 295,899 566,814 468,277 116,050 31,320 8,326 575,005 5,934,443 7,406,785 Service Tax - - - - - - - - - - - - - - - Adjustment for change in reserve for unexpired risks (170,527) 113,277 (569,420) (321,959) (891,380) (1,777) 43,044 (54,648) 88,173 66,669 (389) (4,657) 71,610 (683,355) (740,605)
Gross Earned Premium 750,553 664,539 1,905,229 1,021,357 2,926,584 53,011 338,943 512,166 556,450 182,719 30,931 3,669 646,615 5,251,088 6,666,180 Add: Premium on reinsurance accepted 61,971 21,685 - - - - - 646 20,127 8,795 - - - 29,568 113,224 Less : Premium on reinsurance ceded 813,220 79,374 135,659 81,987 217,646 8,509 22,565 28,808 311,807 113,316 4,463 8,326 479,439 1,194,879 2,087,473 Net Premium 169,831 493,573 2,338,990 1,261,329 3,600,318 46,279 273,334 538,652 176,597 11,529 26,857 - 95,566 4,769,132 5,432,536 Adjustment for change in reserve for unexpired risks (115,888) 100,324 (541,251) (300,945) (842,195) (1,236) 40,937 (42,346) 107,360 4,054 (5,132) 2 392 (738,164) (753,728)
Premium Earned (Net) 53,943 593,897 1,797,739 960,384 2,758,123 45,043 314,271 496,306 283,957 15,583 21,725 2 95,958 4,030,968 4,678,808
TATA AIG GENERAL INSURANCE COMPANY LIMITED
MISCELLANEOUS

FORM NL-5 - CLAIMS SCHEDULECLAIMS INCURRED [NET]
(Rs. in '000s)Particulars FIRE MARINE For the Year Ended
MARCH 31, 2016
Motor-OD Motor-TP Motor Total Workmen's Compensation
Personal Accident
Health Insurance Liability Engineering Trade Credit Aviation Others Total Grand Total
Claims paid - Direct 2,040,684 2,124,845 6,397,936 1,802,714 8,200,650 54,801 702,167 1,699,686 394,935 201,881 163,291 - 2,008,809 13,426,220 17,591,749 Add Claims Outstanding at the end of the period 345,969 1,207,963 1,276,252 9,523,826 10,800,078 85,502 528,604 687,192 614,787 70,580 48,650 15 83,280 12,918,688 14,472,620 Less Claims Outstanding at the beginning of the year 285,710 1,209,317 1,065,545 6,635,186 7,700,731 83,284 531,261 639,919 537,223 80,696 35,320 5 100,474 9,708,913 11,203,940 Gross Incurred Claims 2,100,943 2,123,491 6,608,643 4,691,354 11,299,997 57,019 699,510 1,746,959 472,499 191,765 176,621 10 1,991,615 16,635,995 20,860,429 Add :Re-insurance accepted to direct claims 106,602 2,635 - (6,707) (6,707) - - 90,944 9,589 5,267 - - - 99,093 208,330 Less :Re-insurance Ceded to claims paid 1,952,035 301,355 373,413 262,490 635,903 3,040 38,016 83,048 143,187 186,674 136,910 - 1,685,955 2,912,733 5,166,123
Net Claims 255,510 1,824,771 6,235,230 4,422,157 10,657,387 53,979 661,494 1,754,855 338,901 10,358 39,711 10 305,660 13,822,355 15,902,636
(Rs. in '000s)Particulars FIRE MARINE For the Year Ended
MARCH 31, 2015
Motor-OD Motor-TP Motor Total Workmen's Compensation
Personal Accident
Health Insurance Liability Engineering Trade Credit Aviation Others Total Grand Total
Claims paid - Direct 1,826,077 1,604,052 4,717,256 1,444,343 6,161,599 46,722 634,829 1,616,125 278,217 145,900 9,284 - 527,330 9,420,006 12,850,135 Add Claims Outstanding at the end of the period 285,710 1,209,317 1,065,545 6,635,186 7,700,731 83,284 531,261 639,919 537,223 80,696 35,320 5 100,474 9,708,913 11,203,940
Less Claims Outstanding at the beginning of the year 259,079 982,056 1,052,909 4,383,207 5,436,116 63,309 315,422 589,667 446,512 60,861 16,637 2 68,609 6,997,135 8,238,270 Gross Incurred Claims 1,852,708 1,831,313 4,729,892 3,696,322 8,426,214 66,697 850,668 1,666,377 368,928 165,735 27,967 3 559,195 12,131,784 15,815,805 Add :Re-insurance accepted to direct claims 100,778 - - 38,672 38,672 - - 111,265 23,427 1,510 - - - 174,874 275,652 Less :Re-insurance Ceded to claims paid 1,750,295 285,485 242,678 298,952 541,630 3,114 36,204 102,890 228,367 138,177 5,367 - 238,349 1,294,098 3,329,878
Net Claims 203,191 1,545,828 4,487,214 3,436,042 7,923,256 63,583 814,464 1,674,752 163,988 29,068 22,600 3 320,846 11,012,560 12,761,579
(Rs. in '000s)Particulars FIRE MARINE MISCELLANEOUS Quarter Ended
MARCH 31, 2016
Motor-OD Motor-TP Motor Workmen's Compensation
Personal Accident
Health Insurance Liability Engineering Trade Credit Aviation Others Total Grand Total
Claims paid - Direct 828,417 589,215 1,993,013 624,282 2,617,294 15,867 193,439 514,553 139,564 42,885 123 - 757,784 4,281,509 5,699,141 Add Claims Outstanding at the end of the quarter 345,969 1,207,963 1,276,252 9,523,826 10,800,078 85,502 528,604 687,192 614,787 70,580 48,650 15 83,280 12,918,688 14,472,620
Less Claims Outstanding at the beginning of the quarter 362,078 1,321,155 1,380,121 8,678,518 10,058,639 85,388 525,761 753,925 511,701 83,772 28,974 13 92,395 12,140,568 13,823,801 Gross Incurred Claims 812,308 476,023 1,889,144 1,469,590 3,358,733 15,981 196,282 447,820 242,650 29,693 19,799 2 748,669 5,059,629 6,347,960 Add :Re-insurance accepted to direct claims 17,603 1,311 - (6,707) (6,707) - - - 2,660 23 - - - (4,024) 14,890 Less :Re-insurance Ceded to claims paid 770,108 73,432 156,379 85,804 242,183 850 10,750 25,019 54,911 39,183 6 - 666,254 1,039,156 1,882,696
Net Claims 59,803 403,902 1,732,765 1,377,079 3,109,843 15,131 185,532 422,801 190,399 (9,467) 19,793 2 82,415 4,016,449 4,480,154
(Rs. in '000s)Particulars FIRE MARINE MISCELLANEOUS Quarter Ended
MARCH 31, 2015
Motor-OD Motor-TP Motor Workmen's Compensation
Personal Accident
Health Insurance Liability Engineering Trade Credit Aviation Others Total Grand Total
Claims paid - Direct 299,022 553,646 1,321,013 490,820 1,811,833 11,694 175,856 414,625 64,346 45,034 2,196 - 243,718 2,769,302 3,621,970
Add Claims Outstanding at the end of the quarter 285,710 1,209,317 1,065,545 6,635,186 7,700,731 83,284 531,261 639,919 537,223 80,696 35,320 5 100,474 9,708,913 11,203,940
Less Claims Outstanding at the beginning of the quarter 353,582 1,302,703 1,104,808 6,176,832 7,281,641 74,172 492,234 663,050 525,141 95,569 17,325 4 108,181 9,257,317 10,913,602 Gross Incurred Claims 231,150 460,260 1,281,750 949,174 2,230,923 20,806 214,883 391,494 76,428 30,161 20,191 1 236,011 3,220,898 3,912,308 Add :Re-insurance accepted to direct claims 38,061 - - 13,125 13,125 - - 46,294 104 14 - - - 59,537 97,598 Less :Re-insurance Ceded to claims paid 290,305 124,732 65,751 86,654 152,405 712 9,455 21,835 48,778 44,923 2,969 - 166,745 447,822 862,859
Net Claims (21,094) 335,528 1,215,999 875,645 2,091,643 20,094 205,428 415,953 27,754 (14,748) 17,222 1 69,266 2,832,613 3,147,047
TATA AIG GENERAL INSURANCE COMPANY LIMITED
MISCELLANEOUS
MISCELLANEOUS

FORM NL-6-COMMISSION SCHEDULE
(Rs. in '000s)
Particulars FIRE MARINE For the Year Ended MARCH 31, 2016
Motor-OD Motor-TP Motor Total Workmen's Compensation
Personal Accident
Health Insurance Liability Engineering Trade Credit Aviation Others Total Grand Total
Commission Paid - Direct 230,019 305,844 705,174 752 705,926 24,480 108,783 181,730 319,405 50,309 17,997 761 70,953 1,480,344 2,016,207 Add: Reinsurance accepted 77,885 5,251 - - - 118 - 9,993 28,835 9,222 - - 247 48,415 131,551 Less : Reinsurance ceded 854,307 59,218 66,649 13,122 79,771 (7,552) 28,902 59,653 39,225 181,292 2,919 1,677 60,806 446,693 1,360,218 Net Commission (546,403) 251,877 638,525 (12,370) 626,155 32,150 79,881 132,070 309,015 (121,761) 15,078 (916) 10,394 1,082,066 787,540
Break up of Gross CommissionAgents 75,584 6,846 58,752 32 58,784 3,227 35,156 95,398 1,184 1,603 - - 7,213 202,565 284,995 Brokers 25,545 68,305 411,310 63 411,373 8,974 29,101 60,337 17,215 11,074 631 - 27,471 566,176 660,026 Corporate Agents 128,890 230,693 235,112 657 235,769 12,279 44,526 25,995 301,006 37,632 17,366 761 36,269 711,603 1,071,186 Referral - - - - - - - - - - - - - - -
230,019 305,844 705,174 752 705,926 24,480 108,783 181,730 319,405 50,309 17,997 761 70,953 1,480,344 2,016,207
(Rs. in '000s)
Particulars FIRE MARINE For the Year Ended MARCH 31, 2015
Motor-OD Motor-TP Motor Total Workmen's Compensation
Personal Accident
Health Insurance Liability Engineering Trade Credit Aviation Others Total Grand Total
Commission Paid - Direct 208,307 325,925 608,495 - 608,495 19,741 118,391 172,986 280,408 46,184 14,555 326 48,769 1,309,855 1,844,087 Add: Reinsurance accepted 68,912 5,455 - - - 453 - 4,339 20,472 12,090 - - 122 37,476 111,843 Less : Reinsurance ceded 855,754 54,902 66,763 10,995 77,758 6,800 28,353 26,085 55,505 179,254 2,933 759 281,603 659,050 1,569,706 Net Commission (578,535) 276,478 541,732 (10,995) 530,737 13,394 90,038 151,240 245,375 (120,980) 11,622 (433) (232,712) 688,281 386,224
Break up of Gross CommissionAgents 29,907 64,210 383,491 - 383,491 6,769 29,464 50,857 14,855 8,516 400 - 12,696 507,048 601,165 Brokers 118,610 255,751 159,321 - 159,321 9,847 49,764 66,822 264,372 36,205 14,155 326 29,810 630,622 1,004,983 Corporate Agents 59,790 5,964 65,683 - 65,683 3,125 39,163 55,307 1,181 1,463 - - 6,263 172,185 237,939 Referral - - - - - - - - - - - - - - -
208,307 325,925 608,495 - 608,495 19,741 118,391 172,986 280,408 46,184 14,555 326 48,769 1,309,855 1,844,087
(Rs. in '000s)
Particulars FIRE MARINE MISCELLANEOUS Quarter Ended MARCH 31, 2016
Motor-OD Motor-TP Motor Workmen's Compensation
Personal Accident
Health Insurance Liability Engineering Trade Credit Aviation Others Total Grand Total
Commission Paid - Direct 60,798 70,927 195,821 195 196,016 6,873 26,369 44,541 63,460 10,791 4,682 631 17,736 371,099 502,824 Add: Reinsurance accepted 12,755 1,187 - - - - - - 5,844 2,527 - - 245 8,616 22,558 Less : Reinsurance ceded 135,082 17,827 17,427 4,174 21,601 (9,276) 20,235 47,394 9,706 36,379 372 982 (69,478) 57,915 210,824 Net Commission (61,529) 54,287 178,394 (3,979) 174,415 16,149 6,134 (2,853) 59,598 (23,061) 4,310 (351) 87,459 321,800 314,558
Break up of Gross CommissionAgents 36,072 (28,682) (156,610) (12) (156,622) (2,076) 10,691 35,834 (6,899) (4,153) (458) - (1,497) (125,180) (117,790) Brokers (35,753) (74,699) 196,314 (189) 196,125 1,310 (628) 22,308 (143,527) (12,364) (8,267) (130) (5,484) 49,343 (61,109) Corporate Agents 60,479 174,308 156,117 396 156,513 7,639 16,306 (13,601) 213,886 27,308 13,407 761 24,717 446,936 681,723 Referral - - - - - - - - - - - - - - -
60,798 70,927 195,821 195 196,016 6,873 26,369 44,541 63,460 10,791 4,682 631 17,736 371,099 502,824
(Rs. in '000s)
Particulars FIRE MARINE MISCELLANEOUS Quarter Ended MARCH 31, 2015
Motor-OD Motor-TP Motor Workmen's Compensation
Personal Accident
Health Insurance Liability Engineering Trade Credit Aviation Others Total Grand Total
Commission Paid - Direct 50,115 66,672 191,679 (221) 191,458 4,996 26,737 42,945 58,649 10,316 4,453 326 12,700 352,580 469,367 Add: Reinsurance accepted 9,132 (1,095) - - - 264 - 32 1,863 685 - - - 2,844 10,881 Less : Reinsurance ceded 184,694 12,667 18,576 3,618 22,194 4,131 2,220 2,107 7,966 32,349 338 572 90,688 162,565 359,926 Net Commission (125,447) 52,910 173,103 (3,839) 169,264 1,129 24,517 40,870 52,546 (21,348) 4,115 (246) (77,988) 192,859 120,322
Break up of Gross CommissionAgents (20,480) 10,969 83,376 - 83,376 129 (14,671) (17,325) 4,180 1,582 42 - 706 58,019 48,508 Brokers 23,408 50,810 54,495 (221) 54,274 2,477 10,411 14,409 53,638 7,570 4,411 326 6,556 154,072 228,290 Corporate Agents 47,187 4,893 53,809 - 53,809 2,390 30,997 45,861 831 1,164 - - 5,438 140,490 192,570 Referral - - (1) - (1) - - - - - - - - (1) (1)
50,115 66,672 191,679 (221) 191,458 4,996 26,737 42,945 58,649 10,316 4,453 326 12,700 352,580 469,367
TATA AIG GENERAL INSURANCE COMPANY LIMITED
MISCELLANEOUS
MISCELLANEOUS
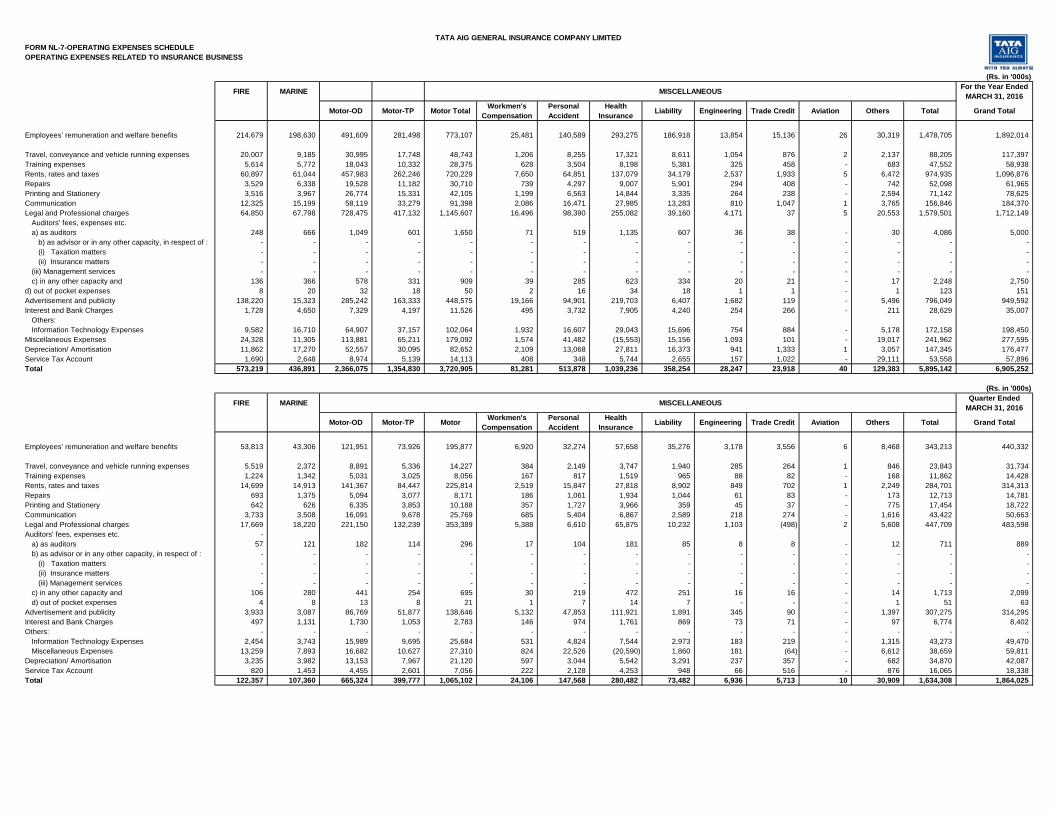
FORM NL-7-OPERATING EXPENSES SCHEDULEOPERATING EXPENSES RELATED TO INSURANCE BUSINESS
(Rs. in '000s)
FIRE MARINE MISCELLANEOUS For the Year Ended MARCH 31, 2016
FIRE MARINE Motor-OD Motor-TP Motor Total Workmen's Compensation
Personal Accident
Health Insurance Liability Engineering Trade Credit Aviation Others Total Grand Total
Employees’ remuneration and welfare benefits 214,679 198,630 491,609 281,498 773,107 25,481 140,589 293,275 186,918 13,854 15,136 26 30,319 1,478,705 1,892,014
Travel, conveyance and vehicle running expenses 20,007 9,185 30,995 17,748 48,743 1,206 8,255 17,321 8,611 1,054 876 2 2,137 88,205 117,397 Training expenses 5,614 5,772 18,043 10,332 28,375 628 3,504 8,198 5,381 325 458 - 683 47,552 58,938 Rents, rates and taxes 60,897 61,044 457,983 262,246 720,229 7,650 64,851 137,079 34,179 2,537 1,933 5 6,472 974,935 1,096,876 Repairs 3,529 6,338 19,528 11,182 30,710 739 4,297 9,007 5,901 294 408 - 742 52,098 61,965 Printing and Stationery 3,516 3,967 26,774 15,331 42,105 1,199 6,563 14,844 3,335 264 238 - 2,594 71,142 78,625 Communication 12,325 15,199 58,119 33,279 91,398 2,086 16,471 27,985 13,283 810 1,047 1 3,765 156,846 184,370 Legal and Professional charges 64,850 67,798 728,475 417,132 1,145,607 16,496 98,390 255,082 39,160 4,171 37 5 20,553 1,579,501 1,712,149
Auditors' fees, expenses etc.a) as auditors 248 666 1,049 601 1,650 71 519 1,135 607 36 38 - 30 4,086 5,000
b) as advisor or in any other capacity, in respect of : - - - - - - - - - - - - - - - (i) Taxation matters - - - - - - - - - - - - - - - (ii) Insurance matters - - - - - - - - - - - - - - -
(iii) Management services - - - - - - - - - - - - - - - c) in any other capacity and 136 366 578 331 909 39 285 623 334 20 21 - 17 2,248 2,750
d) out of pocket expenses 8 20 32 18 50 2 16 34 18 1 1 - 1 123 151 Advertisement and publicity 138,220 15,323 285,242 163,333 448,575 19,166 94,901 219,703 6,407 1,682 119 - 5,496 796,049 949,592 Interest and Bank Charges 1,728 4,650 7,329 4,197 11,526 495 3,732 7,905 4,240 254 266 - 211 28,629 35,007
Others:Information Technology Expenses 9,582 16,710 64,907 37,157 102,064 1,932 16,607 29,043 15,696 754 884 - 5,178 172,158 198,450
Miscellaneous Expenses 24,328 11,305 113,881 65,211 179,092 1,574 41,482 (15,553) 15,156 1,093 101 - 19,017 241,962 277,595 Depreciation/ Amortisation 11,862 17,270 52,557 30,095 82,652 2,109 13,068 27,811 16,373 941 1,333 1 3,057 147,345 176,477 Service Tax Account 1,690 2,648 8,974 5,139 14,113 408 348 5,744 2,655 157 1,022 - 29,111 53,558 57,896 Total 573,219 436,891 2,366,075 1,354,830 3,720,905 81,281 513,878 1,039,236 358,254 28,247 23,918 40 129,383 5,895,142 6,905,252
(Rs. in '000s)
FIRE MARINE MISCELLANEOUS Quarter Ended MARCH 31, 2016
FIRE MARINE Motor-OD Motor-TP Motor Workmen's Compensation
Personal Accident
Health Insurance Liability Engineering Trade Credit Aviation Others Total Grand Total
Employees’ remuneration and welfare benefits 53,813 43,306 121,951 73,926 195,877 6,920 32,274 57,658 35,276 3,178 3,556 6 8,468 343,213 440,332
Travel, conveyance and vehicle running expenses 5,519 2,372 8,891 5,336 14,227 384 2,149 3,747 1,940 285 264 1 846 23,843 31,734 Training expenses 1,224 1,342 5,031 3,025 8,056 167 817 1,519 965 88 82 - 168 11,862 14,428 Rents, rates and taxes 14,699 14,913 141,367 84,447 225,814 2,519 15,847 27,818 8,902 849 702 1 2,249 284,701 314,313 Repairs 693 1,375 5,094 3,077 8,171 186 1,061 1,934 1,044 61 83 - 173 12,713 14,781 Printing and Stationery 642 626 6,335 3,853 10,188 357 1,727 3,966 359 45 37 - 775 17,454 18,722 Communication 3,733 3,508 16,091 9,678 25,769 685 5,404 6,867 2,589 218 274 - 1,616 43,422 50,663 Legal and Professional charges 17,669 18,220 221,150 132,239 353,389 5,388 6,610 65,875 10,232 1,103 (498) 2 5,608 447,709 483,598 Auditors' fees, expenses etc. - - - - - - - - - - - - - - -
a) as auditors 57 121 182 114 296 17 104 181 85 8 8 - 12 711 889 b) as advisor or in any other capacity, in respect of : - - - - - - - - - - - - - - -
(i) Taxation matters - - - - - - - - - - - - - - - (ii) Insurance matters - - - - - - - - - - - - - - - (iii) Management services - - - - - - - - - - - - - - -
c) in any other capacity and 106 280 441 254 695 30 219 472 251 16 16 - 14 1,713 2,099 d) out of pocket expenses 4 8 13 8 21 1 7 14 7 - - - 1 51 63
Advertisement and publicity 3,933 3,087 86,769 51,877 138,646 5,132 47,853 111,921 1,891 345 90 - 1,397 307,275 314,295 Interest and Bank Charges 497 1,131 1,730 1,053 2,783 146 974 1,761 869 73 71 - 97 6,774 8,402 Others: - - - - - - - - - - - - - - -
Information Technology Expenses 2,454 3,743 15,989 9,695 25,684 531 4,824 7,544 2,973 183 219 - 1,315 43,273 49,470 Miscellaneous Expenses 13,259 7,893 16,682 10,627 27,310 824 22,526 (20,590) 1,860 181 (64) - 6,612 38,659 59,811
Depreciation/ Amortisation 3,235 3,982 13,153 7,967 21,120 597 3,044 5,542 3,291 237 357 - 682 34,870 42,087 Service Tax Account 820 1,453 4,455 2,601 7,056 222 2,128 4,253 948 66 516 - 876 16,065 18,338 Total 122,357 107,360 665,324 399,777 1,065,102 24,106 147,568 280,482 73,482 6,936 5,713 10 30,909 1,634,308 1,864,025
TATA AIG GENERAL INSURANCE COMPANY LIMITED
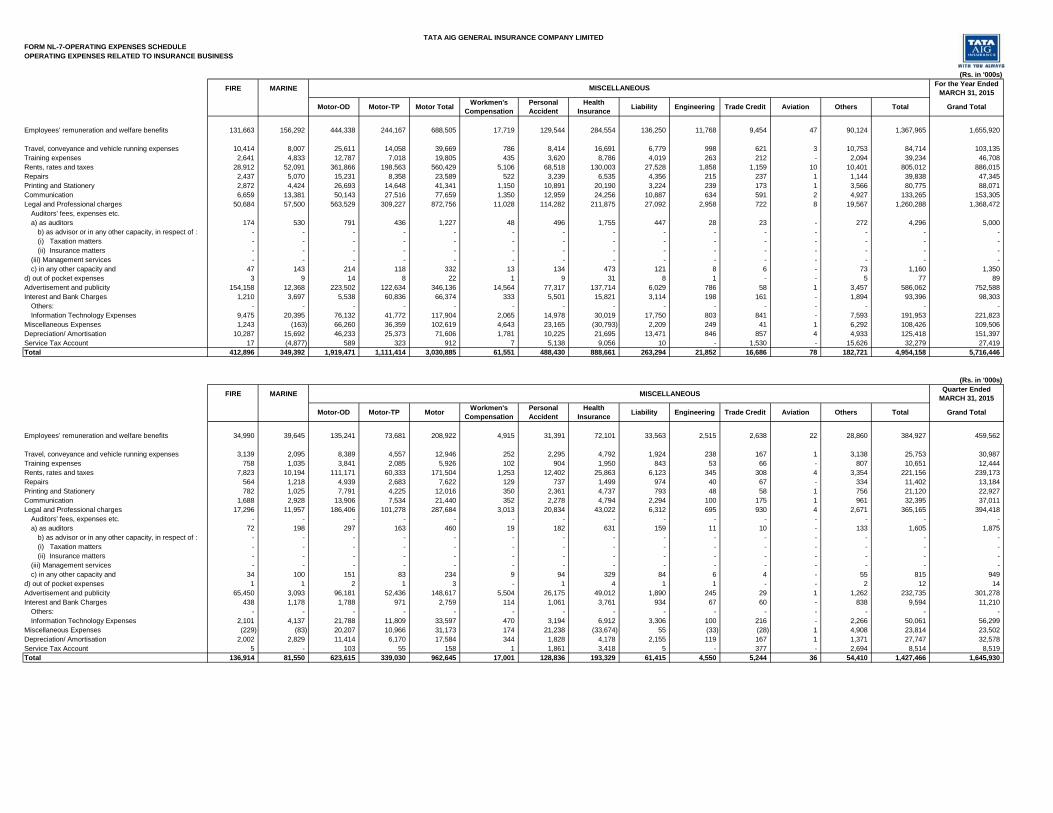
FORM NL-7-OPERATING EXPENSES SCHEDULEOPERATING EXPENSES RELATED TO INSURANCE BUSINESS
(Rs. in '000s)
FIRE MARINE For the Year Ended MARCH 31, 2015
FIRE MARINE Motor-OD Motor-TP Motor Total Workmen's Compensation
Personal Accident
Health Insurance Liability Engineering Trade Credit Aviation Others Total Grand Total
Employees’ remuneration and welfare benefits 131,663 156,292 444,338 244,167 688,505 17,719 129,544 284,554 136,250 11,768 9,454 47 90,124 1,367,965 1,655,920
Travel, conveyance and vehicle running expenses 10,414 8,007 25,611 14,058 39,669 786 8,414 16,691 6,779 998 621 3 10,753 84,714 103,135 Training expenses 2,641 4,833 12,787 7,018 19,805 435 3,620 8,786 4,019 263 212 - 2,094 39,234 46,708 Rents, rates and taxes 28,912 52,091 361,866 198,563 560,429 5,106 68,518 130,003 27,528 1,858 1,159 10 10,401 805,012 886,015 Repairs 2,437 5,070 15,231 8,358 23,589 522 3,239 6,535 4,356 215 237 1 1,144 39,838 47,345 Printing and Stationery 2,872 4,424 26,693 14,648 41,341 1,150 10,891 20,190 3,224 239 173 1 3,566 80,775 88,071 Communication 6,659 13,381 50,143 27,516 77,659 1,350 12,959 24,256 10,887 634 591 2 4,927 133,265 153,305 Legal and Professional charges 50,684 57,500 563,529 309,227 872,756 11,028 114,282 211,875 27,092 2,958 722 8 19,567 1,260,288 1,368,472
Auditors' fees, expenses etc.a) as auditors 174 530 791 436 1,227 48 496 1,755 447 28 23 - 272 4,296 5,000
b) as advisor or in any other capacity, in respect of : - - - - - - - - - - - - - - - (i) Taxation matters - - - - - - - - - - - - - - - (ii) Insurance matters - - - - - - - - - - - - - - -
(iii) Management services - - - - - - - - - - - - - - - c) in any other capacity and 47 143 214 118 332 13 134 473 121 8 6 - 73 1,160 1,350
d) out of pocket expenses 3 9 14 8 22 1 9 31 8 1 - - 5 77 89 Advertisement and publicity 154,158 12,368 223,502 122,634 346,136 14,564 77,317 137,714 6,029 786 58 1 3,457 586,062 752,588 Interest and Bank Charges 1,210 3,697 5,538 60,836 66,374 333 5,501 15,821 3,114 198 161 - 1,894 93,396 98,303
Others: - - - - - - - - - - - - - - - Information Technology Expenses 9,475 20,395 76,132 41,772 117,904 2,065 14,978 30,019 17,750 803 841 - 7,593 191,953 221,823
Miscellaneous Expenses 1,243 (163) 66,260 36,359 102,619 4,643 23,165 (30,793) 2,209 249 41 1 6,292 108,426 109,506 Depreciation/ Amortisation 10,287 15,692 46,233 25,373 71,606 1,781 10,225 21,695 13,471 846 857 4 4,933 125,418 151,397 Service Tax Account 17 (4,877) 589 323 912 7 5,138 9,056 10 - 1,530 - 15,626 32,279 27,419 Total 412,896 349,392 1,919,471 1,111,414 3,030,885 61,551 488,430 888,661 263,294 21,852 16,686 78 182,721 4,954,158 5,716,446
(Rs. in '000s)
FIRE MARINE MISCELLANEOUS Quarter Ended MARCH 31, 2015
FIRE MARINE Motor-OD Motor-TP Motor Workmen's Compensation
Personal Accident
Health Insurance Liability Engineering Trade Credit Aviation Others Total Grand Total
Employees’ remuneration and welfare benefits 34,990 39,645 135,241 73,681 208,922 4,915 31,391 72,101 33,563 2,515 2,638 22 28,860 384,927 459,562
Travel, conveyance and vehicle running expenses 3,139 2,095 8,389 4,557 12,946 252 2,295 4,792 1,924 238 167 1 3,138 25,753 30,987 Training expenses 758 1,035 3,841 2,085 5,926 102 904 1,950 843 53 66 - 807 10,651 12,444 Rents, rates and taxes 7,823 10,194 111,171 60,333 171,504 1,253 12,402 25,863 6,123 345 308 4 3,354 221,156 239,173 Repairs 564 1,218 4,939 2,683 7,622 129 737 1,499 974 40 67 - 334 11,402 13,184 Printing and Stationery 782 1,025 7,791 4,225 12,016 350 2,361 4,737 793 48 58 1 756 21,120 22,927 Communication 1,688 2,928 13,906 7,534 21,440 352 2,278 4,794 2,294 100 175 1 961 32,395 37,011 Legal and Professional charges 17,296 11,957 186,406 101,278 287,684 3,013 20,834 43,022 6,312 695 930 4 2,671 365,165 394,418
Auditors' fees, expenses etc. - - - - - - - - - - - - - - - a) as auditors 72 198 297 163 460 19 182 631 159 11 10 - 133 1,605 1,875
b) as advisor or in any other capacity, in respect of : - - - - - - - - - - - - - - - (i) Taxation matters - - - - - - - - - - - - - - - (ii) Insurance matters - - - - - - - - - - - - - - -
(iii) Management services - - - - - - - - - - - - - - - c) in any other capacity and 34 100 151 83 234 9 94 329 84 6 4 - 55 815 949
d) out of pocket expenses 1 1 2 1 3 - 1 4 1 1 - - 2 12 14 Advertisement and publicity 65,450 3,093 96,181 52,436 148,617 5,504 26,175 49,012 1,890 245 29 1 1,262 232,735 301,278 Interest and Bank Charges 438 1,178 1,788 971 2,759 114 1,061 3,761 934 67 60 - 838 9,594 11,210
Others: - - - - - - - - - - - - - - - Information Technology Expenses 2,101 4,137 21,788 11,809 33,597 470 3,194 6,912 3,306 100 216 - 2,266 50,061 56,299
Miscellaneous Expenses (229) (83) 20,207 10,966 31,173 174 21,238 (33,674) 55 (33) (28) 1 4,908 23,814 23,502 Depreciation/ Amortisation 2,002 2,829 11,414 6,170 17,584 344 1,828 4,178 2,155 119 167 1 1,371 27,747 32,578 Service Tax Account 5 - 103 55 158 1 1,861 3,418 5 - 377 - 2,694 8,514 8,519 Total 136,914 81,550 623,615 339,030 962,645 17,001 128,836 193,329 61,415 4,550 5,244 36 54,410 1,427,466 1,645,930
TATA AIG GENERAL INSURANCE COMPANY LIMITED
MISCELLANEOUS
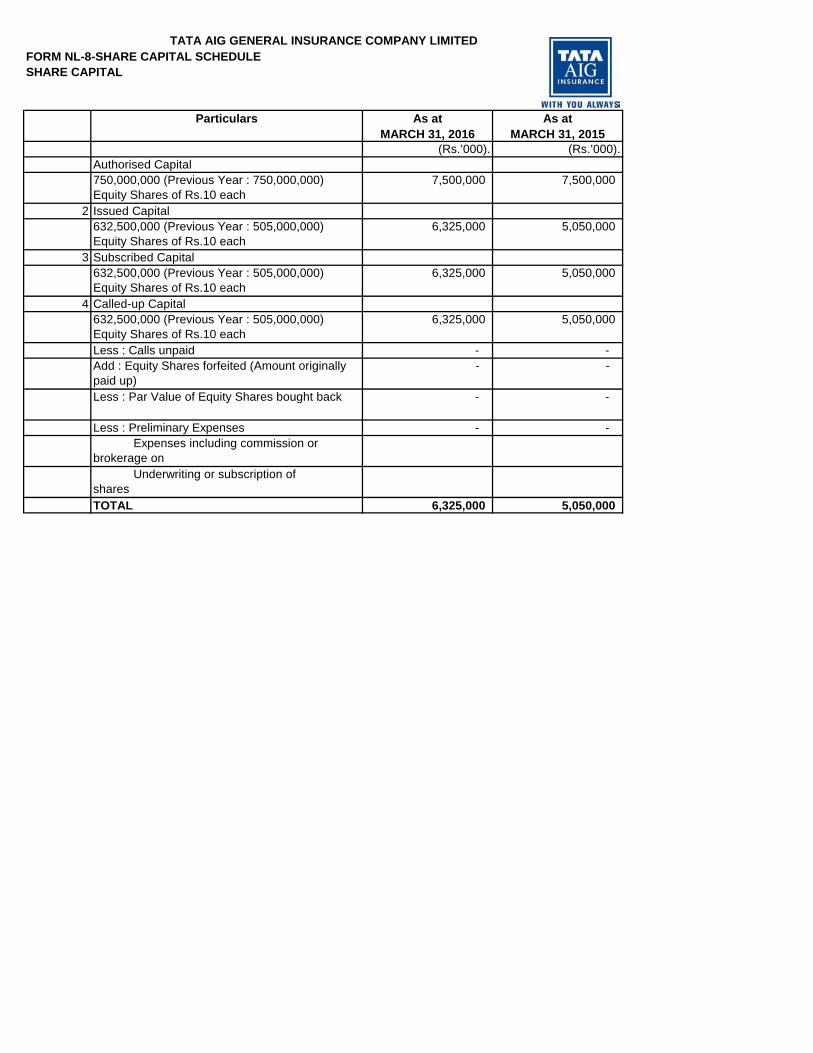
FORM NL-8-SHARE CAPITAL SCHEDULESHARE CAPITAL
Particulars As at MARCH 31, 2016
As at MARCH 31, 2015
(Rs.’000). (Rs.’000).1 Authorised Capital
750,000,000 (Previous Year : 750,000,000) Equity Shares of Rs.10 each
7,500,000 7,500,000
2 Issued Capital632,500,000 (Previous Year : 505,000,000) Equity Shares of Rs.10 each
6,325,000 5,050,000
3 Subscribed Capital632,500,000 (Previous Year : 505,000,000) Equity Shares of Rs.10 each
6,325,000 5,050,000
4 Called-up Capital632,500,000 (Previous Year : 505,000,000) Equity Shares of Rs.10 each
6,325,000 5,050,000
Less : Calls unpaid - - Add : Equity Shares forfeited (Amount originally paid up)
- -
Less : Par Value of Equity Shares bought back - -
Less : Preliminary Expenses - - Expenses including commission or brokerage on Underwriting or subscription of shares TOTAL 6,325,000 5,050,000
TATA AIG GENERAL INSURANCE COMPANY LIMITED

FORM NL-9-PATTERN OF SHAREHOLDING SCHEDULESHARE CAPITAL
PATTERN OF SHAREHOLDING[As certified by the Management]
Shareholder
Number of Shares
% of Holding Number of Shares
% of Holding
Promoters· Indian - Tata Sons Limited 468,050,000 74% 373,700,000 74%
· Foreign - AIG MEA Investments and Services Inc. (Formerly Chartis Memsa Holding Inc.) 164,450,000 26% 131,300,000 26%
Others - - - - TOTAL 632,500,000 100% 505,000,000 100%
As at MARCH 31, 2015
As at MARCH 31, 2016
TATA AIG GENERAL INSURANCE COMPANY LIMITED

FORM NL-10-RESERVE AND SURPLUS SCHEDULERESERVES AND SURPLUS
Particulars As at MARCH 31, 2016
As at MARCH 31, 2015
(Rs.’000). (Rs.’000).1 Capital Reserve - - 2 Capital Redemption Reserve - - 3 Securities Premium 825,000 -
General Reserves 151,237 151,237 Less: Debit balance in Profit and Loss Account - -
Less: Amount utilized for Buy-back - - 5 Catastrophe Reserve - - 6 Other Reserves (to be specified) - - 7 Balance of Profit in Profit & Loss Account 3,346,472 3,146,681
TOTAL 4,322,709 3,297,918
4
TATA AIG GENERAL INSURANCE COMPANY LIMITED

FORM NL-11-BORROWINGS SCHEDULEBORROWINGS
Particulars As at MARCH 31, 2016
As at MARCH 31, 2015
(Rs.’000). (Rs.’000).1 Debentures/ Bonds - - 2 Banks - - 3 Financial Institutions - - 4 Others (to be specified) - -
TOTAL - -
TATA AIG GENERAL INSURANCE COMPANY LIMITED

FORM NL-12-INVESTMENT SCHEDULEInvestments
Particulars As at MARCH 31, 2016
As at MARCH 31, 2015
(Rs.’000). (Rs.’000).LONG TERM INVESTMENTS
1 Government securities and Government guaranteed bonds including Treasury Bills
13,707,563 5,809,358
2 Other Approved Securities - - 3 Other Investments
(a) Shares(aa) Equity 2,839,998 - (bb) Preference - - ( b) Mutual Funds - - (c) Derivative Instruments - - (d) Debentures/ Bonds 4,220,753 2,747,096 (e) Other Securities - - (f) Subsidiaries - - (g) Investment Properties-Real Estate
- -
4 Investments in Infrastructure and Social Sector 9,152,220 12,780,003
5 Other than Approved Investments - - SHORT TERM INVESTMENTS
1 Government securities and Government guaranteed bonds including Treasury Bills
1,354,098 4,699,762
2 Other Approved Securities - - 3 Other Investments
(a) Shares(i) Equity - 2,157,030 (ii) Preference - - (b) Mutual Funds - - (c) Derivative Instruments - - (d) Debentures/ Bonds 2,258,098 1,609,440 (e) Other Securities (Reverse Repo) 2,699,924 379,766 (f) Subsidiaries - - (g) Investment Properties-Real Estate - -
4 Investments in Infrastructure and Social Sector 611,382 99,970
5 Other than Approved Investments - - TOTAL 36,844,037 30,282,425
TATA AIG GENERAL INSURANCE COMPANY LIMITED

FORM NL-13-LOANS SCHEDULELOANS
Particulars As at MARCH 31, 2016
As at MARCH 31, 2015
(Rs.’000). (Rs.’000).1 SECURITY-WISE CLASSIFICATION
Secured(a) On mortgage of property(aa) In India - - (bb) Outside India - - (b) On Shares, Bonds, Govt. Securities - - (c) Others (to be specified) - - Unsecured - - TOTAL - -
2 BORROWER-WISE CLASSIFICATION(a) Central and State Governments - - (b) Banks and Financial Institutions - - (c) Subsidiaries - - (d) Industrial Undertakings - - (e) Others (to be specified) - - TOTAL - -
3 PERFORMANCE-WISE CLASSIFICATION(a) Loans classified as standard(aa) In India - - (bb) Outside India - - (b) Non-performing loans less provisions(aa) In India - - (bb) Outside India - - TOTAL - -
4 MATURITY-WISE CLASSIFICATION(a) Short Term - - (b) Long Term - - TOTAL - -
TATA AIG GENERAL INSURANCE COMPANY LIMITED

FORM NL-14-FIXED ASSETS SCHEDULE
FIXED ASSETS(Rs.’000)
ParticularsOn Sales/
AdjustmentsGoodwill - - - - - - - - - - Intangibles (software) 609,625 124,396 - 734,021 471,991 71,096 - 543,087 190,934 137,635 Land-Freehold - - - - - - - - - - Leasehold Improvements 247,152 22,714 - 269,866 175,924 27,520 - 203,444 66,422 71,228 Buildings 528,498 - - 528,498 18,357 8,808 - 27,165 501,333 510,141 Freehold Improvements 57,745 168 - 57,913 17,244 5,079 - 22,323 35,590 40,501 Furniture & Fittings 83,054 3,530 203 86,381 71,131 5,861 193 76,799 9,582 11,922 Information Technology Equipment
537,851 38,636 4,347 572,140 414,335 40,994 4,240 451,089 121,051 123,517
Vehicles 27,253 8,447 15,063 20,637 17,871 4,681 13,794 8,758 11,879 9,381 Office Equipment 150,834 11,837 1,340 161,331 118,344 12,438 1,151 129,631 31,700 32,491 Others (Specify nature) - - - - - - - - - - TOTAL 2,242,012 209,728 20,953 2,430,787 1,305,197 176,477 19,378 1,462,296 968,491 936,816 Work in progress - - - - - - - - 12,321 31,471 Grand Total 2,242,012 209,728 20,953 2,430,787 1,305,197 176,477 19,378 1,462,296 980,812 968,287 PREVIOUS YEAR 2,024,518 221,509 4,014 2,242,013 1,157,744 151,394 3,941 1,305,197 936,816
As at MARCH 31, 2016
As at March 31, 2015
TATA AIG GENERAL INSURANCE COMPANY LIMITED
To DateCost/ Gross Block Depreciation Net Block
ClosingOpening Additions/Adjustments
Deductions/Adjustments
Up to Last Year For The Period

FORM NL-15-CASH AND BANK BALANCE SCHEDULECASH AND BANK BALANCES
Particulars As at MARCH 31, 2016
As at MARCH 31, 2015
(Rs.’000) (Rs.’000)1 Cash (including cheques, drafts and
stamps) 347,714 343,887
2 Bank Balances(a) Deposit Accounts (aa) Short-term (due within 12 months)
- -
(bb) Others - - (b) Current Accounts 814,887 1,403,459 (c) Others (to be specified) - -
3 Money at Call and Short Notice(a) With Banks - - (b) With other Institutions - -
4 Others (to be specified) - - TOTAL 1,162,601 1,747,346
Balances with non-scheduled banks included in 2 and 3 above
TATA AIG GENERAL INSURANCE COMPANY LIMITED

FORM NL-16-ADVANCES AND OTHER ASSETS SCHEDULE ADVANCES AND OTHER ASSETS
Particulars As at MARCH 31, 2016
As at MARCH 31, 2015
(Rs.’000). (Rs.’000).ADVANCES
1 Reserve deposits with ceding companies - -
2 Application money for investments - - 3 Prepayments 58,574 45,583 4 Commission Paid on Premium Received
in Advance - -
5 Advances to Directors/Officers - - 6 Advance tax paid and taxes deducted at
source (Net of provision for taxation) 394,265 272,733
7 Others Advance to Employees 6,206 8,044 Advance to Suppliers 50,493 12,617 Advances against Capital Assets - 7,831 TOTAL (A) 509,538 346,808
OTHER ASSETS1 Income accrued on investments 1,038,589 817,878 2 Outstanding Premiums 482,921 990,775 3 Agents’ Balances 93,529 56,886 4 MAT Credit Entitlement - - 5 Foreign Agencies Balances - - 6 Due from other entities carrying on
insurance business (including reinsurers)
2,101,190 1,822,784
7 Due from subsidiaries/ holding - - 8 Deposit with Reserve Bank of India
[Pursuant to section 7 of Insurance Act, 1938]
- -
9 Other Receivables 28,889 32,402 10 Others
Deposits for Office Premises 95,363 97,194 Deposits with Telecom Authorities and Housing Deposits for employees
24,574 25,510
Service tax unutilised credit 55,856 118,824 Earnest Money Deposit 3,276 - Other Deposits - 3,140 Balance due from AIG entities & others 21,041 29,177
Salvage and Subrogation 4,334 - TOTAL (B) 3,949,562 3,994,570 TOTAL (A+B) 4,459,100 4,341,378
TATA AIG GENERAL INSURANCE COMPANY LIMITED

FORM NL-17-CURRENT LIABILITIES SCHEDULE
CURRENT LIABILITIES
Particulars As at MARCH 31, 2016
As at MARCH 31, 2015
(Rs.’000). (Rs.’000).1 Agents’ Balances 140,578 120,171 2 Balances due to other insurance
companies (including. reinsurers) 1,944,011 2,213,275
3 Deposits held on re-insurance ceded - -
4 Premiums received in advance 1,907,483 2,075,693 5 Unallocated Premium 762,769 427,290 6 Sundry creditors 815,248 628,558 7 Due to subsidiaries/ holding
company - -
8 Claims Outstanding 15,716,521 12,589,073 9 Due to Officers/ Directors - -
10 Unclaimed Amount of Policyholders 195,787 156,623
11 Due to Officers/Directors 1,800 6,750 12 Others (to be specified)
Others Payable 7,583 5,093 Other Deposits Accepted - - Due to Environment Relief Fund 632 669 Due to Solatium Fund 18,457 13,189 Due to Statutory Liabilities 98,161 94,682 Payable on purchase of investments 168 95
Service Tax Liability - - Salvage and Subrogation - 8,515 Temporary overdraft (as per book only)
- -
TOTAL 21,609,198 18,339,676
TATA AIG GENERAL INSURANCE COMPANY LIMITED

FORM NL-18-PROVISIONS SCHEDULE
PROVISIONS
Particulars As at MARCH 31, 2016
As at MARCH 31, 2015
(Rs.’000). (Rs.’000).1 Reserve for Unexpired Risk 11,224,397 10,068,147 2 For taxation (less advance tax paid and
taxes deducted at source) 267 37,374
3 For proposed dividends - 378,750 4 For dividend distribution tax - 77,105 5 Others :
Gratuity 29,649 24,322 Long Term Incentive Plan 71,500 - Accrued Leave 38,350 27,522
6 Reserve for Premium Deficiency - - TOTAL 11,364,163 10,613,220
TATA AIG GENERAL INSURANCE COMPANY LIMITED

FORM NL-19 MISC EXPENDITURE SCHEDULE
MISCELLANEOUS EXPENDITURE(To the extent not written off or adjusted)
Particulars As at MARCH 31, 2016
As at MARCH 31, 2015
(Rs.’000). (Rs.’000).1 Discount Allowed in issue of shares/
debentures - -
2 Others (to be specified) - - TOTAL - -
TATA AIG GENERAL INSURANCE COMPANY LIMITED

FORM NL-20-RECEIPT AND PAYMENTS SCHEDULE
Format of Receipts and Payments A/c for the year ended March 31, 2016(Rs in '000's)
Cash Flows from the operating activities:Premium received from policyholders, including advance receipts 36,968,164 Other receipts - Payments to the re-insurers, net of commissions and claims (3,348,833) Payments to co-insurers, net of claims recovery (395,492) Payments of claims (18,514,532) Payments of commission and brokerage (2,106,367) Payments of other operating expenses (7,344,062) Preliminary and pre-operative expenses - Deposits, advances and staff loans (148,816) Income taxes paid (Net) (152,465) Service tax paid (3,155,372) Other payments - Cash flows before extraordinary items 1,802,225 Cash flow from extraordinary operations - Net cash flow from operating activities 1,802,225 Cash flows from investing activities:Purchase of fixed assets (180,587) Proceeds from sale of fixed assets 3,309 Purchases of investments (34,593,367) Loans disbursed - Sales of investments 29,810,642 Repayments received - Rents/Interests/ Dividends received 2,138,902 Investments in money market instruments and in liquid mutual funds (Net)* - Expenses related to investments - Net cash flow from investing activities (2,821,101) Cash flows from financing activities:Proceeds from issuance of share capital 2,100,000 Proceeds from borrowing - Repayments of borrowing - Interest/dividends paid (455,855) Net cash flow from financing activities 1,644,145
Effect of foreign exchange rates on cash and cash equivalents, net 10,144
Net increase in cash and cash equivalents: 635,413 Cash and cash equivalents at the beginning of the year 2,127,112 Cash and cash equivalents at the end of the year 2,762,525
2. Cash and cash equivalents at the end of the current accounting year comprise of the following Balance Sheet amounts:(Rs in '000's)
Cash (including cheques on hand, stamps on hand) 347,714 Bank Balances (with scheduled banks) 814,887 Balance in Reverse Repo Account 1,599,924
2,762,525
TATA AIG GENERAL INSURANCE COMPANY LIMITED
Total

Insurer: Tata AIG General Insurance Co. Ltd. Date:
(Rs in Lakhs)
Sl.No. Particular Reserves for unexpired risks
Reserve for Outstanding Claims IBNR Reserves Total Reserves Reserves for
unexpired risksReserve for Outstanding
Claims IBNR Reserves Total Reserves
1 Fire 13,874 3,056 404 17,334 9,433 2,234 623 12,290 2 Marine 6,710 9,936 2,143 18,790 6,784 10,109 1,985 18,877
a Marine Cargo 6,710 9,936 2,143 18,790 6,784 10,109 1,985 18,877 b Marine Hull - - - - - - - -
3 Miscellaneous 81,114 72,150 57,319 210,583 74,206 56,446 42,781 173,436 a Motor 67,350 66,529 53,911 187,790 61,853 52,223 38,636 152,712 b Engineering 331 457 249 1,037 331 365 442 1,138 c Aviation 0 0 0 0 0 - 0 0 d Liability 11,227 4,486 2,517 18,230 9,530 3,280 2,925 15,735 e Others 2,206 679 640 3,526 2,492 578 779 3,850
4 Health Insurance 10,545 6,213 5,945 22,703 10,258 6,802 4,909 21,970 5 Total Liabilities 112,244 91,355 65,810 269,410 100,681 75,591 50,300 226,573
Note Figures including Motor Pool & Declined PoolHealth Insurance includes Personal Accident.
PERIODIC DISCLOSURESFORM NL-21
As at MARCH 31, 2015
31-March-2016
As at MARCH 31, 2016
Statement of Liabilities

FORM NL-22 Geographical Distribution of Business
Insurer: TATA AIG General Insurance Company Limited Date:GROSS DIRECT PREMIUM UNDERWRITTEN FOR THE QUARTER: MARCH 2016
(Rs in Lakhs)
STATES
For the qtrUpto the
qtr For the qtrUpto the
qtr For the qtrUpto the
qtr For the qtrUpto the
qtr For the qtrUpto the
qtr For the qtr Upto the qtr For the qtrUpto the
qtr For the qtrUpto the
qtr For the qtrUpto the
qtr For the qtrUpto the
qtr For the qtrUpto the
qtr For the qtrUpto the
qtr For the qtrUpto the
qtr For the qtr Upto the qtr
Andhra Pradesh 47 228 9 65 3 16 0 0 202 648 273 806 12 60 38 120 42 130 35 115 7 7 5 16 672 2,213
Arunachal Pradesh 0 0 0 0 0 0 0 0 0 0 0 0 0 0 0 0 0 0 0 0 0 0 0 0 0 0
Assam 57 159 11 22 5 10 0 0 92 243 104 295 2 4 24 67 56 204 1 10 0 0 3 15 355 1,029
Bihar 31 87 0 13 0 0 0 0 259 1,007 180 740 1 2 20 67 32 107 1 3 0 0 4 12 527 2,039
Chhattisgarh 26 108 5 23 1 5 0 0 131 534 148 442 8 34 27 168 39 124 2 10 0 0 3 10 390 1,458
Goa 51 69 9 35 1 2 0 0 80 209 39 121 53 78 2 10 10 30 4 23 0 0 1 4 248 580
Gujarat 766 3,341 717 2,923 48 219 0 0 1,734 6,361 965 2,908 430 1,401 187 795 153 438 181 935 0 0 137 825 5,318 20,145
Haryana 58 974 121 465 10 58 0 0 526 2,135 189 699 2 23 36 138 2 11 11 55 0 0 39 152 993 4,709
Himachal Pradesh 0 2 1 4 0 0 0 0 26 91 19 81 0 2 0 5 0 1 0 1 0 1 0 -1 47 188
Jammu & Kashmir 1 2 0 0 0 0 0 0 79 201 40 80 0 0 0 0 0 0 0 0 0 0 0 0 121 284
Jharkhand 39 175 -8 65 4 37 0 0 283 1,041 185 735 8 30 20 72 20 79 8 45 1 1 6 25 565 2,306
Karnataka 655 2,708 757 2,909 105 316 0 7 1,844 6,747 1,126 4,557 441 3,900 409 2,391 263 1,003 851 3,893 0 0 125 721 6,576 29,153
Kerala 82 280 7 22 2 11 0 0 149 482 205 688 58 131 9 59 17 57 32 156 0 0 5 13 567 1,899
Madhya Pradesh 89 268 34 186 5 13 0 0 415 1,564 492 1,284 27 100 18 82 49 179 11 77 17 1,177 14 200 1,172 5,131
Maharasthra 4,744 19,263 3,032 11,123 667 4,636 58 203 5,390 19,048 3,795 12,248 3,199 14,844 1,216 5,000 446 6,510 992 4,908 22 497 973 3,573 24,534 101,853
Manipur 0 0 0 0 0 0 0 0 0 0 0 0 0 0 0 0 0 0 0 0 0 0 0 0 0 0
Meghalaya 0 0 0 0 0 0 0 0 0 0 0 0 0 0 0 0 0 0 0 0 0 0 0 0 0 0
Mizoram 0 0 0 0 0 0 0 0 0 0 0 0 0 0 0 0 0 0 0 0 0 0 0 0 0 0
Nagaland 0 0 0 0 0 0 0 0 0 0 0 0 0 0 0 0 0 0 0 0 0 0 0 0 0 0
Orissa 46 142 3 37 1 6 0 0 216 783 281 873 2 9 27 92 44 167 11 36 0 0 6 22 637 2,169
Punjab 48 145 17 137 5 9 0 0 415 1,840 163 737 10 52 38 176 52 186 8 53 21 112 7 120 784 3,566
Rajasthan 92 280 35 109 28 43 0 0 1,383 4,564 1,531 4,070 63 161 35 155 40 102 28 90 2 33 20 112 3,259 9,720
Sikkim 0 0 0 0 0 0 0 0 0 0 0 0 0 0 0 0 0 0 0 0 0 0 0 0 0 0
Tamil Nadu 412 1,420 327 1,173 32 165 0 0 1,253 4,572 910 5,508 378 1,483 95 677 75 300 228 1,062 0 0 69 287 3,779 16,648
Telangana 570 3,255 378 2,557 262 1,516 0 0 798 3,088 765 2,540 155 933 97 472 72 245 136 585 5 5 66 342 3,306 15,538
Tripura 0 0 0 0 0 0 0 0 0 0 0 0 0 0 0 0 0 0 0 0 0 0 0 0 0 0
Uttar Pradesh 97 296 55 185 7 15 0 0 1,263 4,554 591 1,896 12 60 21 77 75 197 23 83 2,325 4,715 15 59 4,482 12,137
Uttrakhand 12 36 5 12 0 8 0 0 236 783 122 385 1 7 13 39 14 46 19 44 0 8 1 -3 422 1,366
West Bengal 303 1,230 259 1,137 44 150 0 0 555 1,952 562 1,706 101 451 110 436 198 691 124 577 0 0 37 138 2,293 8,468
Andaman & Nicobar Is. 0 0 0 0 0 0 0 0 0 0 0 0 0 0 0 0 0 0 0 0 0 0 0 0 0 0
Chandigarh 48 168 28 127 3 14 0 0 455 1,928 168 751 6 38 59 240 52 161 20 115 0 0 6 27 843 3,569
Dadra & Nagra Haveli 0 0 0 0 0 0 0 0 0 0 0 0 0 0 0 0 0 0 0 0 0 0 0 0 0 0
Daman & Diu 0 0 0 0 0 0 0 0 0 0 0 0 0 0 0 0 0 0 0 0 0 0 0 0 0 0
Delhi 652 3,821 507 3,213 112 652 0 3 6,342 25,038 1,647 6,775 799 3,756 359 1,572 201 664 597 2,395 0 0 234 936 11,450 48,825
Lakshadweep 0 0 0 0 0 0 0 0 0 0 0 0 0 0 0 0 0 0 0 0 0 0 0 0 0 0
Puducherry 12 37 0 0 - 0 - - 113 335 108 466 0 2 3 8 2 11 0 3 - - 0 2 239 864
Total 8,938 38,494 6,307 26,543 - - 1,345 7,901 58 213 24,239 89,747 14,610 51,389 5,768 27,562 2,862 12,921 1,954 11,644 3,323 15,275 2,401 6,556 1,776 7,610 73,580 295,855
Grand Total
PERIODIC DISCLOSURES
Motor Third Party Liability insurance Personal Accident Medical InsuranceMarine (Hull) Engineering AviationOverseas medical
InsuranceMotor Own Damage
31-March-2016
Fire Marine (Cargo)All Other
MiscellaneousCrop Insurance
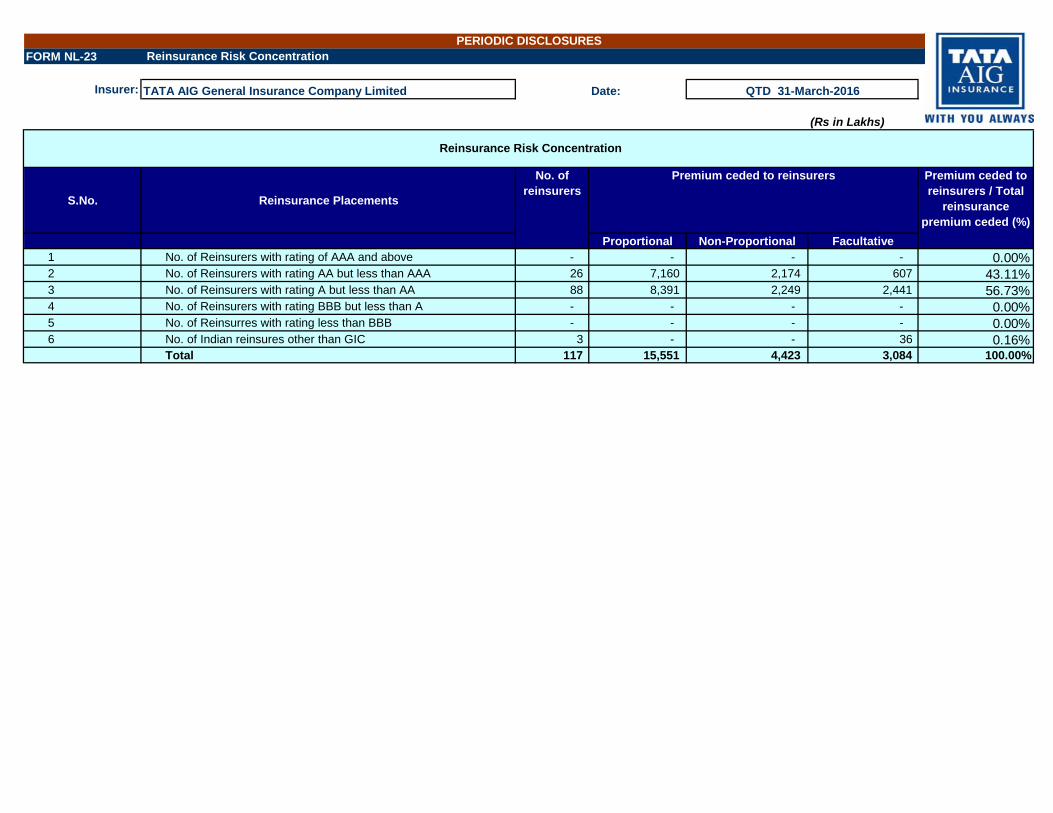
FORM NL-23 Reinsurance Risk Concentration
Insurer: TATA AIG General Insurance Company Limited Date:
(Rs in Lakhs)
S.No. Reinsurance Placements
Proportional Non-Proportional Facultative1 No. of Reinsurers with rating of AAA and above - - - - 0.00%2 No. of Reinsurers with rating AA but less than AAA 26 7,160 2,174 607 43.11%3 No. of Reinsurers with rating A but less than AA 88 8,391 2,249 2,441 56.73%4 No. of Reinsurers with rating BBB but less than A - - - - 0.00%5 No. of Reinsurres with rating less than BBB - - - - 0.00%6 No. of Indian reinsures other than GIC 3 - - 36 0.16%
Total 117 15,551 4,423 3,084 100.00%
PERIODIC DISCLOSURES
QTD 31-March-2016
Reinsurance Risk Concentration
No. of reinsurers
Premium ceded to reinsurers Premium ceded to reinsurers / Total
reinsurance premium ceded (%)

FORM NL-24 Ageing of Claims
Insurer: Tata AIG General Insurance Co. Ltd. Date:
(Rs in Lakhs)
Line of Business Total No. of claims paid
Total amount of
claims paid
1 month 1 - 3 months 3 - 6 months 6 months - 1 year > 1 year
1 Fire 24 135 114 132 59 464 8,460.20 2 Marine Cargo 4,070 3,334 2,052 598 165 10,219 5,943.39
3 Marine Hull - - - -
4 Engineering 40 48 31 31 23 173 429.08
5 Motor OD 58,105 12,404 2,075 494 121 73,199 20,422.64
6 Motor TP 39 87 219 369 785 1,499 6,242.39
7 Health 11,148 2,944 522 321 63 14,998 3,377.78
8 Overseas Travel 424 2,134 402 241 470 3,671 1,338.61
9 Personal Accident 991 1,183 564 180 83 3,001 1,909.29
10 Liability 33 82 59 40 16 230 1,580.91
11 Crop 435 301 24 4 764 6,596.07
12 Aviation - - - -
13 Miscellaneous 2,717 3,716 734 352 36 7,555 983.00 Total 78,026 26,368 6,796 2,758 1,825 115,773 57,283.36
PERIODIC DISCLOSURES
No. of claims paid
31-March-2016
Ageing of Claims - Quarter Ended MARCH 31, 2016
Sl.No.

Insurer: TATA AIG General Insurance Company Limited Date:
No. of claims only
Sl. No. Claims Experience Fire Marine Cargo
Marine Hull
Engineering Motor OD Motor
TP Health Overseas Travel
Personal Accident Liability Crop Credit Miscella
neous Total
1 Claims O/S at the beginning of the period 1,777 15,155 430 15,544 14,990 2,584 1,827 2,137 874 278 10 4,852 60,458 2 Claims reported during the period 528 25,119 295 74,024 2,671 18,319 4,198 4,406 527 873 5 9,296 140,261 3 Claims Settled during the period 464 10,219 173 73,199 1,499 14,998 3,671 3,001 230 764 - 7,555 115,773 4 Claims Repudiated during the period 216 1,556 54 496 - 865 135 388 28 3 227 3,968 5 Claims closed during the period 242 6,298 71 5,525 1,616 1,739 778 1,234 203 193 2 1,842 19,743 6 Claims O/S at End of the period 1,383 22,201 427 10,348 14,546 3,301 1,441 1,920 940 194 10 4,524 61,235
Less than 3months 256 16,078 135 8,195 1,599 2,867 1,267 1,391 292 54 3 3,031 35,168 3 months to 6 months 337 4,628 83 1,063 1,689 303 93 213 151 140 2 714 9,416 6months to 1 year 345 1,002 93 365 2,838 46 59 115 192 - 2 335 5,392 1year and above 445 493 116 725 8,420 85 22 201 305 - 3 444 11,259
31-March-2016
PERIODIC DISCLOSURESFORM NL-25
Quarter Ended March 31, 2016

FORM NL-26 - CLAIMS INFORMATION - KG Table I
Insurer : TATA AIG General Insurance Company Ltd.Solvency as on March 31, 2016Required solvency margin based on net premium and net incurred claims (Rs. in Lacs)
RSM1 Fire 44,662 7,118 35,765 2,555 4,466 5,365 5,365 2 Marine Cargo 27,062 22,508 22,707 18,248 4,502 5,474 5,474 3 Marine Hull4 Motor 141,128 132,770 115,921 106,574 26,554 31,972 31,972 5 Engineering 8,594 633 3,845 226 859 577 859 6 Aviation 213 1 194 0 21 29 29 7 Laibilities 29,536 14,184 7,196 3,929 4,430 1,619 4,430 8 Others 13,636 3,078 21,289 3,615 1,909 4,471 4,471 9 Health 41,162 37,545 25,481 24,163 7,509 7,249 7,509
Total 305,993 217,837 232,398 159,310 50,250 56,756 60,109
Item No. Description
PREMIUM
Gross Premium Net Premium
Gross incurred claim
Net incurred Claim RSM-1 RSM-2

FORM NL-27 Offices information for Non-Life
Insurer: TATA AIG General Insurance Company Limited Date: 31-March-2016
Sl. No.
12
3Out of approvals of previous year
4 Out of approvals of this year56789
PERIODIC DISCLOSURES
Number
985
Office Information
0103
No. of offices at the beginning of the yearNo. of branches approved during the period
No. of branches closed during the periodNo of branches at the end of the period
No. of branches opened during the period 05
No. of branches approved but not openedNo. of rural branchesNo. of urban branches
00
103

FORM NL-28-STATEMENT OF ASSETS - 3BCompany Name & Code: Tata AIG General Insurance Co. Ltd. - Code 108Statement as on: 31-March-2016Statement of Investment Assets(Business within India) Rs. In LakhsPeriodicity of Submission: QuarterlySection I
No PARTICULARS SCH AMOUNT1 Investments 8 368,440 2 Loans 9 - 3 Deferred Tax Asset - 4 Fixed Assets 10 9,808 5 Current Assets
a. Cash & Bank Balance 11 11,626 b. Advances & Other Assets 12 44,591
6 Current Liabilitiesa. Current Liabilities 13 216,092 b. Provisions 14 113,642 c. Misc. Exp not Written Off 15 - d. Debit Balance of P&L A/c -
Application of Funds as per Balance Sheet (A) 104,732
Less: Other Assets SCH Amount 1 Loans (if any) 9 - 2 Fixed Assets (if any) 10 9,808 3 Deferred Tax Asset - 4 Cash & Bank Balance (if any) 11 11,626 5 Advances & Other Assets (if any) 12 44,591 6 Current Liabilities 13 216,092 7 Provisions 14 113,642 8 Misc. Exp not Written Off 15 - 9 Debit Balance of P&L A/c -
TOTAL (B) (263,708) 'Investment Assets' As per FORM 3B (A-B) 368,440
Section II
Balance FRSM+
(a) (b) (c) d = (b+c) (e) (d + e)
1 Central Government SecuritiesNot less than
20%28,219 69,889 98,108 27% 98,108 99,279
2 Central 'G. Sec /State Govt Bondsor Other Apporved Sec. (incl. (1) abovNot less than
30%43,322 107,294 150,617 41% 150,617 152,833
3 Investment subject to Exposure Norms 63,155 156,414 219,569 59% - 217,824 220,021
a. 'Housing & Loans to SG for Housing and FFE,Not less than
15%- -
1.Approved Invetsments 12,590 31,180 43,770 11.82% 43,770 44,137
2.Other Invetsments - - - -
b.' Infrastructure Investments - - - -
1.Approved Invetsments 28,083 69,553 97,636 26.37% 97,636 99,469
2.Other Invetsments - - - -
c. Approved Investments - -
22,482 55,681 78,163 21.11% 1,745- 76,418 76,415
- -
d. Other Investments (not exceeding 25%) - - - - - - -
Total Investment Assets 100% 106,477 263,708 370,186 100% 368,440 372,853
Certification:
Certified that the information given herein are correct and complete to the bestof my knowledge and belief and nothing has been concealed or suppressed
No 'Investment' represented as Reg. %
SHTotal
% Actual
Not exceeding
55%
Market Value
PHBook Value (SH
+ PH)FVC Amount

FORM NL-29 Detail regarding debt securities
Insurer: TATA AIG General Insurance Company Ltd. Date:
(Rs in Lakhs)
As at MARCH 31, 2016
as % of total for this class
As at MARCH 31, 2015
as % of total for this class
As at MARCH 31, 2016
as % of total for this class
As at MARCH 31, 2015
as % of total for this class
Break down by credit ratingAAA rated 149,119 47% 180,375 63% 146,906 47% 170,365 61%AA or better 15,502 5% 2,027 1% 15,519 5% 2,000 1%Rated below AA but above A - 0% - 0% - 0% - 0%Rated below A but above B - 0% - 0% - 0% - 0%Any other 152,833 48% 105,813 37% 150,617 48% 105,091 38%Total 317,454 100% 288,216 100% 313,041 100% 277,456 100%BREAKDOWN BY RESIDUALMATURITYUp to 1 year 42,336 13% 64,100 22% 42,236 13% 64,092 23%
more than 1 yearand upto 3years 37,250 12% 32,556 11% 37,123 12% 32,337 12%
More than 3years and up to 7years 102,276 32% 27,472 10% 100,992 32% 26,652 10%
More than 7 years and up to 10 years 64,205 20% 45,702 16% 62,817 20% 44,280 16%
above 10 years 71,388 22% 118,386 41% 69,874 22% 110,095 40%Total 317,454 100% 288,216 100% 313,041 100% 277,456 100%Breakdown by type of the issurera. Central Government 99,279 31% 97,724 34% 98,108 31% 97,007 35%b. State Government 53,553 17% 8,089 3% 52,509 17% 8,084 3%c.Corporate Securities 164,621 52% 182,403 63% 162,425 52% 172,365 62%Total 317,454 100% 288,216 100% 313,041 100% 277,456 100%
Note1. In case of a debt instrument is rated by more than one agency, then the lowest rating will be taken for the purpose of classification.
PERIODIC DISCLOSURES
2. Market value of the securities will be in accordnace with the valuation method specified by the Authority under Accounting/ Investment regulations.
MARKET VALUE Book ValueDetail Regarding debt securities
31-March-2016

FORM NL-30 Analytical Ratios
Insurer: TATA AIG General Insurance Company Ltd. Date:
Sl.No. Particular Total FIRE MARINE
Motor-OD Motor-TP Motor Total Workmen's Compensation
Personal Accident Health Insurance Liability Engineering Trade Credit Aviation Others Total
1 Gross Direct Premium Growth Rate 9% 10% 7% 14% 18% 15% 23% -9% 13% 11% 9% 42% -3% -31% 9%2 Gross Direct Premium to Net Worth Ratio 2.783 Growth rate of Net Worth 28%4 Net Retention Ratio 70% 15% 83% 94% 94% 94% 93% 90% 92% 43% 7% 55% 0% 17% 80%5 Net Commission Ratio 4% -77% 11% 8% 0% 5% 13% 7% 5% 26% -192% 15% -1290% 5% 6%
6 Expense of Management to Gross Direct Premium Ratio 30%
7 Expense of Management to Net Written Premium Ratio 41%8 Net Incurred Claims to Net Earned Premium 77%9 Combined Ratio 112%10 Technical Reserves to Net Premium Ratio 1.2411 Underwriting Balance Ratio -0.14 -0.05 -0.11 -0.13 -0.26 -0.18 0.25 -0.02 -0.17 0.02 2.31 0.16 14.32 -0.83 -0.1512 Operating Profit Ratio -3%13 Liquid Assets to Liabilities Ratio 0.3014 Net Earning Ratio 1%15 Return on Net Worth Ratio 2%16 Available Solvency to Required Solvency Margin Ratio 1.6617 NPA Ratio
Gross NPA Ratio NANet NPA Ratio NA
Sl.No. Particular Total FIRE MARINE
Motor-OD Motor-TP Motor Total Workmen's Compensation
Personal Accident Health Insurance Liability Engineering Trade Credit Aviation Others Total
1 Gross Direct Premium Growth Rate 15% 12% 10% 12% 19% 14% 7% -5% 11% 12% -5% 13% -18% 135% 16%2 Gross Direct Premium to Net Worth Ratio 3.253 Growth rate of Net Worth 15%4 Net Retention Ratio 70% 15% 86% 94% 94% 94% 84% 93% 95% 42% 8% 58% 0% 18% 78%5 Net Commission Ratio 2% -94% 13% 7% 0% 5% 7% 7% 6% 24% -191% 15% -4330% -71% 4%
6 Expense of Management to Gross Direct Premium Ratio 28%
7 Expense of Management to Net Written Premium Ratio 38%8 Net Incurred Claims to Net Earned Premium 71%9 Combined Ratio 102%10 Technical Reserves to Net Premium Ratio 1.1511 Underwriting Balance Ratio -0.05 0.85 -0.03 -0.01 -0.27 -0.10 0.20 -0.04 -0.22 0.32 2.19 0.32 21.71 0.21 -0.0612 Operating Profit Ratio 7%13 Liquid Assets to Liabilities Ratio 0.4714 Net Earning Ratio 8%15 Return on Net Worth Ratio 18%16 Available Solvency to Required Solvency Margin Ratio 1.5517 NPA Ratio
Gross NPA Ratio NANet NPA Ratio NA
Sl.No. Particular Total FIRE MARINE
Motor-OD Motor-TP Motor Total Workmen's Compensation
Personal Accident Health Insurance Liability Engineering Trade Credit Aviation Others Total
1 Gross Direct Premium Growth Rate -1% -3% 14% -2% 9% 2% 35% -3% -7% 7% 16% 20% -30% -34% -2%2 Gross Direct Premium to Net Worth Ratio 0.693 Growth rate of Net Worth 28%4 Net Retention Ratio 70% 17% 72% 93% 94% 94% 93% 83% 82% 26% 12% 70% 0% 16% 79%5 Net Commission Ratio 6% -33% 12% 8% 0% 5% 23% 3% -1% 45% -121% 16% -17550% 148% 7%
6 Expense of Management to Gross Direct Premium Ratio 32%
7 Expense of Management to Net Written Premium Ratio 45%8 Net Incurred Claims to Net Earned Premium 86%9 Combined Ratio 127%10 Technical Reserves to Net Premium Ratio 5.1111 Underwriting Balance Ratio -0.27 -0.89 0.10 -0.23 -0.50 -0.33 0.10 -0.17 -0.32 -0.24 2.11 0.03 29.25 -1.69 -0.3212 Operating Profit Ratio -13.97%13 Liquid Assets to Liabilities Ratio 0.3014 Net Earning Ratio -9%15 Return on Net Worth Ratio -5%16 Available Solvency to Required Solvency Margin Ratio 1.6617 NPA Ratio
Gross NPA Ratio NANet NPA Ratio NA
Sl.No. Particular Total FIRE MARINE
Motor-OD Motor-TP Motor Total Workmen's Compensation
Personal Accident Health Insurance Liability Engineering Trade Credit Aviation Others Total
1 Gross Direct Premium Growth Rate 22% 16% 7% 263% -42% 27% 17% -13% 26% 0% 15% 21% 319% 90% 25%2 Gross Direct Premium to Net Worth Ratio 0.893 Growth rate of Net Worth 15%4 Net Retention Ratio 72% 17% 86% 95% 94% 94% 84% 92% 95% 36% 9% 86% 0% 17% 80%5 Net Commission Ratio 2% -74% 11% 7% 0% 5% 2% 9% 8% 30% -185% 15% 0% -82% 4%
6 Expense of Management to Gross Direct Premium Ratio 29%
7 Expense of Management to Net Written Premium Ratio 39%8 Net Incurred Claims to Net Earned Premium 67%9 Combined Ratio 100%10 Technical Reserves to Net Premium Ratio 4.1711 Underwriting Balance Ratio -0.05 1.18 0.21 -0.12 -0.26 -0.17 0.15 -0.14 -0.31 0.50 3.02 -0.22 105.50 0.52 -0.1012 Operating Profit Ratio 5%13 Liquid Assets to Liabilities Ratio 0.4714 Net Earning Ratio 6%15 Return on Net Worth Ratio 4%16 Available Solvency to Required Solvency Margin Ratio 1.5517 NPA Ratio
Gross NPA Ratio NANet NPA Ratio NA
Analytical Ratios for the Quarter ended MARCH 31, 2016MISCELLANEOUS
Analytical Ratios for the Quarter ended MARCH 31, 2015MISCELLANEOUS
MISCELLANEOUSAnalytical Ratios for the YEAR ENDED MARCH 31, 2015
PERIODIC DISCLOSURES
31-March-2016
Analytical Ratios for the YEAR ENDED MARCH 31, 2016MISCELLANEOUS

FORM NL-31 : RELATED PARTY TRANSACTIONS
INSURER: DATE:(Rs in Lakhs)
FOR THE QUARTER
UP TO THE QUARTER
CORRESPONDING QUARTER OF
THE PRECEEDING
YEAR
UP TO THE QUARTER OF
THE PRECEEDING
YEAR
1 ALBRECHT BUILDER PRIVATE LIMITED (PEEPUL TREE PROPERTIES LIMITED ) FELLOW SUBSIDIARIES PREMIUM RECEIVED 15 15 - -
2 ALBRECHT BUILDER PRIVATE LIMITED (PEEPUL TREE PROPERTIES LIMITED ) FELLOW SUBSIDIARIES SERVICES RECEIVED 633 633 - -
3 ALBRECHT BUILDER PRIVATE LIMITED (PEEPUL TREE PROPERTIES LIMITED ) FELLOW SUBSIDIARIES AMOUNT DUE TO THE ENTITY 3 3
4 ALBRECHT BUILDER PRIVATE LIMITED (PEEPUL TREE PROPERTIES LIMITED ) FELLOW SUBSIDIARIES SECURITY DEPOSIT - 192 - -
5 ARDENT PROPERTIES PVT LIMITED FELLOW SUBSIDIARIES PREMIUM RECEIVED 0 0 - -
6 ARVIND AND SMART VALUE HOMES LLP FELLOW SUBSIDIARIES PREMIUM RECEIVED 2 4 - - 7 AUTOMOTIVE STAMPINGS AND ASSEMBLIES FELLOW SUBSIDIARIES PREMIUM RECEIVED - 5 13 17 8 C-EDGE TECHNOLOGIES LIMITED FELLOW SUBSIDIARIES PREMIUM RECEIVED 10 10 0 8 9 CHARTIS MEMSA HOLDINGS INC JOINT VENTURE PROMOTERS SHARE CAPTIAL 3,640 5,460 985 985 10 CMC LIMITED FELLOW SUBSIDIARIES AMOUNT DUE TO THE ENTITY (53) 9 - - 11 CMC LIMITED FELLOW SUBSIDIARIES PREMIUM RECEIVED - 5 2 15 12 CMC LIMITED FELLOW SUBSIDIARIES SERVICES RECEIVED (73) 394 - 281 13 EWART INVESTMENTS LIMITED FELLOW SUBSIDIARIES PREMIUM RECEIVED 5 5 5 5 14 E NXT FINANCIALS LIMITED FELLOW SUBSIDIARIES PREMIUM RECEIVED - - 0 0 15 HELA SYSTEMS PRIVATE LIMITED FELLOW SUBSIDIARIES PREMIUM RECEIVED 8 25 3 28 16 HL PROMOTERS PRIVATE LIMIED FELLOW SUBSIDIARIES PREMIUM RECEIVED 4 4 - - 17 INDIAN ROTORCRAFT LIMITED FELLOW SUBSIDIARIES PREMIUM RECEIVED - 0 0 2
18 INFINITI RETAIL LIMITED FELLOW SUBSIDIARIES CLAIMS PAID 4 123 5 14 19 INFINITI RETAIL LIMITED FELLOW SUBSIDIARIES PREMIUM RECEIVED 72 505 136 984 20 INFINITI RETAIL LIMITED FELLOW SUBSIDIARIES SERVICES RECEIVED 1 1 1 1 21 KOLKATA-ONE EXCELTON PRIVATE LIMITED FELLOW SUBSIDIARIES PREMIUM RECEIVED - 0 - -
22 KRIDAY REALTY PRIVATE LIMITED FELLOW SUBSIDIARIES PREMIUM RECEIVED 5 19 6 19
23 KRIDAY REALTY PRIVATE LIMITED FELLOW SUBSIDIARIES CLAIMS PAID - - - 39
24 LEMON TREE LAND & DEVELOPERS PVT LIMITED FELLOW SUBSIDIARIES PREMIUM RECEIVED 6 24 7 24
25 LANDMARK E-TAIL LIMITED FELLOW SUBSIDIARIES PREMIUM RECEIVED 1 1 - - 26 NOVA INTEGRATED SYSTEMS LIMITED FELLOW SUBSIDIARIES PREMIUM RECEIVED 7 13 2 15 27 PROMONT HILLTOP PRIVATE LIMITED FELLOW SUBSIDIARIES PREMIUM RECEIVED 5 5 1 33 28 PRINCETON INFRASTRUCTURE PRIVATE LIMITED FELLOW SUBSIDIARIES PREMIUM RECEIVED 4 4 - - 29 PUNE SOLAPUR EXPRESSWAYS PVT LIMITED FELLOW SUBSIDIARIES CLAIMS PAID - 0 - - 30 PUNE SOLAPUR EXPRESSWAYS PVT LIMITED FELLOW SUBSIDIARIES PREMIUM RECEIVED - 2 - - 31 SMART VALUE HOMES (BOISAR) PVT.LIMITED FELLOW SUBSIDIARIES PREMIUM RECEIVED 0 0 - -
32 SMART VALUE HOMES NEW PROJECT LLP FELLOW SUBSIDIARIES PREMIUM RECEIVED - 0 - -
33 SMART VALUE HOMES PEENYA PROJECT PVT LIMITED FELLOW SUBSIDIARIES PREMIUM RECEIVED (0) 0 2 2
PERIODIC DISCLOSURES
TATA AIG GENERAL INSURANCE COMPANY LIMITED 31-March-2016
`
SL.NO. NAME OF THE RELATED PARTY NATURE OF RELATIONSHIP WITH THE CCOMPANY
DESCRIPTION OF TRANSACTIONS / CATEGORIES
CONSIDERATION PAID / RECEIVED
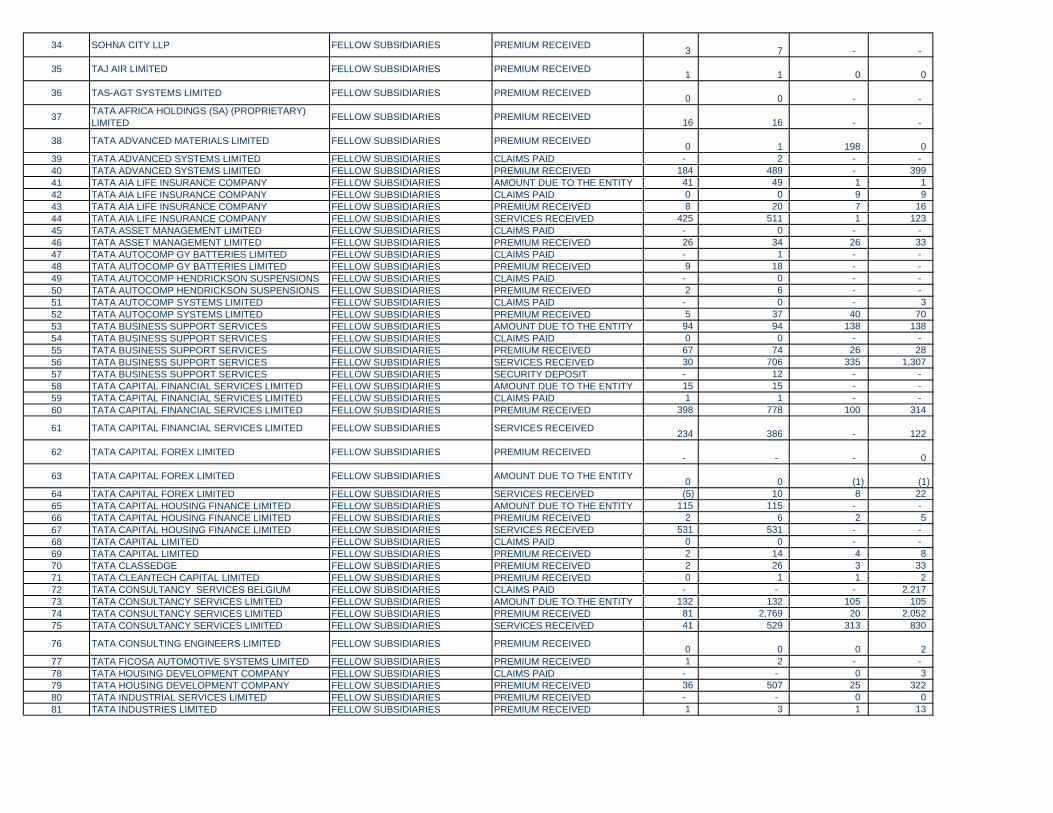
34 SOHNA CITY LLP FELLOW SUBSIDIARIES PREMIUM RECEIVED 3 7 - -
35 TAJ AIR LIMITED FELLOW SUBSIDIARIES PREMIUM RECEIVED 1 1 0 0
36 TAS-AGT SYSTEMS LIMITED FELLOW SUBSIDIARIES PREMIUM RECEIVED 0 0 - -
37 TATA AFRICA HOLDINGS (SA) (PROPRIETARY) LIMITED FELLOW SUBSIDIARIES PREMIUM RECEIVED 16 16 - -
38 TATA ADVANCED MATERIALS LIMITED FELLOW SUBSIDIARIES PREMIUM RECEIVED 0 1 198 0 39 TATA ADVANCED SYSTEMS LIMITED FELLOW SUBSIDIARIES CLAIMS PAID - 2 - - 40 TATA ADVANCED SYSTEMS LIMITED FELLOW SUBSIDIARIES PREMIUM RECEIVED 184 489 - 399 41 TATA AIA LIFE INSURANCE COMPANY FELLOW SUBSIDIARIES AMOUNT DUE TO THE ENTITY 41 49 1 1 42 TATA AIA LIFE INSURANCE COMPANY FELLOW SUBSIDIARIES CLAIMS PAID 0 0 9 9 43 TATA AIA LIFE INSURANCE COMPANY FELLOW SUBSIDIARIES PREMIUM RECEIVED 8 20 7 16 44 TATA AIA LIFE INSURANCE COMPANY FELLOW SUBSIDIARIES SERVICES RECEIVED 425 511 1 123 45 TATA ASSET MANAGEMENT LIMITED FELLOW SUBSIDIARIES CLAIMS PAID - 0 - - 46 TATA ASSET MANAGEMENT LIMITED FELLOW SUBSIDIARIES PREMIUM RECEIVED 26 34 26 33 47 TATA AUTOCOMP GY BATTERIES LIMITED FELLOW SUBSIDIARIES CLAIMS PAID - 1 - - 48 TATA AUTOCOMP GY BATTERIES LIMITED FELLOW SUBSIDIARIES PREMIUM RECEIVED 9 18 - - 49 TATA AUTOCOMP HENDRICKSON SUSPENSIONS FELLOW SUBSIDIARIES CLAIMS PAID - 0 - - 50 TATA AUTOCOMP HENDRICKSON SUSPENSIONS FELLOW SUBSIDIARIES PREMIUM RECEIVED 2 6 - - 51 TATA AUTOCOMP SYSTEMS LIMITED FELLOW SUBSIDIARIES CLAIMS PAID - 0 - 3 52 TATA AUTOCOMP SYSTEMS LIMITED FELLOW SUBSIDIARIES PREMIUM RECEIVED 5 37 40 70 53 TATA BUSINESS SUPPORT SERVICES FELLOW SUBSIDIARIES AMOUNT DUE TO THE ENTITY 94 94 138 138 54 TATA BUSINESS SUPPORT SERVICES FELLOW SUBSIDIARIES CLAIMS PAID 0 0 - - 55 TATA BUSINESS SUPPORT SERVICES FELLOW SUBSIDIARIES PREMIUM RECEIVED 67 74 26 28 56 TATA BUSINESS SUPPORT SERVICES FELLOW SUBSIDIARIES SERVICES RECEIVED 30 706 335 1,307 57 TATA BUSINESS SUPPORT SERVICES FELLOW SUBSIDIARIES SECURITY DEPOSIT - 12 - - 58 TATA CAPITAL FINANCIAL SERVICES LIMITED FELLOW SUBSIDIARIES AMOUNT DUE TO THE ENTITY 15 15 - - 59 TATA CAPITAL FINANCIAL SERVICES LIMITED FELLOW SUBSIDIARIES CLAIMS PAID 1 1 - - 60 TATA CAPITAL FINANCIAL SERVICES LIMITED FELLOW SUBSIDIARIES PREMIUM RECEIVED 398 778 100 314
61 TATA CAPITAL FINANCIAL SERVICES LIMITED FELLOW SUBSIDIARIES SERVICES RECEIVED 234 386 - 122
62 TATA CAPITAL FOREX LIMITED FELLOW SUBSIDIARIES PREMIUM RECEIVED - - - 0
63 TATA CAPITAL FOREX LIMITED FELLOW SUBSIDIARIES AMOUNT DUE TO THE ENTITY 0 0 (1) (1)64 TATA CAPITAL FOREX LIMITED FELLOW SUBSIDIARIES SERVICES RECEIVED (5) 10 8 22 65 TATA CAPITAL HOUSING FINANCE LIMITED FELLOW SUBSIDIARIES AMOUNT DUE TO THE ENTITY 115 115 - - 66 TATA CAPITAL HOUSING FINANCE LIMITED FELLOW SUBSIDIARIES PREMIUM RECEIVED 2 6 2 5 67 TATA CAPITAL HOUSING FINANCE LIMITED FELLOW SUBSIDIARIES SERVICES RECEIVED 531 531 - - 68 TATA CAPITAL LIMITED FELLOW SUBSIDIARIES CLAIMS PAID 0 0 - - 69 TATA CAPITAL LIMITED FELLOW SUBSIDIARIES PREMIUM RECEIVED 2 14 4 8 70 TATA CLASSEDGE FELLOW SUBSIDIARIES PREMIUM RECEIVED 2 26 3 33 71 TATA CLEANTECH CAPITAL LIMITED FELLOW SUBSIDIARIES PREMIUM RECEIVED 0 1 1 2 72 TATA CONSULTANCY SERVICES BELGIUM FELLOW SUBSIDIARIES CLAIMS PAID - - - 2,217 73 TATA CONSULTANCY SERVICES LIMITED FELLOW SUBSIDIARIES AMOUNT DUE TO THE ENTITY 132 132 105 105 74 TATA CONSULTANCY SERVICES LIMITED FELLOW SUBSIDIARIES PREMIUM RECEIVED 81 2,769 20 2,052 75 TATA CONSULTANCY SERVICES LIMITED FELLOW SUBSIDIARIES SERVICES RECEIVED 41 529 313 830
76 TATA CONSULTING ENGINEERS LIMITED FELLOW SUBSIDIARIES PREMIUM RECEIVED 0 0 0 2 77 TATA FICOSA AUTOMOTIVE SYSTEMS LIMITED FELLOW SUBSIDIARIES PREMIUM RECEIVED 1 2 - - 78 TATA HOUSING DEVELOPMENT COMPANY FELLOW SUBSIDIARIES CLAIMS PAID - - 0 3 79 TATA HOUSING DEVELOPMENT COMPANY FELLOW SUBSIDIARIES PREMIUM RECEIVED 36 507 25 322 80 TATA INDUSTRIAL SERVICES LIMITED FELLOW SUBSIDIARIES PREMIUM RECEIVED - - 0 0 81 TATA INDUSTRIES LIMITED FELLOW SUBSIDIARIES PREMIUM RECEIVED 1 3 1 13

82 TATA INDUSTRIES LIMITED DHP FELLOW SUBSIDIARIES PREMIUM RECEIVED 2 2 - - 83 TATA INTERACTIVE SYSTEMS FELLOW SUBSIDIARIES CLAIMS PAID 0 0 0 0 84 TATA INTERACTIVE SYSTEMS FELLOW SUBSIDIARIES PREMIUM RECEIVED 11 14 12 15 85 TATA INTERACTIVE SYSTEMS FELLOW SUBSIDIARIES SERVICES RECEIVED - 1 7 7 86 TATA INTERNATIONAL DLT PRIVATE LIMITED FELLOW SUBSIDIARIES CLAIMS PAID (1) 1 - - 87 TATA INTERNATIONAL DLT PRIVATE LIMITED FELLOW SUBSIDIARIES PREMIUM RECEIVED 2 2 - - 88 TATA INTERNATIONAL LIMITED FELLOW SUBSIDIARIES CLAIMS PAID - 0 - - 89 TATA INTERNATIONAL LIMITED FELLOW SUBSIDIARIES SERVICES RECEIVED - - - 1 90 TATA INTERNATIONAL LIMITED FELLOW SUBSIDIARIES PREMIUM RECEIVED (0) 22 10 28 91 TATA LOCKHEED MARTIN AEROSTRUCTURES FELLOW SUBSIDIARIES PREMIUM RECEIVED 95 118 97 109 92 TATA LIMITED FELLOW SUBSIDIARIES CLAIMS PAID 0 0 - - 93 TATA LIMITED FELLOW SUBSIDIARIES PREMIUM RECEIVED 22 69 9 64 94 TATA PETRODYNE LIMITED FELLOW SUBSIDIARIES PREMIUM RECEIVED 0 1 0 0 95 TATA REALTY AND INFRASTRUCTURE LIMITED FELLOW SUBSIDIARIES PREMIUM RECEIVED 24 99 - 83 96 TATA SECURITIES LIMITED FELLOW SUBSIDIARIES PREMIUM RECEIVED 0 1 - 1 97 TATA SIA AIRLINES LIMITED FELLOW SUBSIDIARIES PREMIUM RECEIVED 0 4 1 1 98 TATA SIKORSKY AEROSPACE LIMITED FELLOW SUBSIDIARIES PREMIUM RECEIVED 6 62 6 67 99 TATA SKY LIMITED FELLOW SUBSIDIARIES CLAIMS PAID 22 129 2 15
100 TATA SKY LIMITED FELLOW SUBSIDIARIES PREMIUM RECEIVED 0 195 3 212 101 TATA SONS LIMITED HOILDING CLAIMS PAID 0 0 - - 102 TATA SONS LIMITED HOILDING PREMIUM RECEIVED 5 102 8 118 103 TATA SONS LIMITED HOILDING SERVICES RECEIVED 57 69 4 11 104 TATA SONS LIMITED HOILDING AMOUNT DUE TO THE ENTITY 54 54 1 1 105 TATA SONS LIMITED HOILDING DIVIDEND PAID - - 2,803 2,803 106 TATA SONS LIMITED HOILDING SHARE CAPTIAL 10,360 15,540 - - 107 TATA STRATEGIC MANAGEMENT GROUP FELLOW SUBSIDIARIES PREMIUM RECEIVED 1 1 - - 108 TATA TRUSTEE COMPANY LIMITED FELLOW SUBSIDIARIES PREMIUM RECEIVED 26 26 26 26 109 TATA TOYO RADIATOR LIMITED FELLOW SUBSIDIARIES CLAIMS PAID 0 0 3 7 110 TATA TOYO RADIATOR LIMITED FELLOW SUBSIDIARIES PREMIUM RECEIVED 0 24 19 29 111 TATA UNISTORE LIMITED FELLOW SUBSIDIARIES PREMIUM RECEIVED 2 2 - - 112 TATA VALUE HOMES LIMITED FELLOW SUBSIDIARIES PREMIUM RECEIVED 3 13 3 19 113 TC TRAVEL & SERVICES LIMITED FELLOW SUBSIDIARIES AMOUNT DUE TO THE ENTITY 48 51 12 12 114 TC TRAVEL & SERVICES LIMITED FELLOW SUBSIDIARIES CLAIMS PAID 0 0 - 0 115 TC TRAVEL & SERVICES LIMITED FELLOW SUBSIDIARIES PREMIUM RECEIVED 20 54 14 58 116 TC TRAVEL & SERVICES LIMITED FELLOW SUBSIDIARIES SERVICES RECEIVED 631 891 51 244 117 THDC FACILITY MANAGEMENT LIMITED FELLOW SUBSIDIARIES PREMIUM RECEIVED 25 27 2 7 118 TRIF AMRITSAR PROJECTS LIMITED FELLOW SUBSIDIARIES PREMIUM RECEIVED - 0 - - 119 TRIF KOCHI PROJECTS PRIVATE LIMITED FELLOW SUBSIDIARIES PREMIUM RECEIVED - 13 - -
120 TRIF REAL ESTATE & DEVELOPMENT PVT LIMITED FELLOW SUBSIDIARIES PREMIUM RECEIVED 8 13 - -
121 TRIF REAL ESTATE & DEVELOPMENT PVT LIMITED FELLOW SUBSIDIARIES CLAIMS PAID 35 35 - - 122 TRIL CONSTRUCTIONS LIMITED FELLOW SUBSIDIARIES PREMIUM RECEIVED 0 0 - - 123 TRIL INFOPARK LIMITED FELLOW SUBSIDIARIES PREMIUM RECEIVED - 47 - - 124 VIOM NETWORKS LIMITED FELLOW SUBSIDIARIES PREMIUM RECEIVED 0 11 - 14
125 KAUSHAL K. MISHRA KEY MANAGEMENT PERSONNEL REMUNERATION 50 297 57 233
126 NEELESH GARG KEY MANAGEMENT PERSONNEL REMUNERATION 20 358 - - Total 18,325 33,716 5,677 14,833

FORM NL-32
Insurer: TATA AIG GENERAL INSURANCE COMPANY LIMITED Date:
List below the products and/or add-ons introduced during the period
Sl. No. Name of Product Co. Ref. No. IRDA Ref.no. Class of Business* Category of product Date of filing of Product
Date IRDA confirmed filing/ approval
1 Product Recall Insurance TAG-LI-P15-35-V01-15-16 TAG‐LI‐P15‐35‐V01‐15‐16 Miscellaneous Insurance Casualty Line 26‐Feb‐15 27‐Aug‐15
Products Information - For the Quarter Ended March 2016
PERIODIC DISCLOSURES Products Information
31-March-2016

TABLE - IIInsurer: TATA AIG General Insurance Company LimitedSolvency as on March 31, 2016Available Solvency Margin and Solvency Ratio
(Rs. in Lacs)Item Description Notes No. Amount(1) (2) (3) (4)1 Available Assets in Policyholders’ Funds (adjusted value 329,733
of Assets as mentioned in Form IRDA-Assets-AA): - Deduct: -
2 Liabilities (reserves as mentioned in Form HG) 269,408 -
3 Other Liabilities (other liabilities in respect of 60,325 Policyholders’ Fund as mentioned in Balance Sheet)
4 Excess in Policyholders’ Funds (1-2-3) (0)
5 Available Assets in Shareholders’ Funds (value ofAssets as mentioned in Form IRDA-Assets-AA): 99,569 Deduct:
6 Other Liabilities (other liabilities in respect of Shareholders’ Fund as mentioned in Balance Sheet) -
7 Excess in Shareholders’ Funds (5-6) 99,569
8 Total Available Solvency Margin [ASM] (4+7) 99,569
9 Total Required Solvency Margin [RSM] 60,109
10 Solvency Ratio (Total ASM/Total RSM) 1.66
PERIODIC DISCLOSURESFORM NL-33 - SOLVENCY MARGIN - KGII

FORM NL-34
Insurer: Tata AIG General Insurance Co. Ltd. Date:
Sl. No. Name of person Role/designation1 Mr. Ishaat Hussain Chairman2 Mr. B.D. Banerjee Independent Director No Change3 Mr. F.N. Subedar Director No Change4 Mr. Janki Ballabh Independent Director No Change5 Ms. Seraina Maag Director No Change6 Mr. Madhusudan Kannan Director No Change7 Mr. Michael Jensen Director No Change8 Mr. Neelesh Garg Managing Director & CEO No Change9 Mr. Kurush J Daruwalla Chief Operating Officer & Company Secretary No Change
10 Mr. M. Ravichandran President-Insurance No Change11 Mr. Miranjit Mukherjee Executive Vice President Finance & CFO No Change12 Mr. Subramanian Suryanarayanan Chief Human Resource Officer No Change13 Mr. Saket Singhal Appointed Actuary No Change14 Mr. Koushik Gopinath Chief Investment Officer No Change15 Mr. Vijay Pandit National Head - Internal Audit No Change
Key Persons as defined in IRDA Registration of Companies Regulations, 2000
No Change
PERIODIC DISCLOSURES: Board of Directors & Key Person
BOD and Key Person informationDetails of change in the period
31-March-2016

FORM NL-35-NON PERFORMING ASSETS-7A
Company Name & Code: Tata AIG General Insurance Co. Ltd. - Code 108
Statement as on: 31-March-2016
Details of Investment Portfolio
Periodicity of Submission : Quarterly
% Has there been revision? Amount Board
Approval Ref
CERTIFICATION
Certified that the information given herein are correct and complete to the best of my knowledge and belief and nothing has been concealed or suppressed.
NIL
Name of the Fund
COI Company Name Instrument Type
Interest RateTotal O/s
(Book Value)
Default Principal (Book
Value)
Default Interest (Book Value)
Principal Due from
Interest Due from
Deferred Principal
Deferred Interest Provision (Rs)Rolled Over?
Has there been any Principal Waiver?
Classification Provision (%)
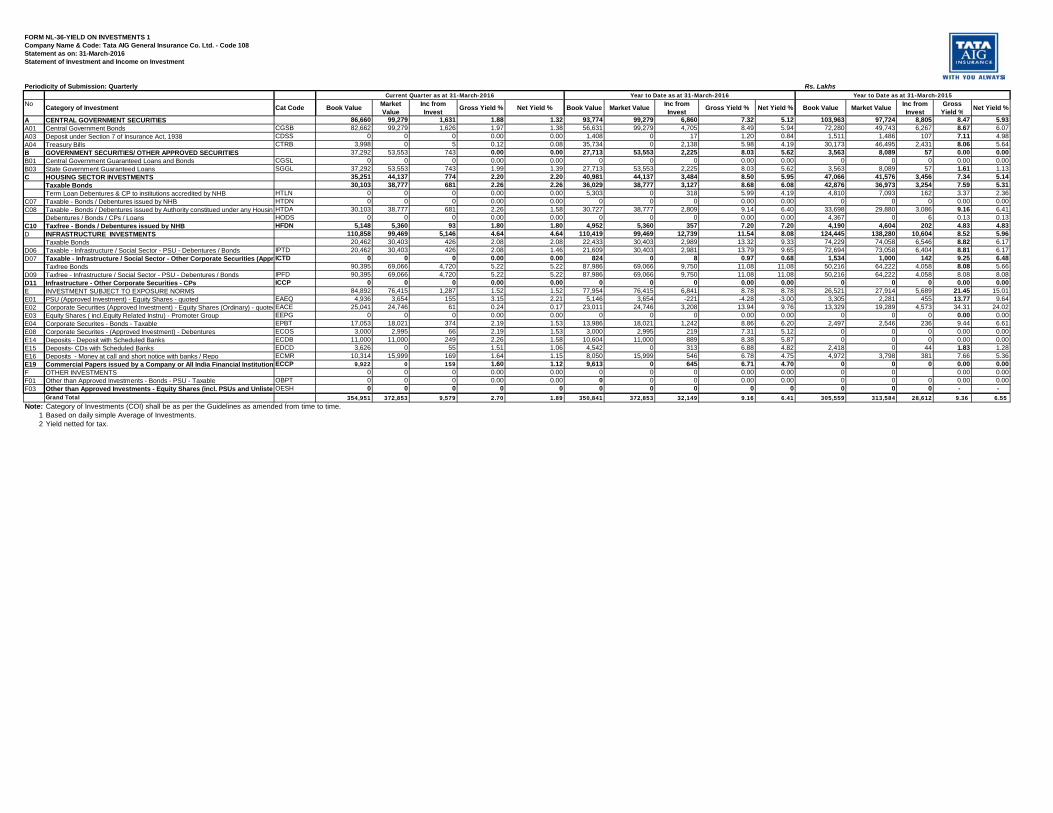
FORM NL-36-YIELD ON INVESTMENTS 1Company Name & Code: Tata AIG General Insurance Co. Ltd. - Code 108Statement as on: 31-March-2016Statement of Investment and Income on Investment
Periodicity of Submission: Quarterly Rs. Lakhs
No Category of Investment Cat Code Book Value Market Value
Inc from Invest Gross Yield % Net Yield % Book Value Market Value Inc from
Invest Gross Yield % Net Yield % Book Value Market Value Inc from Invest
Gross Yield % Net Yield %
A CENTRAL GOVERNMENT SECURITIES 86,660 99,279 1,631 1.88 1.32 93,774 99,279 6,860 7.32 5.12 103,963 97,724 8,805 8.47 5.93A01 Central Government Bonds CGSB 82,662 99,279 1,626 1.97 1.38 56,631 99,279 4,705 8.49 5.94 72,280 49,743 6,267 8.67 6.07A03 Deposit under Section 7 of Insurance Act, 1938 CDSS 0 0 0 0.00 0.00 1,408 0 17 1.20 0.84 1,511 1,486 107 7.11 4.98A04 Treasury Bills CTRB 3,998 0 5 0.12 0.08 35,734 0 2,138 5.98 4.19 30,173 46,495 2,431 8.06 5.64B GOVERNMENT SECURITIES/ OTHER APPROVED SECURITIES 37,292 53,553 743 0.00 0.00 27,713 53,553 2,225 8.03 5.62 3,563 8,089 57 0.00 0.00B01 Central Government Guaranteed Loans and Bonds CGSL 0 0 0 0.00 0.00 0 0 0 0.00 0.00 0 0 0 0.00 0.00B03 State Government Guaranteed Loans SGGL 37,292 53,553 743 1.99 1.39 27,713 53,553 2,225 8.03 5.62 3,563 8,089 57 1.61 1.13C HOUSING SECTOR INVESTMENTS 35,251 44,137 774 2.20 2.20 40,981 44,137 3,484 8.50 5.95 47,066 41,576 3,456 7.34 5.14
Taxable Bonds 30,103 38,777 681 2.26 2.26 36,029 38,777 3,127 8.68 6.08 42,876 36,973 3,254 7.59 5.31Term Loan Debentures & CP to institutions accredited by NHB HTLN 0 0 0 0.00 0.00 5,303 0 318 5.99 4.19 4,810 7,093 162 3.37 2.36
C07 Taxable - Bonds / Debentures issued by NHB HTDN 0 0 0 0.00 0.00 0 0 0 0.00 0.00 0 0 0 0.00 0.00C08 Taxable - Bonds / Debentures issued by Authority constitued under any HousingHTDA 30,103 38,777 681 2.26 1.58 30,727 38,777 2,809 9.14 6.40 33,698 29,880 3,086 9.16 6.41
Debentures / Bonds / CPs / Loans HODS 0 0 0 0.00 0.00 0 0 0 0.00 0.00 4,367 0 6 0.13 0.13C10 Taxfree - Bonds / Debentures issued by NHB HFDN 5,148 5,360 93 1.80 1.80 4,952 5,360 357 7.20 7.20 4,190 4,604 202 4.83 4.83D INFRASTRUCTURE INVESTMENTS 110,858 99,469 5,146 4.64 4.64 110,419 99,469 12,739 11.54 8.08 124,445 138,280 10,604 8.52 5.96
Taxable Bonds 20,462 30,403 426 2.08 2.08 22,433 30,403 2,989 13.32 9.33 74,229 74,058 6,546 8.82 6.17D06 Taxable - Infrastructure / Social Sector - PSU - Debentures / Bonds IPTD 20,462 30,403 426 2.08 1.46 21,609 30,403 2,981 13.79 9.65 72,694 73,058 6,404 8.81 6.17D07 Taxable - Infrastructure / Social Sector - Other Corporate Securities (Appr ICTD 0 0 0 0.00 0.00 824 0 8 0.97 0.68 1,534 1,000 142 9.25 6.48
Taxfree Bonds 90,395 69,066 4,720 5.22 5.22 87,986 69,066 9,750 11.08 11.08 50,216 64,222 4,058 8.08 5.66D09 Taxfree - Infrastructure / Social Sector - PSU - Debentures / Bonds IPFD 90,395 69,066 4,720 5.22 5.22 87,986 69,066 9,750 11.08 11.08 50,216 64,222 4,058 8.08 8.08D11 Infrastructure - Other Corporate Securities - CPs ICCP 0 0 0 0.00 0.00 0 0 0 0.00 0.00 0 0 0 0.00 0.00E INVESTMENT SUBJECT TO EXPOSURE NORMS 84,892 76,415 1,287 1.52 1.52 77,954 76,415 6,841 8.78 8.78 26,521 27,914 5,689 21.45 15.01E01 PSU (Approved Investment) - Equity Shares - quoted EAEQ 4,936 3,654 155 3.15 2.21 5,146 3,654 -221 -4.28 -3.00 3,305 2,281 455 13.77 9.64E02 Corporate Securities (Approved Investment) - Equity Shares (Ordinary) - quotedEACE 25,041 24,746 61 0.24 0.17 23,011 24,746 3,208 13.94 9.76 13,329 19,289 4,573 34.31 24.02E03 Equity Shares ( incl.Equity Related Instru) - Promoter Group EEPG 0 0 0 0.00 0.00 0 0 0 0.00 0.00 0 0 0 0.00 0.00E04 Corporate Securites - Bonds - Taxable EPBT 17,053 18,021 374 2.19 1.53 13,986 18,021 1,242 8.86 6.20 2,497 2,546 236 9.44 6.61E08 Corporate Securites - (Approved Investment) - Debentures ECOS 3,000 2,995 66 2.19 1.53 3,000 2,995 219 7.31 5.12 0 0 0 0.00 0.00E14 Deposits - Deposit with Scheduled Banks ECDB 11,000 11,000 249 2.26 1.58 10,604 11,000 889 8.38 5.87 0 0 0 0.00 0.00E15 Deposits- CDs with Scheduled Banks EDCD 3,626 0 55 1.51 1.06 4,542 0 313 6.88 4.82 2,418 0 44 1.83 1.28E16 Deposits - Money at call and short notice with banks / Repo ECMR 10,314 15,999 169 1.64 1.15 8,050 15,999 546 6.78 4.75 4,972 3,798 381 7.66 5.36E19 Commercial Papers issued by a Company or All India Financial InstitutionsECCP 9,922 0 159 1.60 1.12 9,613 0 645 6.71 4.70 0 0 0 0.00 0.00F OTHER INVESTMENTS 0 0 0 0.00 0.00 0 0 0 0.00 0.00 0 0 0.00 0.00F01 Other than Approved Investments - Bonds - PSU - Taxable OBPT 0 0 0 0.00 0.00 0 0 0 0.00 0.00 0 0 0 0.00 0.00F03 Other than Approved Investments - Equity Shares (incl. PSUs and UnlistedOESH 0 0 0 0 0 0 0 0 0 0 0 0 0 - -
Grand Total 354,951 372,853 9,579 2.70 1.89 350,841 372,853 32,149 9.16 6.41 305,559 313,584 28,612 9.36 6.55 Note: Category of Investments (COI) shall be as per the Guidelines as amended from time to time.
1 Based on daily simple Average of Investments.2 Yield netted for tax.
Current Quarter as at 31-March-2016 Year to Date as at 31-March-2016 Year to Date as at 31-March-2015

FORM NL-37-DOWN GRADING OF INVESTMENT-2
Company Name & Code: Tata AIG General Insurance Co. Ltd. - Code 108
Statement as on: 31-March-2016 Name of Fund
From Date : 01-January-2016 To Date : 31-March-2016
Statement of Down Graded Investments
Periodicity of Submission: Quarterly
Rs. Lakhs
No Name of the Security COI Amount Date of Purchase Rating Agency Original Grade Current Grade Date of
Downgrade Remarks
A. During the Quarter ¹
8.38% SAIL- 16-Dec-2017 EPBT 2,003 3-Jul-15 CARE AAA AA+ 16-Mar-16
B. As on Date ²
8.38% SAIL- 16-Dec-2017 EPBT 2,003 3-Jul-15 CARE AAA AA+ 16-Mar-16
CERTIFICATION
Certified that the information given herein are correct and complete to the best of my
knowledge and belief and nothing has been concealed or suppressed.
Date:
Note:
1 Provide details of Down Graded Investments during the Quarter.
2 Investments currently upgraded, listed as Down Graded during earlier Quarter shall be deleted from the Cumulative listing.
3 FORM-2 shall be prepared in respect of each fund.
4 Category of Investmet (COI) shall be as per INV/GLN/001/2003-04

Insurer: Tata AIG General Insurance Co. Ltd. Date:
(Rs in Lakhs)
Premium No. of Policies Premium No. of Policies Premium No. of Policies Premium No. of Policies1 Fire 8,938 36,054 9,211 46,228 38,494 117,449 34,863 117,823 2 Cargo & Hull 6,307 10,075 5,513 7,577 26,543 35,328 24,905 28,840 3 Motor TP 14,610 49,790 13,433 37,978 51,389 137,766 43,404 353,285 4 Motor OD 24,239 319,155 24,746 344,148 89,747 1,172,383 79,054 942,373 5 Engineering 1,345 1,062 1,160 1,425 7,901 4,107 7,239 3,552 6 Workmen's Compensation 740 2,416 548 1,675 8,741 8,261 2,179 6,392 7 Employer's Liability 5,028 2,830 4,683 2,527 18,820 9,851 22,347 9,592 8 Aviation 58 2 83 2 213 9 220 9 9 Personal Accident 2,862 195,951 2,959 712,037 12,921 871,558 14,146 1,419,373 10 Health 5,277 160,642 5,668 441,959 26,919 721,791 23,782 978,545 11 Others* 4,177 68,672 6,063 34,585 14,166 239,449 19,275 90,637
Total 73,580 846,649 74,068 1,630,141 295,855 3,317,952 271,414 3,950,421
Note:1. Premium stands for amount of premium2. The line of business which are not applicable for any company should be filled up with NA. Figure '0' in those fields will imply no business in the segment.*any other segment contributing more than 5% of the total premium needs to be shown separately
Quarterly Business Returns across line of Business
Upto the period Same period of the previos year
PERIODIC DISCLOSURESFORM NL-38
Current Quarter Same Quarter previous year
Sl.No. Line of Business
31-March-2016

FORM NL-39 Rural & Social Obligations (Quarterly Returns)
Insurer: Tata AIG General Insurance C Date:
(Rs in Lakhs)
Sl.No. Line of Business Particular No. of Policies Issued Premium Collected Sum Assured No. of Policies Issued Premium Collected Sum AssuredRural 7,236 1,131 2,469,496 20,125 3,396 10,392,728 Social - - - - - - Rural 468 632 140,479 1,725 2,473 584,141 Social - - - - - - Rural - 2,056 - - 7,770 - Social - - - - - - Rural 40,789 2,329 150,965 158,078 8,999 614,078 Social - - - - - - Rural 66 41 87,073 163 162 599,720 Social - - - - - - Rural 38 14 53,181 149 123 329,310 Social - - - - - - Rural 656 456 386,991 1,965 1,498 1,052,986 Social - - - - - - Rural - - - - - - Social - - - - - - Rural 8,974 332 823,599 23,263 1,220 3,132,157 Social - - - - 5,947 - Rural 15,798 673 751,034 65,173 5,955 4,768,162 Social - - - - 3,567 - Rural 7,200 2,562 84,434 22,633 7,463 1,066,414 Social - - - - - -
*any other segment contributing more than 5% needs to be shown separately
PERIODIC DISCLOSURES
31-March-2016
CURRENT QUARTER
10 Health
YEAR TO DATE
Rural & Social Obligations (Quarterly Returns)
5 Engineering
4 Motor OD
1 Fire
2 Cargo & Hull
3 Motor TP
11 Others*
6 Workmen's Compensation
7 Employer's Liability
8 Aviation
9 Personal Accident

Insurer: Tata AIG General Insurance Co. Ltd. Date:
(Rs in Lakhs)
1 Individual agents 210,573 21,282 310,472 21,227 810,063 79,692 906,418 72,895 2 Corporate Agents-Banks 120,979 6,097 191,657 6,279 453,225 23,016 542,160 21,563 3 Corporate Agents -Others 44,733 1,379 34,082 778 152,424 4,686 167,641 3,423 4 Brokers 170,255 25,029 436,961 22,440 701,648 109,571 792,197 93,347 5 Micro Agents - - - - - - 6 Direct Business 300,109 19,793 656,969 23,344 1,200,592 78,892 1,542,005 80,186
Total (A) 846,649 73,580 1,630,141 74,068 3,317,952 295,855 3,950,421 271,414 1 Referral (B) - - - - - - - -
Grand Total (A+B) 846,649 73,580 1,630,141 74,068 3,317,952 295,855 3,950,421 271,414
Note:1. Premium means amount of premium received from business acquired by the source2. No of Policies stand for no. of policies sold at coverage level
PERIODIC DISCLOSURESFORM NL-40
Same period of the previous year
Sl.No.
Business Acquisition through different channels
Channels
Current Quarter Same quarter Previous Year Up to the period
PremiumNo. of
PoliciesNo. of
PoliciesPremiumNo. of
Policies Premium
31-March-2016
No. of Policies Premium

Insurer: Tata AIG General Insurance Co. Ltd. Date:
Additions during the quarter
Full Accepted
Partial Accepted Rejected
1 Complaints made by customersa) Proposal Related - 2 2 - - - 15 b) Claim 11 200 63 58 86 4 1,008 c) Policy Related 13 188 157 12 22 10 1,096 d) Premium 3 7 5 4 1 - 45 e) Refund 1 29 25 4 1 - 144 f) Coverage 5 231 60 112 63 1 761 g) Cover Note Related - - - - - - 1 h) Product - 6 3 2 1 - 15 i) Others 3 93 59 13 18 6 378
Total Number of complaints: 36 756 374 205 192 21 3,463
2 Total No. of policies during previous year:
3 Total No. of claims during previous year:
4 Total No. of policies during current year:
5 Total No. of claims during current year:
6Total No. of Policy complaints (current year) per 10,000 policies (current year) ;
7Total No. of Claim Complaints (current year) per 10,000 claims registered (current year)
8 Duration wise Pending StatusComplaints made by
CustomersComplaints made by
Intermediaries Total( a ) Upto 7 days 20 20 ( b ) 7 - 15 Days 1 1 ( c ) 15 - 30 Days( d ) 30 - 90 Days( e ) 90 days & Beyond
Total No. of Complaints 21 - 21
Note:1 Points 1 (a) to 1 (i) and Point No.4 have been considered for the calculation of Point No. 62 Points 1 (b) and Point No. 5 have been considered for the calculation of Point No. 73 Complaints received in Escalated Status from IRDA are not included in this report
Total Complaints registered upto the quarter during the
financial year
* Opening balance should tally with the closing balance of the previous financial year
2,515,652
548,639
13.77
18.37
PERIODIC DISCLOSURERSFORM NL-41 GRIEVANCE DISPOSAL
31-March-2016
2,354,805
447,086
Sl. No. ParticularsOpening Balance* As on beginning of the quarter
Complaints Resolved / Settled during the quarter
Complaints Pending at the
end of the quarter
GRIEVANCE DISPOSAL FOR THE QUARTER ENDED 31ST MARCH, 2016

Insurer: Tata AIG General Insurance Co. Ltd. Date:
Additions during the year
Full Accepted
Partial Accepted Rejected
1 Complaints made by customersa) Proposal Related 1 15 11 3 2 - 15 b) Claim 8 1,008 451 285 276 4 1,008 c) Policy Related 18 1,096 922 84 98 10 1,096 d) Premium 1 45 30 12 4 - 45 e) Refund 2 144 117 18 11 - 144 f) Coverage 9 761 333 236 200 1 761 g) Cover Note Related - 1 - 1 - - 1 h) Product - 15 10 2 3 - 15 i) Others 8 378 274 45 61 6 378
Total Number of complaints: 47 3,463 2,148 686 655 21 3,463
2 Total No. of policies during previous year:
3 Total No. of claims during previous year:
4 Total No. of policies during current year:
5 Total No. of claims during current year:
6Total No. of Policy complaints (current year) per 10,000 policies (current year) ;
7Total No. of Claim Complaints (current year) per 10,000 claims registered (current year)
8 Duration wise Pending StatusComplaints made by
CustomersComplaints made by
Intermediaries Total( a ) Upto 7 days 20 20 ( b ) 7 - 15 Days 1 1 ( c ) 15 - 30 Days( d ) 30 - 90 Days( e ) 90 days & Beyond
Total No. of Complaints 21 - 21
Note:1 Points 1 (a) to 1 (i) and Point No.2 have been considered for the calculation of Point No. 62 Points 1 (b) and Point No. 5 have been considered for the calculation of Point No. 73 Complaints received in Escalated Status from IRDA are not included in this report
PERIODIC DISCLOSURERSFORM NL-41 GRIEVANCE DISPOSAL
31-March-2016
Sl. No. ParticularsOpening Balance* As on
beginning of the year
Complaints Resolved / Settled during the year Complaints
Pending at the end of the year
GRIEVANCE DISPOSAL FOR THE YEAR ENDED 31ST MARCH, 2016
18.37
* Opening balance should tally with the closing balance of the previous financial year
Total Complaints registered upto the
year during the financial year
2,354,805
447,086
2,515,652
548,639
13.77