forests of ohio, 2016for the 2016 inventory, estimates for current variables such as area, volume,...
TRANSCRIPT

RESOURCE UPDATE FS-XXX
Forest Service | September 20171
This resource update provides an overview of the forest resources in Ohio based on inventories conducted by the U.S. Forest Service, Forest Inventory and Analysis (FIA) program of the Northern Research Station. Estimates are based on field data collected using the FIA annualized sample design and are updated yearly.1 Information about the national and regional FIA program is available online at https://fia.fs.fed.us. Since 2001, FIA has implemented an annual inventory in Ohio. For the 2016 inventory, estimates for current variables such as area, volume, and biomass are based on 4,283 (1,660 forested) plot samples collected from 2011 to 2016. Change variables such as net growth, removals, and mortality are based on 4,131 (1,524 forested) samples collected from 2006 to 2011 and remeasured from 2011 to 2016. Estimates from previous inventories are shown for comparison. See Bechtold and Patterson (2005), Gormanson et al. (2017), and O’Connell et al. (2017) for definitions and technical details. A complete set of inventory tables is available at https://doi.org/10.2737/FS-RU-139.
Ohio’s forest land area totals 8.0 million acres and occupies 30 percent of the State’s total area (Table 1). Since 2011, there has been a 1.1 percent decrease in forest land. Ninety-six percent of Ohio’s forest land, or 7.6 million acres, is classified as timberland. Four percent (289,000 acres) is publically owned reserved forest land. Less than 1 percent (62,000 acres) is other forest land, where minimum productivity standards are not met. Net volumes continue to increase, though at a slower pace than previously observed. Annual net growth on timberland also decreased, though it still outpaces annual removals by a factor of 1.3:1. Average annual mortality has increased by 30 percent from 2011.
Overview
United States Department of Agriculture
RESOURCE UPDATE FS-139
Forests of Ohio, 2016
Table 1.—Ohio forest statistics, 2016 and 2011. Volume estimates are for trees 5 inches and larger in diameter. Numbers of trees and biomass estimates are for trees 1 inch and larger in diameter. Sampling errors in tables and error bars in figures represent 68 percent confidence intervals.
2016 Estimate
Sampling error
(percent)
Percent change
from 20112011
Estimate
Sampling error
(percent)Forest landArea (thousand acres) 7,996.5 1.0 -1.1 8,088.8 1.1Number of all live trees >1 inch diameter (million trees) 3,960.8 2.1 -4.1 4,128.9 2.1Aboveground biomass of all live trees >1 inch (thousand oven-dry tons) 482,838.1 1.6 1.2 477,066.3 1.6Net volume of all live trees (million ft3) 16,619.7 1.7 1.4 16,384.6 1.7Annual net growth of all live trees (thousand ft3/yr) 373,422.4 4.7 -22.6 482,493.0 3.9Annual mortality of all live trees (thousand ft3/yr) 236,384.8 5.1 30.1 181,715.4 5.5Annual harvest removals of all live trees (thousand ft3/yr) 227,656.9 10.8 9.2 208,566.9 9.9Annual other removals of all live trees (thousand ft3/yr) 20,398.8 27.8 109.8 9,722.1 34.7TimberlandArea (thousand acres) 7,645.5 1.1 -1.7 7,779.5 1.1Number of all live trees >1 inch diameter (million trees) 3,801.6 2.2 -5.0 4,000.9 2.2Aboveground biomass of all live trees >1 inch (thousand oven-dry tons) 460,252.2 1.7 0.6 457,671.1 1.7Net volume of all live trees (million ft3) 15,838.4 1.8 0.7 15,721.2 1.8Net volume of growing-stock trees (million ft3) 13,600.1 2.0 0.0 13,595.7 2.0Annual net growth of growing-stock trees (thousand ft3/yr) 292,036.0 4.3 -21.4 371,698.7 3.4Annual mortality of growing-stock trees (thousand ft3/yr) 152,695.7 5.8 30.3 117,222.9 6.1Annual harvest removals of growing-stock trees (thousand ft3/yr) 184,123.8 11.2 6.9 172,294.8 10.1Annual other removals of growing-stock trees (thousand ft3/yr) 34,124.7 24.1 96.2 17,388.6 34.5
1The 5-year cycle (1/5th of plots measured annually) was changed to a 7-year cycle in 2014, wherein 1/7th (14.3 percent) of the plots are measured annually.

Figure 1.—Area of forest land and timberland by year, Ohio, 1952 to 2016.
Forest Area
2
RESOURCE UPDATE FS-139
Forest land area in Ohio leveled out in the 1990s after decades of substantial growth. From 1991 to 2013, forest land acreage increased steadily from 7.8 to 8.2 million acres (Fig. 1). Since 2013, however, forest land has decreased by 166,000 acres. Land use change estimations show that from 2011 to 2016, Ohio saw a net gain of 55,000 acres of forest land from agricultural land uses. Conversely, a net loss of over 91,000 acres of forest land to developed land uses over the same time period indicates a continued pressure on forest land from development. Given the past observations, it is likely that the area of forest land in Ohio has peaked and further loss is possible if future economic conditions favor development. Private ownership makes up the majority (6.8 million acres or 85 percent) of forest land in Ohio. Nearly 83 percent of private forest land (5.6 million acres) is in family ownerships. Corporate holdings account for 12 percent of total forest land (974,000 acres), distributed throughout the southeast (Fig. 2). Other private entities (conservation organizations, clubs, associations) own the remaining 204,000 private acres. Public ownership is 15 percent (1.2 million acres) of forest land, primarily state (528,000 acres), local (301,000 acres), and national forest (287,000 acres).Large diameter stands have been increasing in area for decades and the 2016 estimates of timberland area by stand-size class2 show a primarily mature forest (Fig. 3). Large diameter stands now make up 68 percent of timberland with medium and small diameter stands accounting for 21 percent and 11 percent, respectively. The percentage of area by forest-type group in small diameter stands ranges from 6 percent in the white/red/jack pine group to 17 percent in the oak/pine and elm/ash/cottonwood groups (Fig. 4). The largest forest-type group, oak/hickory, occupies 63 percent of all Ohio forest land and has 10 percent of its area in small diameter stands.
Figure 3.—Area of timberland by stand-size class and inventory year, Ohio, 1968 to 2016.
Figure 4.—Area of forest land by stand-size class for the top six forest-type groups ranked by total acres, Ohio, 2016.
Figure 2.—Distribution of forest land by ownership class, Ohio, 2014.
2 Small diameter stands (seedling/sapling): dominated by trees less than 5.0 inches diameter at breast height (d.b.h.); Medium (poletimber): 5.0 to 8.9 inches d.b.h. for softwoods and 5.0 to 10.9 inches d.b.h. for hardwoods; Large (sawtimber):≥ 9.0 inches for softwoods and ≥ 11.0 d.b.h. for hardwoods.
Volume, Biomass, and Trends
3
RESOURCE UPDATE FS-139
The net volume of trees on Ohio’s forest land has continued to show gains from 5 years previous. Total net volume increased 1.4 percent over the 2011 estimate to a total of 16.6 billion ft3 in 2016 (Table 2). While it is unclear whether a downward trend has begun, there is a decrease from the 2015 estimates for the rate of volume gain (3.0 percent) and total net volume (16.7 billion ft3). Most of the top 10 species by volume exhibited increases, ranging from 0.2 percent (American beech) to 11.3 percent (shagbark hickory). The most voluminous species, red maple, increased in net volume by 4.9 percent over the 2011 estimate. White oak and white ash both show increasing rates of volume loss, decreasing 7.3 and 19.6 percent, respectively, from 2011. Sawtimber volume on timberland totaled 51.1 billion board feet, a 2.1 percent increase since 2011. Changes in volume for individual species from 2011 ranged from a loss of 22.3 percent for white ash to an increase of 16.7 percent for shagbark hickory. Yellow-poplar remains the leading species by sawtimber volume, gaining 5.1 percent over the 2011 estimate.Aboveground biomass of live trees on forest land increased 1.2 percent since 2011 to 483 million dry tons. Like net volume, this is a slight decrease from the 2015 estimate of 487 million dry tons.Average annual net growth on timberland has also decreased. On timberland, net growth of growing-stock averaged 292 million ft3 per year in 2016 and annual removals of growing-stock were 218 million ft3 (Table 1), for a growth to removals ratio (G:R) of 1.3:1.
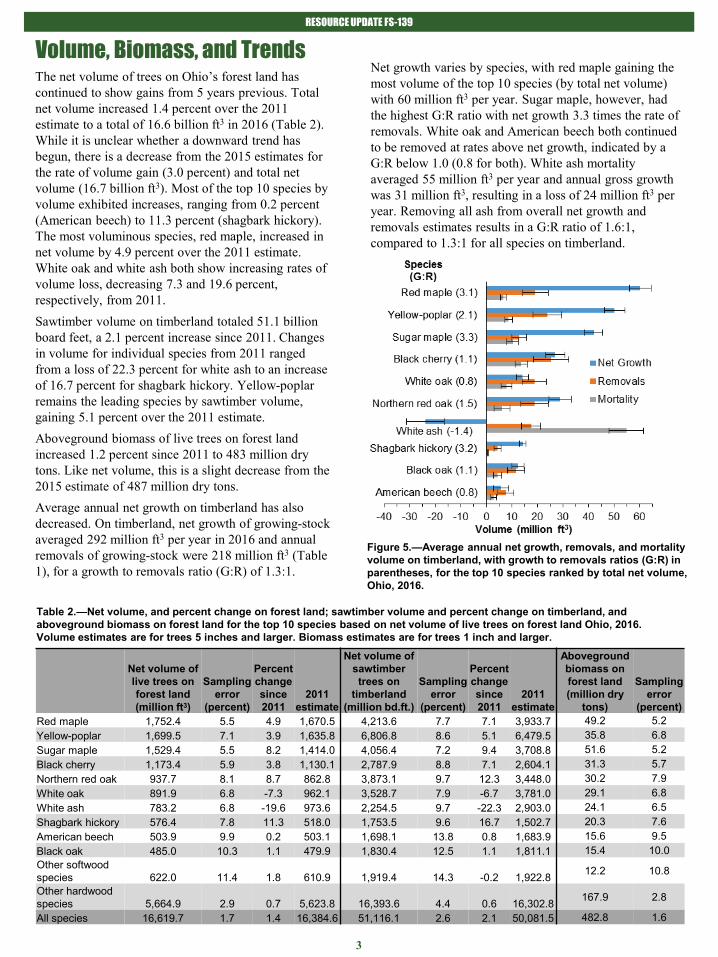
Net growth varies by species, with red maple gaining the most volume of the top 10 species (by total net volume) with 60 million ft3 per year. Sugar maple, however, had the highest G:R ratio with net growth 3.3 times the rate of removals. White oak and American beech both continued to be removed at rates above net growth, indicated by a G:R below 1.0 (0.8 for both). White ash mortality averaged 55 million ft3 per year and annual gross growth was 31 million ft3, resulting in a loss of 24 million ft3 per year. Removing all ash from overall net growth and removals estimates results in a G:R ratio of 1.6:1, compared to 1.3:1 for all species on timberland.
Table 2.—Net volume, and percent change on forest land; sawtimber volume and percent change on timberland, and aboveground biomass on forest land for the top 10 species based on net volume of live trees on forest land Ohio, 2016. Volume estimates are for trees 5 inches and larger. Biomass estimates are for trees 1 inch and larger.
Figure 5.—Average annual net growth, removals, and mortality volume on timberland, with growth to removals ratios (G:R) in parentheses, for the top 10 species ranked by total net volume, Ohio, 2016.
Net volume of live trees on forest land (million ft3)
Sampling error
(percent)
Percent change since 2011
2011 estimate
Net volume of sawtimbertrees on
timberland (million bd.ft.)
Sampling error
(percent)
Percent change since 2011
2011 estimate
Aboveground biomass on forest land (million dry
tons)
Sampling error
(percent)Red maple 1,752.4 5.5 4.9 1,670.5 4,213.6 7.7 7.1 3,933.7 49.2 5.2Yellow-poplar 1,699.5 7.1 3.9 1,635.8 6,806.8 8.6 5.1 6,479.5 35.8 6.8Sugar maple 1,529.4 5.5 8.2 1,414.0 4,056.4 7.2 9.4 3,708.8 51.6 5.2Black cherry 1,173.4 5.9 3.8 1,130.1 2,787.9 8.8 7.1 2,604.1 31.3 5.7Northern red oak 937.7 8.1 8.7 862.8 3,873.1 9.7 12.3 3,448.0 30.2 7.9White oak 891.9 6.8 -7.3 962.1 3,528.7 7.9 -6.7 3,781.0 29.1 6.8White ash 783.2 6.8 -19.6 973.6 2,254.5 9.7 -22.3 2,903.0 24.1 6.5Shagbark hickory 576.4 7.8 11.3 518.0 1,753.5 9.6 16.7 1,502.7 20.3 7.6American beech 503.9 9.9 0.2 503.1 1,698.1 13.8 0.8 1,683.9 15.6 9.5Black oak 485.0 10.3 1.1 479.9 1,830.4 12.5 1.1 1,811.1 15.4 10.0Other softwood species 622.0 11.4 1.8 610.9 1,919.4 14.3 -0.2 1,922.8 12.2 10.8
Other hardwood species 5,664.9 2.9 0.7 5,623.8 16,393.6 4.4 0.6 16,302.8 167.9 2.8
All species 16,619.7 1.7 1.4 16,384.6 51,116.1 2.6 2.1 50,081.5 482.8 1.6

The Changing Ash Resource of OhioRESOURCE UPDATE FS-139
The published report is available online at https://doi.org/10.2737/FS-RU-139
How to Cite This Publication
Albright, Thomas A. 2017. Forests of Ohio, 2016 Resource Update FS-139. Newtown Square, PA: U.S. Department of Agriculture, Forest Service, Northern Research Station. 4 p.
Contact Information
Thomas A. Albright, ForesterUSDA Forest Service, Northern Research Station Ph: [email protected] FIA: https://nrs.fs.fed.us/fia/National FIA: https://fia.fs.fed.us
USDA is an equal opportunity provider and employer
4
ReferencesBechtold, W.A.; Patterson, P.L., eds. 2005. The enhanced Forest Inventory and Analysis Program: national sampling design and estimation procedures. Gen. Tech. Rep. SRS-80. Asheville, NC: U.S. Department of Agriculture, Forest Service, Southern Research Station. 85 p. https://doi.org/10.2737/SRS-GTR-80.
Gormanson, D.D.; Pugh, S.A.; Barnett, C.J. [et al.] 2017. Statistics and quality assurance for the Northern Research Station Forest Inventory and Analysis Program, 2016. Gen. Tech. Rep. NRS-166. Newtown Square, PA: U.S. Department of Agriculture, Forest Service, Northern Research Station. 23 p. https://doi.org/10.2737/NRS-GTR-166.
Herms, D.A.; McCullough, D.G. 2014. Emerald ash borer invasion on North America: history, biology, ecology, impacts and management. Annual Review of Entomology. 59(1): 13-30. https://doi.org/10.1146/annurev-ento-011613-162051.
O’Connell, B.M.; Conkling, B.L.; Wilson, A.M. [et al.]. 2017. The Forest Inventory and Analysis Database: Database description and user guide version 7.0 for Phase 2. Washington, DC: U.S. Dept. of Agriculture, Forest Service. 830 p. https://www.fia.fs.fed.us/library/database‐documentation/. (accessed Sept. 8, 2017).
Four species of ash have been identified in FIA inventories of Ohio. White ash, ranked 7th overall in the state by volume, makes up the majority of the species group with 77 percent of ash volume. Green ash comprises 20 percent, with blue and black ash accounting for the remaining 2 and 1 percent, respectively. Ash is a major component of the three most dominant forest-type groups in Ohio. In 2004, ash made up 9 percent of the combined biomass of the maple/beech/birch, elm/ash/cottonwood, and oak/hickory forest-type groups. That proportion has since dropped to 7 percent.
Emerald ash borer (EAB; Agrilus planipennis) is a wood-boring beetle native to Asia. First discovered in the United States in Michigan in 2002, it was found in Ohio in 2003. It has since proven to be one of the most destructive nonnative forest insects in the U.S. Though symptoms of an infestation may not be immediately evident, EAB generally causes the death of its host within 4 years of the onset of apparent symptoms (Herms and McCullough 2014). Attacks begin with the laying of eggs on bark and in crevices. Larvae hatch and bore their way through the outer bark to get to the cambium and phloem where they feed, creating galleries that effectively girdle the tree, starving it of water and nutrients.
Since the discovery of EAB in Ohio, substantial changes in the ash resource have been observed (Fig. 6). Between 2004 and 2016, the number of ash trees 5.0 inches and larger dropped 19 percent to 69.3 million. The combined net volume of ash decreased 24 percent from 1.3 billion to 1.0 billion ft3 over the same time period. In 2007, average annual mortality of ash was estimated at 19.7 million ft3 per year. That estimate nearly quadrupled to 75.7 million ft3 (7.5 percent of total net volume) per year in 2016. Annual mortality began to exceed gross growth in 2014, resulting in negative net growth reaching an estimated -34.3 million ft3
per year in 2016.
While the observed trends make the fate of ash in Ohio seem all but certain, the story is not over. Since 2004, the number of ash seedlings has increased 46 percent. This, combined with the high volume of ash remaining, means the future of ash is not yet written.
Figure 6.—Ash average annual mortality, net growth, and removals along with net volume of ash (right axis), Ohio 2004 to 2016.