forescene_brussels_biodiversity_08sept08
DESCRIPTION
NSFD: Soil Framework Directive None Weak protection Strong protection NSFD: Soil Framework Directive None Weak protection Strong protection NSFD: Soil Framework Directive None Weak protection Strong protection NSFD: Soil Framework Directive None Weak protection Strong protection NSFD: Soil Framework Directive None Weak protection Strong protection NSFD: Soil Framework Directive None Weak protection Strong protection NSFD: Soil Framework Directive None Weak protection Strong protectionTRANSCRIPT
1
The Biodiversity, Soils andLandscape sub-model
Alison Rollett & Roy Haines-YoungCentre for Environmental Management
University of Nottingham
2
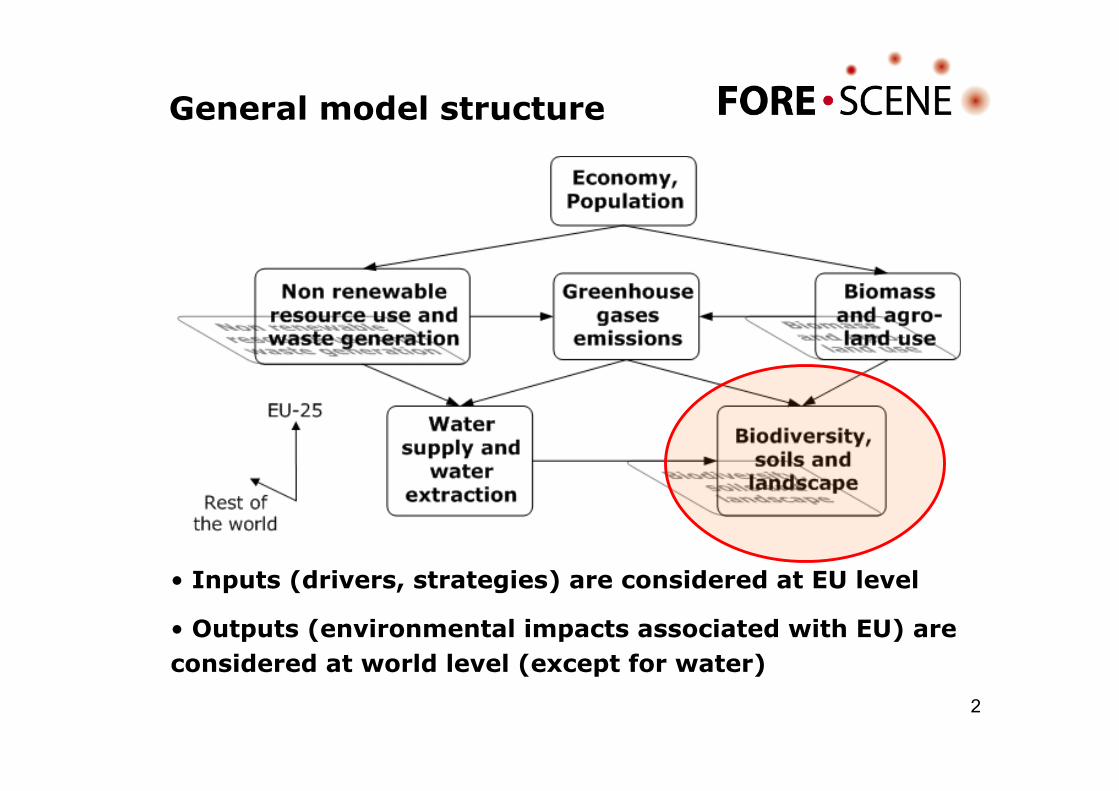
General model structure
• Inputs (drivers, strategies) are considered at EU level
• Outputs (environmental impacts associated with EU) areconsidered at world level (except for water)
3
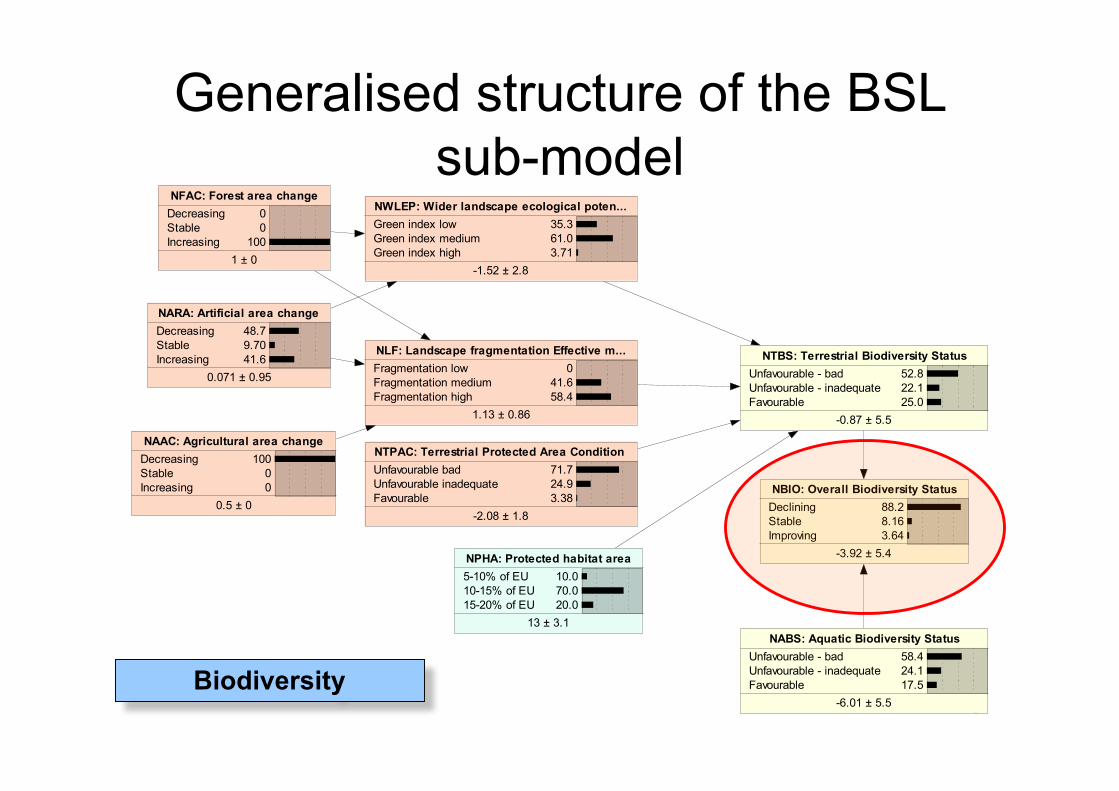
NFAC: Forest area change
Decreasing
Stable
Increasing
0
0
100
1 ± 0
NTPAC: Terrestrial Protected Area Condition
Unfavourable bad
Unfavourable inadequate
Favourable
71.7
24.9
3.38
-2.08 ± 1.8
NLF: Landscape fragmentation Effective m...
Fragmentation low
Fragmentation medium
Fragmentation high
0
41.6
58.4
1.13 ± 0.86
NPHA: Protected habitat area
5-10% of EU
10-15% of EU
15-20% of EU
10.0
70.0
20.0
13 ± 3.1
NTBS: Terrestrial Biodiversity Status
Unfavourable - bad
Unfavourable - inadequate
Favourable
52.8
22.1
25.0
-0.87 ± 5.5
NBIO: Overall Biodiversity Status
Declining
Stable
Improving
88.2
8.16
3.64
-3.92 ± 5.4
NABS: Aquatic Biodiversity Status
Unfavourable - bad
Unfavourable - inadequate
Favourable
58.4
24.1
17.5
-6.01 ± 5.5
NARA: Artificial area change
Decreasing
Stable
Increasing
48.7
9.70
41.6
0.071 ± 0.95
NAAC: Agricultural area change
Decreasing
Stable
Increasing
100
0
0
0.5 ± 0
NWLEP: Wider landscape ecological poten...
Green index low
Green index medium
Green index high
35.3
61.0
3.71
-1.52 ± 2.8
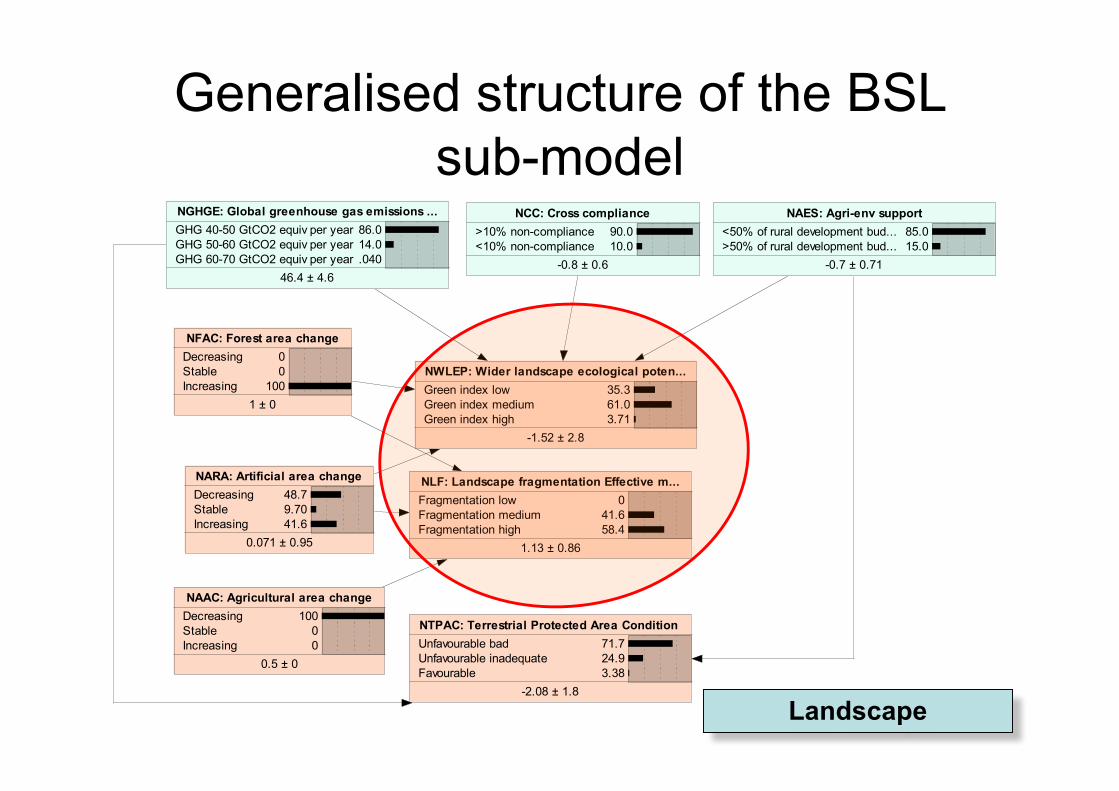
Generalised structure of the BSLsub-model
Biodiversity
4
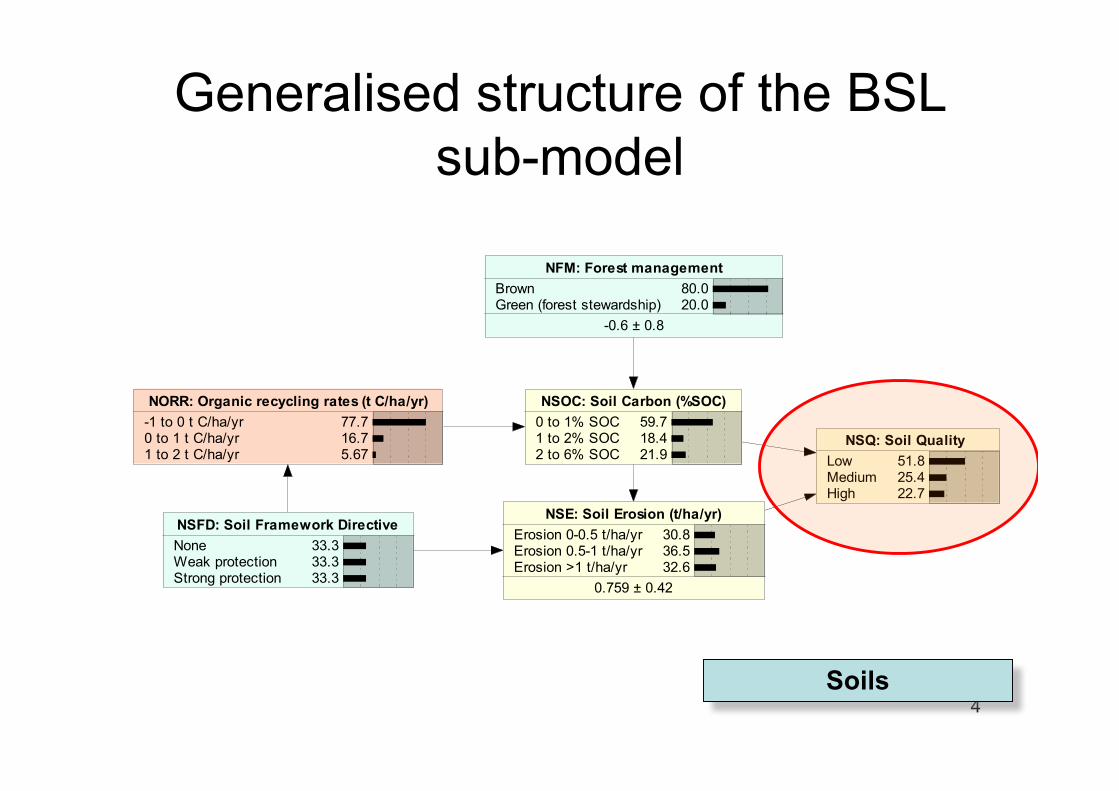
Generalised structure of the BSLsub-model
Soils
NSE: Soil Erosion (t/ha/yr)
Erosion 0-0.5 t/ha/yrErosion 0.5-1 t/ha/yrErosion >1 t/ha/yr
30.836.532.6
0.759 ± 0.42
NSFD: Soil Framework Directive
NoneWeak protectionStrong protection
33.333.333.3
NSQ: Soil Quality
LowMediumHigh
51.825.422.7
NSOC: Soil Carbon (%SOC)
0 to 1% SOC1 to 2% SOC2 to 6% SOC
59.718.421.9
NFM: Forest management
BrownGreen (forest stewardship)
80.020.0
-0.6 ± 0.8
NORR: Organic recycling rates (t C/ha/yr)
-1 to 0 t C/ha/yr0 to 1 t C/ha/yr1 to 2 t C/ha/yr
77.716.75.67
5
NAAC: Agricultural area change
Decreasing
Stable
Increasing
100
0
0
0.5 ± 0
NFAC: Forest area change
Decreasing
Stable
Increasing
0
0
100
1 ± 0
NLF: Landscape fragmentation Effective m...
Fragmentation low
Fragmentation medium
Fragmentation high
0
41.6
58.4
1.13 ± 0.86
NARA: Artificial area change
Decreasing
Stable
Increasing
48.7
9.70
41.6
0.071 ± 0.95
NTPAC: Terrestrial Protected Area Condition
Unfavourable bad
Unfavourable inadequate
Favourable
71.7
24.9
3.38
-2.08 ± 1.8
NGHGE: Global greenhouse gas emissions ...
GHG 40-50 GtCO2 equiv per year
GHG 50-60 GtCO2 equiv per year
GHG 60-70 GtCO2 equiv per year
86.0
14.0
.040
46.4 ± 4.6
NAES: Agri-env support
<50% of rural development bud...
>50% of rural development bud...
85.0
15.0
-0.7 ± 0.71
NCC: Cross compliance
>10% non-compliance
<10% non-compliance
90.0
10.0
-0.8 ± 0.6
NWLEP: Wider landscape ecological poten...
Green index low
Green index medium
Green index high
35.3
61.0
3.71
-1.52 ± 2.8
Generalised structure of the BSLsub-model
Landscape

6
The ‘green background’
7
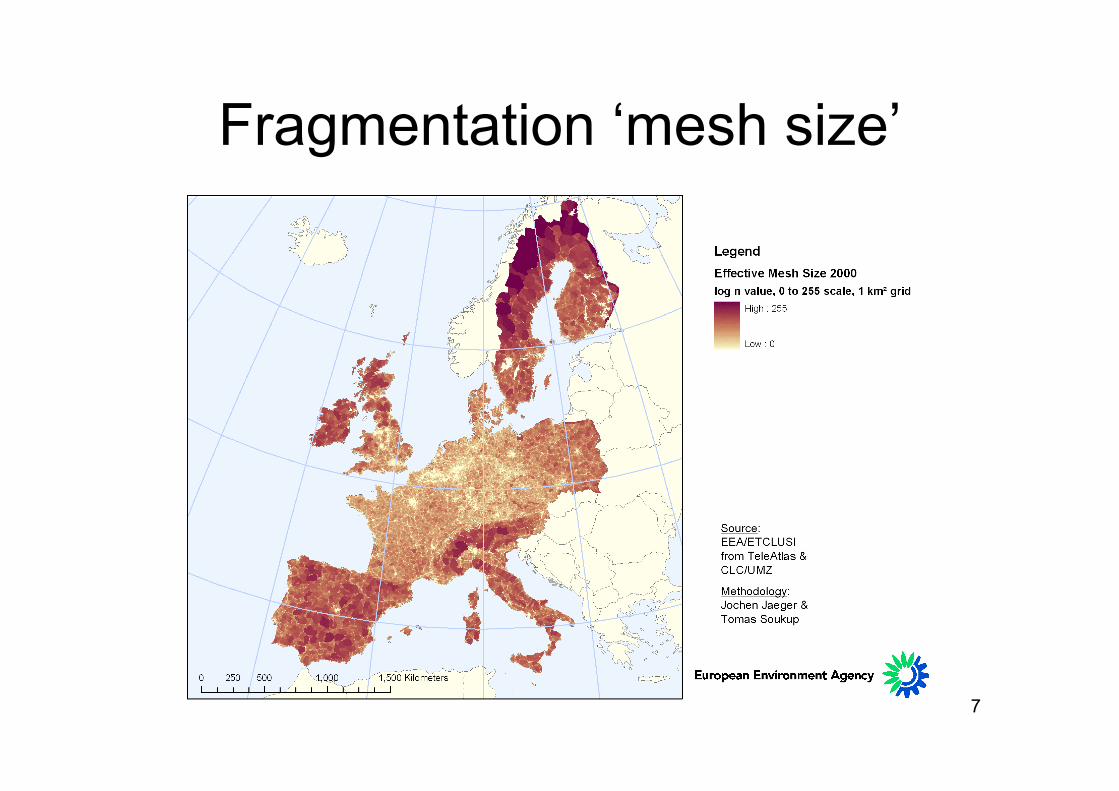
Fragmentation ‘mesh size’
8
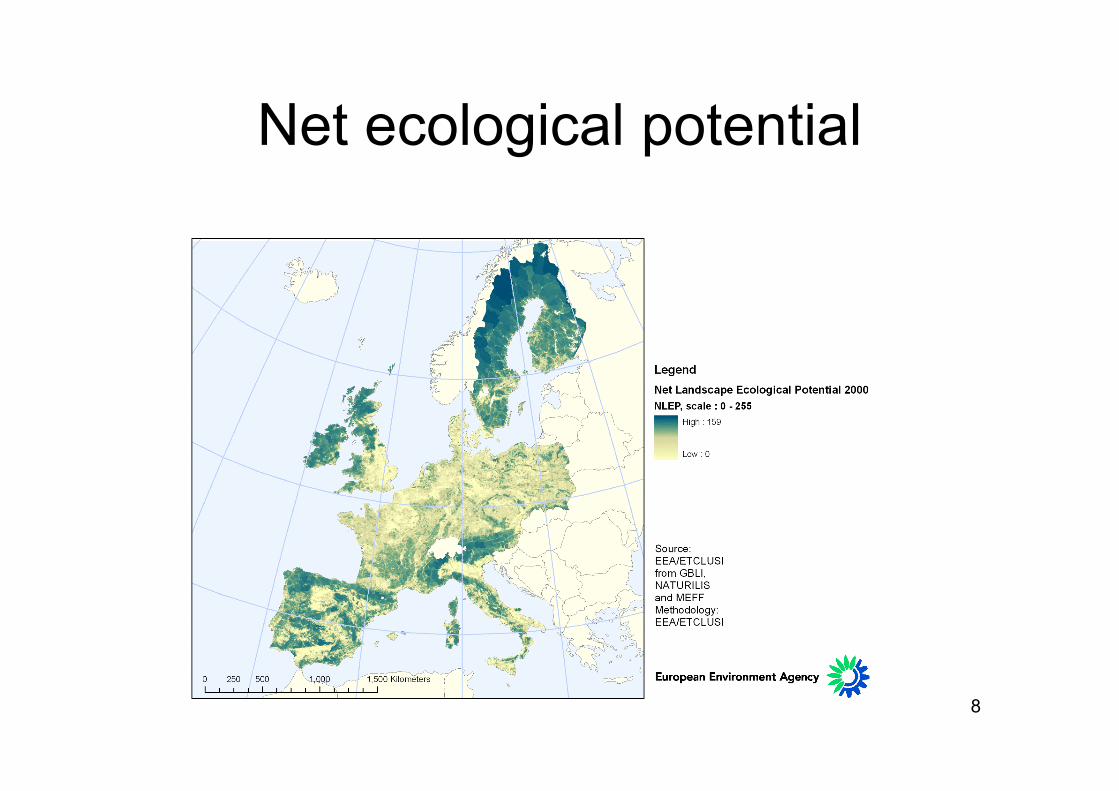
Net ecological potential
9
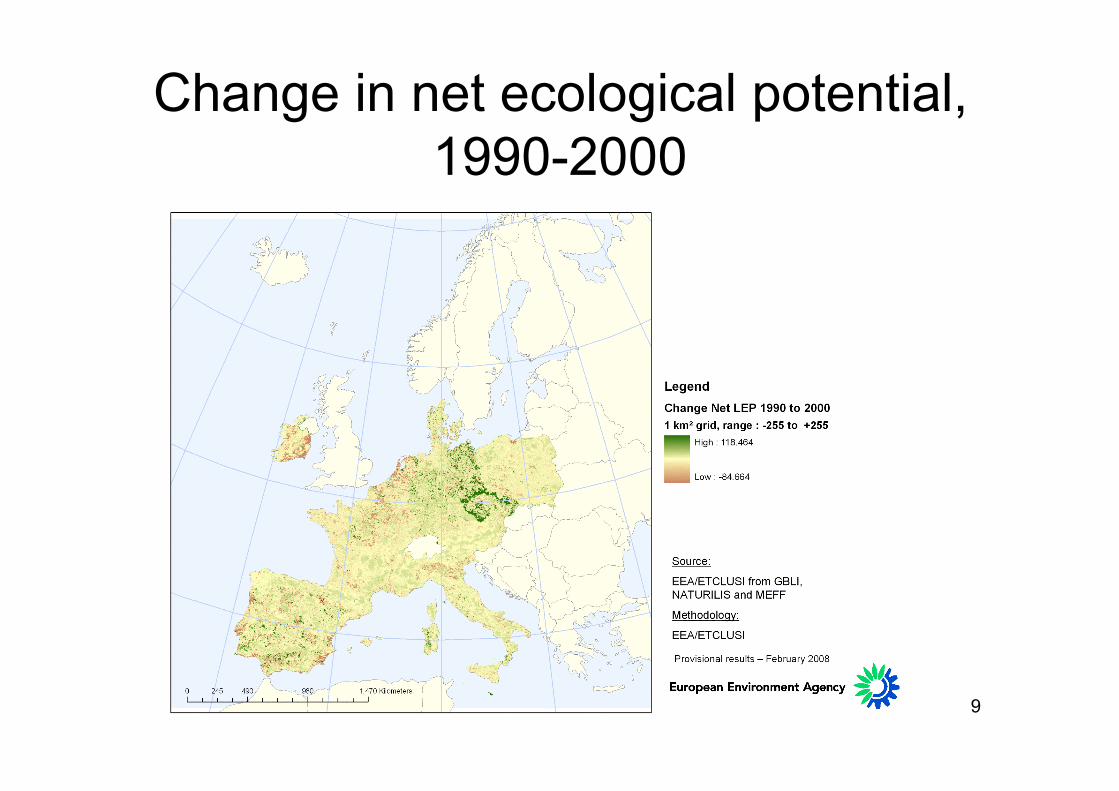
Change in net ecological potential,1990-2000

10
Issues in developing the BSL sub-module
• Few strong empirical relationships exist:– Node states are represented by some ‘condition’
rather than a simple measurable parameter.– Much of the modelling has to be based on ‘expert’
judgement.– ‘Outcomes’ are generally probabilities of particular
states (e.g. ‘high soil quality’) rather than ‘quantifiableconditions’ (e.g. %SOC).
• There are likely to be strong regional differencesnot easily captured in EU-scale model.
• Changes over time of input parameters difficultto track through to effects, due to time lags.
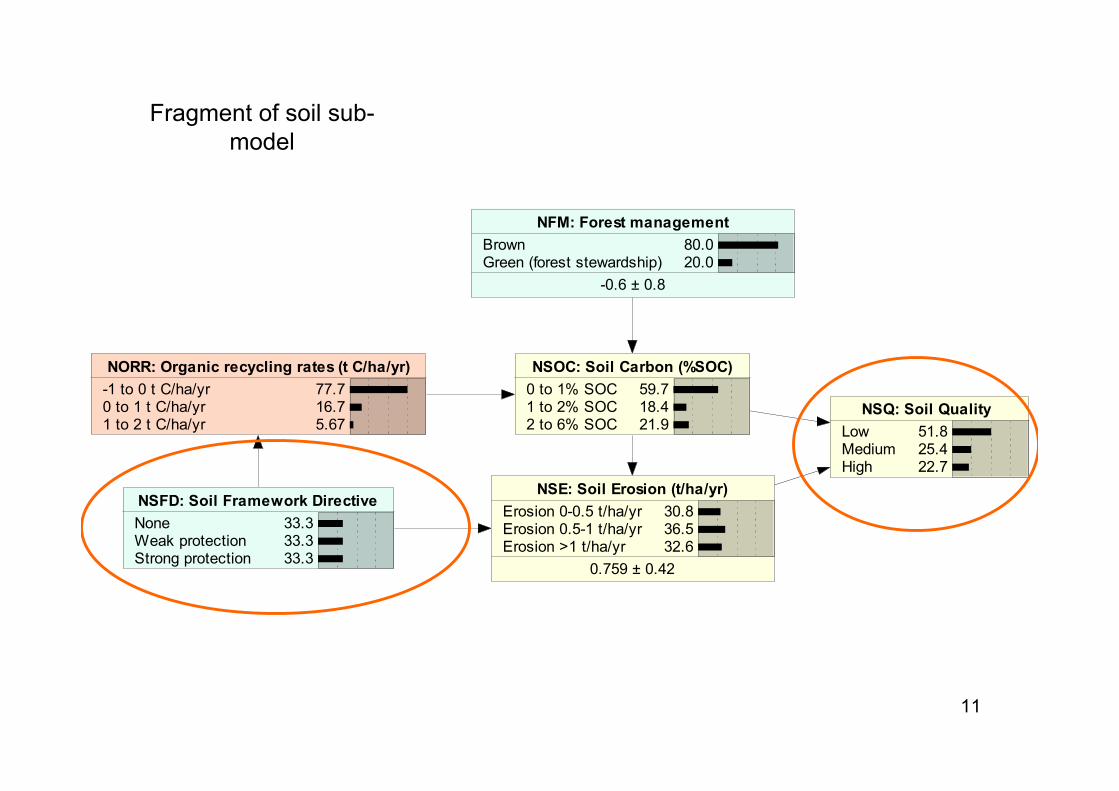
11
NSE: Soil Erosion (t/ha/yr)
Erosion 0-0.5 t/ha/yrErosion 0.5-1 t/ha/yrErosion >1 t/ha/yr
30.836.532.6
0.759 ± 0.42
NSFD: Soil Framework Directive
NoneWeak protectionStrong protection
33.333.333.3
NSQ: Soil Quality
LowMediumHigh
51.825.422.7
NSOC: Soil Carbon (%SOC)
0 to 1% SOC1 to 2% SOC2 to 6% SOC
59.718.421.9
NFM: Forest management
BrownGreen (forest stewardship)
80.020.0
-0.6 ± 0.8
NORR: Organic recycling rates (t C/ha/yr)
-1 to 0 t C/ha/yr0 to 1 t C/ha/yr1 to 2 t C/ha/yr
77.716.75.67
Fragment of soil sub-model

12
Fragment of soil sub-model
NSE: Soil Erosion (t/ha/yr)
Erosion 0-0.5 t/ha/yrErosion 0.5-1 t/ha/yrErosion >1 t/ha/yr
25.833.141.1
0.826 ± 0.43
NSFD: Soil Framework Directive
NoneWeak protectionStrong protection
100 0 0
NSQ: Soil Quality
LowMediumHigh
56.825.917.3
NSOC: Soil Carbon (%SOC)
0 to 1% SOC1 to 2% SOC2 to 6% SOC
68.216.115.8
NFM: Forest management
BrownGreen (forest stewardship)
80.020.0
-0.6 ± 0.8
NORR: Organic recycling rates (t C/ha/yr)
-1 to 0 t C/ha/yr0 to 1 t C/ha/yr1 to 2 t C/ha/yr
93.05.002.00
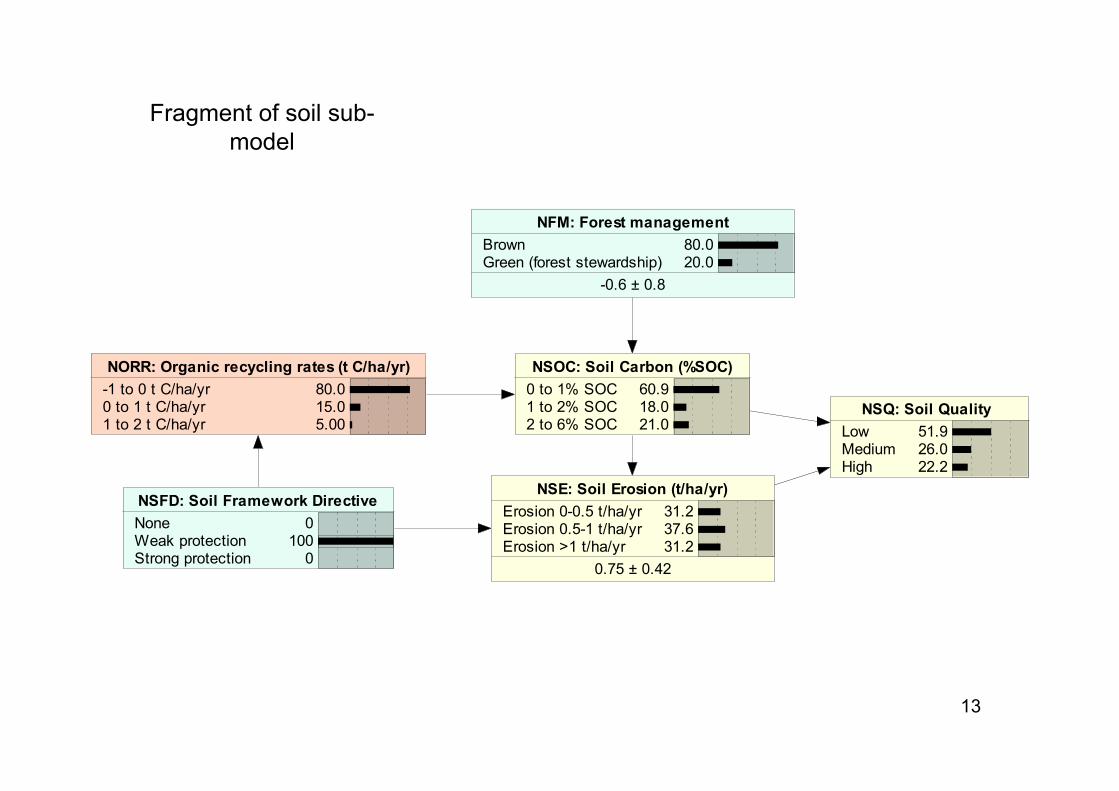
13
Fragment of soil sub-model
NSE: Soil Erosion (t/ha/yr)
Erosion 0-0.5 t/ha/yrErosion 0.5-1 t/ha/yrErosion >1 t/ha/yr
31.237.631.2
0.75 ± 0.42
NSFD: Soil Framework Directive
NoneWeak protectionStrong protection
0 100 0
NSQ: Soil Quality
LowMediumHigh
51.926.022.2
NSOC: Soil Carbon (%SOC)
0 to 1% SOC1 to 2% SOC2 to 6% SOC
60.918.021.0
NFM: Forest management
BrownGreen (forest stewardship)
80.020.0
-0.6 ± 0.8
NORR: Organic recycling rates (t C/ha/yr)
-1 to 0 t C/ha/yr0 to 1 t C/ha/yr1 to 2 t C/ha/yr
80.015.05.00
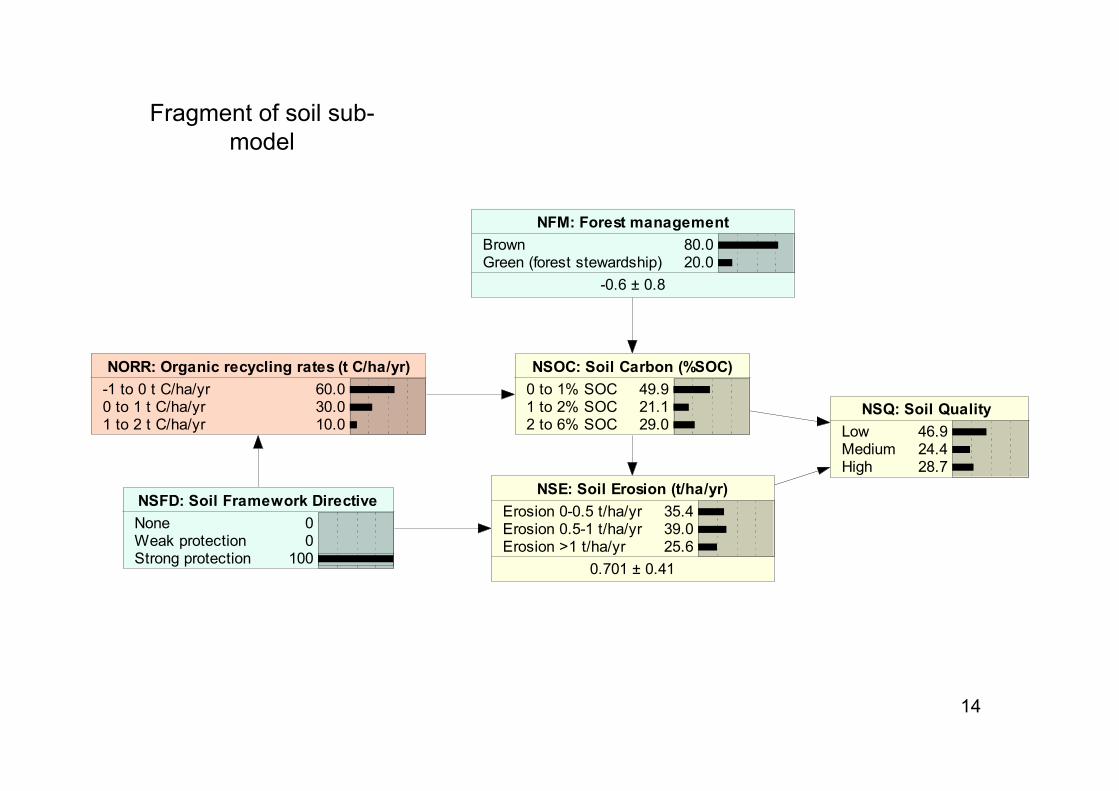
14
Fragment of soil sub-model
NSE: Soil Erosion (t/ha/yr)
Erosion 0-0.5 t/ha/yrErosion 0.5-1 t/ha/yrErosion >1 t/ha/yr
35.439.025.6
0.701 ± 0.41
NSFD: Soil Framework Directive
NoneWeak protectionStrong protection
0 0
100
NSQ: Soil Quality
LowMediumHigh
46.924.428.7
NSOC: Soil Carbon (%SOC)
0 to 1% SOC1 to 2% SOC2 to 6% SOC
49.921.129.0
NFM: Forest management
BrownGreen (forest stewardship)
80.020.0
-0.6 ± 0.8
NORR: Organic recycling rates (t C/ha/yr)
-1 to 0 t C/ha/yr0 to 1 t C/ha/yr1 to 2 t C/ha/yr
60.030.010.0
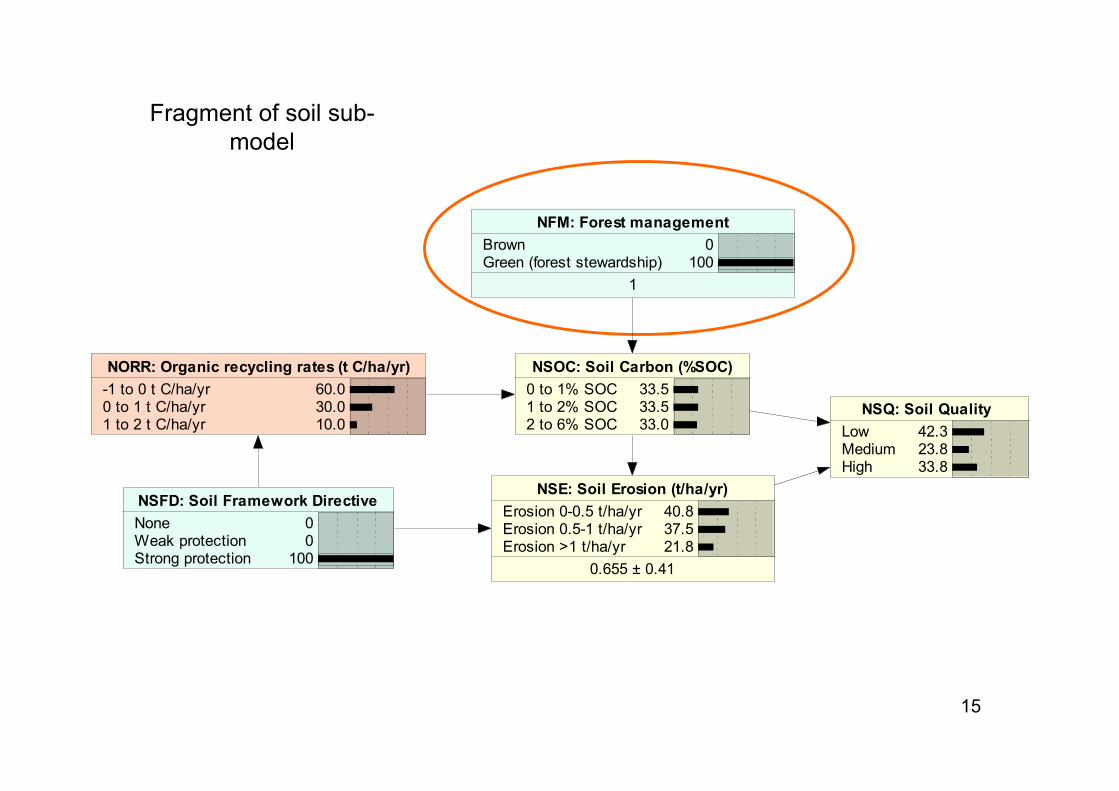
15
Fragment of soil sub-model
NSE: Soil Erosion (t/ha/yr)
Erosion 0-0.5 t/ha/yrErosion 0.5-1 t/ha/yrErosion >1 t/ha/yr
40.837.521.8
0.655 ± 0.41
NSFD: Soil Framework Directive
NoneWeak protectionStrong protection
0 0
100
NSQ: Soil Quality
LowMediumHigh
42.323.833.8
NSOC: Soil Carbon (%SOC)
0 to 1% SOC1 to 2% SOC2 to 6% SOC
33.533.533.0
NFM: Forest management
BrownGreen (forest stewardship)
0 100
1
NORR: Organic recycling rates (t C/ha/yr)
-1 to 0 t C/ha/yr0 to 1 t C/ha/yr1 to 2 t C/ha/yr
60.030.010.0
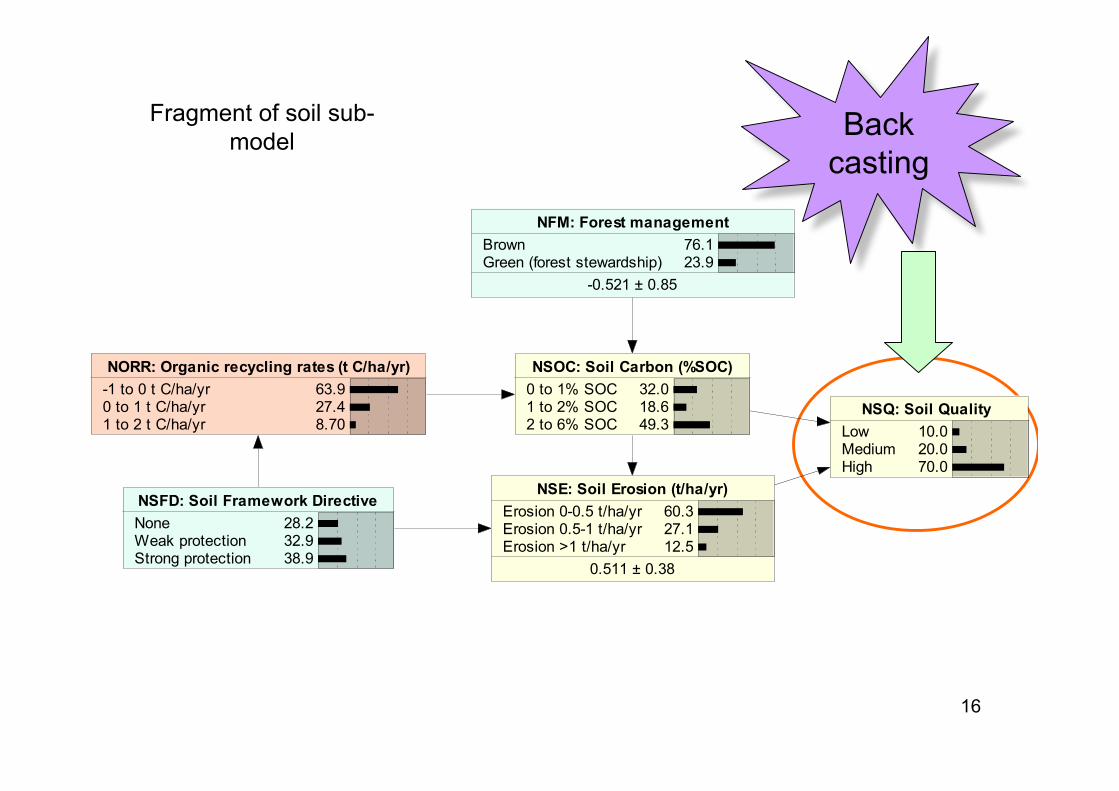
16
Fragment of soil sub-model Back
casting
NSE: Soil Erosion (t/ha/yr)
Erosion 0-0.5 t/ha/yrErosion 0.5-1 t/ha/yrErosion >1 t/ha/yr
60.327.112.5
0.511 ± 0.38
NSFD: Soil Framework Directive
NoneWeak protectionStrong protection
28.232.938.9
NSQ: Soil Quality
LowMediumHigh
10.020.070.0
NSOC: Soil Carbon (%SOC)
0 to 1% SOC1 to 2% SOC2 to 6% SOC
32.018.649.3
NFM: Forest management
BrownGreen (forest stewardship)
76.123.9
-0.521 ± 0.85
NORR: Organic recycling rates (t C/ha/yr)
-1 to 0 t C/ha/yr0 to 1 t C/ha/yr1 to 2 t C/ha/yr
63.927.48.70
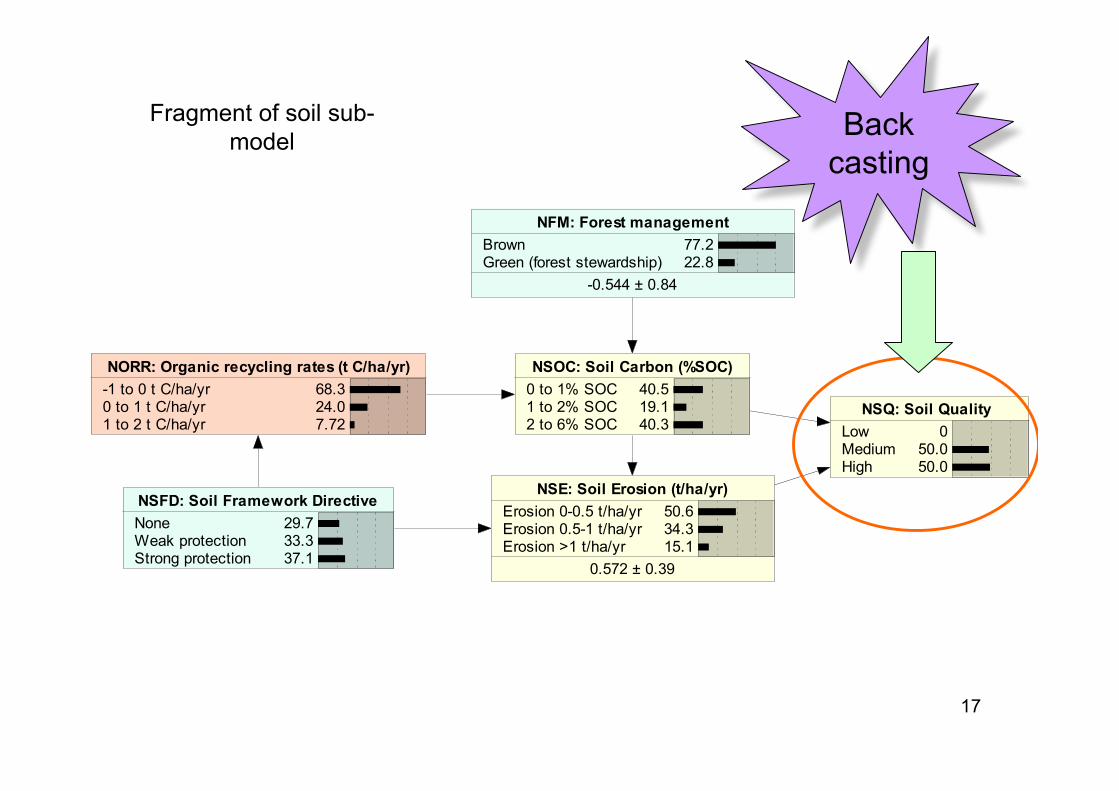
17
NSE: Soil Erosion (t/ha/yr)
Erosion 0-0.5 t/ha/yrErosion 0.5-1 t/ha/yrErosion >1 t/ha/yr
50.634.315.1
0.572 ± 0.39
NSFD: Soil Framework Directive
NoneWeak protectionStrong protection
29.733.337.1
NSQ: Soil Quality
LowMediumHigh
050.050.0
NSOC: Soil Carbon (%SOC)
0 to 1% SOC1 to 2% SOC2 to 6% SOC
40.519.140.3
NFM: Forest management
BrownGreen (forest stewardship)
77.222.8
-0.544 ± 0.84
NORR: Organic recycling rates (t C/ha/yr)
-1 to 0 t C/ha/yr0 to 1 t C/ha/yr1 to 2 t C/ha/yr
68.324.07.72
Fragment of soil sub-model Back
casting
18
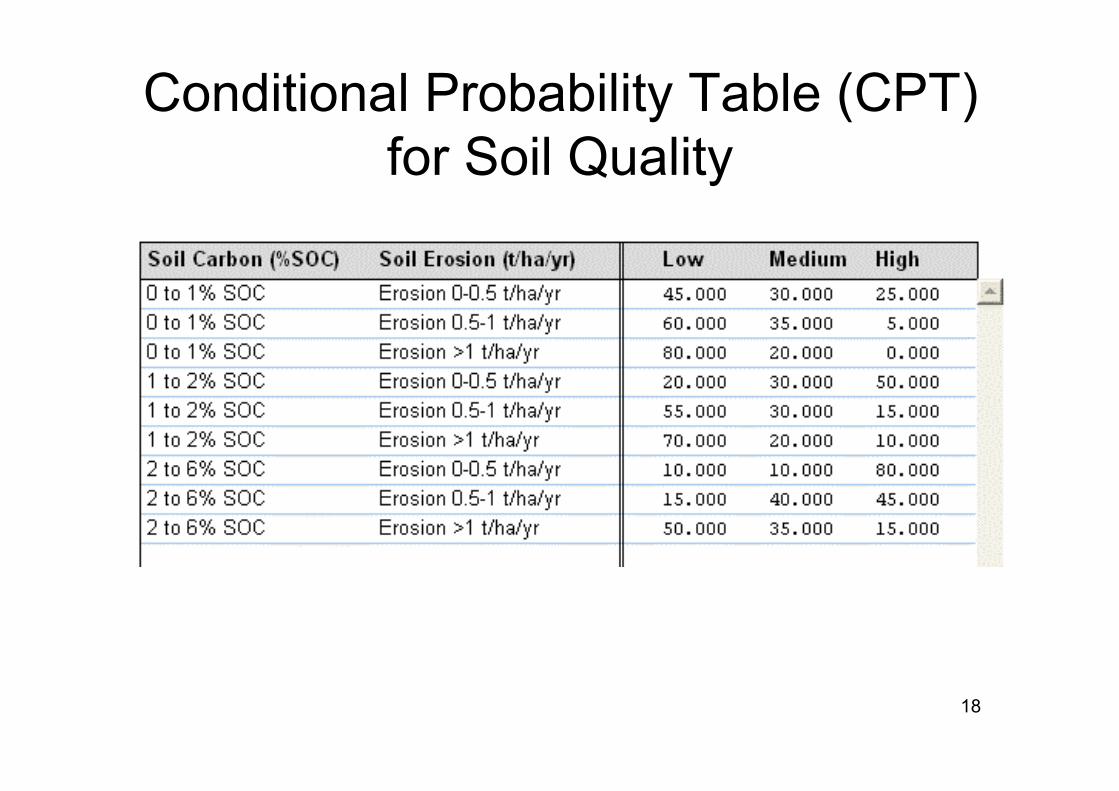
Conditional Probability Table (CPT)for Soil Quality
19
Low SQMedium
SQHigh
SQ
0
10
20
30
40
50
60
70
80
Low SC (0 to 1% SOC)
Erosion 0-0.5 t/ha/yr
Erosion 0.5-1 t/ha/yr
Erosion >1 t/ha/yr
Low SQMedium
SQHigh
SQ
0
10
20
30
40
50
60
70
Medium SC (1% to 2%)
Erosion 0-0.5 t/ha/yr
Erosion 0.5-1 t/ha/yr
Erosion >1 t/ha/yr
Low SQMedium
SQHigh
SQ
0
10
20
30
40
50
60
70
80
High SQ (2%-6% SOC )
Erosion 0-0.5 t/ha/yr
Erosion 0.5-1 t/ha/yr
Erosion >1 t/ha/yr
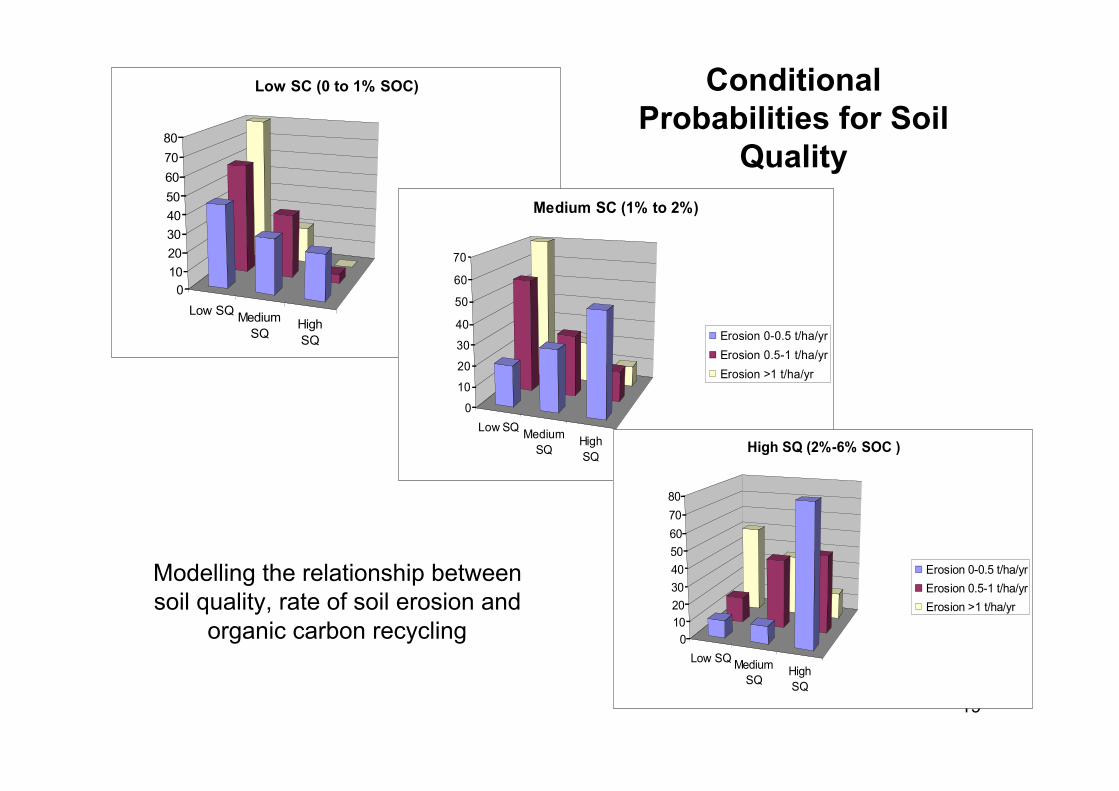
Modelling the relationship betweensoil quality, rate of soil erosion and
organic carbon recycling
ConditionalProbabilities for Soil
Quality
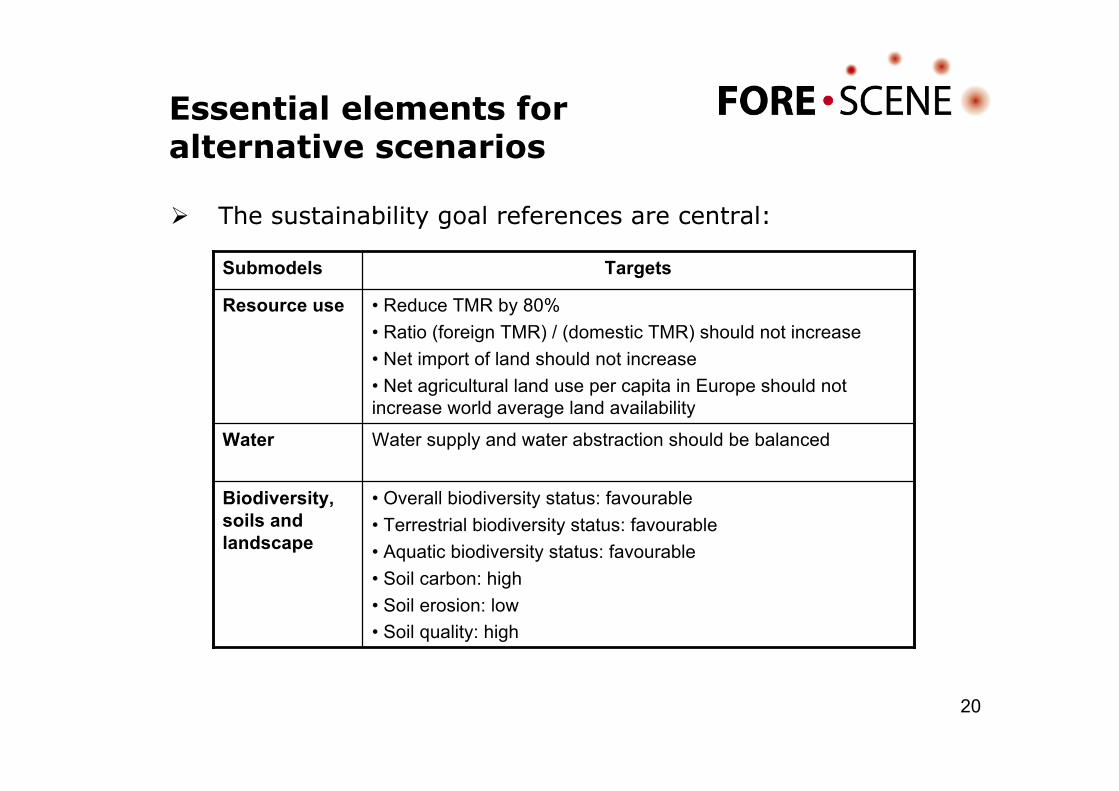
20
The sustainability goal references are central:
Essential elements foralternative scenarios
• Overall biodiversity status: favourable• Terrestrial biodiversity status: favourable• Aquatic biodiversity status: favourable• Soil carbon: high• Soil erosion: low• Soil quality: high
Biodiversity,soils andlandscape
Water supply and water abstraction should be balancedWater
• Reduce TMR by 80%• Ratio (foreign TMR) / (domestic TMR) should not increase• Net import of land should not increase• Net agricultural land use per capita in Europe should notincrease world average land availability
Resource use
TargetsSubmodels
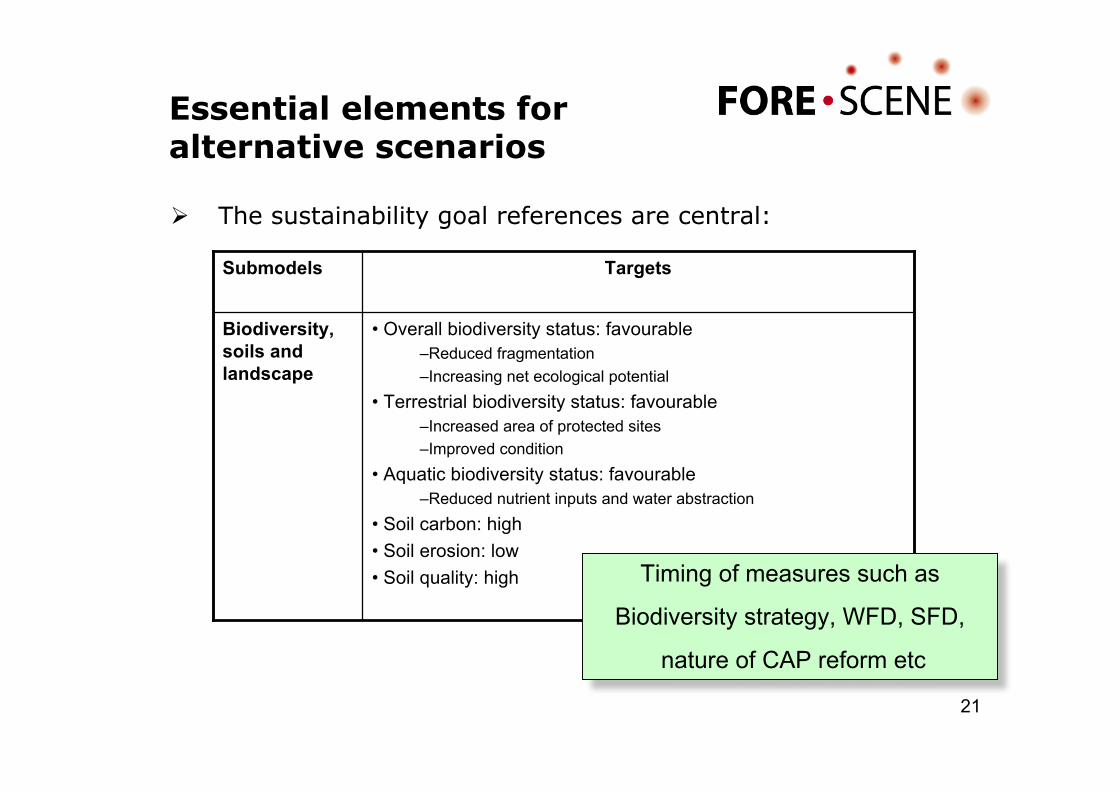
21
The sustainability goal references are central:
Essential elements foralternative scenarios
• Overall biodiversity status: favourable–Reduced fragmentation–Increasing net ecological potential
• Terrestrial biodiversity status: favourable–Increased area of protected sites–Improved condition
• Aquatic biodiversity status: favourable–Reduced nutrient inputs and water abstraction
• Soil carbon: high• Soil erosion: low• Soil quality: high
Biodiversity,soils andlandscape
TargetsSubmodels
Timing of measures such as
Biodiversity strategy, WFD, SFD,
nature of CAP reform etc

22
Modelling change over time
Change of soil quality, erosion and organic
recycling
0
0.05
0.1
0.15
0.2
0.25
0.3
0.35
Now 2025 2050
Prob of High Soil
Quality
Prob of HighCarbon Recycling
Prob of High Soil
Carbon
AssumesSFD is weakby 2025 and
strong by2050

23
Development of BSL sub-model
• Link to drivers from other sub-modules,e.g.:– Demand for biomass– Nutrient surplus– Changes in water use– Land use change (crop area etc.)
• Develop measures for characterisingimpacts on biodiversity, soils andlandscape outside EU.