foreign direct investment into the western balkans: …
TRANSCRIPT
0 / 27
FOREIGN DIRECT INVESTMENT INTO
THE WESTERN BALKANS: THE
STATISTICAL ANALYSIS OF
DETERMINANTS IN BILATERAL
INVESTMENT
Sho Sakuma
Graduate School of Tokyo University of Foreign Studies, JAPAN
January 2014

FOREIGN DIRECT INVESTMENT INTO THE WESTERN BALKANS: THE STATISTICAL ANALYSIS OF DETERMINANTS IN BILATERAL INVESTMENT
1 / 27
Contents
Abstract 2
Introduction 3
Previous works and backgrounds 6
The analytical method and the model 8
The empirical results 12
Concluding Remarks 16
References 18
Appendix 20
FOREIGN DIRECT INVESTMENT INTO THE WESTERN BALKANS: THE STATISTICAL ANALYSIS OF DETERMINANTS IN BILATERAL INVESTMENT
2 / 27
Foreign Direct Investment into the Western Balkans:
The Statistical Analysis of Determinants in Bilateral Investment
Sho Sakuma
Graduate School of Tokyo University of Foreign Studies, Tokyo, JAPAN
Abstract:
This paper aims to analyze the determinants of foreign direct investment (FDI) in the
Western Balkans, which are located in the western part of the Balkan Peninsula. This
region is one of the poorest regions in Europe and their need for the economic
development is necessary. In this paper, we adopted statistical method and analyzed
the relationship between the latest FDI data and following seven types of data- Gross
Domestic Product (GDP) of the host country, GDP of the origin country, geographical
distance between origin and host countries, the amount of official development
assistance (ODA) inflows, the number of emigration, religious commonness and the
existence of investment treaties. The results indicate that ODA by some origin
countries are positively correlated with FDI flows from that country. We also find
positive correlation between FDI and the number of emigration from the Western
Balkans. As for commonness of religion, we observe some origin countries’ preference
for commonness of religion. Contrary to our expectation, investment treaties do not
ensure increase of FDI inflows.

FOREIGN DIRECT INVESTMENT INTO THE WESTERN BALKANS: THE STATISTICAL ANALYSIS OF DETERMINANTS IN BILATERAL INVESTMENT
3 / 27
I. Introduction
The Western Balkans, which are specifically defined as following eight countries-
Slovenia, Croatia, Bosnia and Herzegovina1, Serbia, Montenegro, Kosovo2, Macedonia
and Albania-are located in a part of Southeast Europe. From worldwide point of view,
what is well known about this region is the wars in 90’s. Slovenia, Croatia, Bosnia and
Herzegovina, Kosovo and Macedonia suffered massive wars in the past.
More than ten years has passed since the final war ended in Macedonia in 2001 and it
is often said that direct influence from a series of wars have already disappeared.
Indeed, according to the World Bank’s data base ”World Development Indicators”,
income levels of these countries are rated not so bad (only is Kosovo classified
as ”Lower middle income” and the other countries are classified as “High income”
or ”Upper middle income”). Compared to the least developed countries (LDCs),
economic situation the Western Balkans face today looks less serious than that of LDCs.
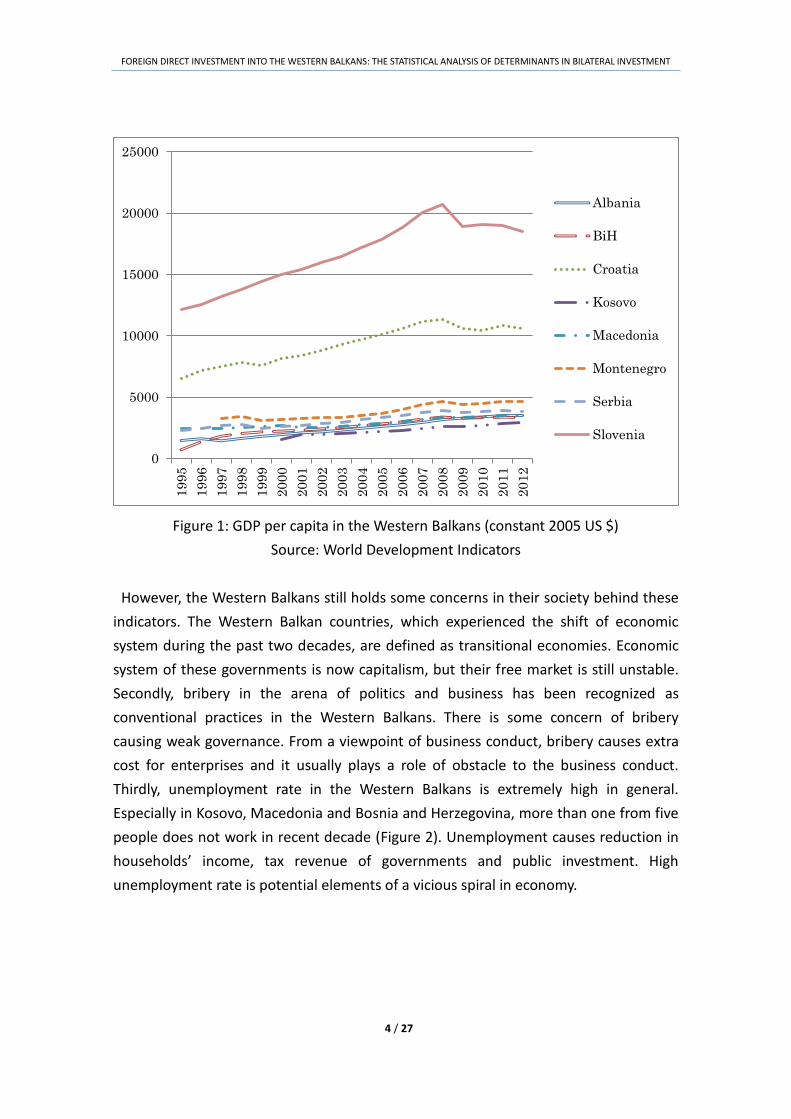
Similarly, GDP per capita of the Western Balkans from 1995 to 2012 has been growing
as a whole, even though its trend is gradual (Figure 1).
1 We indicate Bosnia and Herzegovina as BiH at some part of this paper. 2 Recognitions about status of Kosovo in the world differ by country. In this paper we take up Kosovo as one country because of convenience to implement statistical analysis.
FOREIGN DIRECT INVESTMENT INTO THE WESTERN BALKANS: THE STATISTICAL ANALYSIS OF DETERMINANTS IN BILATERAL INVESTMENT
4 / 27
Figure 1: GDP per capita in the Western Balkans (constant 2005 US $)
Source: World Development Indicators
However, the Western Balkans still holds some concerns in their society behind these
indicators. The Western Balkan countries, which experienced the shift of economic
system during the past two decades, are defined as transitional economies. Economic
system of these governments is now capitalism, but their free market is still unstable.
Secondly, bribery in the arena of politics and business has been recognized as
conventional practices in the Western Balkans. There is some concern of bribery
causing weak governance. From a viewpoint of business conduct, bribery causes extra
cost for enterprises and it usually plays a role of obstacle to the business conduct.
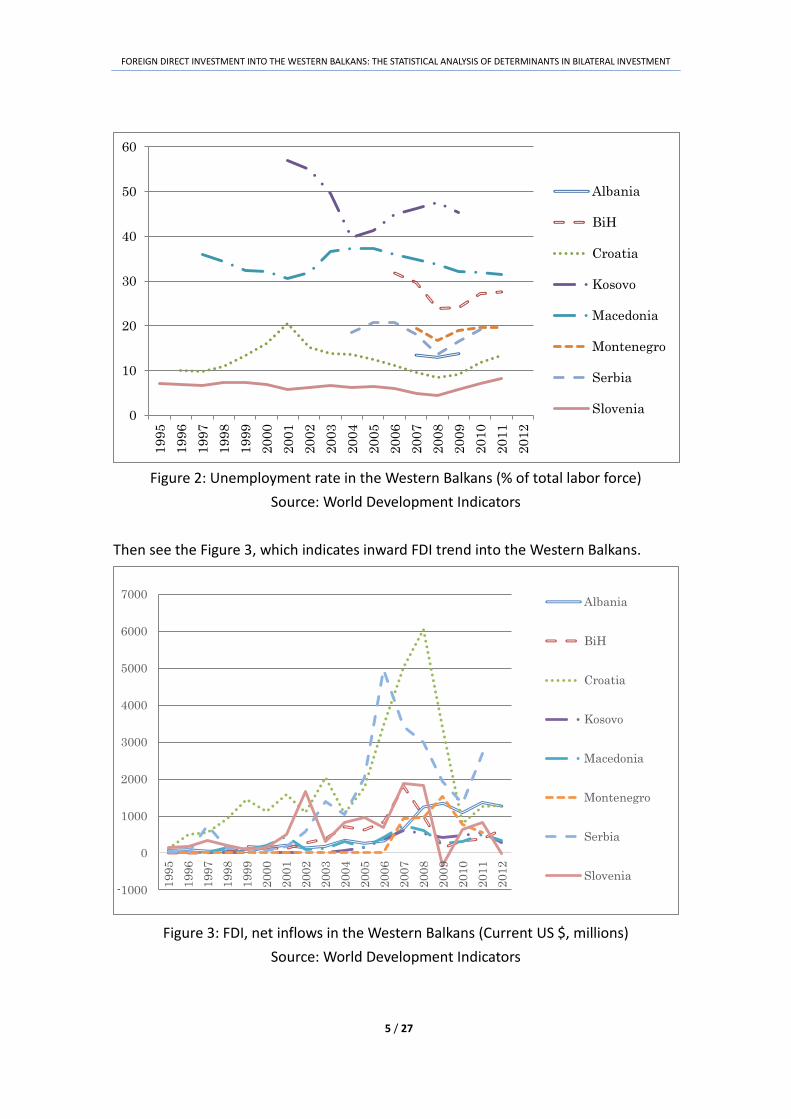
Thirdly, unemployment rate in the Western Balkans is extremely high in general.
Especially in Kosovo, Macedonia and Bosnia and Herzegovina, more than one from five
people does not work in recent decade (Figure 2). Unemployment causes reduction in
households’ income, tax revenue of governments and public investment. High
unemployment rate is potential elements of a vicious spiral in economy.
0
5000
10000
15000
20000
25000
19
95
19
96
19
97
19
98
19
99
20
00
20
01
20
02
20
03
20
04
20
05
20
06
20
07
20
08
20
09
20
10
20
11
20
12
Albania
BiH
Croatia
Kosovo
Macedonia
Montenegro
Serbia
Slovenia
FOREIGN DIRECT INVESTMENT INTO THE WESTERN BALKANS: THE STATISTICAL ANALYSIS OF DETERMINANTS IN BILATERAL INVESTMENT
5 / 27
Figure 2: Unemployment rate in the Western Balkans (% of total labor force)
Source: World Development Indicators
Then see the Figure 3, which indicates inward FDI trend into the Western Balkans.
Figure 3: FDI, net inflows in the Western Balkans (Current US $, millions)
Source: World Development Indicators
0
10
20
30
40
50
6019
95
19
96
19
97
19
98
19
99
20
00
20
01
20
02
20
03
20
04
20
05
20
06
20
07
20
08
20
09
20
10
20
11
20
12
Albania
BiH
Croatia
Kosovo
Macedonia
Montenegro
Serbia
Slovenia
-1000
0
1000
2000
3000
4000
5000
6000
7000
199
5
199
6
199
7
199
8
199
9
200
0
200
1
200
2
200
3
200
4
200
5
200
6
200
7
200
8
200
9
201
0
201
1
201
2
Albania
BiH
Croatia
Kosovo
Macedonia
Montenegro
Serbia
Slovenia
FOREIGN DIRECT INVESTMENT INTO THE WESTERN BALKANS: THE STATISTICAL ANALYSIS OF DETERMINANTS IN BILATERAL INVESTMENT
6 / 27
The major driving forces of FDI attraction are Croatia and Serbia3. Nearly 59% of total
FDI inflow into the region goes only to these two countries. From 1995, FDI inflows
have been increasing in all countries by 2008 in general, but after the global financial
crisis its volume fell down sharply and still has not recovered in the level of 2008.
The Western Balkans countries are in transition in various points and their institutions
are not functioning properly. Firstly, all countries of the Western Balkans sifted their
economic systems to capitalism after the end of the Cold War, but the process of
transition to free market has not completed yet. Secondly, most of the Balkan countries
are trying to be a member of the European Union (EU). Slovenia and Croatia already
joined EU in 2004 and 2013. The other countries have already applied for membership
or are recognized as candidates or potential candidates by EU member countries. EU
membership requires the adoption of EU legislation across the range of commercial
and civil law, including trade rules, financial regulation, and competition policy.
However, the process of this adoption is also still in the middle.
At the end of the introduction, we state a research question of this paper to enter the
next chapter. What are the major determinants of attracting FDI into the Western
Balkan countries that leads to economic development?
II. Previous works and backgrounds
In this chapter, we review the previous studies on FDI in the Western Balkans. The
number of studies which are focusing on the Western Balkans’ economy is not many.
Especially there are few quantitative economic studies.
Žugić (2011) analyzes the economic environment that the Western Balkan countries
face after the global economic crisis and assessed its effect on FDI. She states that it is
the indigenous structural problem in the Western Balkans that caused inward FDI
reduction, so just focusing on dealing with economic crisis is not sufficient to the FDI
attraction. Botrić (2010) shows the relationship between the level of privatization of
national companies and FDI attraction in the Western Balkans using the panel data
framework. Botrić and Škuflić (2006) investigate the main determinants of FDI in the
Southeast European Countries by using regression-based estimation. They conclude
privatization, trade openness and density of infrastructure appear to be robust as
determinants of inward FDI. Janicki and Wunnava (2004) also try to find the FDI
3 Serbia’s data by 2006 is the data of State Union of Serbia and Montenegro.

FOREIGN DIRECT INVESTMENT INTO THE WESTERN BALKANS: THE STATISTICAL ANALYSIS OF DETERMINANTS IN BILATERAL INVESTMENT
7 / 27
determinants between EU member countries and central and east European candidate
economies in transition. They reveal that the key determinants are size of the host
economy, host country risk, labor costs in host country and openness to trade. In terms
of the effects of EU accession on inward FDI, Bevan and Estrin (2004) find that besides
unit labor costs, gravity factors, market size and proximity, announcements about EU
accession proposals have an influence on FDI inflows into the European transition
economies.
These studies mainly focus on the national status of destination countries of FDI4. For
that reason, bilateral indicators have been hardly analyzed as variables. The traditional
variables such as the level of privatization, trade openness, density of infrastructure,
size of the host country do not vary from whichever country inward FDI originates. On
the other hand, bilateral indicators such as inward ODA, geographic distance, the
number of emigration always vary depending on the combination of host county and
origin country.
Therefore, emphasizing on bilateral indicators the relationship between FDI flows and
economic indicators is analyzed in this paper. Especially commonness of religion
between two countries, which we talk about in the next chapter, has hardly examined
so far. These are uniqueness of our study and are expected to be “value-added” for this
paper.
4 In most of the previous works, FDI is divided in three types-market seeking, efficiency seeking and resource seeking and analyzed. Host counties’ indicator is suitable for this viewpoint.
FOREIGN DIRECT INVESTMENT INTO THE WESTERN BALKANS: THE STATISTICAL ANALYSIS OF DETERMINANTS IN BILATERAL INVESTMENT
8 / 27
III. The analytical method and the model
Before we determine a model to see the correlation between inward FDI into the
Western Balkans and bilateral indicators, we have to look into the model proposed by
Bevan and Estrin (2004). This study is the basis of our study. According to Tanaka (2012),
gravity equation has been developing both in the theory and in the methods of
quantitative analysis. The gravity model in international economics is used to capture
the correlation in investment and the model proposed by Bevan and Estrin is also
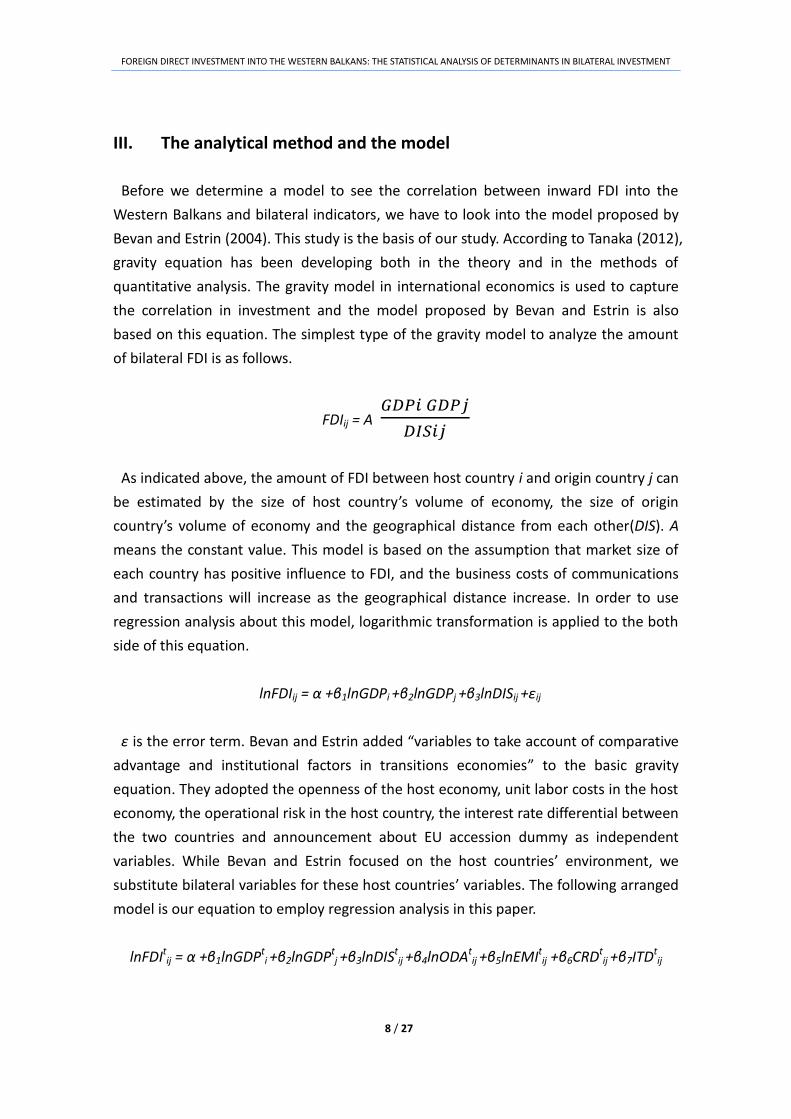
based on this equation. The simplest type of the gravity model to analyze the amount
of bilateral FDI is as follows.
FDIij = A 𝐺𝐷𝑃𝑖 𝐺𝐷𝑃𝑗
𝐷𝐼𝑆𝑖𝑗
As indicated above, the amount of FDI between host country i and origin country j can
be estimated by the size of host country’s volume of economy, the size of origin
country’s volume of economy and the geographical distance from each other(DIS). A
means the constant value. This model is based on the assumption that market size of
each country has positive influence to FDI, and the business costs of communications
and transactions will increase as the geographical distance increase. In order to use
regression analysis about this model, logarithmic transformation is applied to the both
side of this equation.
lnFDIij = α +β1lnGDPi +β2lnGDPj +β3lnDISij +εij
ε is the error term. Bevan and Estrin added “variables to take account of comparative
advantage and institutional factors in transitions economies” to the basic gravity
equation. They adopted the openness of the host economy, unit labor costs in the host
economy, the operational risk in the host country, the interest rate differential between
the two countries and announcement about EU accession dummy as independent
variables. While Bevan and Estrin focused on the host countries’ environment, we
substitute bilateral variables for these host countries’ variables. The following arranged
model is our equation to employ regression analysis in this paper.
lnFDItij = α +β1lnGDPt
i +β2lnGDPtj +β3lnDISt
ij +β4lnODAtij +β5lnEMIt
ij +β6CRDtij +β7ITDt
ij
FOREIGN DIRECT INVESTMENT INTO THE WESTERN BALKANS: THE STATISTICAL ANALYSIS OF DETERMINANTS IN BILATERAL INVESTMENT
9 / 27
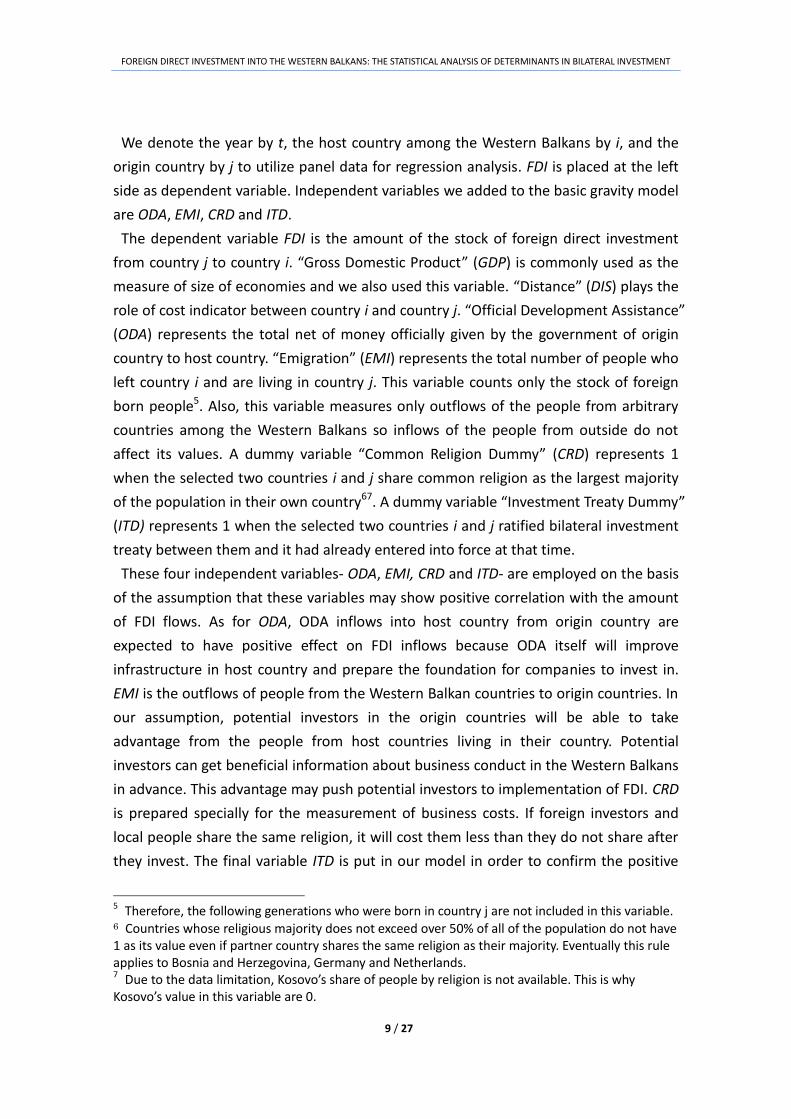
We denote the year by t, the host country among the Western Balkans by i, and the
origin country by j to utilize panel data for regression analysis. FDI is placed at the left
side as dependent variable. Independent variables we added to the basic gravity model
are ODA, EMI, CRD and ITD.
The dependent variable FDI is the amount of the stock of foreign direct investment
from country j to country i. “Gross Domestic Product” (GDP) is commonly used as the
measure of size of economies and we also used this variable. “Distance” (DIS) plays the
role of cost indicator between country i and country j. “Official Development Assistance”
(ODA) represents the total net of money officially given by the government of origin
country to host country. “Emigration” (EMI) represents the total number of people who
left country i and are living in country j. This variable counts only the stock of foreign
born people5. Also, this variable measures only outflows of the people from arbitrary
countries among the Western Balkans so inflows of the people from outside do not
affect its values. A dummy variable “Common Religion Dummy” (CRD) represents 1
when the selected two countries i and j share common religion as the largest majority
of the population in their own country67. A dummy variable “Investment Treaty Dummy”
(ITD) represents 1 when the selected two countries i and j ratified bilateral investment
treaty between them and it had already entered into force at that time.
These four independent variables- ODA, EMI, CRD and ITD- are employed on the basis
of the assumption that these variables may show positive correlation with the amount
of FDI flows. As for ODA, ODA inflows into host country from origin country are
expected to have positive effect on FDI inflows because ODA itself will improve
infrastructure in host country and prepare the foundation for companies to invest in.
EMI is the outflows of people from the Western Balkan countries to origin countries. In
our assumption, potential investors in the origin countries will be able to take
advantage from the people from host countries living in their country. Potential
investors can get beneficial information about business conduct in the Western Balkans
in advance. This advantage may push potential investors to implementation of FDI. CRD
is prepared specially for the measurement of business costs. If foreign investors and
local people share the same religion, it will cost them less than they do not share after
they invest. The final variable ITD is put in our model in order to confirm the positive
5 Therefore, the following generations who were born in country j are not included in this variable. 6 Countries whose religious majority does not exceed over 50% of all of the population do not have 1 as its value even if partner country shares the same religion as their majority. Eventually this rule applies to Bosnia and Herzegovina, Germany and Netherlands. 7 Due to the data limitation, Kosovo’s share of people by religion is not available. This is why Kosovo’s value in this variable are 0.
FOREIGN DIRECT INVESTMENT INTO THE WESTERN BALKANS: THE STATISTICAL ANALYSIS OF DETERMINANTS IN BILATERAL INVESTMENT
10 / 27
effects of bilateral investment treaties on actual volume of FDI inflows.
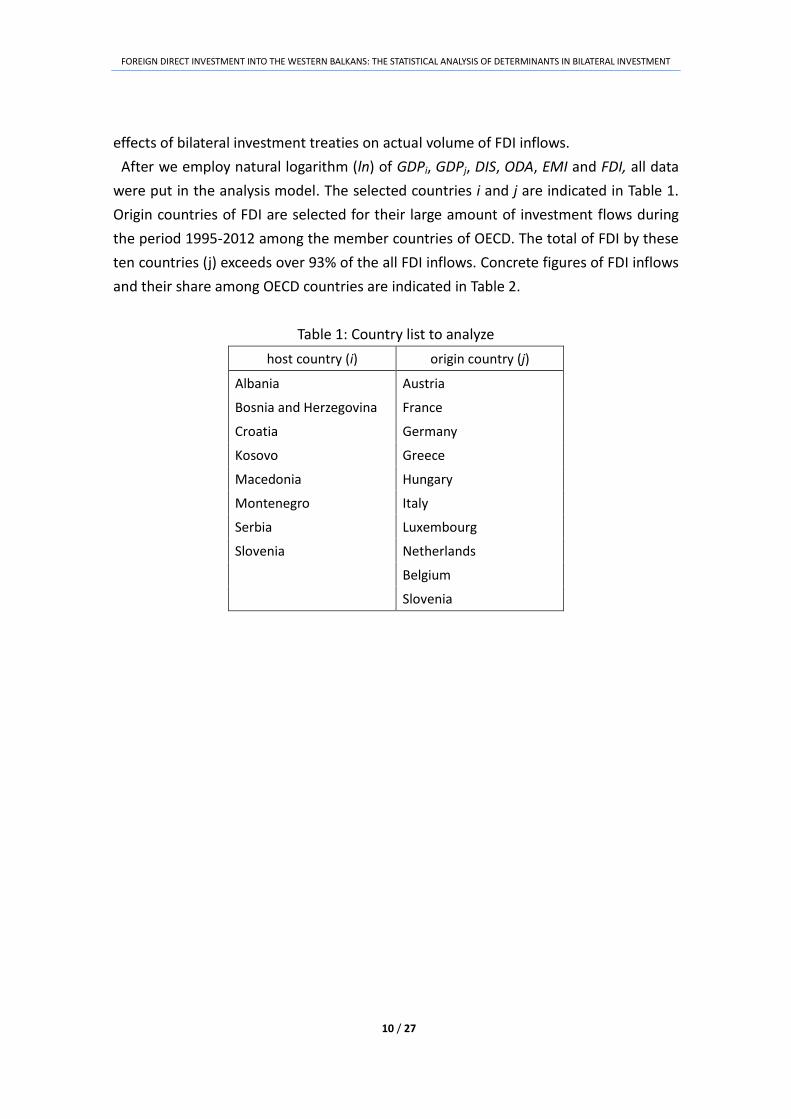
After we employ natural logarithm (ln) of GDPi, GDPj, DIS, ODA, EMI and FDI, all data
were put in the analysis model. The selected countries i and j are indicated in Table 1.
Origin countries of FDI are selected for their large amount of investment flows during
the period 1995-2012 among the member countries of OECD. The total of FDI by these
ten countries (j) exceeds over 93% of the all FDI inflows. Concrete figures of FDI inflows
and their share among OECD countries are indicated in Table 2.
Table 1: Country list to analyze
host country (i) origin country (j)
Albania Austria
Bosnia and Herzegovina France
Croatia Germany
Kosovo Greece
Macedonia Hungary
Montenegro Italy
Serbia Luxembourg
Slovenia Netherlands
Belgium
Slovenia

FOREIGN DIRECT INVESTMENT INTO THE WESTERN BALKANS: THE STATISTICAL ANALYSIS OF DETERMINANTS IN BILATERAL INVESTMENT
11 / 27
Table 2: The origin ten countries (j) and their volume in total FDI (US $, millions)8
origin country (j) FDI into host country (i) Share
Austria 16023.3 33.9%
94.0%
Germany 6491.0 13.7%
Hungary 4572.1 9.7%
Belgium 4153.9 8.8%
France 3207.7 6.8%
Slovenia 2993.3 6.3%
Greece 2021.7 4.3%
Italy 2005.4 4.2%
Luxembourg 1955.7 4.1%
Netherlands 1001.9 2.1%
The others 2829.4 6.0% 6.0%
Total 47255.4 100.0% 100.0%
Source: OECD.stat
The range of the year t is basically from 1995 to 2012. The data of the countries which
became independent after 1995 cover only the period after independence9. Because of
the limitation of available data, the original data downloaded from online databases
contained some defect part. As for variables FDI, GDPi, GDPj, ODA and EMI, we
substituted the estimated values for the missing values in order to get substantial
number of data combinations for statistical analysis10. Data combinations that have still
some defect part before regression analysis are finally dropped from the dataset.
The original data used for these variables are obtained from following websites. FDI,
ODA and EMI are from the Organisation for Economic Co-operation and Development
“OECD.stat”, GDPi and GDPj from the World Bank “World Development Indicators”, DIS
from Google Inc. “Google Maps”11, CRD from Central Intelligence Agency “The World
Factbook” and ITD from the International Centre for Settlement of Investment Disputes
“ICSID Database of Bilateral Investment Treaties”.
8 Figures in this table are made by totaling FDI inflows from 1995 to 2012. 9 Serbia, Montenegro and Kosovo correspond to this. 10 From year and available values of each data observation, we used general linear model to create the estimated values. After its creation every value were checked and inappropriate values were deleted (e.g. minus value in FDI). 11 Variable DIS is made by measuring geographical slant distance between capitals of two countries. As for Montenegro, we choose Podgorica as capital, not Cetinje because of its practical function as capital city.

FOREIGN DIRECT INVESTMENT INTO THE WESTERN BALKANS: THE STATISTICAL ANALYSIS OF DETERMINANTS IN BILATERAL INVESTMENT
12 / 27
IV. The empirical results
We employed two types of aggregation in this study. In the first stage, the dataset is
aggregated by the host country (i). In the second stage, we changed the way of
aggregation using the same dataset, in order to inspect the determinants from the side
of the origin country (j). The results of regression analysis based on the model
discussed in the previous chapter are shown in Table 3 and 4.
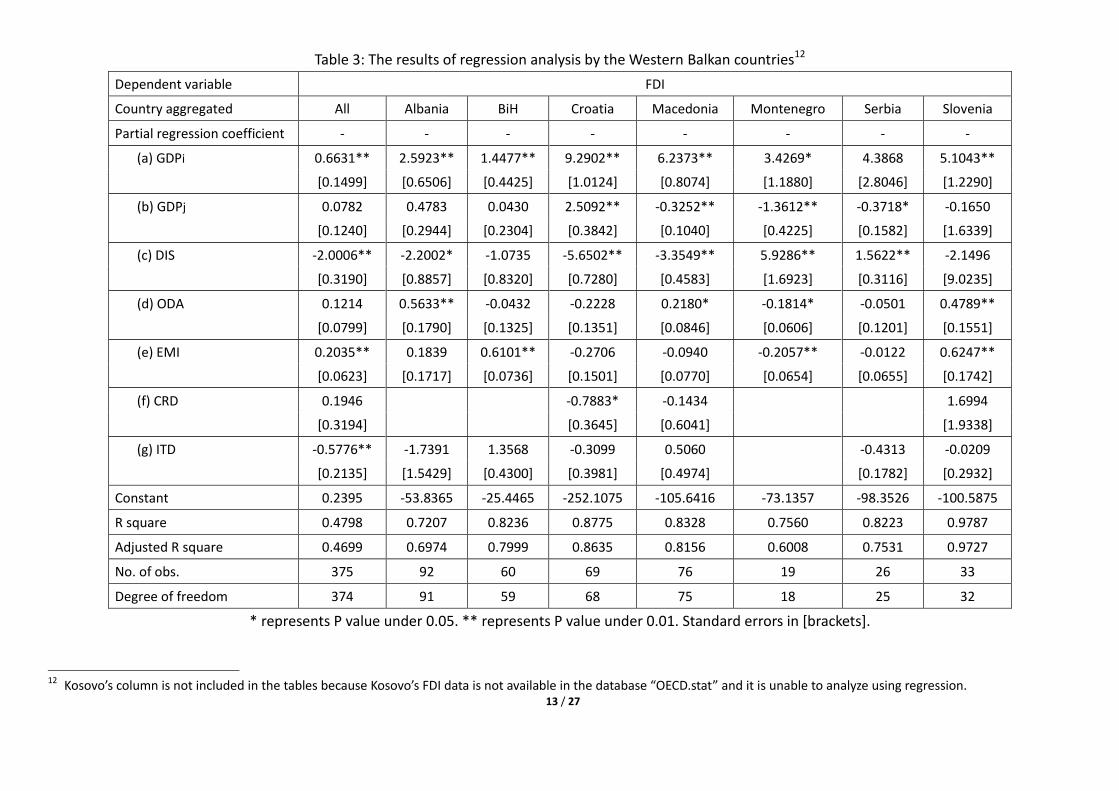
Table 3 shows the result of regression analysis from the views of host countries. We
can see the correlation between seven independent variables and FDI by the Western
Balkan countries. On the other hand, Table 4 indicates the correlation by the origin
country of FDI. Blanks in these tables are the parts that could not get results of
regression analysis. This is because in the all observations of each aggregation, we
could not find any difference in corresponding variables.
These two tables are summarized for comparison among the countries so we can
grasp characteristics of each country. The original and detailed results of regression
analysis implemented in this paper are contained in Appendix.
13 / 27
Table 3: The results of regression analysis by the Western Balkan countries12
Dependent variable FDI
Country aggregated All Albania BiH Croatia Macedonia Montenegro Serbia Slovenia
Partial regression coefficient - - - - - - - -
(a) GDPi 0.6631** 2.5923** 1.4477** 9.2902** 6.2373** 3.4269* 4.3868 5.1043**
[0.1499] [0.6506] [0.4425] [1.0124] [0.8074] [1.1880] [2.8046] [1.2290]
(b) GDPj 0.0782 0.4783 0.0430 2.5092** -0.3252** -1.3612** -0.3718* -0.1650
[0.1240] [0.2944] [0.2304] [0.3842] [0.1040] [0.4225] [0.1582] [1.6339]
(c) DIS -2.0006** -2.2002* -1.0735 -5.6502** -3.3549** 5.9286** 1.5622** -2.1496
[0.3190] [0.8857] [0.8320] [0.7280] [0.4583] [1.6923] [0.3116] [9.0235]
(d) ODA 0.1214 0.5633** -0.0432 -0.2228 0.2180* -0.1814* -0.0501 0.4789**
[0.0799] [0.1790] [0.1325] [0.1351] [0.0846] [0.0606] [0.1201] [0.1551]
(e) EMI 0.2035** 0.1839 0.6101** -0.2706 -0.0940 -0.2057** -0.0122 0.6247**
[0.0623] [0.1717] [0.0736] [0.1501] [0.0770] [0.0654] [0.0655] [0.1742]
(f) CRD 0.1946 -0.7883* -0.1434 1.6994
[0.3194] [0.3645] [0.6041] [1.9338]
(g) ITD -0.5776** -1.7391 1.3568 -0.3099 0.5060 -0.4313 -0.0209
[0.2135] [1.5429] [0.4300] [0.3981] [0.4974] [0.1782] [0.2932]
Constant 0.2395 -53.8365 -25.4465 -252.1075 -105.6416 -73.1357 -98.3526 -100.5875
R square 0.4798 0.7207 0.8236 0.8775 0.8328 0.7560 0.8223 0.9787
Adjusted R square 0.4699 0.6974 0.7999 0.8635 0.8156 0.6008 0.7531 0.9727
No. of obs. 375 92 60 69 76 19 26 33
Degree of freedom 374 91 59 68 75 18 25 32
* represents P value under 0.05. ** represents P value under 0.01. Standard errors in [brackets].
12 Kosovo’s column is not included in the tables because Kosovo’s FDI data is not available in the database “OECD.stat” and it is unable to analyze using regression.
14 / 27
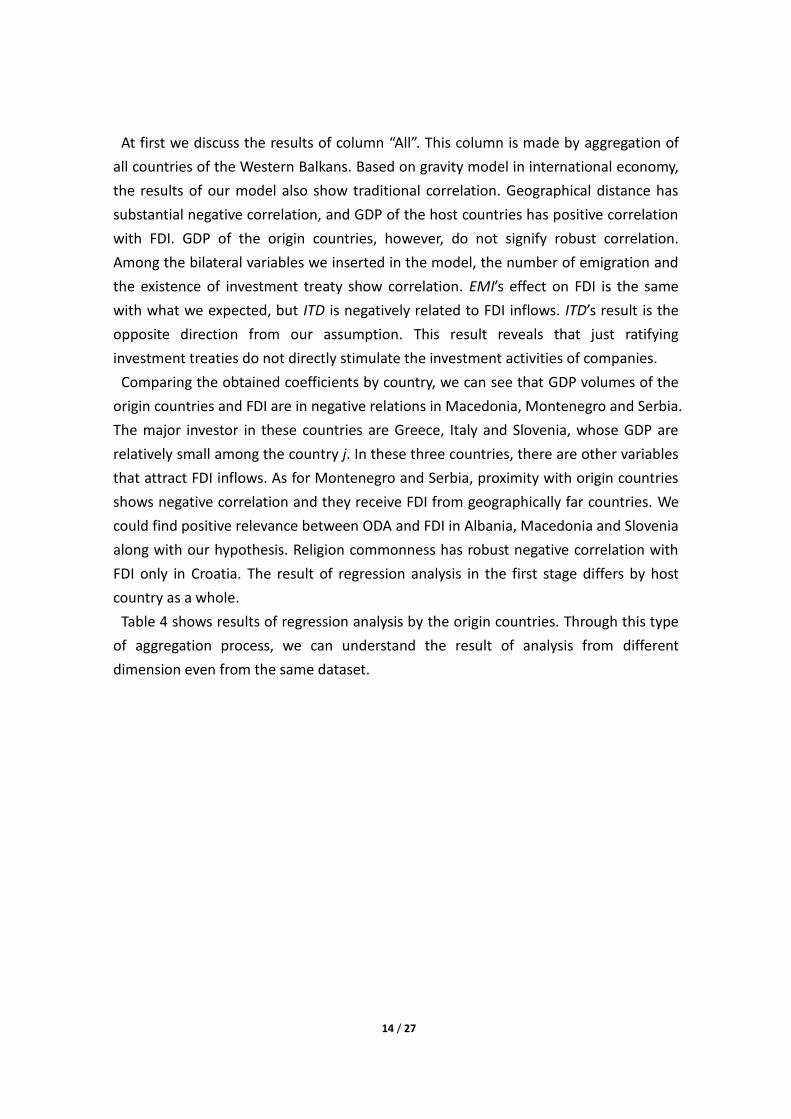
At first we discuss the results of column “All”. This column is made by aggregation of
all countries of the Western Balkans. Based on gravity model in international economy,
the results of our model also show traditional correlation. Geographical distance has
substantial negative correlation, and GDP of the host countries has positive correlation
with FDI. GDP of the origin countries, however, do not signify robust correlation.
Among the bilateral variables we inserted in the model, the number of emigration and
the existence of investment treaty show correlation. EMI’s effect on FDI is the same
with what we expected, but ITD is negatively related to FDI inflows. ITD’s result is the
opposite direction from our assumption. This result reveals that just ratifying
investment treaties do not directly stimulate the investment activities of companies.
Comparing the obtained coefficients by country, we can see that GDP volumes of the
origin countries and FDI are in negative relations in Macedonia, Montenegro and Serbia.
The major investor in these countries are Greece, Italy and Slovenia, whose GDP are
relatively small among the country j. In these three countries, there are other variables
that attract FDI inflows. As for Montenegro and Serbia, proximity with origin countries
shows negative correlation and they receive FDI from geographically far countries. We
could find positive relevance between ODA and FDI in Albania, Macedonia and Slovenia
along with our hypothesis. Religion commonness has robust negative correlation with
FDI only in Croatia. The result of regression analysis in the first stage differs by host
country as a whole.
Table 4 shows results of regression analysis by the origin countries. Through this type
of aggregation process, we can understand the result of analysis from different
dimension even from the same dataset.

15 / 27
Table 4: The results of regression analysis by the origin countries1314
Dependent variable FDI
Country aggregated Austria France Germany Greece Hungary Italy Netherlands Slovenia
Partial regression coefficient - - - - - - - -
(a) GDPi 2.9714** -2.5821* 0.8728** 3.5359** -7.9375* 14.7555** -0.2901 0.2608**
[0.7817] [1.0773] [0.2253] [0.7593] [3.3221] [2.1882] [0.8613] [0.0873]
(b) GDPj 10.8805** 9.1776** 7.1955** 4.0231** 16.6256 -3.4827 0.8938 -1.6055
[1.4082] [2.2483] [1.4004] [1.0832] [8.5938] [3.4800] [2.1606] [0.8051]
(c) DIS 3.4418* -22.7565** -3.9563** -6.1405** -14.1573** 11.0031** 1.2050**
[1.6550] [3.8073] [0.9705] [1.7562] [4.8261] [1.7075] [0.3431]
(d) ODA 0.0979 0.7229** 0.2419** 0.2409* 0.0882 -0.0548 -0.0077 0.0767
[0.1555] [0.2439] [0.0856] [0.1127] [0.5509] [0.0897] [0.0668] [0.0965]
(e) EMI 0.6004** 0.8381 0.1603 0.3001 0.4658 -0.5383 0.6935 0.6885**
[0.1731] [0.4676] [0.0926] [0.1503] [0.3488] [0.3743] [0.5894] [0.0591]
(f) CRD 0.8713 -2.5435 5.7115** 7.1925* 2.6164**
[0.9127] [1.4237] [1.0269] [3.2706] [0.5698]
(g) ITD 0.0589 1.7375** 0.2037 1.7637 6.3468 -1.1379**
[0.1869] [0.6205] [0.1963] [1.0513] [4.5050] [0.1175]
Constant -375.1415 -35.0225 -195.5265 -146.7065 -152.8168 -302.1923 -17.1357 30.6893
R square 0.9661 0.6498 0.9172 0.9343 0.5812 0.9766 0.7677 0.9421
Adjusted R square 0.9609 0.6192 0.9076 0.9218 0.4802 0.9640 0.4402 0.9308
No. of obs. 54 88 69 45 37 21 17 44
Degree of freedom 53 87 68 44 36 20 19 43
* represents P value under 0.05. ** represents P value under 0.01. Standard errors in [brackets].
13 Belgium’s column is not included in the tables because Belgium’s EMI data is not available in the database “OECD.stat” and it is unable to analyze using regression. 14 Luxembourg’s column is not included in the tables because Luxembourg’s FDI data is not available in the database “OECD.stat” and it is unable to analyze using regression.

16 / 27
Seen from the points of views of origin countries, each variables shows different
feature in correlation by origin country as well. Positive effect of the origin countries’
GDP on FDI flows is observed in Austria, France, Germany and Greece this time. In the
columns of France, Germany and Greece influence of ODA is positive to FDI. There
might be a possibility that public-private partnership (PPP) strategy has been done in
these three countries. The most characteristic result is observed in CRD. Significant
positive correlation with FDI inflows is observed in Greece, Hungary and Slovenia.
Considering both results of regression analysis in the first and second stage, it is
concluded that there are two types of origin country from the viewpoint of religion.
Countries that take account of similarity of religion and prefer countries that share
common religion as a destination, and countries that do not take account of religious
similarity in decision making where to invest. The positive effect of investment treaties
on FDI is seen only in France.
V. Concluding Remarks
We analyzed in this study what are the main determinants for the Western Balkan
countries to attract FDI from abroad. In specific, through applying statistical regression
analysis to the latest available data, we examined if inward FDI and those variables –
GDP of the host county, GDP of the origin country, geographical distance of each county,
the amount of ODA to the host country, the number of emigration from the Balkan
country, similarity of religion and existence of bilateral investment treaty – show some
correlation through two types of aggregation.
Though these Balkan countries are bounded on each other and they were forming
one country in the near past except Albania, we find that economic characteristics
from the viewpoint of FDI are quite different among examined eight countries. Even
though they are called “the Western Balkans” as one regional group, the Western
Balkans hold diversity in its attraction of FDI.
Looking into the analytical results of whole Western Balkans, we can see that the
number of people from Western Balkans living in the origin countries of FDI plays the
role of push factor for potential investors. Considering this finding, the Western Balkan
countries should negotiate with other countries to accept emigrants from the Western
Balkans in anticipation of future FDI inflows. In addition, we find possibility of FDI
reduction effect of bilateral investment treaties in the Western Balkans. This result has
FOREIGN DIRECT INVESTMENT INTO THE WESTERN BALKANS: THE STATISTICAL ANALYSIS OF DETERMINANTS IN BILATERAL INVESTMENT
17 / 27
to be examined further in detail, but it may be possible to assume that just ratifying
investment treaties does not increases FDI flows any longer.
In the second analysis, we observed similar phenomenon in terms of the difference in
significant variables among origin countries of FDI. Because of the defect parts of some
countries in raw data, we were not able to conduct regression analysis about all of the
countries we had planned. However, the result that ODA have a positive correlation
with FDI flows suggests that policies taken by each government of origin countries have
influence on the money flows in private sector even though it is indirect. As for
commonness of religion, some countries among origin countries of FDI consider
commonness of religion when they select FDI destination and prefer similar country to
their own country.
Since the global economic crisis occurred in the first decade of the 21st century, the
Western Balkans, as well as the other part of the world, has been experiencing difficult
economic conditions. The range of findings our statistical and econometric study could
explore may not be comprehensive, but the empirical findings obtained through this
study would be one of the keys to the future attraction of FDI in the Western Balkans.
FOREIGN DIRECT INVESTMENT INTO THE WESTERN BALKANS: THE STATISTICAL ANALYSIS OF DETERMINANTS IN BILATERAL INVESTMENT
18 / 27
References
Barolli Blendi, Takahashi Koji and Tomizawa Toshikatsu (2009), "The Impact of Political
Volatility on Foreign Direct Investment: Evidences from the Western Balkan
Countries", Bulletin of Yamagata University(Social Science), Vol.40 No.1, 65-78.
Bellak Christian, Leibrecht Markus and Riedl Aleksandra (2008), "Labour costs and FDI
flows into Central and Eastern European Countries: Asurvey of the literature
and empirical evidence", Structural Change and Economic Dynamics 19, 17-37.
Bevan A. Alan and Estrin Saul (2004), "The determinants of foreign direct investment
into European transition economies" Journal of Comparative Economics 32,
775-787.
Botrić Valerija (2010), "Foreign direct investment in the Western Balkans: privatization,
institutional change, and banking sector dominance", Economic Annals, Volume
LV, No. 187, 7-30.
Botrić Valerija and Škuflić Lorena (2006), "Main Determinants of Foreign Direct
Investment in the Southeast European Countries", Transition Studies Review 13
(2), 359-377.
Budak Jelena and Rajh Edo (2011), "Corruption as an obstacle for Doing Business in the
Western Balkans: A Business Sector Perspective", EIZ Working Papers
EIZ-WP-1104.
Carstensen Kai and Toubal Farid (2003), "Foreign Direct Investment in Central and
Eastern European Countries: A Dynamic Panel Analysis", Kiel Working Paper No.
1143.
Clausing A. Kimberly and Dorobantu L. Cosmina (2005), "Re-entering Europe: Does
European Union candidacy boost foreign direct investment?" Economics of
Transition Volume 13 (1), 77-103.
Egger Peter and Pfaffermayr Michael (2004), "The impact of bilateral investment
treaties on foreign direct investment", Journal of Comparative Economics 32,
788-804.
Fink Guenther and Redaelli Silvia (2009), "Determinants of International Emergency Aid
Humanitarian Need Only?", The World Bank East Asia Human Development
Department Social Protection Division.
Galego Aurora, Vieira Carlos and Vieira Isabel (2004), "The CEEC as FDI Attractors A
Menace to the EU Periphery?", Emerging Markets Finance and Trade, vol.40,
no5, 74-91.
International Commission on the Balkans (2005), "The Balkans in Europe's Future",

FOREIGN DIRECT INVESTMENT INTO THE WESTERN BALKANS: THE STATISTICAL ANALYSIS OF DETERMINANTS IN BILATERAL INVESTMENT
19 / 27
Report.
International Monetary Fund (2013), "Financing Future Growth: The Evolving Role of
Banking Systems in CESEE", Central, Eastern and Southeastern
Europe—Regional Economic Issues, 1-42.
Janicki P. Hubert and Wunnava V. Phanindra (2004), "Determinants of foreign direct
investment: empirical evidence from EU accession candidates", Applied
Economics 36, 505-509.
Karakaplan Ugur M., Neyapti Bilin and Sayek Selin (2005), "Aid and Foreign Direct
Investment: International Evidence", Ankara: Bilkent University.
Kinoshita Yuko and Campos F. Nauro (2003), "Why does FDI go where it goes? New
evidence from the transition economies", William Davidson Institute Working
Paper Number 573.
Tešić Jelena (2010), "Institutional Environment and Foreign Direct Investment in the
Western Balkans", Institute for the Danube Region and Central Europe.
Multilateral Investment Guarantee Agency (2006), "Investment Horizons: Western
Balkans Benchmarking FDI Opportunities", The World Bank Group/MIGA,
Washington, DC.
Žugić Jelena (2011), "Foreign Direct Investment and Global Economic Crisis in the
Western Balkans", Journal on European Perspectives of the Western Balkans Vol.
3, No. 1 (4), 69-90.
Koyama Yoji (2010), “An Overview of Economy in the Western Balkans” (in Japanese,
“南東欧バルカン経済図説”), Eurasia Booklet No. 160, Toyo Shoten.
Tanaka Ayumu (2012), “International Trade and Trade Policy Studies No.13” (in
Japanese, “国際貿易と貿易政策研究メモ No.13”), Research Institute of
Economy, Trade & Industry, IAA.
Chida Zen (1999), “Why Yugoslav Wars were at a Stalemate for a Long Time?
Responsibilities of the Western Countries” (in Japanese, “ユーゴ紛争はなぜ長
期化したか 悲劇を大きくさせた欧米諸国の責任”), Keiso Shobo.
Taro Tsukimura (2006), “Wars in Yugoslavia – Political Power and Racism” (in Japanese,
“ユーゴ内戦―政治リーダーと民族主義”), University of Tokyo Press.
Momose Ryoji et al. (2012), “The Latest Studies of the Former Yugoslavia” (in Japanese,
“旧ユーゴ研究の最前線”), Keisuisha.
FOREIGN DIRECT INVESTMENT INTO THE WESTERN BALKANS: THE STATISTICAL ANALYSIS OF DETERMINANTS IN BILATERAL INVESTMENT
20 / 27
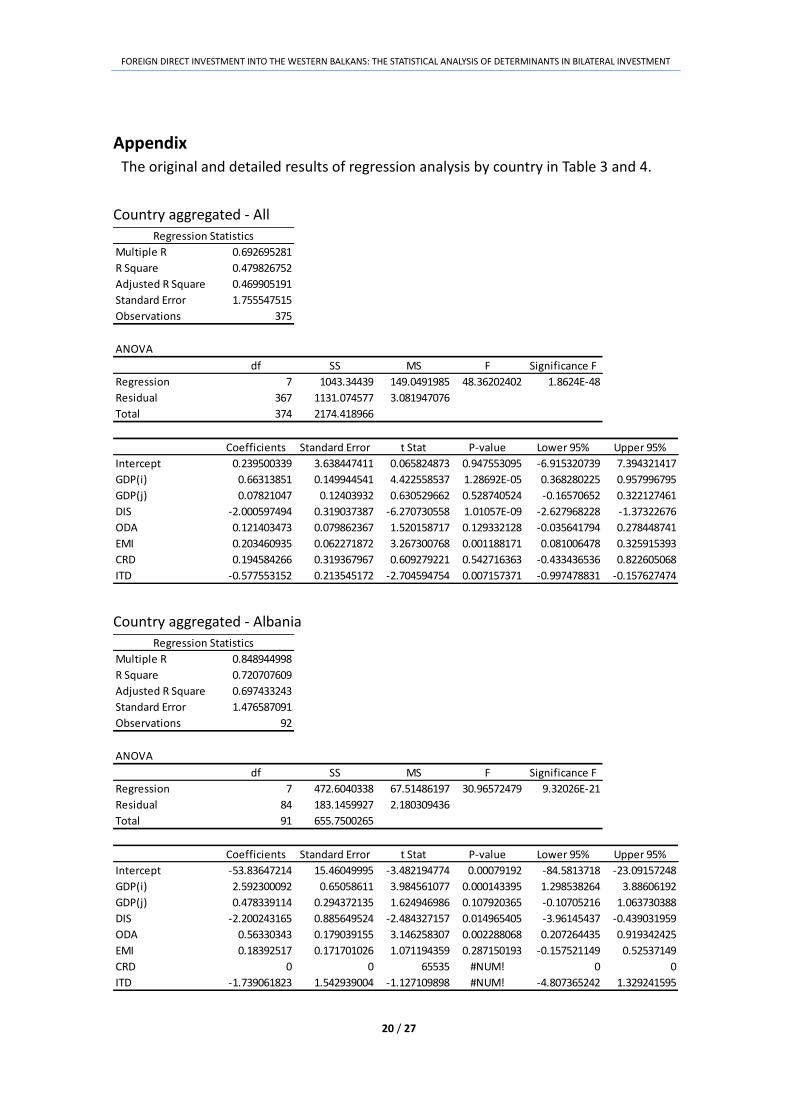
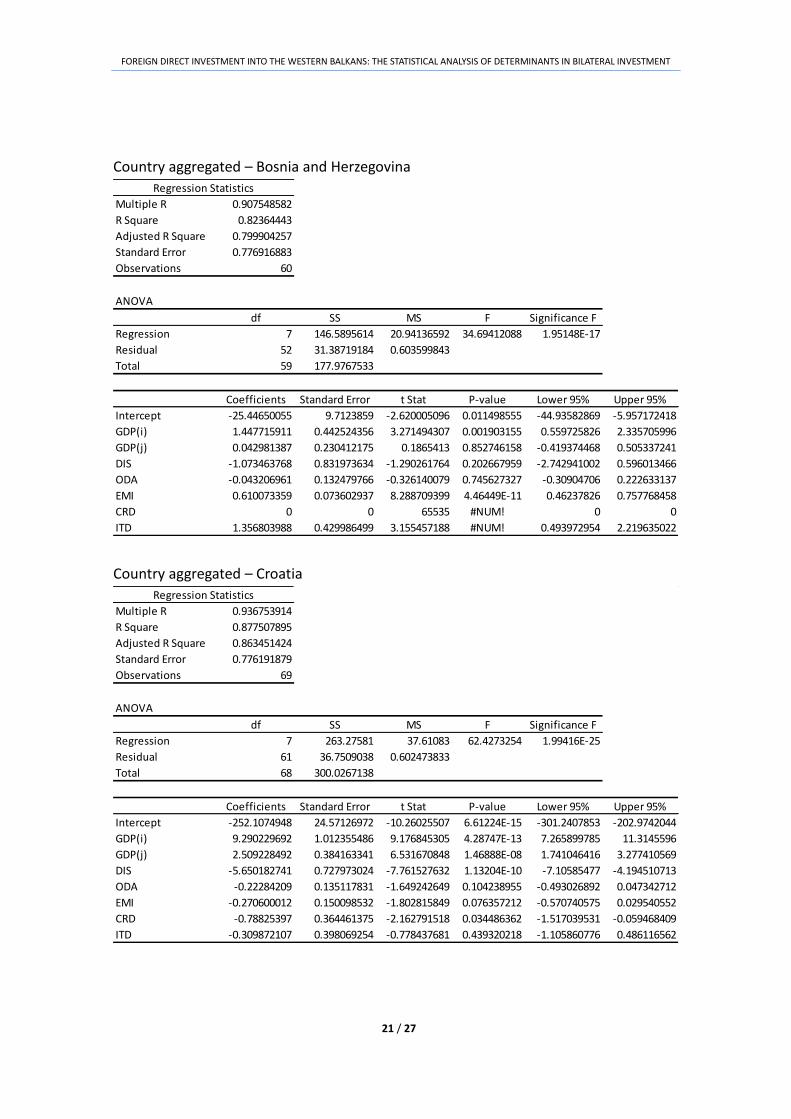
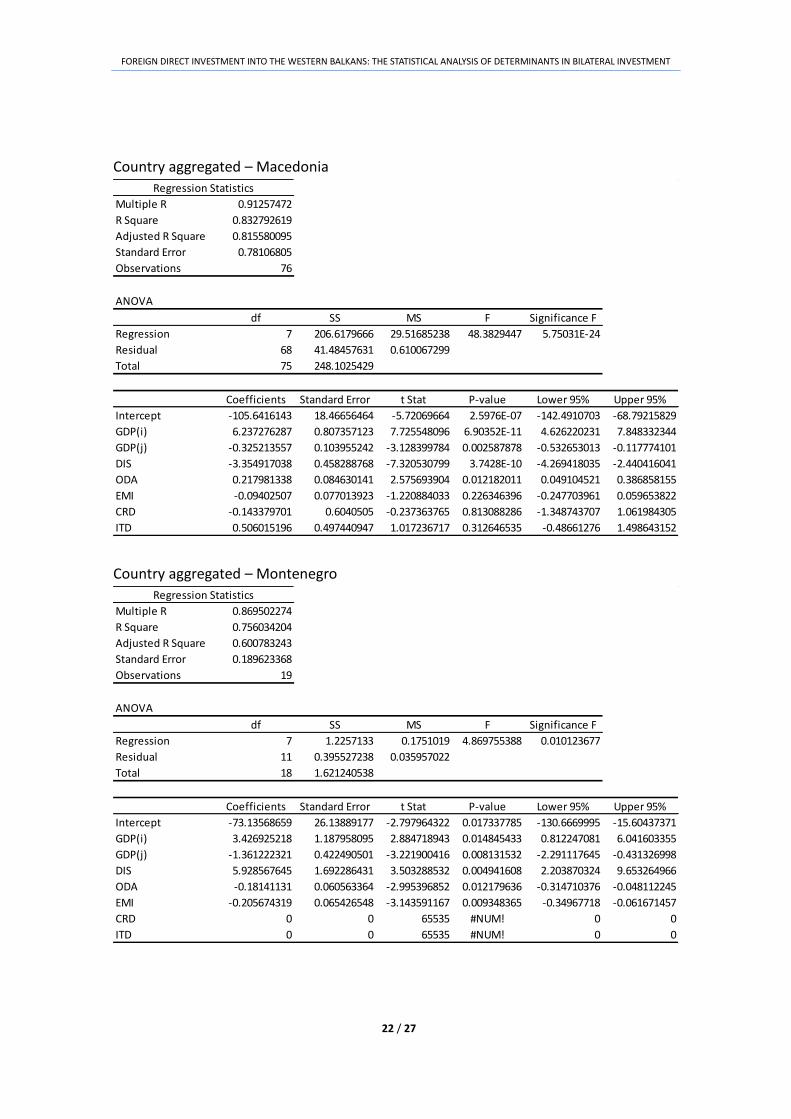
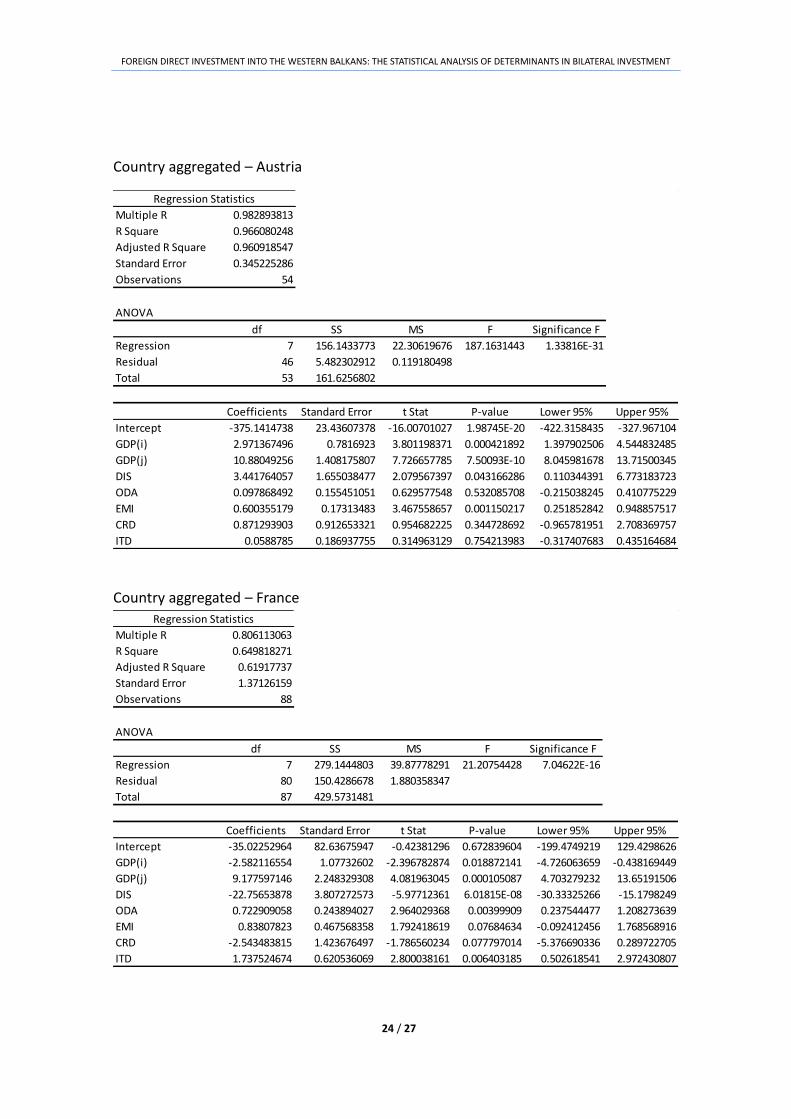
Appendix The original and detailed results of regression analysis by country in Table 3 and 4.
Country aggregated - All
Country aggregated - Albania
Regression Statistics
Multiple R 0.692695281
R Square 0.479826752
Adjusted R Square 0.469905191
Standard Error 1.755547515
Observations 375
ANOVA
df SS MS F Significance F
Regression 7 1043.34439 149.0491985 48.36202402 1.8624E-48
Residual 367 1131.074577 3.081947076
Total 374 2174.418966
Coefficients Standard Error t Stat P-value Lower 95% Upper 95%
Intercept 0.239500339 3.638447411 0.065824873 0.947553095 -6.915320739 7.394321417
GDP(i) 0.66313851 0.149944541 4.422558537 1.28692E-05 0.368280225 0.957996795
GDP(j) 0.07821047 0.12403932 0.630529662 0.528740524 -0.16570652 0.322127461
DIS -2.000597494 0.319037387 -6.270730558 1.01057E-09 -2.627968228 -1.37322676
ODA 0.121403473 0.079862367 1.520158717 0.129332128 -0.035641794 0.278448741
EMI 0.203460935 0.062271872 3.267300768 0.001188171 0.081006478 0.325915393
CRD 0.194584266 0.319367967 0.609279221 0.542716363 -0.433436536 0.822605068
ITD -0.577553152 0.213545172 -2.704594754 0.007157371 -0.997478831 -0.157627474
Regression Statistics
Multiple R 0.848944998
R Square 0.720707609
Adjusted R Square 0.697433243
Standard Error 1.476587091
Observations 92
ANOVA
df SS MS F Significance F
Regression 7 472.6040338 67.51486197 30.96572479 9.32026E-21
Residual 84 183.1459927 2.180309436
Total 91 655.7500265
Coefficients Standard Error t Stat P-value Lower 95% Upper 95%
Intercept -53.83647214 15.46049995 -3.482194774 0.00079192 -84.5813718 -23.09157248
GDP(i) 2.592300092 0.65058611 3.984561077 0.000143395 1.298538264 3.88606192
GDP(j) 0.478339114 0.294372135 1.624946986 0.107920365 -0.10705216 1.063730388
DIS -2.200243165 0.885649524 -2.484327157 0.014965405 -3.96145437 -0.439031959
ODA 0.56330343 0.179039155 3.146258307 0.002288068 0.207264435 0.919342425
EMI 0.18392517 0.171701026 1.071194359 0.287150193 -0.157521149 0.52537149
CRD 0 0 65535 #NUM! 0 0
ITD -1.739061823 1.542939004 -1.127109898 #NUM! -4.807365242 1.329241595
FOREIGN DIRECT INVESTMENT INTO THE WESTERN BALKANS: THE STATISTICAL ANALYSIS OF DETERMINANTS IN BILATERAL INVESTMENT
21 / 27
Country aggregated – Bosnia and Herzegovina
Country aggregated – Croatia
Regression Statistics
Multiple R 0.907548582
R Square 0.82364443
Adjusted R Square 0.799904257
Standard Error 0.776916883
Observations 60
ANOVA
df SS MS F Significance F
Regression 7 146.5895614 20.94136592 34.69412088 1.95148E-17
Residual 52 31.38719184 0.603599843
Total 59 177.9767533
Coefficients Standard Error t Stat P-value Lower 95% Upper 95%
Intercept -25.44650055 9.7123859 -2.620005096 0.011498555 -44.93582869 -5.957172418
GDP(i) 1.447715911 0.442524356 3.271494307 0.001903155 0.559725826 2.335705996
GDP(j) 0.042981387 0.230412175 0.1865413 0.852746158 -0.419374468 0.505337241
DIS -1.073463768 0.831973634 -1.290261764 0.202667959 -2.742941002 0.596013466
ODA -0.043206961 0.132479766 -0.326140079 0.745627327 -0.30904706 0.222633137
EMI 0.610073359 0.073602937 8.288709399 4.46449E-11 0.46237826 0.757768458
CRD 0 0 65535 #NUM! 0 0
ITD 1.356803988 0.429986499 3.155457188 #NUM! 0.493972954 2.219635022
Regression Statistics
Multiple R 0.936753914
R Square 0.877507895
Adjusted R Square 0.863451424
Standard Error 0.776191879
Observations 69
ANOVA
df SS MS F Significance F
Regression 7 263.27581 37.61083 62.4273254 1.99416E-25
Residual 61 36.7509038 0.602473833
Total 68 300.0267138
Coefficients Standard Error t Stat P-value Lower 95% Upper 95%
Intercept -252.1074948 24.57126972 -10.26025507 6.61224E-15 -301.2407853 -202.9742044
GDP(i) 9.290229692 1.012355486 9.176845305 4.28747E-13 7.265899785 11.3145596
GDP(j) 2.509228492 0.384163341 6.531670848 1.46888E-08 1.741046416 3.277410569
DIS -5.650182741 0.727973024 -7.761527632 1.13204E-10 -7.10585477 -4.194510713
ODA -0.22284209 0.135117831 -1.649242649 0.104238955 -0.493026892 0.047342712
EMI -0.270600012 0.150098532 -1.802815849 0.076357212 -0.570740575 0.029540552
CRD -0.78825397 0.364461375 -2.162791518 0.034486362 -1.517039531 -0.059468409
ITD -0.309872107 0.398069254 -0.778437681 0.439320218 -1.105860776 0.486116562
FOREIGN DIRECT INVESTMENT INTO THE WESTERN BALKANS: THE STATISTICAL ANALYSIS OF DETERMINANTS IN BILATERAL INVESTMENT
22 / 27
Country aggregated – Macedonia
Country aggregated – Montenegro
Regression Statistics
Multiple R 0.91257472
R Square 0.832792619
Adjusted R Square 0.815580095
Standard Error 0.78106805
Observations 76
ANOVA
df SS MS F Significance F
Regression 7 206.6179666 29.51685238 48.3829447 5.75031E-24
Residual 68 41.48457631 0.610067299
Total 75 248.1025429
Coefficients Standard Error t Stat P-value Lower 95% Upper 95%
Intercept -105.6416143 18.46656464 -5.72069664 2.5976E-07 -142.4910703 -68.79215829
GDP(i) 6.237276287 0.807357123 7.725548096 6.90352E-11 4.626220231 7.848332344
GDP(j) -0.325213557 0.103955242 -3.128399784 0.002587878 -0.532653013 -0.117774101
DIS -3.354917038 0.458288768 -7.320530799 3.7428E-10 -4.269418035 -2.440416041
ODA 0.217981338 0.084630141 2.575693904 0.012182011 0.049104521 0.386858155
EMI -0.09402507 0.077013923 -1.220884033 0.226346396 -0.247703961 0.059653822
CRD -0.143379701 0.6040505 -0.237363765 0.813088286 -1.348743707 1.061984305
ITD 0.506015196 0.497440947 1.017236717 0.312646535 -0.48661276 1.498643152
Regression Statistics
Multiple R 0.869502274
R Square 0.756034204
Adjusted R Square 0.600783243
Standard Error 0.189623368
Observations 19
ANOVA
df SS MS F Significance F
Regression 7 1.2257133 0.1751019 4.869755388 0.010123677
Residual 11 0.395527238 0.035957022
Total 18 1.621240538
Coefficients Standard Error t Stat P-value Lower 95% Upper 95%
Intercept -73.13568659 26.13889177 -2.797964322 0.017337785 -130.6669995 -15.60437371
GDP(i) 3.426925218 1.187958095 2.884718943 0.014845433 0.812247081 6.041603355
GDP(j) -1.361222321 0.422490501 -3.221900416 0.008131532 -2.291117645 -0.431326998
DIS 5.928567645 1.692286431 3.503288532 0.004941608 2.203870324 9.653264966
ODA -0.18141131 0.060563364 -2.995396852 0.012179636 -0.314710376 -0.048112245
EMI -0.205674319 0.065426548 -3.143591167 0.009348365 -0.34967718 -0.061671457
CRD 0 0 65535 #NUM! 0 0
ITD 0 0 65535 #NUM! 0 0

FOREIGN DIRECT INVESTMENT INTO THE WESTERN BALKANS: THE STATISTICAL ANALYSIS OF DETERMINANTS IN BILATERAL INVESTMENT
23 / 27
Country aggregated – Serbia
Country aggregated – Slovenia
Regression Statistics
Multiple R 0.906788637
R Square 0.822265632
Adjusted R Square 0.753146711
Standard Error 0.306772081
Observations 26
ANOVA
df SS MS F Significance F
Regression 7 7.83691064 1.119558663 11.89638991 1.2998E-05
Residual 18 1.693963974 0.09410911
Total 25 9.530874613
Coefficients Standard Error t Stat P-value Lower 95% Upper 95%
Intercept -98.35264898 66.36994901 -1.481885257 0.155665921 -237.7907377 41.08543972
GDP(i) 4.386842139 2.804596386 1.56416166 0.135190102 -1.505396224 10.2790805
GDP(j) -0.371784856 0.158239653 -2.349505004 0.030411166 -0.704234031 -0.039335682
DIS 1.562187041 0.311592863 5.013552067 9.01587E-05 0.907554728 2.216819354
ODA -0.050073963 0.120123696 -0.41685333 0.681714762 -0.302444484 0.202296558
EMI -0.012169303 0.065503677 -0.185780457 0.854694455 -0.149787421 0.125448815
CRD 0 0 65535 #NUM! 0 0
ITD -0.43126778 0.178158922 -2.420691458 #NUM! -0.805565785 -0.056969775
Regression Statistics
Multiple R 0.989268984
R Square 0.978653124
Adjusted R Square 0.972675998
Standard Error 0.345262114
Observations 33
ANOVA
df SS MS F Significance F
Regression 7 136.6256719 19.51795313 163.7330756 2.86283E-19
Residual 25 2.980148186 0.119205927
Total 32 139.6058201
Coefficients Standard Error t Stat P-value Lower 95% Upper 95%
Intercept -100.5875204 84.22055497 -1.194334571 0.243556229 -274.0430003 72.86795949
GDP(i) 5.104297299 1.228979298 4.153281759 0.000333927 2.573167055 7.635427543
GDP(j) -0.164955935 1.633861459 -0.100960785 0.920386941 -3.5299566 3.20004473
DIS -2.149570307 9.023518381 -0.238218643 0.81365326 -20.7338543 16.43471368
ODA 0.478911324 0.155144976 3.086863246 0.004896114 0.159384265 0.798438383
EMI 0.624723968 0.174164017 3.586986448 0.001418615 0.266026461 0.983421475
CRD 1.699380048 1.933782425 0.878785548 0.387886131 -2.28331941 5.682079505
ITD -0.020883149 0.293167824 -0.071232744 0.943779314 -0.624673585 0.582907288
FOREIGN DIRECT INVESTMENT INTO THE WESTERN BALKANS: THE STATISTICAL ANALYSIS OF DETERMINANTS IN BILATERAL INVESTMENT
24 / 27
Country aggregated – Austria
Country aggregated – France
Regression Statistics
Multiple R 0.982893813
R Square 0.966080248
Adjusted R Square 0.960918547
Standard Error 0.345225286
Observations 54
ANOVA
df SS MS F Significance F
Regression 7 156.1433773 22.30619676 187.1631443 1.33816E-31
Residual 46 5.482302912 0.119180498
Total 53 161.6256802
Coefficients Standard Error t Stat P-value Lower 95% Upper 95%
Intercept -375.1414738 23.43607378 -16.00701027 1.98745E-20 -422.3158435 -327.967104
GDP(i) 2.971367496 0.7816923 3.801198371 0.000421892 1.397902506 4.544832485
GDP(j) 10.88049256 1.408175807 7.726657785 7.50093E-10 8.045981678 13.71500345
DIS 3.441764057 1.655038477 2.079567397 0.043166286 0.110344391 6.773183723
ODA 0.097868492 0.155451051 0.629577548 0.532085708 -0.215038245 0.410775229
EMI 0.600355179 0.17313483 3.467558657 0.001150217 0.251852842 0.948857517
CRD 0.871293903 0.912653321 0.954682225 0.344728692 -0.965781951 2.708369757
ITD 0.0588785 0.186937755 0.314963129 0.754213983 -0.317407683 0.435164684
Regression Statistics
Multiple R 0.806113063
R Square 0.649818271
Adjusted R Square 0.61917737
Standard Error 1.37126159
Observations 88
ANOVA
df SS MS F Significance F
Regression 7 279.1444803 39.87778291 21.20754428 7.04622E-16
Residual 80 150.4286678 1.880358347
Total 87 429.5731481
Coefficients Standard Error t Stat P-value Lower 95% Upper 95%
Intercept -35.02252964 82.63675947 -0.42381296 0.672839604 -199.4749219 129.4298626
GDP(i) -2.582116554 1.07732602 -2.396782874 0.018872141 -4.726063659 -0.438169449
GDP(j) 9.177597146 2.248329308 4.081963045 0.000105087 4.703279232 13.65191506
DIS -22.75653878 3.807272573 -5.97712361 6.01815E-08 -30.33325266 -15.1798249
ODA 0.722909058 0.243894027 2.964029368 0.00399909 0.237544477 1.208273639
EMI 0.83807823 0.467568358 1.792418619 0.07684634 -0.092412456 1.768568916
CRD -2.543483815 1.423676497 -1.786560234 0.077797014 -5.376690336 0.289722705
ITD 1.737524674 0.620536069 2.800038161 0.006403185 0.502618541 2.972430807

FOREIGN DIRECT INVESTMENT INTO THE WESTERN BALKANS: THE STATISTICAL ANALYSIS OF DETERMINANTS IN BILATERAL INVESTMENT
25 / 27
Country aggregated – Germany
Country aggregated – Greece
Regression Statistics
Multiple R 0.957680783
R Square 0.917152483
Adjusted R Square 0.907645391
Standard Error 0.500979782
Observations 69
ANOVA
df SS MS F Significance F
Regression 7 169.4853958 24.2121994 96.47034768 1.46644E-30
Residual 61 15.30982523 0.250980742
Total 68 184.795221
Coefficients Standard Error t Stat P-value Lower 95% Upper 95%
Intercept -195.5265032 33.06738826 -5.91297086 1.63603E-07 -261.6488326 -129.4041737
GDP(i) 0.872765464 0.225262498 3.874437467 0.000263581 0.422325259 1.323205669
GDP(j) 7.195481242 1.400349594 5.138346362 3.08167E-06 4.395309167 9.995653318
DIS -3.956317903 0.970470131 -4.076702391 0.000134327 -5.896892865 -2.015742941
ODA 0.241903152 0.085620138 2.825306727 0.006375488 0.070695104 0.413111199
EMI 0.160281437 0.092635889 1.730230457 0.088645842 -0.024955472 0.345518345
CRD 0 0 65535 #NUM! 0 0
ITD 0.203662004 0.196344582 1.037268263 #NUM! -0.188953254 0.596277261
Regression Statistics
Multiple R 0.966577248
R Square 0.934271577
Adjusted R Square 0.92183647
Standard Error 0.599050762
Observations 45
ANOVA
df SS MS F Significance F
Regression 7 188.7334589 26.96192269 75.13176812 6.34518E-20
Residual 37 13.27788717 0.358861815
Total 44 202.011346
Coefficients Standard Error t Stat P-value Lower 95% Upper 95%
Intercept -146.7065004 24.25365023 -6.048842093 5.39193E-07 -195.8490637 -97.56393711
GDP(i) 3.53594968 0.759333752 4.65664758 4.05335E-05 1.997393354 5.074506006
GDP(j) 4.023092886 1.083165303 3.714200295 0.000669673 1.828391514 6.217794259
DIS -6.140538767 1.756176969 -3.496537578 0.001243142 -9.698891306 -2.582186228
ODA 0.240850857 0.112650923 2.138028255 0.039185506 0.012598405 0.469103309
EMI 0.30011993 0.150266595 1.997249821 0.053192029 -0.004349112 0.604588972
CRD 5.711476116 1.026903203 5.561844682 2.46245E-06 3.630772586 7.792179645
ITD 1.763721815 1.051285853 1.677680538 0.101838608 -0.366385656 3.893829287

FOREIGN DIRECT INVESTMENT INTO THE WESTERN BALKANS: THE STATISTICAL ANALYSIS OF DETERMINANTS IN BILATERAL INVESTMENT
26 / 27
Country aggregated – Hungary
Country aggregated – Italy
Regression Statistics
Multiple R 0.762394806
R Square 0.581245841
Adjusted R Square 0.48016725
Standard Error 2.476482192
Observations 37
ANOVA
df SS MS F Significance F
Regression 7 246.8704682 35.26720974 5.750434778 0.000305293
Residual 29 177.8559573 6.132964046
Total 36 424.7264255
Coefficients Standard Error t Stat P-value Lower 95% Upper 95%
Intercept -152.8168484 237.7338276 -0.642806495 0.525399843 -639.0371196 333.4034227
GDP(i) -7.937494108 3.322115003 -2.389289384 0.023604928 -14.73198219 -1.143006029
GDP(j) 16.62561696 8.593804007 1.934605088 0.06284779 -0.950685735 34.20191965
DIS -14.15728444 4.82614242 -2.933457657 0.006487843 -24.02785397 -4.286714903
ODA 0.088196994 0.5508915 0.160098665 0.873913311 -1.038502631 1.214896619
EMI 0.465788076 0.34880454 1.335384214 0.192138322 -0.247597308 1.17917346
CRD 7.192526765 3.270561041 2.199172153 0.035991475 0.503478378 13.88157515
ITD 6.346754878 4.504991353 1.408827316 0.169518746 -2.866986975 15.56049673
Regression Statistics
Multiple R 0.988228596
R Square 0.976595759
Adjusted R Square 0.963993475
Standard Error 0.354031518
Observations 21
ANOVA
df SS MS F Significance F
Regression 7 67.99038163 9.712911661 77.49355477 1.39388E-09
Residual 13 1.629398109 0.125338316
Total 20 69.61977974
Coefficients Standard Error t Stat P-value Lower 95% Upper 95%
Intercept -302.1922667 121.7574891 -2.481919338 0.027510401 -565.2333298 -39.1512036
GDP(i) 14.75554244 2.188247344 6.743087101 1.3768E-05 10.02812146 19.48296341
GDP(j) -3.482656132 3.480035003 -1.00075319 0.33521049 -11.00081468 4.035502413
DIS 11.00314639 1.707546224 6.443835156 2.18749E-05 7.314217045 14.69207573
ODA -0.0547954 0.089734124 -0.610641726 0.55196379 -0.248654189 0.139063388
EMI -0.538304164 0.374296439 -1.438176023 0.174020147 -1.346922459 0.270314131
CRD 0 0 65535 #NUM! 0 0
ITD 0 0 65535 #NUM! 0 0

FOREIGN DIRECT INVESTMENT INTO THE WESTERN BALKANS: THE STATISTICAL ANALYSIS OF DETERMINANTS IN BILATERAL INVESTMENT
27 / 27
Country aggregated – Netherlands
Country aggregated – Slovenia
Regression Statistics
Multiple R 0.876157631
R Square 0.767652194
Adjusted R Square 0.440202926
Standard Error 0.226068543
Observations 17
ANOVA
df SS MS F Significance F
Regression 7 2.026223926 0.289460561 9.911677788 0.001334466
Residual 12 0.613283836 0.051106986
Total 19 2.639507762
Coefficients Standard Error t Stat P-value Lower 95% Upper 95%
Intercept -17.13568772 55.9113143 -0.306479787 0.764491956 -138.9559766 104.6846012
GDP(i) -0.290106352 0.861262954 -0.336838303 0.742056619 -2.166637126 1.586424422
GDP(j) 0.893840473 2.160575324 0.413704842 0.68638814 -3.813648762 5.601329709
DIS 0 0 65535 #NUM! 0 0
ODA -0.007685183 0.066759848 -0.115116837 #NUM! -0.153142396 0.137772031
EMI 0.693546624 0.589375725 1.17674786 0.262111148 -0.590592768 1.977686016
CRD 0 0 65535 #NUM! 0 0
ITD 0 0 65535 #NUM! 0 0
Regression Statistics
Multiple R 0.970594799
R Square 0.942054264
Adjusted R Square 0.930787038
Standard Error 0.301476709
Observations 44
ANOVA
df SS MS F Significance F
Regression 7 53.19422321 7.599174745 83.61013031 2.45372E-20
Residual 36 3.271975415 0.090888206
Total 43 56.46619863
Coefficients Standard Error t Stat P-value Lower 95% Upper 95%
Intercept 30.68927977 18.83892325 1.629035766 0.112026347 -7.517827452 68.896387
GDP(i) 0.260790961 0.087288689 2.987683331 0.005036765 0.083761295 0.437820628
GDP(j) -1.605518178 0.805100547 -1.994183438 0.05374829 -3.238337768 0.027301413
DIS 1.204953651 0.343118462 3.511771547 0.001218254 0.509077157 1.900830145
ODA 0.076664658 0.096526776 0.79423204 0.432265014 -0.119100717 0.272430034
EMI 0.688494508 0.059140496 11.64167625 9.21138E-14 0.568552023 0.808436994
CRD 2.616426893 0.569807043 4.591777034 5.19281E-05 1.460804648 3.772049138
ITD -1.137919269 0.117525718 -9.682300116 1.46134E-11 -1.376272472 -0.899566066