foreign direct investment in regional integration ... 419-444.pdf · foreign direct investment in...
TRANSCRIPT

European Journal of Sustainable Development (2012), 1, 3, 419-444 ISSN: 2239-5938
| 1 FSEG, University of Yaounde II, Cameroon Po.box: 12557 Yaounde, Tel : (237)99849252 E-mail : [email protected]
Foreign Direct Investment in Regional Integration: Comparative Attractiveness in the CEMAC and UEMOA Economic Spaces By Elie Ngongang, Ph.D Abstract:
The competition or complementarity of foreign direct investment (FDI) attractiveness between economically similar regions located in the same continent has not yet been up to now sufficiently explored in the literature. The purpose of this paper is consequently to contribute to this literature by determining whether or not there exists a long-term relationship between FDI flows in the CEMAC and UEMOA regions of Central and West Africa. This hypothesis is tested in both economic spaces using a Vector Autoregression (VAR) model. The study shows that the FDI flowing in the UEMOA zone directly attracts FDI flows in the CEMAC zone. These inflows improve the business environment in both regions. Overall, the study however finds that the long-term relationship which exists between these two regions is inclined to be more competitive rather than complementary.
Key words: Foreign direct investment, attractiveness, integration, CEMAC, UEMOA. Résumé: La concurrence ou la complémentarité d’attractivité des IDE entre les régions économiquement proches et situées dans un continent n’est pas suffisamment explorée. L’objectif de ce papier est de déterminer l’existence d’une relation de long terme entre les IDE de l’espace CEMAC et les IDE de l’espace UEMOA. Cette hypothèse est testée dans les deux espaces à l’aide d’un modèle VAR. Nous montrons que les flux d’IDE entrant en zone UEMOA attirent de façon direct les IDE en zone CEMAC. Ces flux améliorent l’environnement des affaires dans les deux espaces. D’une manière générale, il existe entre les deux espaces une relation de long terme plutôt concurrentielle.

420 European Journal of Sustainable Development (2012), 1, 3, 419-444
Mots clés : Investissements directs étrangers, attractivité, intégration, CEMAC, UEMOA. JEL: F59, F23, F21 Introduction From a theoretical point of view, and from the history of facts and economic thought, the explanation of the location of foreign direct investment (FDI) flows in a zone, a region or a given country have been the subject of numerous (political, economic, cultural, etc.) debates and research studies. However, this research theme has not been sufficiently explored in some Sub-Saharan African regions such as in the UEMOA and CEMAC countries. Moreover, the unification of a theoretical framework and of homogenous and comparable empirical results still remains difficult to carry out. In his works, Blonigen (2005) explains this location through two problems and two methodological approaches: microeconomic models which attempt to explain the decision of an entreprise to locate and produce abroad rather than to export, and macroeconomic models which identify the explanatory factors linked to the the choice of location and the volumes of FDI received by an economy or a region. This second option favours the question of the attractiveness of economic spaces or zones, whose literature provides a list of various elements which are industrial (1), commercial (2), as well as institutional (3), to justify FDI flows in a given country or region. On the level of facts, we note that there exist three determinants that may lead an enterprise to internalize through FDI, namely: (1) according to Nicet-Chenaf and Rougier (2007), to find new outlets (horizontal FDI) (2) to produce at optimal costs (vertical FDI); and (3), according to Markussen (1996), for a combination of the two preceding options (i.e. to produce and to sell or the « Knowledge capital model »). Bloningen (2005) finds a fourth determinant of platform FDI with the objective of setting up a stage in a transnational production-assembly network, and hence of intra-enterprises trade. According to the traditional view of foreign trade (Mundell, 1967), location , the mobility of capital are subdivided into exports, the mobility of goods, insofar as the enterprise intends to get around tariff barriers (tariff jumping investments); location reduces transaction and transport costs, and for that reason, gets very close to demand. However, for many authors (most particularly Braimard, 1993, 1997; Markussen, 1995; Markussen et al, 1996; Matha, 2000; Nicet-Chenaf and Rougier, 2007) according to the new geographic economics, an enterprise willing to achieve scale economies in its region of origin may hesitate between a concentration of production in its region of origin and a search for the proximity of consumers, and for that reason, opt in favour of locating abroad.

E. Ngongang 421
© 2012 The Authors. Journal Compilation © 2012 European Center of Sustainable Development. Published by ECSDEV, Via dei Fiori, 34, 00172, Rome, Italy
In the case of North-South types of investments which may be qualified as vertical FDIs, differences in terms of natural resources (Dunning, 1993), factor endowments, labour costs, and qualifications of the workforce are, according to (Helpmann, 1984, Wheeler and Mody, 1992, Culem, 1988) at the centre of the analysis. Yeaple (2003), Hansen et al (2003), Feinberg and Keene (2001), and Nicet-Chenaf and Rougier (2007), show that vertical FDIs are significant in the sectors of mechanical and electronic industries. In this respect, studies carried out in this area make comparisons between the characteristics of the country of origin and those of the host country, with a view to determine the costs and benefits of locating abroad. The ownership, location, and internalization (OLI) paradigm in a study by Dunning (1993) is an attempt to take a census of the various combinations of benefits which may cause an enterprise to locate abroad and to choose a particular country as a location site. The comparisons made in these studies are measured in terms of differentials in factor endowments, labour qualifications, salaries, as well as transport and transaction costs between the country of origin and the host country. However, in a sequential plan or outline of a given enterprise, when the decision to locate abroad has been taken, the question then arises as to which host country should be chosen. Thus, our research issue boils down to the choice of location once the FDI decision is taken by the firm. Now, there exist several possible choices of location, which depend on the conjunction of both the objectives of the firm and the characteristics peculiar to the host country targeted in comparison with a host country or zone. Therefore, the choice of location is not carried out in an absolute manner. It is made after comparing different potential zones that are candidates for location. This comparative analysis thus makes it possible for the firm to choose within a finite panel the country, the zone or the region which provides the best quality. Qualities are assessed relative to other candidates in terms of labour costs (Wheeler and Mody, 1992; Culem, 1988), the training of the workforce (Helpman, 1984), the quality of infrastructures (Wheeler et Mody, 1992; Asiedu, 2002), political stability and the quality of institutions (Wei, 2000a , 2000b), fiscal policy (Hartman 1984, 1985), the performance of the banking system, the control of capital movements, the stability of exchange rates (Froot and Stein, 1991; Steven, 1998; Klein and Rosengren, 1994) or relative to the specific practice of a language or the existence of historical relationships. The evaluation of the attractiveness of an economic space also poses problems linked to the large number of variables that must be taken into consideration. The theoretical and empirical studies, notably those of Loewendahlt and Ertugal- Loewendahlt (2001), which were revisited by Bloningen (2005), Nicet-Chenaf and Rougier (2007) list several determinants of location, most of which are classified

422 European Journal of Sustainable Development (2012), 1, 3, 419-444
as economic, political, institutional, and incentive determinants. Among the many attractivenesses of a country, Lim (2001), as well as Basu and Srinivasan (2002) show the importance of traditional factors such as the dimension of the market and wage costs or agglomeration effects, while Blonigen (2005) highlights the importance of exchange rates, tax levies, institutions, and factors linked to trade obstacles such transport, transaction costs, etc. Thus, a foreign direct investment is defined as an international capital flow motivated by the acquisition of an enterprise abroad (repurchase of structure, ex nihilo creation, etc.) or equity participation higher than the conventional 10%. An FDI must in principle have a stable nature, and the person who carries it out must take part in the decisions of the enterprise, while attractiveness is the capacity of a territory (country, region, and city) to attract foreign operators (enterprises, investors, etc.). The attractiveness of a zone depends on its stability, its taxation system, the dynamism of its demand, the characteristics of its available workforce, the quality of its infrastructures, etc…, the intensification of the globalization process poses the problem of the attractiveness of national and regional sites with more acuity. Two major questions emerge from the above presentation, namely:
‐ How can the attractiveness of zones or regions be explained? ‐ Are the CEMAC and UEMOA zones attractive together or separately?
We may envisage several approaches for answering these questions. A possible approach may consist in attempting to find, as in the studies carried out by the UN Conference on Trade and Development (UNCTAD), all the determinants of FDI inflows in regional economic spaces. However interesting it may be, this approach has one drawback, for it restricts the FDIs to be classified as a good or bad student country, region, or space. In sequential logic or reasoning, it is plausible to wonder about the potential competition exerted by the UEMOA with regard to locations in the CEMAC zone. The complementary question is that of a potential regional attractiveness which would direct FDI flows towards complementary and non substitutable spaces. Does the level of FDI inflows in UEMOA contribute to the improvement of the business climate in its own zone and for that matter in the CEMAC zone? In this scenario, a positive relationship between these two FDI flows must be observed. Firstly, the existence of a long-term relationship between the CEMAC FDI and the UEMOA FDI must be tested, and then the direction of this relationship must be determined. It is opportune to determine the direction of causality (in Granger’s (1969) sense) of the CEMAC FDI and the UEMOA FDI.

E. Ngongang 423
© 2012 The Authors. Journal Compilation © 2012 European Center of Sustainable Development. Published by ECSDEV, Via dei Fiori, 34, 00172, Rome, Italy
It is for this reason that it is appropriate to test the hypothesis of the existence of a relationship between the FDIs of both spaces, and to examine, firstly, the FDIs and the attractiveness policies in the CEMAC and UEMOA spaces, and secondly, to analyze the interdependence relationship between the FDI of the CEMAC space and the FDI of the UEMOA space. 1. FDI and Attractiveness Policies in the CEMAC and UEMOA Spaces After presenting the characteristics of the FDIs of both spaces, we will deal with the attractiveness and incentive policies of the two zones. 1.1. Characteristics of FDI in the CEMAC and UEMOA Spaces
Investment is a support activity for recipient nations which thoroughly focus on the search for economic gain through costs and benefits. In Sub-Saharan African (SSA) countries, attempts at reforms were made in 1980 to attract foreign capital. But it was not until the 1990-1994 period that a second wave of reforms of Investment Codes was carried of under the guidance of financial backers, and foreign investments began to soar. The evolution of FDI in SSA countries is illustrated by the data published by regional and national institutes of statistics. In fact, the volumes of FDI inflows received by CEMAC and UEMOA countries are generally low, of a vertical nature, and targeted at particular attractive sectors. Only a few countries such as Cameroon, the Congo, Gabon, and Equatorial Guinea in the CEMAC zone, and Côte d’Ivoire, Benin, and Senegal in the UEMOA zone, attract significant amounts of foreign direct investment. Thus, among CEMAC and UEMOA countries, Cameroon accounted for 12 % the FDI stock in 2006 versus 17% for Equatorial Guinea, 10% for the Congo, less than 9 % for Gabon, Benin, and Senegal, and 15 % for Côte d’Ivoire. In terms of flows, the world’s share of the two zones fell back in 2007 to its 1999 level with 10 billion dollars, against 7.8 billion in 2004, and 13.3 billion in 2002. Despite this evolution which goes up and down, we note a slight acceleration of FDI inflows in the CEMAC and UEMOA spaces which are now highlighted below (See, Figure 2). 1.1.1. FDI Inflows in the CEMAC Space Generally speaking, the FDI flows towards the CEMAC zone have witnessed a significant increase since 1998, and they are highly conditioned by the logic of privatisations, infrastructure investment plans, and telecommunications (for example, in this sector we mention enterprises such as Orange and MTN in Central Africa), etc. These FDI flows increased from 9 billion dollars in 2005 to 9.9 billion dollars in 2006, which in fact for the Banque des Etats de l’Afrique

424 European Journal of Sustainable Development (2012), 1, 3, 419-444
Centrale (BEAC, 2006) represents an significant evolution, insofar as the privatization of part of the telecommunications sector since the year 2002, has made it possible to attract a considerable volume of funds. However, the year 2004 enabled CEMAC zone countries, thanks to important merger-acquisition operations, to achieve an FDI level almost equivalent to that of the year 2000, with an FDI amount of 6.8 billion dollars (BEAC, 2003) which ranks the zone at the 9th place among the beneficiaries of FDI in Africa. The year 2004 appears to be the pivotal year for the CEMAC zone. It permitted merger and acquisitions in the zone worth about 1.2 billion dollars, whereas the UEMOA zone attracted a slightly lower FDI volume amounting 1.07 billion dollars during the same year. The evolution of FDI inflows in the CEMAC zone seems to be stable (see Figure 1). Figure 1: FDI Inflows in the CEMAC 1985 to 2010 (Billions of dollars).
Sources: BEAC Synthesis Statistics 1985-2011 Figure 2: Inflows of FDI in the CEMAC and UEMOA space from 1985 to 2010 (Billions of dollars).
0
2
4
6
8
10
12
Inflow FDI CEMAC

E. Ngongang 425
© 2012 The Authors. Journal Compilation © 2012 European Center of Sustainable Development. Published by ECSDEV, Via dei Fiori, 34, 00172, Rome, Italy
Sources: BCEAO and BEAC Synthesis Statistics 1985-2011 1.1.2. FDI Inflows in the UEMOA Space The FDI inflows in the UEMOA space witnessed a rather unstable evolution. These FDIs are nonetheless linked to the medium and long-term strategies of the firms, with sufficiently higher average levels than in the CEMAC zone, in spite of the situation in the last five years which may be explained by political instability in Côte d’Ivoire. However, the FDI inflows recorded in the UEMOA zone were, in 1999, the highest since 1985 and almost three times as much as the amount recorded in 2002 (see Figure 2 and 3). In the UEMOA zone, the FDI stock witnessed an increase of more than 6.5 % from 2001 to 2003 (BCEAO, 2003).
0
2
4
6
8
10
12
Outflow FDI CEMACInflow FDI CEMAC
Outflow FDI UEMOA
426 European Journal of Sustainable Development (2012), 1, 3, 419-444
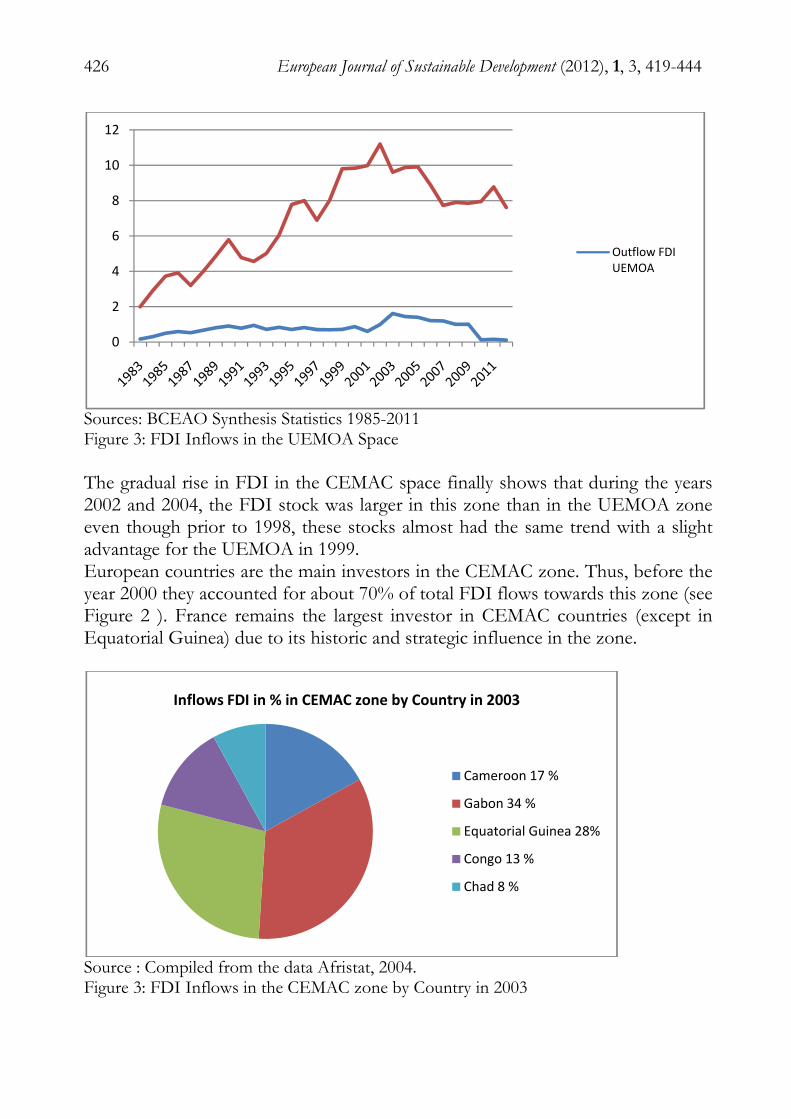
Sources: BCEAO Synthesis Statistics 1985-2011 Figure 3: FDI Inflows in the UEMOA Space The gradual rise in FDI in the CEMAC space finally shows that during the years 2002 and 2004, the FDI stock was larger in this zone than in the UEMOA zone even though prior to 1998, these stocks almost had the same trend with a slight advantage for the UEMOA in 1999. European countries are the main investors in the CEMAC zone. Thus, before the year 2000 they accounted for about 70% of total FDI flows towards this zone (see Figure 2 ). France remains the largest investor in CEMAC countries (except in Equatorial Guinea) due to its historic and strategic influence in the zone.
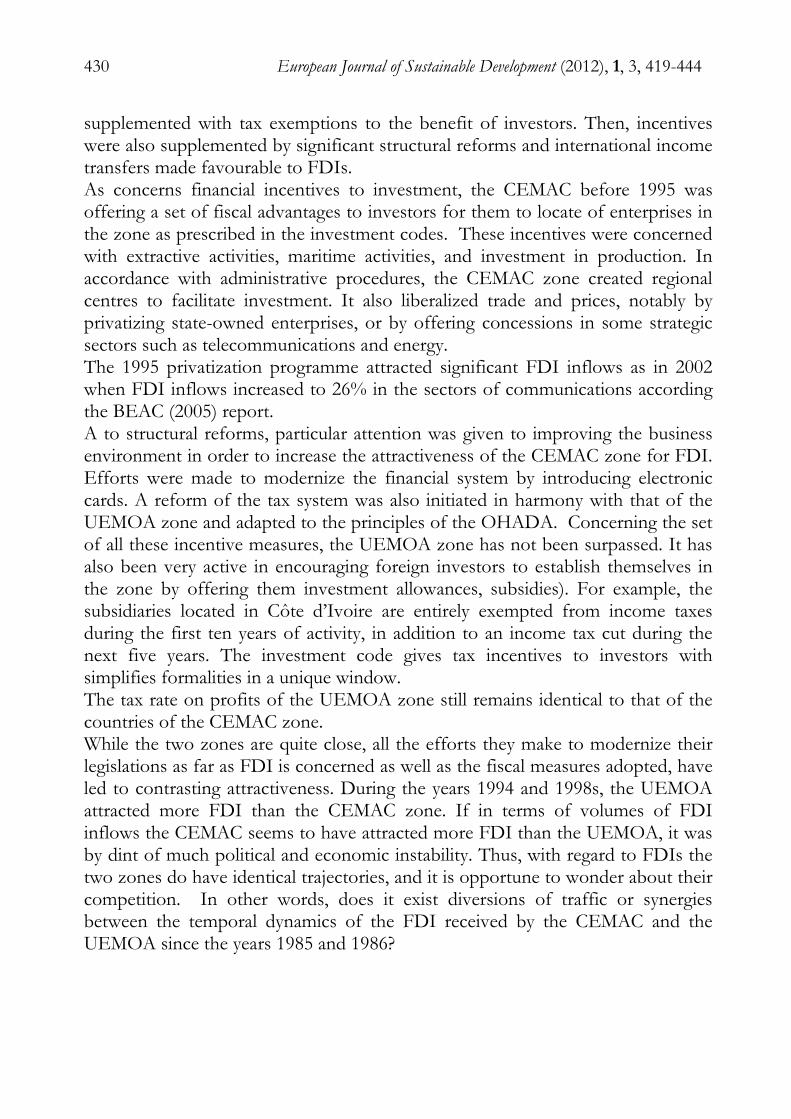
Source : Compiled from the data Afristat, 2004. Figure 3: FDI Inflows in the CEMAC zone by Country in 2003
0
2
4
6
8
10
12
Outflow FDI UEMOA
Inflows FDI in % in CEMAC zone by Country in 2003
Cameroon 17 %
Gabon 34 %
Equatorial Guinea 28%
Congo 13 %
Chad 8 %

E. Ngongang 427
© 2012 The Authors. Journal Compilation © 2012 European Center of Sustainable Development. Published by ECSDEV, Via dei Fiori, 34, 00172, Rome, Italy
European countries also remain the main source of FDI flows in the UEMOA zone, where they represent about 74% of FDI in the zone in 2002 (see Figure 4). France naturally remains the major investor in the zone. The primary and secondary sectors account for significant shares of FDI in the zone. A special feature of the CEMAC and UEMOA spaces (Table 1) is that the tertiary sector has absorbed 80 % of the total FDI contribution to the these zones between 2000 and 2003, and about 75% since 2006. The services which absorb the most FDI inflows are telecommunications (79% of the total inflows in 2002) and property (23% of total inflows in 2003). At the same time, FDI in industry fell from 28 % of total capital inflows in 1998 to 9% in 2007 in the UEMOA zone (BCEAO, 2007), and from 39% in 2000 to 24% in 2008 in the CEMAC zone (BEAC, 2008). In addition, these two zones are not in the logic of platform FDI or even in the vertical FDI logic, but rather in the logic of horizontal FDI-market logic (i.e. to find new outlets). Therefore, these FDIs do not enable the CEMAC and UEMOA countries to get into a passive or active trade of improvement as in European countries where FDIs are directed towards high value added industries (Nicet-Chenaf and Rougier, 2007). Table 1: FDI Inflows by Industry in 2004 (millions of dollars)
Source : Compiled from the data Afristat, 2004. In the CEMAC zone, FDI flows are essentially supported by investment in oil exploitation activities (872 million dollars in 2005) and industrial sectors (318 million dollars in 2005). In contrast to the UEMOA zone, hotel business attracts less FDI in the CEMAC zone, its flows in this sector representing only 23 million dollars in 2005. Up to 2004, the major investors in these sectors were European companies, and mainly French ones. Equatorial Guinea is the only country in the
0
20
40
60
80
100
year
FDI by Industry in 2004 in % CEMAC
FDI by Industry in 2004 in % UEMOA

428 European Journal of Sustainable Development (2012), 1, 3, 419-444
CEMAC zone that still benefits from high rates of FDI inflows since the exploitation of its oil resources came on stream. Oil has played and continues to play a major role in the attractiveness of the CEMAC space. The Investment Code reform in the oil exploration activity in 2000 has brought greater flexibility to the States in retaining countries engaged in oil exploration. These remarks show that the CEMAC and UEMOA zones, which are not very close to each other geographically, are witnessing the development in their respective zones of location strategies which seem convergent, not only in the sectors the oil, the secondary and tertiary sectors, etc., but also in terms of the amounts and regularity of FDI flows, as well as in terms of investor countries. However, over the last 15 years both of these zones have developed attractiveness strategies which are somewhat homogenous. 1.2. Attractiveness and Incentive Policies in the CEMAC and UEMOA
Spaces.
The synthesis of the Work Bank reports from 2002 to 2010 on the CEMAC and UEMOA spaces (1), show low rates of economic growth in both of these spaces even though they are endowed with significant assets (access to a maritime coast, average country risk, etc.), and have put in place macroeconomic stabilization (price stabilization, reduction of the public debt, etc.), and quasi-harmonized structural reforms (harmonisation of the financial system, privatizations, reforms of education). This synthesis explains this situation through deficient economic policies, namely, a highly rigid labour market, a highly restrictive fiscal policy for investors and existing enterprises which hinders the recruitment of qualified young people, a fixed exchange rate regime which hampers international competitiveness, and a level of protection that still remains too high in the age of globalization. 1.2.1 FDI Attractiveness Policies in the CEMAC and UEMOA Space Several factors hamper the markets of these economic spaces such as information deficiencies which reduce the profitability of investments in activities that are highly news-intensive, coordination weaknesses between the public and private sector as well in professional and intermediary training. These weaknesses in professional training lead to a reduction in the average skills level of the workforce in enterprises. Programmes of economic policy management were put in place for the ten years or in the two zones with a view to respond to these deficiencies and to low rates of economic growth. It emerges from the summary of the BEAC (2007) and BCEAO (2006) reports that manufacturing activities

E. Ngongang 429
© 2012 The Authors. Journal Compilation © 2012 European Center of Sustainable Development. Published by ECSDEV, Via dei Fiori, 34, 00172, Rome, Italy
account for less than half the exports of the two zones, while they contribute only for about 14 % and 11.7% respectively to GDP formation in CEMAC and UEMOA countries. Exports are very concentrated in the food textiles and textiles industry, while the manufacturing sector is very fragmented and much less concentrated, a situation which curtails the potential gains linked to economies of scale and increasing internal returns. Since the spatial concentration of activities is generally very low in these zones, external scale economies are usually limited. The structure of exports today constitutes a serious obstacle to export growth. If we consider the level of income per head, the CEMAC actually has a level of performance largely inferior to what it should be in the context of Sub-Saharan Africa. According to the World Bank (2007), the weaknesses in productive diversification and competitiveness have their roots in the slowness of the structural transformation of the economies of the CEMAC and UEMOA zones. These weakness partially explains the fact that the CEMAC zone has struggled for a long time to attract capital inflows. Now, the hypothesis that we are now going to test is that of, everything being equal elsewhere, a weakness in the attractiveness of the CEMAC zone as far as FDI is concerned, owing to its proximity to the UEMOA zone which is its competitor. Several reasons attempt to explain the « modest» performances displayed by CEMAC zone countries in attracting FDI. First of all, we mention its small market size in the absence of genuine in-depth integration in this sub-region. Some authors such as FEMISE (2005), Nnicet-Chenaf and Rougier (2007)) cite a reform process concerning privatizations, restructurings, institutional and regulatory reforms, etc. which were not brought to completion, in addition to being poorly financed and assisted technically by investors. To this must be added the irreversible nature of reforms in the zone which does not benefit from the « long-term stability » that could be associated with reforms of adherence to investors for new members. According to the Word Bank (2006) report, the CEMAC zone is characterized by many administrative and judicial dysfunctions which still hamper investors. The CEMAC is still has very high customs duties (in the order of 25% for average duties, and 62% for maximum duties). Ant yet, the CEMAC and the UEMOA have worked hard for the last ten years or so to improve the attractiveness of the countries of their respective zones and to capture the financial (flows) needed for their growth. 1.2.2 FDI Incentive Measures in Both Spaces From the end of 1994 to the beginning of 1999, the CEMAC and the UEMOA initiated a campaign of «seduction » vis-à-vis foreign investors. This work was carried out through a series of reforms of investment codes, notably, of codes linked to industrial investment, mining investment, etc. This operation was
430 European Journal of Sustainable Development (2012), 1, 3, 419-444
supplemented with tax exemptions to the benefit of investors. Then, incentives were also supplemented by significant structural reforms and international income transfers made favourable to FDIs. As concerns financial incentives to investment, the CEMAC before 1995 was offering a set of fiscal advantages to investors for them to locate of enterprises in the zone as prescribed in the investment codes. These incentives were concerned with extractive activities, maritime activities, and investment in production. In accordance with administrative procedures, the CEMAC zone created regional centres to facilitate investment. It also liberalized trade and prices, notably by privatizing state-owned enterprises, or by offering concessions in some strategic sectors such as telecommunications and energy. The 1995 privatization programme attracted significant FDI inflows as in 2002 when FDI inflows increased to 26% in the sectors of communications according the BEAC (2005) report. A to structural reforms, particular attention was given to improving the business environment in order to increase the attractiveness of the CEMAC zone for FDI. Efforts were made to modernize the financial system by introducing electronic cards. A reform of the tax system was also initiated in harmony with that of the UEMOA zone and adapted to the principles of the OHADA. Concerning the set of all these incentive measures, the UEMOA zone has not been surpassed. It has also been very active in encouraging foreign investors to establish themselves in the zone by offering them investment allowances, subsidies). For example, the subsidiaries located in Côte d’Ivoire are entirely exempted from income taxes during the first ten years of activity, in addition to an income tax cut during the next five years. The investment code gives tax incentives to investors with simplifies formalities in a unique window. The tax rate on profits of the UEMOA zone still remains identical to that of the countries of the CEMAC zone. While the two zones are quite close, all the efforts they make to modernize their legislations as far as FDI is concerned as well as the fiscal measures adopted, have led to contrasting attractiveness. During the years 1994 and 1998s, the UEMOA attracted more FDI than the CEMAC zone. If in terms of volumes of FDI inflows the CEMAC seems to have attracted more FDI than the UEMOA, it was by dint of much political and economic instability. Thus, with regard to FDIs the two zones do have identical trajectories, and it is opportune to wonder about their competition. In other words, does it exist diversions of traffic or synergies between the temporal dynamics of the FDI received by the CEMAC and the UEMOA since the years 1985 and 1986?

E. Ngongang 431
© 2012 The Authors. Journal Compilation © 2012 European Center of Sustainable Development. Published by ECSDEV, Via dei Fiori, 34, 00172, Rome, Italy
2. Analysis of the Interdependence Relationship between the FDIs of the CEMAC and UEMOA Spaces We take inspiration from the approach used by Nicet-Chenaf and Rougier (2007). Using this empirical approach, our objective is to determine the state of nature of a relationship between the magnitudes of the CEMAC and UEMOA zones FDIs. In case this relationship exists, it will be opportune to test for its direction of causality in order to draw a conclusion on the existence of a complementarity or competition between these two economic spaces. 2.1 Empirical Study of the Interdepence Relationship Using a VAR Model Here we have chosen to test our hypothesis of the existence of a functional link between the FDI of CEMAC space and the FDI of the UEMOA space (i.e. the direction of causality is to be determined) in the framework of an autoregressive vector process (p) or VAR (p). In general, simultaneous equations are used to describe the existing relationships not only between different variables ),( xyt , but also between a set of exogenous variables ),( tt wz . From the structural approach we therefore test a system of the type:
⎪⎪
⎩
⎪⎪
⎨
⎧
+++++++++
+++++++=
+++++
+++++++++++=
−−−
−
−−
−−
tmstmstttkktthth
ttfttfttt
tststtlrr
tttqtqttptpttt
vwlwlwlzjzjzjyg
ygygxexexex
wdwdwdzc
zczcybybybxaxaxay
.........
...............................
.................
..............
22112211
221122112
2211
221122112111
α
ε
α
Where, the variable ty (and respectively tx ) is explained by the present or past values of the variables x (respectively y), z, and w, but also by information contained in the past values of y (respectively x) tε and tv are specification errors of the model. One of the problems of these simultaneous equations approaches is that economic theory is not rich enough to provide an adequate specification of the relationship existing between the different variables. Moreover, estimations predictions are complicated by the fact that endogenous variables may appear in both sides of the equation. Thus, all of these remarks have led authors such as Granger (1969) and Sims (1980) to criticize economic modelling with simultaneous equations (i.e. the structural approach) very strongly, owing essentially to its poor explanatory power. The VAR (p) processes, which are a generalization of the autoregressive (AR) processes, were proposed by Sims (1980) as an alternative to macroeconomic models of Keynesian inspiration, and they are characterized by two principal aspects. The first is the lack of distinction between endogenous and exogenous

432 European Journal of Sustainable Development (2012), 1, 3, 419-444
variables. Thus, this makes it possible in accordance with our objective, to perform a causality analysis between the variables of the model without making any prior theoretical assumption, save for the choice of the to be introduced in the analysis (as for instance, the FDIs of the two economic spaces considered in this study and the GDP of the CEMAC zone). The second aspect is the consideration in the analysis of the dynamics of the model, and hence of the different lags « p, q, s, f, h, k » which appear in the system of equations. Indeed, a lagged functional relationship between variables is always possible and may therefore be captured in the context of a VAR (p). It only remains to determine the number of lags to be introduced in the model. In general, a VAR (p) model may be specified as follows:
)1,(nZt =
)1,(n+α
)1,)(,(11
nnnZA t +−
+
)1,)(,( nnn
ZA ptp −
)1,(ntε+
)1( Where the canonical form of the model, by using the lags operator (L), becomes:
ttp
p ZLALAI εα +=−− ).....( 1 or ttZLA εα +=)( (2)
where )...()( 1p
p LALAILA −−−= , the matrix polynomial of lags and of tZ , the vector of explanatory variables which are the FDIs of the two spaces and the GDP of the CEMAC space; Zt is written as follows:
⎥⎥⎥
⎦
⎤
⎢⎢⎢
⎣
⎡=
t
t
t
t
PIBCEMACIDEUEMOAIDECEMAC
Z
From the above, once the conditions of stability, stationarity, and Model (2) validity (i.e. the length of lags tests) of the VAR (p) are established, Model (2) may be used to identify the relationships between the FDI in the CEMAC space, the FDI in the UEMOA space, and the GDP of the CEMAC space. The direction of causality between these two variables may then be tested by using the work of Granger (1969). In the present study, we have built our VAR(p) model with three variables, namely: the CEMAC space FDI inflows (IDECEMAC), the UEMOA space FDI inflows (IDEUEMOA), and the GDP per capita of the CEMAC space (PIBCEMAC). The variable PIBCEMAC is maintained in the analysis because it stands generally at the centre of empirical studies of this nature. It enables us to approximate the degree of attractiveness of a space in terms of dimension or

E. Ngongang 433
© 2012 The Authors. Journal Compilation © 2012 European Center of Sustainable Development. Published by ECSDEV, Via dei Fiori, 34, 00172, Rome, Italy
market size. For instance, it provides us with an idea on developments in the evolution and magnitude of the local market demand, as well as other factors. By introducing this variable in the model, we assume that high-income zones attract relatively more FDI in innovative and differentiated products and services. Following the example of Nicet-Chenaf and Rougier (2007), we have first determined the lags to be used in building our VAR (p). Then the Akaike, Schwarz, and Hannan-Quinn criteria indicate to us that it is optimal to retain only two lags (see Appendix 1). Thus, by using these two lags our model may be written as follows:
⎥⎥⎥
⎦
⎤
⎢⎢⎢
⎣
⎡
t
t
t
PIBCEMACIDEUEMOAIDECEMAC
=⎥⎥⎥
⎦
⎤
⎢⎢⎢
⎣
⎡
3
3
2
ααα
+⎥⎥⎥
⎦
⎤
⎢⎢⎢
⎣
⎡
987
654
321
aaaaaaaaa
⎥⎥⎥
⎦
⎤
⎢⎢⎢
⎣
⎡
−
−
−
1
1
1
t
t
t
PIBCEMACIDEUEMOAIDECEMAC
+⎥⎥⎥
⎦
⎤
⎢⎢⎢
⎣
⎡
987
654
321
bbbbbbbbb
.
⎥⎥⎥
⎦
⎤
⎢⎢⎢
⎣
⎡
−
−
−
2
2
2
t
t
t
PIBCEMACIDEUEMOAIDECEMAC
+⎥⎥⎥
⎦
⎤
⎢⎢⎢
⎣
⎡
3
3
2
εεε
Furthermore, the stability of the VAR (2) process has also been confirmed by the fact that all the values of the characteristics of pA are lower than 1. Thus, we may say that stability is confirmed (see Appendix 1). Since the VAR (2) is stable, we can say that there exists stable link between the variables of the model. Thus, these variables may be determined by the OLS regression or by the EMV (maximum likelihood estimation) estimation methods. This means that a shock which affects one or several time-series must have limited consequences. In addition, we cannot have an accumulation of past shocks, and the series cannot diverge from their long-term trend. This view is fundamental, for it says that if the variables remain dependent over time, a shock which affects one variable (for instance, a spontaneous rise in the FDI of the UEMOA) will have an impact on the other variable, but this latter impact will be limited over time since this variable will find its long-term equilibrium path again. The VAR (2) representation in Appendix (2) indicates the existence of a significant and positive relation between CEMAC’s FDIs for the previous period (t-1), and CEMAC’s FDIs for the period (t-2) ((t-statistic = 2.57 higher than 1.96)). We may explain this result through the fact that, by improving the business climate in the zone, the FDIs of previous periods contribute in attracting the FDIs of the current periods. However, our model also indicates that there exists a significant and positive relationship between CEMAC’s FDIs and UEMOA’s FDIs lagged one period (IDEUEMOA (-1)), the t-statistic here being equal to 2.41 (higher than 1.96). We

434 European Journal of Sustainable Development (2012), 1, 3, 419-444
can also say that UEMOA’s FDIs of one year will have a positive influence on CEMAC’s FDI flows in the following year. Thus, it is the past flows in the CEMAC zone as well as in the UEMOA zone which contribute in improving the investment prospects in the CEMAC zone. A major fact is that the CEMAC and UEMOA zones would both be attractive by being set in the case of the CEMAC. Generally speaking, and in this precise case, the FDIs of UEMOA do not seem to be a function of CEMAC’s FDIs, and neither do the FDIs of UEMOA lagged one or two periods (see Appendix 2). For a detailed analysis, we will check the existence of the long-term (equilibrium) relationship, namely the cointegrating relationship between our three variables. The results are given in Appendix 4. These results indicate that Johansen’s technique enables us here to determine two cointegrating relations (the trace test, and the maximum characteristics values test). These relations may be written in the following form: (1) IDECEMAC- 0.042273 PIB + 14.33421 IDEUEMOA = 0
(0.09011) (4.23154) Thus, (1) IDECEMAC= 0.042273 PIB - 14.33421 IDEUEMOA (0.09011) (4.23154) (2) PIB – 289.6871 IDEUEMOA = 0 (71.8832) For, (2) PIB = 289.6871 IDEUEMOA (71.8832) According to equation (1), CEMAC’s and UEMOA’s FDIs are cointegrated and are affected by a common trend which, however, acts in the opposite direction. For example, the coefficient of variable IDE-UEMOA, which is significantly different from zero (t-statistic = 4.23154), is in fact negative with a minus sign. In the long-term, there will probably exist some kind of competition between the CEMAC and the UEMOA FDIs. The elements of this competition are to be determined in the context of complementary analyses. Owing to the existence of a long-term relation between the FDIs CEMAC and UEMOA, and to the fact that these two variables are inversely affected by a trend, it is opportune and interesting to wonder about the direction of causality which exists between these variables. To do this, we will use causality in the sense of Ganger (1969), according to which the variable Xi causes the variable Yi, if it contains information which improves the prediction of Yi. In other words,

E. Ngongang 435
© 2012 The Authors. Journal Compilation © 2012 European Center of Sustainable Development. Published by ECSDEV, Via dei Fiori, 34, 00172, Rome, Italy
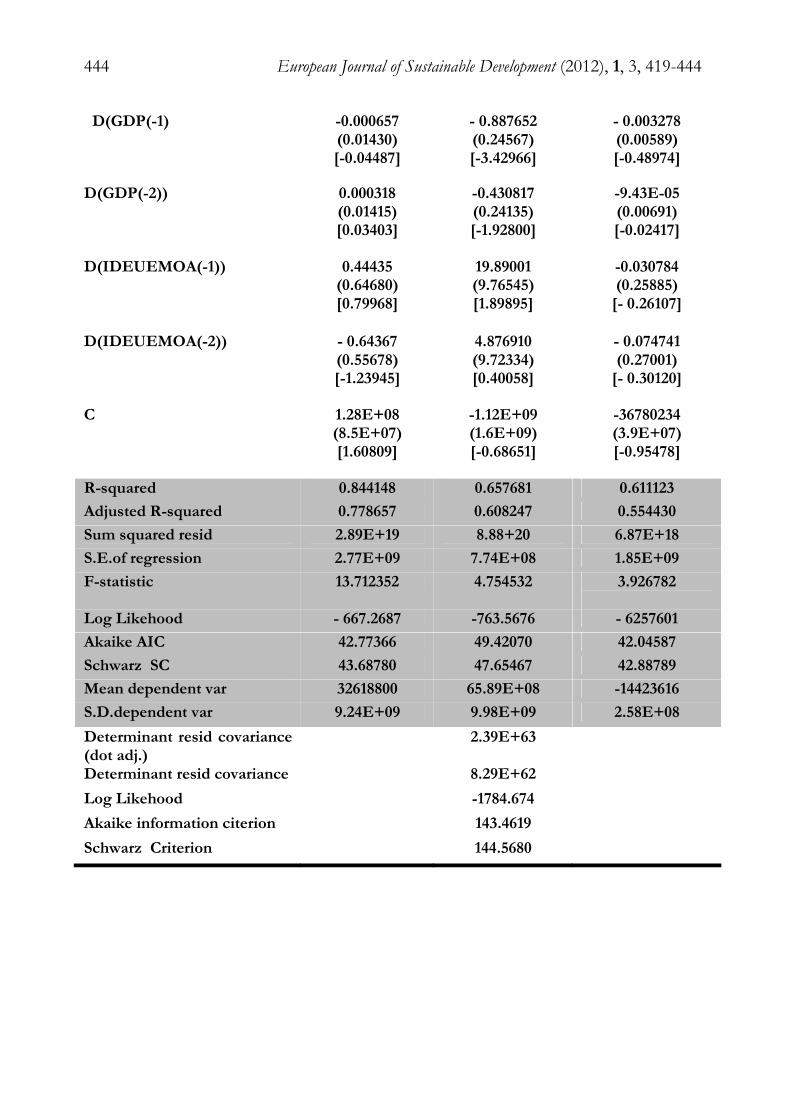
causality exists if the current value and past values of Xi provide a better explanation of Yi than the sole past values of Yi. The causality test in Ganger’s sense (see Appendix 4) in this case shows that UEMOA’s FDIs effectively « cause » CEMAC’s FDIs at the 10% significance level. Likewise, since it is possible to capture two equilibrium relations, one of them indicating to us that CEMAC’s FDIs are « caused » by UEMOA’s FDIs and evolve in the opposite direction, it also becomes relevant to wonder about the nature of the short-term relations bet between the two variables. Our task will then be to build a vector error correction (VEC) model. 2.2. Analyzing the Short-Term Relationship from a VEC Model We first capture the short-term adjustment of the long-term equilibrium situation with the help of an error correction model (ECM), and then analyze the results. 2.2.1 Capturing the Nature of Short-Term Relations. By using an error correction model (ECM), it possible to capture the short-term adjustments which lead to the long-term equilibrium situation we previously described above. To illustrate this in our study, the cointegrating relation (1) is retained: (1) IDECEMAC= 0.042273 PIB - 14.33421 IDEUEMOA (0.09011) (4.23154) Starting from the above equation, we propose an ECM which captures the short-term relationship between the preceding variables. This model is given in the following form: (1’) ttIDEUEMOAPIBIDECEMAC νεααα +−Δ−Δ=Δ −1321 Where 1−tε is the residual of the cointegrating relation, the residuals of equation (1) being stationary. The variables are then expressed in first differences (the operator of which is indicated by the symbolΔ ). The ordinary least squares (OLS) method is applied to relation (1’). The existence of a short-term relationship requires that the coefficient 3α of the error lagged error term (also known as the “the adjustment factor” have a negative sign, hence the opportunity to carry out an effective analysis of the results. 2.2.2 Analyse of the Results The short-term equation such as built using the variables IDECEMAC, IDEUEMOA, and PIB, clearly indicates a negative adjustment factor. There exists a short-term relationship among these variables. However, by looking at Appendix Annexe 5, only the operations of PIB, CEMAC (DPIB), and the FDIs

436 European Journal of Sustainable Development (2012), 1, 3, 419-444
of UEMOA (DIDEUEMOA) are significant. On the other hand, this indicates that in the short term there exists a significant and positive relationship between the FDIs of the CEMAC lagged one or two periods and current GDP, which may be explained by the fact that foreign investments probably help to boost growth further in this zone. Furthermore, we should note the existence of a significant and positive relationship between the UEMOA FDIs and the CEMAC FDIs lagged one or two periods. This indicates that if, in the long term, the UEMOA FDIs compete with the CEMAC FDIs, in the short-term the CEMAC zone effectively benefits from improvements in the business climate. However, this demonstration process is necessary to appreciate the effect of the recovery of attractiveness. Conclusion The purpose of this study was to test the hypothesis that there exists a relationship between the FDIs of the UEMOA region and the FDIs of the CEMAC region. The results of this test have shown that there actually exists a long term relationship between the FDIs of the FDIs of CEMAC and the FDIs of UEMOA. However, the type of relationship existing between the FDIs of both regions manifests itself more through competition rather than through complementarily as is the case in some other African region such as Northern Africa (i.e. the Magreb). However, the improvement of the business environment in Sub-Saharan Africa, made possible by the attractiveness of the CEMAC zone and by the stability of the investment that it receives, also benefits to the UEMOA zone where FDIs have been growing since 1985. Moreover, there probably exists a complementarity between the FDIs of the CEMAC and those of the UEMOA in the short term, a situation which indicates a recovery of regional attractiveness linked to the commitments and initiated in the two regions from 1995 onwards. In addition, a synergic effect seems to have developed between the two zones since similar policies of attractiveness are being jointly implemented in both economic spaces. References Banque Mondiale, (2007), Promouvoir la croissance et l’emploi par la diversification productive et la compétitivité, Mémorandum économique sur le Royaume du Maroc, 2007, World Bank, Washington.

E. Ngongang 437
© 2012 The Authors. Journal Compilation © 2012 European Center of Sustainable Development. Published by ECSDEV, Via dei Fiori, 34, 00172, Rome, Italy
Basu and al., (2002), Liberalization FDI, and Growth in developing Countries: a Panel Cointegration Approach, Economic Inequity, Vol. 41, PP 510-515. Basu, A., K. Srinivasan, (2002), Foreign Direct Investment in Africa – Some case studies, IMF Working Paper, wp/02/61, March 2002. BCEAO (1985-2011), Rapport Annuel, BCEAO. BEAC (1985-2011), Rapport Annuel, BEAC. Blonigen A.A.(2005),A Review of the empirical Literature on FDI Determinants, NBER, Working Paper. Dunning, J H.,( 1993), Reevaluating the Benefits of Foreign Direct Investment, UNCTAD. org. Feinberg, S. and Keane, M., (2001), U.S - Canada Trade Liberalization and MNC Production Location, Review of Economics and Statistics, 83(1): 118-32. Froot K A. and Stein, (1991), Exchange Rates and Foreign Direct Investment: An Empirical Capital Market Approach. The Quarterly Journal of Economics, Oxford Journals.Org. Granger C W J., (1969), Investigating Causal relations by Econometric Models and cross-Spectral Methods, Journal of the Econometric Society, JSTOR. Hanson, G., Mataloni, R., and Slaughter, M.(2003), Vertical Production Networks in Multinational Firms, NBER Working Paper No. 9723. Hartman D G. (1984), Tax Policy and Foreign Direct Investment in the United States, National Journal, vol. 37, n° 4, PP.175-488. Femise (2005), Rapport Femise 2004 sur le partenariat Europe méditerranéen, Document de travail. Granger C W J.(1969), Investigating Causal relations by Econometric Models and cross-Spectral Methods, Journal of the Econometric Society, JSTOR. Hanson, G., Mataloni, R., and Slaughter, M.(2003), Vertical Production Networks in Multinational Firms, NBER Working Paper No. 9723. Hartman D G.(1984), Tax Policy and Foreign Direct Investment in the United States, National Journal, vol. 37, n° 4, PP.175-488.
438 European Journal of Sustainable Development (2012), 1, 3, 419-444
Helpmann,E. (1984), A Endogenous Innovation in Theory of Growth, Journal of Economics Perspectives. Klein B A. and Rosengren, (1994), The real Exchange Rate and Foreign Direct Investment in the United States: relative Wealth US, Relative Wage effects, Journal of International Economics, Elsevier. Loewendahlt H. et E. Ertugal- Loewendahlt, (2001) , Turkey’ performance in Attracting Foreign Direct Investment : Implications of EU enlargement, European Network of Economic Policy research, Working paper, n°8. Markussen J R. et al, (1996), Multinational Firms, Technology Diffusion and trade, Journal of International Economic, Vol. 41, PP 1-28. Matha San’t A.(2000), Mobility, poverty and environment issues: convergences and Contradictions : case of Cotonou, International scientific committee by X. Godard and I.Fatouzoun. Mundell, (1967),Mundell’s International Economics : Adaptations and Debates, Working Paper IMF. Nicet-Chenaf and Rougier (2007), Foreign Direct Investment: a comparative study of the Attraction of Moroccan and Tunisian economics, Cahiers du Gres, n°5. Sims C.(1980), Macroeconomics and reality, Economica. Stevens G.V.G., (1998), Exchange Rates and Foreign Direct Investment: A note, Journal of Policy Modelling, 20 (3), pp 393-401. Wei S J. (2000), Explaining the Border effect, the Role of exchange rate variability, shipping costs, and geography, Nber, Working Paper, N° 7836. Wheeler D. et Mody A., (1992) , International Investment Location decisions : The case of US Firms, Journal of international Economics, vol 33 . PP. 57-76. Yeaple (2003), Multinational enterprises, international trade, and productivity growth firm level: evidence from the United States, Nber.org.

E. Ngongang 439
© 2012 The Authors. Journal Compilation © 2012 European Center of Sustainable Development. Published by ECSDEV, Via dei Fiori, 34, 00172, Rome, Italy
Annexe 1 VAR Lag Oder Selection Criteria Endogenous variables: IDECEMAC GPD IDEUEMOA Exogenous variables: C Date: 24/11/11 Time 23:10 Sample: 1975-2010 Included observations: 29 Lag LogL LR FPE AIC SC HQ 0 -1815617 NA 1.37e+48 131.3011 131.3012 131.3537 1 -1717 012 28.673 428 6.47e+49 130.6212 131.2827 130.7012 2 -1700114 14.018319 6.68e+49 130.6110 131.6112 130.7242 LR: Sequential lag order selected by the criterion FPE: Final prediction error AIC: Akaîke information criterion SC: Schwarz information criterion HQ: Hannan-Quinn information criterion * indicates lag order selected by the criterion Annexe 2 Vector Autoregression Estimates Vector Autoregression Estimates Date: 24/11/11 Time 22::51 Sample(adjusted): 1975-2010 Included observations: 29 after adjustments Standards errors in ( ) t-statistics in[ ] IDECEMAC GPD IDEUEMOA
IDECEMAC (-1) 0.056012(0.16111) [0.26788]
-3.014 298(4.05062) [-0.77998]
0.061445(0.09778) [0.52737]
IDECEMAC (-2) 0.668278(0.16888) [2.57787]
1.782527(4.15663) [0.44154]
0.013742(0.11621) [0.11679]
GPD(-1) -0.000198(0.01345) [-0.01667]
0.361212(0.30275) [1.26331]
0.002404(0.00801) [0.32961]

440 European Journal of Sustainable Development (2012), 1, 3, 419-444
GPD(-2) 0.0065445(0.01367) [0.45666]
0.375343(0.30288) [1.23351]
0.002409(0.00826) [0.77834]
IDEUEMOA (-1) 1.37 7711(0.47 785) [2.41271]
5.980123(12.4678) [0.62331]
0.282442(0.30001) [0.97961]
IDEUEMOA (-2) -0.451246(0.57822) [-0.79567]
-8.677888(13.4123)
[-0.63443]
-0.049070(0.32737) [-0.15034]
C -2.29E+09(2.7E+09) [-0.89667]
8.01E+12(6.2E+08) [1.27234]
1899985(1.7E+09) [0.01445]
R-squared 0.754540 0.37 8988 0.344122
Adjusted R-squared 0.68 6672 0.19 0871 0.130344
Sum squared resid 2.87E+19 1.62E+23 9.77E+15
S.E.of regression 3.78E+09 8.99E+08 2.19E+09
F-statistic 11.812344 1.984212 1.622234
Log Likehood -577.2202 -661.6776 -5637301
Akaike AIC 43.77387 49.45670 42.45687
Schwarz SC 43.88790 50.55443 42.98898
Mean dependent var 3.17E+08 2.55E+11 2.84E+08
S.D.dependent var 6.99E+08 9.90E+09 2.33E+09
Determinant resid covariance (dot adj.)
3.98E+65
Determinant resid covariance 1.60E+56
Log Likehood -1863.018
Akaike information citerion 132.6677
Schwarz Criterion 133.6888

E. Ngongang 441
© 2012 The Authors. Journal Compilation © 2012 European Center of Sustainable Development. Published by ECSDEV, Via dei Fiori, 34, 00172, Rome, Italy
Annexe 3 Johanson Cointegration Test Date: 24/11/11 Time 23::20 Sample(adjusted): 1975-2010 Included observations: 29 after adjustments Trend assumption: linear deterministic trend Series: IDECEMAC GDP IDEUEMOA Lags interval (in first differences): 1 to 2 Unrestricted Cointegration Rank Test (trace)
Hypothesized Trace 0.05 No. of CE(s) Eigenvalue Statistic Critical Value Prob**
None* 0.604524 32.67218 28.90984 0.0266
At most 1 0.228776 8.992177 16.21789 0.3422
At most 2 0.131123 4.023789 4.537121 0.0706 Trace indicates 1 cointegration eqn(s) at the 0.05 level *denotes rejection of the hypothesis at the 0.05 level *Mackinnon-Haug-Michelis (1999) P-value
Unrestricted Cointegration Rank Test (Maximum Eigenvalue)
Hypothesized Max-Eigen 0.05 No. of CE(s) Eigenvalue Statistic Critical Value Prob**
None* 0.604524 28.56789 22.43651 0.0328
At most 1 0.228776 7.08678 15.44321 0.6108
At most 2 0.131123 4.023789 4.537121 0.0706
Max-eigenvalue test indicates 1 cointegration eqn(s) at the 0.05 level *denotes rejection of the hypothesis at the 0.05 level **Mackinnon-Haug-Michelis (1999) P-value
Unrestricted Cointegrating Coefficients (normalized by b *S11* b=1):
IDECEMAC GDP IDEUEMOA 4.88E-10 -1.80E-11 5.44E-08
3.80E-09 1.30E-11 -8.14E-08
-6.11E-10 1.89E-10 -4.02E608
Unrestricted Adjustment Coefficients (alpha)

442 European Journal of Sustainable Development (2012), 1, 3, 419-444
D(IDECEMAC) 1.34E+08 -1.30E+08 43987701
D(GDP) -3.88E+09 -1.70E+09 -1.08E+09
D(IDEUEMOA) -1.23E+08 983402.4 36899809 1 Cointegrating Equation(s): Log likelihood -1694.618 Normalized cointegrating coefficients (standard error in parentheses)
IDECEMAC GDP IDEUEMOA 1.000000 -0.042273 14.33421
(0.09011) (4.23154) Adjustment coefficients (standard error in parentheses)
D(IDECEMAC) 0.065433
(0.03742)
D(GDP) -1,794414
(0.66228)
D(IDEUEMOA) -0.057261
(0.01549)
2 Cointegrating Equation (s) Log likelihood -1691.601 Normalized cointegrating coefficients (standard error in parentheses)
IDECEMAC GDP IDEUEMOA
1.000000 0.000000 -0.990443
(0.70320)
0.000000 1.000000 -289.6871
(71.8832) Adjustment coefficients (standard error in parentheses)
D(IDECEMAC) -0.419602 -0.004010
(0.27321) (0.00161)
D(GDP) -9.088211 0.042776
(4.87623) (0.00234)
D(IDEUEMOA) -0.062475 0.003020
(0.13776) (0.00076)

E. Ngongang 443
© 2012 The Authors. Journal Compilation © 2012 European Center of Sustainable Development. Published by ECSDEV, Via dei Fiori, 34, 00172, Rome, Italy
Annexe 4 Pairwise Granger Causality Tests Date: 24/11/11 Time: 23:40 Sample: 1975 2010 Lags: 2 Null hypothesis: obs F-Statistic ProbabilityIDECEMAC dosesn’t Granger cause GDP 28 1.47566 0.26077GDP dosesn’t Granger Cause IDECEMAC 0.92245 0.41725IDEUEMOA dosesn’t Granger cause GDP 28 1.31804 0.29680GDP dosesn’t Granger cause IDEUEMOA 0.77789 0.47978IDEUEMOA dosesn’t Granger cause IDECEMAC 28 5.56787 0.01010IDECEMAC dosesn’t Granger cause IDEUEMOA 0.23445 0.73678 Annexe 5 Vector Autoregressive Estimates Date:24/11/11 Time: 23:47 Sample(adjusted):1975 2010 Inclused observations : 28 after adjustments Standard errors in ( ) t-statistics in [ ] Cointegrating Eq: Coint Eq 1
IDECEMAC (-1) 1.000000
GPD(-1) - 0.042273(0.09011) [-0.43675]
IDEUEMOA (-1) 14.33421(4.23154) [4.16980]
C -2.59E+08
Error Correction: D(IDECEMAC) D(GDP) D(IDEUEMOA)
Coint Eq 1 0.063566 (0.03452) [1.80787]
-1.878902 (0.65233) [-2.86340]
-0.076468(0.01789) [-3.40895]
D(IDECEMAC(-1)) - 0.923752 (0.24546)
[-3.886634]
9.788901 (4.14378) [2.342231]
0.467083(0.123457) [3.476550]
D(IDECEMAC(-2)) - 0.197769 (0.243540)
[-0.82012]
16.022121(4.078671) [3.80023]
0.3789761(0.112230) [3.89123]
444 European Journal of Sustainable Development (2012), 1, 3, 419-444
D(GDP(-1) -0.000657(0.01430) [-0.04487]
- 0.887652(0.24567) [-3.42966]
- 0.003278(0.00589) [-0.48974]
D(GDP(-2)) 0.000318(0.01415) [0.03403]
-0.430817(0.24135) [-1.92800]
-9.43E-05(0.00691) [-0.02417]
D(IDEUEMOA(-1)) 0.44435(0.64680) [0.79968]
19.89001(9.76545) [1.89895]
-0.030784(0.25885)
[- 0.26107]
D(IDEUEMOA(-2)) - 0.64367(0.55678) [-1.23945]
4.876910(9.72334) [0.40058]
- 0.074741(0.27001)
[- 0.30120]
C 1.28E+08(8.5E+07) [1.60809]
-1.12E+09(1.6E+09) [-0.68651]
-36780234(3.9E+07) [-0.95478]
R-squared 0.844148 0.657681 0.611123
Adjusted R-squared 0.778657 0.608247 0.554430
Sum squared resid 2.89E+19 8.88+20 6.87E+18
S.E.of regression 2.77E+09 7.74E+08 1.85E+09
F-statistic 13.712352 4.754532 3.926782
Log Likehood - 667.2687 -763.5676 - 6257601
Akaike AIC 42.77366 49.42070 42.04587
Schwarz SC 43.68780 47.65467 42.88789
Mean dependent var 32618800 65.89E+08 -14423616
S.D.dependent var 9.24E+09 9.98E+09 2.58E+08
Determinant resid covariance (dot adj.)
2.39E+63
Determinant resid covariance 8.29E+62
Log Likehood -1784.674
Akaike information citerion 143.4619
Schwarz Criterion 144.5680