forecasts and warnings of natural disasters: the roles of national and international agencies
TRANSCRIPT
Meteorol. Appl. 2, 53-64 (1995)
Forecasts and warnings of natural disasters: the roles of national and international agencies J C R Hunt, United Kingdom Meteorological Office, Bracknell, Berkshire RG12 2SZ, UK
Natural disasters are caused b y natural events, whicb can be grouped as (i) extreme unstable events; (ii) large ‘variability’ events associated with extremes of the inherent variability and chaotic behaviour of geophysical systems; and (iii) global change events. These primary events are usually followed by equally harmful secondary events, such as mud slides or tsunamis following volcanic eruptions. Whether these events lead to disasters depends to a large extent on the preparedness and resistance of the afpicted community - i.e. its vulnerability. Forecasts for these different categories of event are of two types: ‘risk’ forecasts based on data of previous events, and real-time forecasts. For group (i) events, these forecasts only begin following some initial detection, wbereas for groups (ii) and (iii), forecasts are made before any indication of the event. Many (but not all) types of secondary event may also be forecast with increasing accuracy using local geophysical data and computational models of relevant processes. In this paper the organisation of forecasts and warnings is described, as is how it involves geophysical and disaster or emergency centres at the national, regional and international Level. Satisfactory arrangements for issuing, receiving and acting on forecasts and warnings between countries (including the use of broadcasting media) require carefully negotiated procedures at the intergovernmental level. I t is pointed out that international procedures developed for meteorology need to be extended to include other types of geophysical event and disaster. The final section of tbis paper reviews the need for defining targets for improvement in forecasting during the current International Decade for Natural Disaster Reduction ( IDNDR), and that this should be preceded by establishing the accuracy of current methods, i.e. the baseline. Clarification of our objectives and targets may well lead to greater financial support from governments and other donors.
I. Introduction
We are concerned here with disasters to human com- munities and ecological systems which are seriously damaged by natural events, to the extent that the com- munities cannot themselves adequately handle all the consequences. These events occur when the dynamic balance in the geophysical (and sometimes biological) processes at the Earth’s surface are significantly disturbed.
From the point of view of the Earth’s equilibrium these natural events are not associated with any significant long-term departure from the usual physical, chemical and biological states of the atmosphere, ocean and land surface. Indeed, these events are an integral part of the geophysical systems and help maintain them in equilib- rium; for example, the sliding movement of the tec- tonic plates, which causes continual earthquakes over a wide spectrum of magnitudes, is a necessary con- sequence of the continuous formation of the plates and their subduction back into the interior of the Earth (e.g. Main, 1993).
These severe geophysical events may or may not lead to disasters, because this depends on their nature and
special features of the events and of the affected com- munities, in particular the conjunction of different geo- physical processes during the event and the ‘vulnerabil- ity’ of the community in question; for example, whether or not it is situated on a low-lying island in the path of a tsunami, or whether the houses are built well enough to withstand a certain level of earthquake.
It is important to note that some geophysical events that give rise to ‘natural’ disasters may be directly or indirectly caused by human influence, such as the col- lapse of a dam following an earthquake. Human activ- ity may also be damaging on a global scale, since it appears to be the cause of the only ‘natural’ disturb- ances that develop within a period much less than a geological time scale and that may be severe enough to cause substantial, possibly irreversible, changes in the Earth’s equilibrium state. These events are usually excluded from the discussion of natural disasters (for example, depletion of stratospheric ozone).
In order to reach the goal of reducing the impact on communities of natural disasters in this decade, it is necessary to attain the following objectives:
53
J C R Hunt
1.
2.
3.
4.
to forecast when and where natural disasters occur, how they travel and evolve, and what secondary effects they cause; to provide appropriate warnings, so that these com- munities are not only informed, but sufficiently impressed that they take remedial action before and during the disaster; to establish from past data and from forecast calcu- lations when, where and with what severity natural disasters affect communities; to study, organise and fund the most economically and socially appropriate arrangements for actions in the precautionary, pre- and post-disaster, and remedial phases of disasters.
It might appear that the tasks in this list may not seem novel because they have all been undertaken for many years, particularly by meteorological and hydrological organisations which provide operational forecastings and regular warnings including forecasts and warnings for events leading to natural disasters.
In fact, these tasks are demanding because national and international organisations are still some way from meeting these objectives, even in meteorology and hydrology. In the case of disasters in these particular areas, although there has been international collabora- tion in the operational exchange of data for 140 years since the Brussels Conference in 1853, it is only recently that there have been protocols for the interna- tional exchange of forecasts and warnings. Even these are restricted to certain types of event (notably tropical cyclones, including hurricanes and typhoons and tsunamis). For other types of geophysical event and natural disaster, while there are scientific exchanges, for example through the International Council of Sci- entific Unions (ICSU), there are no procedures agreed at a world-wide intergovernmental level for opera- tional exchange on an international basis of data, forecasts and warnings between the governmental agencies that have the authority to issue local warnings and organise emergency and disaster relief.
For all types of natural disaster, the communication of effective warnings of natural disasters to communities needs better coordination and improvement. The main defects in present arrangements concern firstly the pro- vision of warnings, which may be totally absent, may be misleading and/or may be duplicated by local, regional and even international media. The second main defect is the highly variable response of commu- nities; even when they receive unambiguous warnings and advice before or during an event, there is often some reluctance to take the appropriate action, for a variety of technical, social and economic factors that are now quite well understood. However, the problem remains (even in quite economically and technologic- ally advanced communities).
During this International Decade for Natural Disaster Keduction (IDNDR), although all these goals will not
be reached, it should be possible to make progress towards them, provided they are clear and the methods for attaining them are agreed. This requires joint dis- cussion between the research, operational and govern- mental disaster agencies leading to the defining of measurable ‘targets’ to be reached at specified dates (or ‘milestones’) to ensure that progress is being made. These targets need to be worked out from a ‘baseline’ defined by the current levels of practice.
This paper, which is focused on the objectives (I), (2) and (3) used above, consists firstly of a brief review of the scientific and technological basis of forecasting these geophysical events by classifying them into groups according to where they fit into the spectrum of fluctuations within the relevant geophysical system. This classification and analysis largely determines the most appropriate methods for forecasts and warnings. Secondly, the paper reviews how different interna- tional and national organisations and UN agencies are working to improve these forecasts and their commun- ication via various media and official channels to com- munities and individuals.
In conclusion, a number of major issues are identified where new agreements and institutional intergovern- mental arrangements are becoming necessary if the developments in technology are to have their max- imum benefit in improving forecasts and warnings. The paper makes use of previous expert reviews on the human and social aspects of disasters; for exampie, in determining what are ‘disasters’, ‘vulnerable’ commu- nities, the acceptable and informative types of warn- ings, and how communities respond to short- or long- term warnings (e.g. Aysan, 1993; Plate et d., 1993).
2. Classification of natural disaster events according to geophysical process
Forecasts and warnings of events associated with strong geophysical disturbances and consequent nat- ural disasters are based firstly on observations of the relevant geophysical phenomena, and secondly on the use of models appropriate to the type of process. Rather than listing all the processes and observational requirements for all the different types of event and disaster, it is more instructive to group them according to the relevant geophysical causes, as follows.
2. I . Extreme unstable events (Group (I))
Extreme unstable events are phenomena that change rapidly over relatively small distances on a global scale. For example, the geological events, volcanoes and earthquakes (e.g. Main, 1993), are drastic instabilities of the crust (for example, with, respectively, the ejec- tion of 1 km’ and displacements of I0 m occurring in minutes within regions of about I km’ - compared to the usual very small displacements, of the order of ccn-
54
Forecasts and warnings of natural disasters
timetres, that take place over many years). The met- eorological events in this group, namely tornadoes and hurricanes/cyclones, are also instabilities of the atmo- sphere-ocean system, rapidly growing within 24 hours over 10-100 km from quite small amplitude disturb- ances. These lead to wind speeds in excess of 200 km h-I, which are much greater than the usual wind speeds of 50 km h-’ and smaller than the usual length scales, of synoptic disturbances of 1000 km and growth time scales of 2-3 days. Thus, these events are essentially manifestations of rapidly growing instabil- ities of geophysical ‘systems’ at the Earth’s surface, and are distinct from those of the dominant dynamical processes that take place on the longer period and longer length scales in these ‘systems’.
Once these events have occurred they often interact with other geophysical or man-made ‘systems’ to cause further geophysical disturbances. These can be termed secondary events and they may also have disastrous consequences for communities. For example, strong volcanic eruptions produce many types of secondary event, such as lava flows or clouds of hot dust-laden air descending rapidly down their slopes, or mud slides caused by volcanic eruptions breaching dams, or vol- canic dust mixed with rain or molten snow; earth- quakes can produce vertical accelerations of the sea bed which cause long waves on the sea surface, ‘tsunamis’, which propagate across oceans, at speeds of about 100 m s-’, grow in amplitude from about 1 m to ZO m when they reach the shallower sea bed near other coastlines and wreak havoc on shore communities (e.g. Dawson et al., 1993); there may be secondary events following typhoons and other severe cyclones, con- sisting of large wind-induced waves, tidal surges and heavy rain at the near-by shore, which may lead to a ‘disaster’ as a result of inundation of communities, and damaging shipping and shoreline structures; when the events are strong enough urban areas can be damaged up to ZOO km inland.
Whether the primary or secondary events lead to nat- ural disasters depends very much on the ‘vulnerability’ of the community to that particular set of events (e.g. Aysan, 1993). Communities differ greatly in how well they are protected and prepared and in the degree to which they have suitable buildings, transport and com- munication systems to ‘weather’ an extreme event, and the organisation and infrastructure to respond.
2.2. Large ‘variability’ events (Group (ii))
Large ‘variability’ events are extremes of the inherent variability and chaotic behaviour of the main geo- physical ‘systems’. These events are usually meteorol- ogcal, hydrological or oceanographic, though certain geothermal phenomena also fall into this category; not- able examples are the extended periods, ranging from three months to two years, when large increases in
rates of precipitation may occur, leading to flooding, or decreases, leading to drought, or when oscillations in the tropical ocean-atmosphere system lead to rises in ocean temperature (which can lead to disastrous loss in fish catch and starvation). These are natural fluctu- ations in the atmosphere-ocean-land-surface system whose probabilities of recurrence at the same place with defined ‘return periods’ have been established by examining records. The extent to which these events can be forecast will be discussed in section 3.
Even more than for events in the first group, these events are usually most serious when they sub- sequently induce secondary events, which may or may not develop on the same time scale as the primary event. Usually, long periods of rain give rise to long periods of flooding, such as occurred in the USA in 1993. However, in other situations, the primary events may induce instabilities in the geophysical processes which cause quite sudden and potentially damaging secondary events over quite short distances as, for example, when large snowfalls are followed by sudden avalanches or heavy rain leads to a flood wave down a river system.
2.3. Global change events (Group (iii))
Over geological periods of the Earth’s history the states of most geophysical systems on the surface of the Earth have undergone large changes as a result of external astronomical effects and process within the Earth’s crust. Although these have led to great changes in the magnitude and frequency of all types of disaster event in the past, in the current geological era such natural changes are not expected to be observable.
However, the increasing world population and the associated agricultural, urban and industrial develop- ment (e.g. by atmospheric release of CO,, and fluoro- carbons, and changes in the biomass) are producing significant changes in the physical, chemical and biolo- gical states of the atmosphere-ocean-land system that may induce directly, o r by secondary causes, events that could lead to an increase in the number of natural disasters.
Some of the main primary events may be droughts and desertification (caused by C 0 2 emission), or excess ultraviolet rays causing loss of ocean plankton (caused by reduction of stratospheric ozone). The secondary events may be increased, as hurricanes and storms change their ‘tracks’ (e.g. Collier et al., 1994); there may be loss in food and fish production; and there is the possibility of greater severity of the impact of dis- asters on vulnerable communities because of the greater population with poorer health and housing (see, for example, Houghton et al., 1990, 1992).
55
J C R Hunt
3. Risk assessment and real-time forecasting
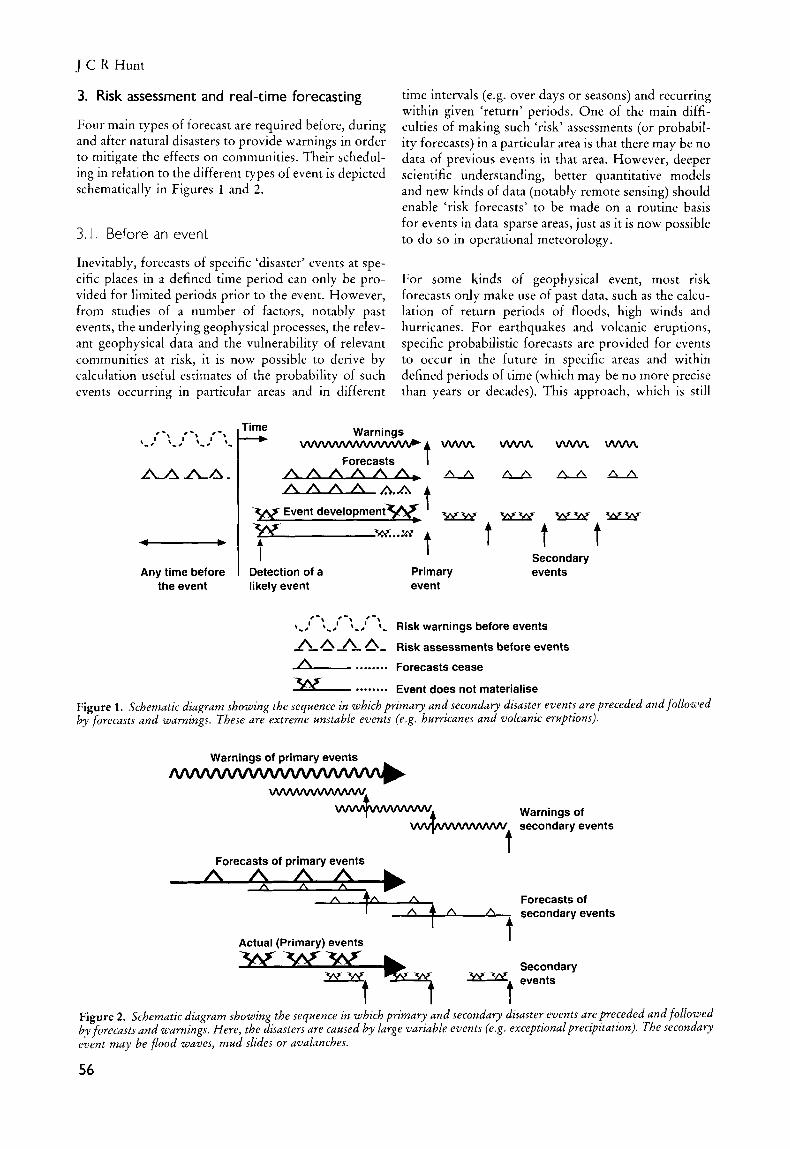
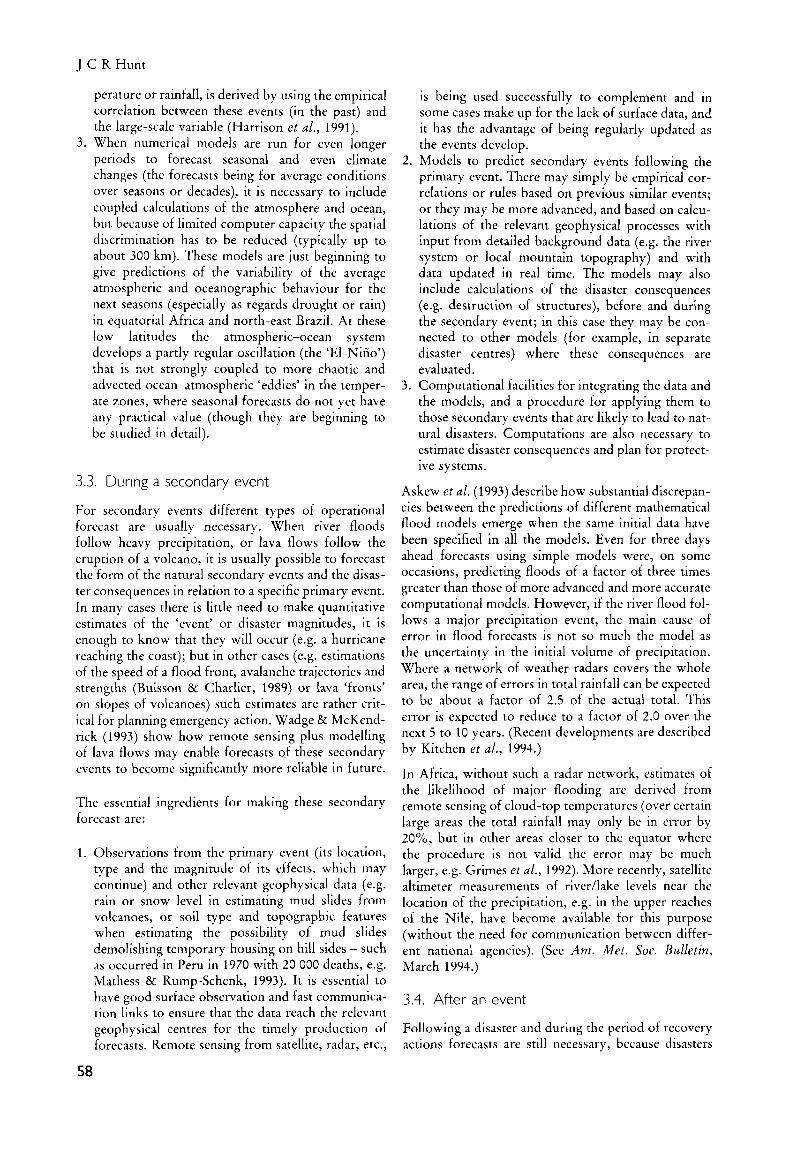
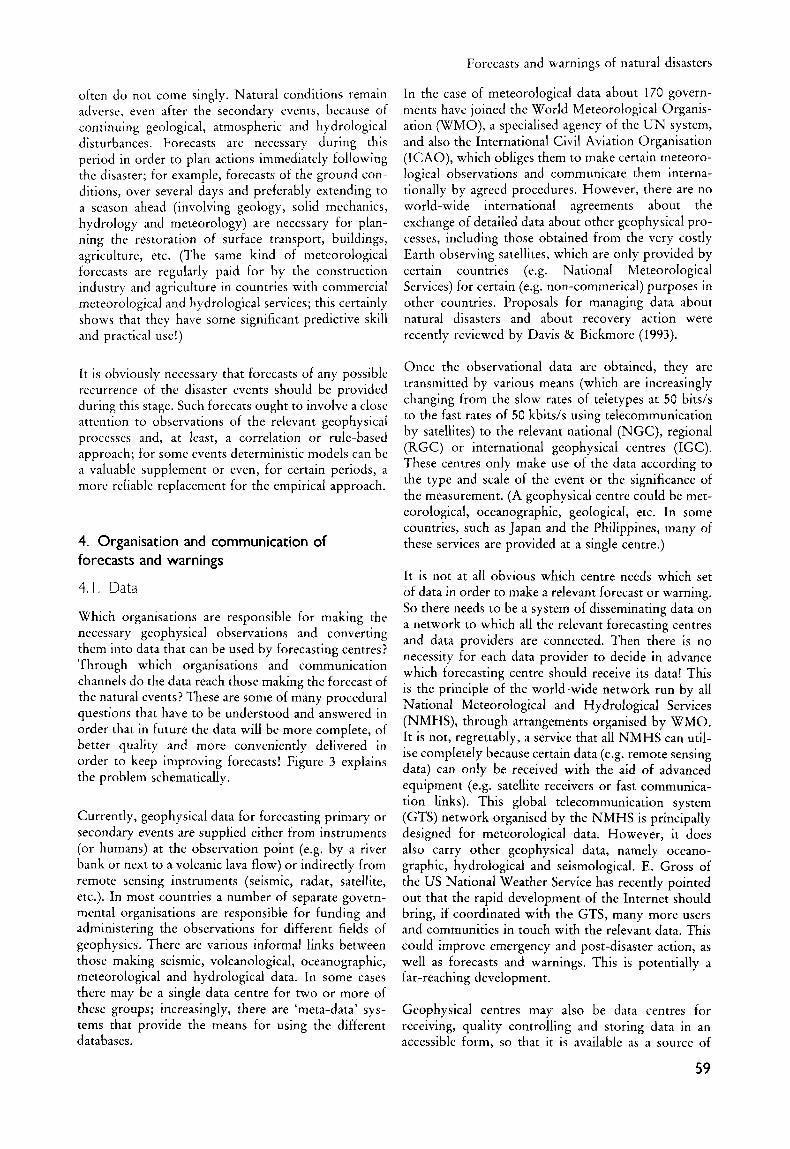
Four main types of forecast are required before, during and after natural disasters to provide warnings in order to mitigate the effects on communities. Their schedul- ing in relation to the different types of event is depicted schematically in Figures 1 and 2.
3. I . Before an event
Inevitably, forecasts of specific ‘disaster’ events at spe- cific places in a defined time period can only be pro- vided for limited periods prior to the event. However, from studies of a number of factors, notably past events, the underlying geophysical processes, the relev- ant geophysical data and the vulnerability of relevant communities at risk, it is now possible to derive by calculation useful estimates of the probability of such events occurring in particular areas and in different
time intervals (e.g. over days or seasons) and recurring within given ‘return’ periods. One of the main diffi- culties of making such ‘risk’ assessments (or probabil- ity forecasts) in a particular area is that there may be no data of previous events in that area. However, deeper scientific understanding, better quantitative models and new kinds of data (notably remote sensing) should enable ‘risk forecasts’ to be made on a routine basis for events in data-sparse areas, just as it is now possible to do so in operational meteorology.
For some kinds of geophysical event, most risk forecasts only make use of past data, such as the calcu- lation of return periods of floods, high winds and hurricanes. For earthquakes and volcanic eruptions, specific probabilistic forecasts are provided for events to occur in the future in specific areas and within defined periods of time (which may be no more precise than years or decades). This approach, which is still
- Any time before
the event
% x 5 4 ? k k 3 2 ? m 5 c E 7 s
t t t I t I Detection of a
likely event
I
Primary event
Secondary events
Risk warnings before events
Risk assessments before events
Forecasts cease
Event does not materialise
Figure I . Schematic diagram showing the sequence in which primary and secondary disaster events are preceded and followed by forecasts and warnings. These are extreme unstable events (e.g. hurricanes and volcanic eruptions).
VVVVVVVVVVVVW ++ t Forecasts of primary events
Actual (Primary) events
Warnings of secondary events
Forecasts of secondary events
Secondary events
Figure 2. Schematic diagram showing the sequence in which primary and secondary disaster events are preceded and followed by forermts and warnings. Here, the disasters are caused b y large variable events (e.g. exceptional precipitation). The secondary event may be flood waves, mud slides or avalanches.
56

Forecasts and warnings of natural disasters
Three main methods are used: extrapolation using real- time data (as in the use of weather radar to forecast tornadoes and flash floods for periods of minutes to hours); the use of empirical correlations or rules based on past data to forecast from present data (e.g. cyclones in the northern hemisphere tend to track on straight lines and then turn north; the behaviour of volcanoes is based on the rate of change of their surface temper- atures, etc.); and the use of computational models incorporating data from world-wide observations of all the relevant geophysical processes (of which the best current example is cyclone/hurricane forecasts by cer- tain Regional Specialised Meteorological Centres as designated by WMO). In the case of hurricanes, the latter approach has only recently been found to be a reliable improvement over the former empirical methods and is the only reasonably reliable method for forecasting the rapid changes in their direction (Chan & Kay 1993). Until recently typical errors in position for 48- and 72-hour periods were about 350 km and 500 km respectively. Since October 1994 these errors have been further reduced by about 30% (Heming et ul., 1995).
tentative, makes use of current data; for example, of stresses, movements and temperature in the rocks (e.g. Schmincke et ul., 1993).
There are two main ways in which this statistical approach of precautionary forecasting has certainly proved its value in different fields of geophysics. Firstly, there is much evidence that ‘disaster’ events have generally recurred within the ‘return periods’ evaluated for the related geophysical processes in that particular region of the world. In other words, the return period concept has been validated (which con- firms that these events are members of a defined statist- ical ensemble) (e.g. Simiu & Scanlan, 1978; Main, 1993).
Secondly, these ‘risk’ forecasts have enabled precau- tionary warnings to be given of specific kinds of danger to particular communities. In an increasing number of countries these ‘precautionary warnings’ have been fol- lowed by preventative action, such as strengthening buildings, flood protection schemes, cyclone shelters, etc. By making quantitative use of the appropriate estimates of the probability of disasters, there is the basis for a stronger justification for expenditure of appropriate resources on these actions.
3.2. During a primary event
For certain primary events real-time forecasts are possible.
(a) Extreme unstable events
The satellite images of ocean cloud beginning to show the disc shape characteristic of a tropical cyclone, or the observed temperature and lava level of a volcano beginning to rise, are examples of the initial detection of a geophysical phenomenon that may develop into a primary event and a ‘natural disaster’. For some very rapidly developing unstable events (on periods of minutes) such as tornadoes there is a ‘pre-initial detec- tion’ phase when the general conditions are suitable for such an event. Following this moment of ‘initial detection’, local, regional or international geophysical centres may begin to make specific forecasts (see Figure I), using observations made locally (e.g. ship measurements of hurricane winds, or vulcanologists’ measurements of Earth vibrations, e.g. Punongbayan, 1994) or remotely (e.g. by satellites, seismic records, etc.) and transmitted between these centres. Such forecasts are aimed at predicting the location, time, form and magnitude of the primary event; these pre- dictions are either probabilistic or are deterministic with a finite error (which should if possible be estimated); for example, a forecast may state that a cyclone will arrive in 24 hours on the coast at a particu- lar point X with a possible error in the landfall position of about 100 km either side of X.
(b) Large (variability) events
It is possible to forecast for a limited period events that routinely occur within chaotic geophysical systems (Palmer, 1993) - see Figure 2. The forecast period for particular variables may be longer o r shorter depending on the availability of data from observations and the properties of the relevant processes and of the predictive models. For atmosphere-ocean systems there are three types of forecast model:
1. There are deterministic calculations based on models of the geophysical processes (such as deter- ministic numerical weather forecasts and seasonal climate forecasts, which include many simplifica- tions of processes taking place on length and time scales smaller than that of the ‘mesh size’ of the numerical calculation). Currently, weather forecasts give useful guidance on these kinds of events up to five days in advance as, for example, for the temper- ature and snow forecasts in the ‘storm of the cen- tury’ in the USA in March 1993 and the cold weather disaster affecting refugees at the borders of Turkey, Iraq and Iran in January 1992.
2. There are statistical correlations, based on past data, between certain geophysical phenomena and par- ticular events at later times which are used for forecasts over longer periods than about 10 days, because the purely deterministic forecast is inaccur- ate. Then, a combined deterministic-statistical method is more effective: initially, a large-scale vari- able, such as atmospheric pressure, is forecast deter- ministically (with an ensemble of calculations to indicate the reliability of this forecast); then the likelihood of local small-scale events, such as tem-
57
J C R Hunt
perature or rainfall, is derived by using the empirical correlation between these events (in the past) and the large-scale variable (Harrison et ul., 1991).
3. When numerical models are run for even longer periods to forecast seasonal and even climate changes (the forecasts being for average conditions over seasons or decades), it is necessary to include coupled calculations of the atmosphere and ocean, but because of limited computer capacity the spatial discrimination has to be reduced (typically up to about 300 km). These models are just beginning to give predictions of the variability of the average atmospheric and oceanographic behaviour for the next seasons (especially as regards drought or rain) in equatorial Africa and north-east Brazil. At these low latitudes the atmospheric-ocean system develops a partly regular oscillation (the ‘El-Nifio’) that is not strongly coupled to more chaotic and advected ocean-atmospheric ‘eddies’ in the temper- ate zones, where seasonal forecasts do not yet have any practical value (though they are beginning to be studied in detail).
3.3. During a secondary event
For secondary events different types of operational forecast are usually necessary. When river floods follow heavy precipitation, or lava flows follow the eruption of a volcano, it is usually possible to forecast the form of the natural secondary events and the disas- ter consequences in relation to a specific primary event. In many cases there is little need to make quantitative estimates of the ‘event’ or disaster magnitudes, it is enough to know that they will occur (e.g. a hurricane reaching the coast); but in other cases (e.g. estimations of the speed of a flood front, avalanche trajectories and strengths (Buisson & Charlier, 1989) or lava ‘fronts’ on slopes of volcanoes) such estimates are rather crit- ical for planning emergency action. Wadge & McKend- rick (1993) show how remote sensing plus modelling of lava flows may enable forecasts of these secondary events to become significantly more reliable in future.
The essential ingredients for making these secondary forecast are:
1. Observations from the primary event (its location, type and the magnitude of its effects, which may continue) and other relevant geophysical data (e.g. rain or snow level in estimating mud slides from volcanoes, or soil type and topographic features when estimating the possibility of mud slides demolishing temporary housing on hill sides - such as occurred in Peru in 1970 with 20 000 deaths, e.g. Mathess & Rump-Schenk, 1993). It is essential to have good surface observation and fast communica- tion links to ensure that the data reach the relevant geophysical centres for the timely production of forecasts. Remote sensing from satellite, radar, etc.,
2.
3.
is being used successfully to complement and in some cases make up for the lack of surface data, and it has the advantage of being regularly updated as the events develop. Models to predict secondary events following the primary event. There may simply be empirical cor- relations or rules based on previous similar events; or they may be more advanced, and based on calcu- lations of the relevant geophysical processes with input from detailed background data (e.g. the river system or local mountain topography) and with data updated in real time. The models may also include calculations of the disaster consequences (e.g. destruction of structures), before and during the secondary event; in this case they may be con- nected to other models (for example, in separate disaster centres) where these consequences are evaluated. Computational facilities for integrating the data and the models, and a procedure for applying them to those secondary events that are likely to lead to nat- ural disasters. Computations are also necessary to estimate disaster consequences and plan for protect- ive systems.
Askew et ul. (1993) describe how substantial discrepan- cies between the predictions of different mathematical flood models emerge when the same initial data have been specified in all the models. Even for three days ahead forecasts using simple models were, on some occasions, predicting floods of a factor of three times greater than those of more advanced and more accurate computational models. However, if the river flood fol- lows a major precipitation event, the main cause of error in flood forecasts is not so much the model as the uncertainty in the initial volume of precipitation. Where a network of weather radars covers the whole area, the range of errors in total rainfall can be expected to be about a factor of 2.5 of the actual total. This error is expected to reduce to a factor of 2.0 over the next 5 to 10 years. (Recent developments are described by Kitchen et ul., 1994.)
In Africa, without such a radar network, estimates of the likelihood of major flooding are derived from remote sensing of cloud-top temperatures (over certain large areas the total rainfall may only be in error by 2O%, but in other areas closer to the equator where the procedure is not valid the error may be much larger, e.g. Grimes et d., 1992). More recently, satellite altimeter measurements of r iverhke levels near the location of the precipitation, e.g. in the upper reaches of the Nile, have become available for this purpose (without the need for communication between differ- ent national agencies). (See Am. Met . SOC. Bulletin, March 1994.)
3.4. After an event
Following a disaster and during the period of recovery actions forecasts are still necessary, because disasters
Forecasts and warnings of natural disasters
In the case of meteorological data about 170 govern- ments have joined the World Meteorological Organis- ation (WMO), a specialised agency of the U N system, and also the International Civil Aviation Organisation (ICAO), which obliges them to make certain meteoro- logical observations and communicate them interna- tionally by agreed procedures. However, there are no world-wide international agreements about the exchange of detailed data about other geophysical pro- cesses, including those obtained from the very costly Earth observing satellites, which are only provided by certain countries (e.g. National Meteorological Services) for certain (e.g. non-commerical) purposes in other countries. Proposals for managing data about natural disasters and about recovery action were recently reviewed by Davis & Bickmore (1993).
often do not come singly. Natural conditions remain adverse, even after the secondary events, because of continuing geological, atmospheric and hydrological disturbances. Forecasts are necessary during this period in order to plan actions immediately following the disaster; for example, forecasts of the ground con- ditions, over several days and preferably extending to a season ahead (involving geology, solid mechanics, hydrology and meteorology) are necessary for plan- ning the restoration of surface transport, buildings, agriculture, etc. (The same kind of meteorological forecasts are regularly paid for by the construction industry and agriculture in countries with commercial meteorological and hydrological services; this certainly shows that they have some significant predictive skill and practical use!)
Once the observational data are obtained, they are transmitted by various means (which are increasingly changing from the slow rates of teletypes at 50 bits/s to the fast rates of 50 kbits/s using telecommunication by satellites) to the relevant national (NGC), regional (RGC) or international geophysical centres (IGC). These centres only make use of the data according to the type and scale of the event or the significance of the measurement. (A geophysical centre could be met-
It is obviously necessary that forecasts of any possible recurrence of the disaster events should be provided during this stage. Such forecats ought to involve a close attention to observations of the relevant geophysical processes and, at least, a correlation or rule-based approach; for some events deterministic models can be a valuable supplement or even, for certain periods, a more reliable replacement for the empirical approach.
. - _ _ eorological, oceanographic, geological, etc. In some countries, such as Japan and the Philippines, many of these services are provided at a single centre.)
It is not at all obvious which centre needs which set of data in order to make a relevant forecast or warning.
4. Organisation and communication of forecasts and warnings
4. I . Data
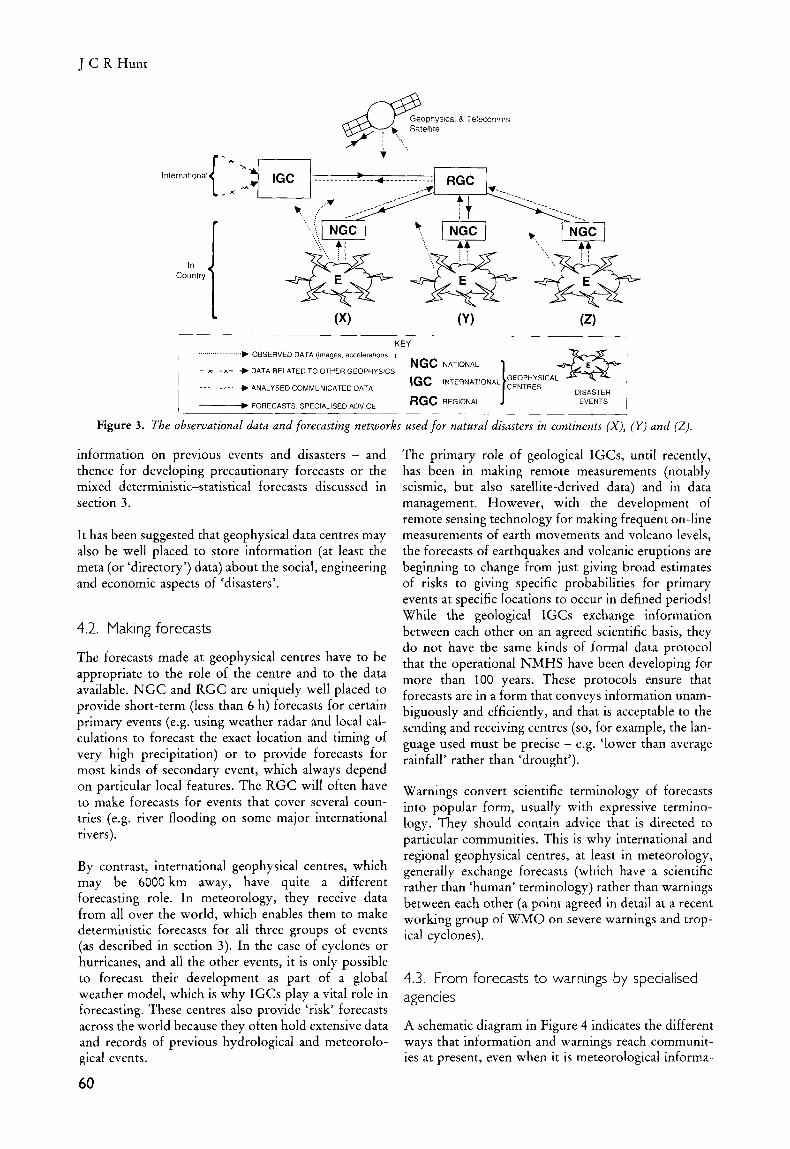
Which organisations are responsible for making the necessary geophysical observations and converting them into data that can be used by forecasting centres? Through which organisations and communication channels do the data reach those making the forecast of the natural events? These are some of many procedural questions that have to be understood and answered in order that in future the data will be more complete, of better quality and more conveniently delivered in order to keep improving forecasts! Figure 3 explains the problem schematically.
Currently, geophysical data for forecasting primary or secondary events are supplied either from instruments (or humans) at the observation point (e.g. by a river bank or next to a volcanic lava flow) or indirectly from remote sensing instruments (seismic, radar, satellite, etc.). In most countries a number of separate govern- mental organisations are responsible for funding and administering the observations for different fields of geophysics. There are various informal links between those making seismic, volcanological, oceanographic, meteorological and hydrological data. In some cases there may be a single data centre for two or more of these groups; increasingly, there are ‘meta-data’ sys- tems that provide the means for using the different databases.
- So there needs to be a system of disseminating data on a network to which all the relevant forecasting centres and data providers are connected. Then there is no necessity for each data provider to decide in advance which forecasting centre should receive its data! This is the principle of the world-wide network run by all National Meteorological and Hydrological Services (NMHS), through arrangements organised by WMO. It is not, regrettably, a service that all NMHS can util- ise completely because certain data (e.g. remote sensing data) can only be received with the aid of advanced equipment (e.g. satellite receivers or fast communica- tion links). This global telecommunication system (GTS) network organised by the NMHS is principally designed for meteorological data. However, it does also carry other geophysical data, namely oceano- graphic, hydrological and seismological. E. Gross of the US National Weather Service has recently pointed out that the rapid development of the Internet should bring, if coordinated with the GTS, many more users and communities in touch with the relevant data. This could improve emergency and post-disaster action, as well as forecasts and warnings. This is potentially a far-reaching development.
Geophysical centres may also be data centres for receiving, quality controlling and storing data in an accessible form, so that it is available as a source of
59
J C R Hunt
{ International
Country
In 1 KEY
k OBSERVED DATA (images. accelerations )
- x -A- + DATA RELATED TO OTHER GEOPHYSICS
. . . . . . . . , , , . . . . . . . , , ,
~ _ _ _ _ . _ _ _ _ _ _ _ _ _ ~ ~- EVENTS i
NGC NATIONAL
+ ANALYSED COMMUNICATED DATA
Figure 3. The observational data and forecasting networks used for natural disasters in continents (X) , (Y ) and (Z).
information on previous events and disasters - and thence for developing precautionary forecasts or the mixed deterministic-statistical forecasts discussed in section 3.
It has been suggested that geophysical data centres may also be well placed to store information (at least the meta (or ‘directory’) data) about the social, engineering and economic aspects of ‘disasters’.
4.2. Making forecasts
The forecasts made at geophysical centres have to be appropriate to the role of the centre and to the data available. NGC and RGC are uniquely well placed to provide short-term (less than 6 h) forecasts for certain primary events (e.g. using weather radar and local cal- culations to forecast the exact location and timing of very high precipitation) or to provide forecasts for most kinds of secondary event, which always depend on particular local features. The RGC will often have to make forecasts for events that cover several coun- tries (e.g. river flooding on some major international rivers).
By contrast, international geophysical centres, which may be 6000 km away, have quite a different forecasting role. In meteorology, they receive data from all over the world, which enables them to make deterministic forecasts for all three groups of events (as described in section 3). In the case of cyclones or hurricanes, and all the other events, it is only possible to forecast their development as part of a global weather model, which is why IGCs play a vital role in forecasting. These centres also provide ‘risk’ forecasts across the world because they often hold extensive data and records of previous hydrological and meteorolo- gical events.
The primary role of geological IGCs, until recently, has been in making remote measurements (notably seismic, but also satellite-derived data) and in data management. However, with the development of remote sensing technology for making frequent on-line measurements of earth movements and volcano levels, the forecasts of earthquakes and volcanic eruptions are beginning to change from just giving broad estimates of risks to giving specific probabilities for primary events at specific locations to occur in defined periods! While the geological IGCs exchange information between each other on an agreed scientific basis, they do not have the same kinds of formal data protocol that the operational NMHS have been developing for more than 100 years. These protocols ensure that forecasts are in a form that conveys information unam- biguously and efficiently, and that is acceptable to the sending and receiving centres (so, for example, the lan- guage used must be precise - e.g. ‘lower than average rainfall’ rather than ‘drought’).
Warnings convert scientific terminology of forecasts into popular form, usually with expressive termino- logy. They should contain advice that is directed to particular communities. This is why international and regional geophysical centres, at least in meteorology, generally exchange forecasts (which have a scientific rather than ‘human’ terminology) rather than warnings between each other (a point agreed in detail at a recent working group of WMO on severe warnings and trop- ical cyclones).
4.3. From forecasts to warnings by specialised agencies
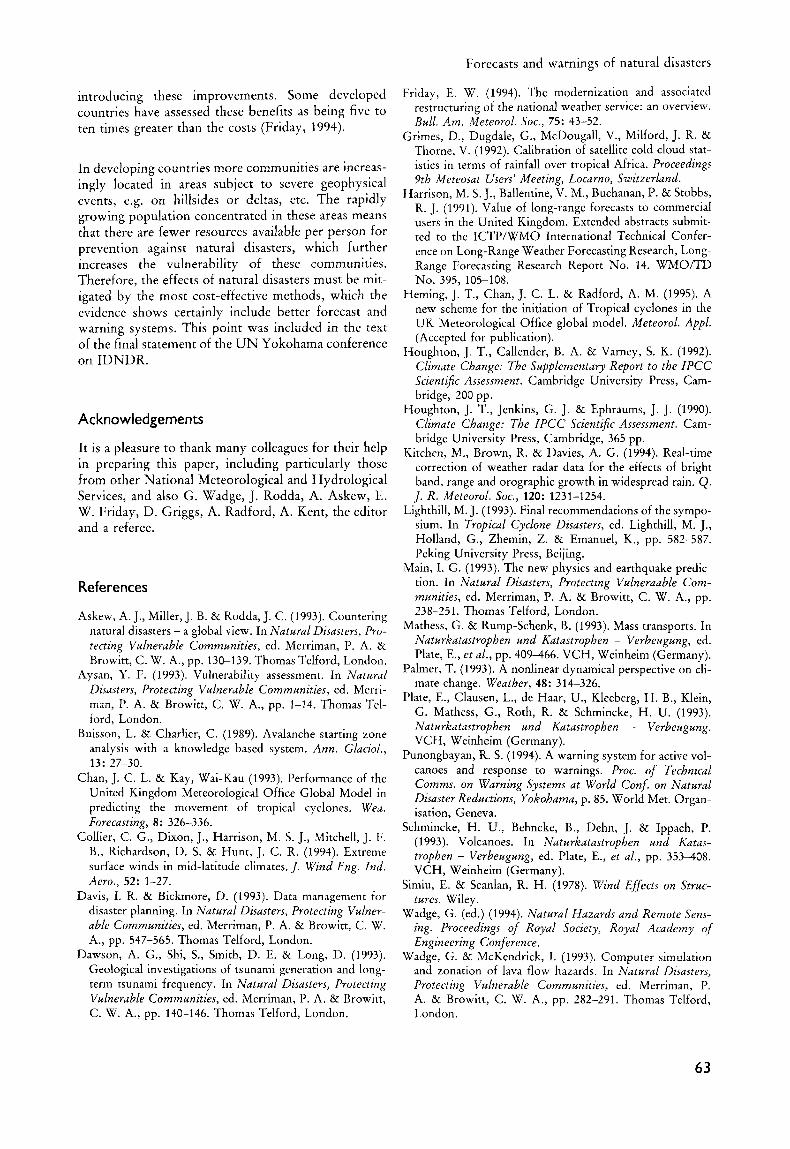
A schematic diagram in Figure 4 indicates the diffe-rent ways that information and warnings reach communit- ies at present, even when it is meteorological informa-
60

Forecasts and warnings of natural disasters
lnternatior r, L‘ ‘
RBC )
- TS TELECOMMS SATELLITE SPECIALISED
KEY
. - INFORMATION
-b CENTRES ----- PUBLIC
INFORMATION
BROADCASTING NDC NATIONAL RBC REGIONAL I CENTRE
W6C WORLD
c DENOTES A COMMUNITY, (X), (Y ) (Z) DENOTES DIFFERENT COUNTRIES
Figure 4. Warnings and information networks for natural disasters.
tion, which is more regulated by international agree- ments than that of other geophysical events.
Starting with the IGCs; these provide specialist information to RGCs (in meteorology this could range from forecast atmospheric charts - or ‘fields’ - to simple direct information about forecast hurricane tra- jections or storm tracks; for the longer term, seasonal forecasts for the equatorial regions are highly relevant to disasters because they include reasonably reliable estimates for droughts or extreme large precipitation). The forms of these kinds of direct information between NMHS have to be agreed in detail in order to avoid ambiguity or issues of national sovereignty that arise when it appears as if international ‘instructions’ are being given! In some cases (as in the latter example of seasonal forecasts) international disaster centres (IDCs) such as those based in international relief agencies request this specialist information. (Such a decision has to be judged carefully because international agencies do not generally have the same knowledge of local con- ditions to interpret the forecasts and warnings, as com- pared to that of the local RGC or NGC. This is the opinion of a number of directors of NMHS in Africa.)
One of the most difficult aspects of organising warn- ings is deciding on the best use of TV and radio broad- casts. World-wide and regional broadcasting systems (WBS or RBS) have gathered information on natural events from IGCs and RGCs and have broadcast them widely, notably on hurricanes, volcanic eruptions, etc. However, this information is given quickly and not usually in the form to guide local communities as to the best action. Furthermore, it may conflict with the information given by national broadcasting systems or by national disaster centres. WMO is proposing pro-
cedures for meteorological and hydrological events involving WBS (or the NMHS informing the WBS) making contact with the local geophysical centres to ensure consistency, and to ensure that the WBS issues ’
forecasts and warnings that are broad brush and not specific enough to duplicate or compete with local ser- vices. A similar approach might be considered for other kinds of geophysical warnings, perhaps along the lines of that being adapted by WMO.
At the regional level, the RGCs receive forecasts (and data) from more than one IGC (a wise policy since forecasts of hurricanes, seasonal climate and other geo- physical events by IGCs may differ significantly!). These have to be evaluated and interpreted in terms of specific local conditions. At the regional level these forecasts for primary events have to be used as a basis for forecasts for secondary events and for potential dis- asters, which requires the further consideration of the precise situation of vulnerable communities. The latter tasks, as explained above, may be undertaken by engin- eers and emergency officers in other institutions such as a regional disaster centre (RDC). Clearly, an RDC can only provide forecasts and warnings and other operational services in different countries in its region if there are clear intergovernmental agreements in place.
It seems that the procedures of WMO for agreeing, instituting and operating meteorological and hydrolo- gical forecasts and warnings would be quite suitable for other kinds of geophysical event and natural disaster. This opinion is shared by a wide range of geophysicists (see discussion reported by Wadge, 1994).
61

J C R Hunt
Forecasts of primary events of shorter periods, events and disaster consequences are produced at N G C s and national disaster centres (NDCs), integrating local observations (e.g. seismic or weather radar) with spe- cialised forecasts and data (e.g. via satellites) from RGCs. In some cases an NDC may also receive warn- ings direct from an RDC and also from other sources. Inevitably, these may differ, and therefore some local, or preferably international, procedure is necessary to guide the NDC in the event of such discrepancies.
Finally, the NDC (or other emergency service) is responsible to their national government for commun- icating ‘warning’ information about the impending event and its disaster consequences to the local com- munities; very often this is coupled with advice as to what to do before, during and after the event.
5. Technical improvements in forecasting
The advantage of naming a decade for an identified problem is that it gives the world community working on that problem an opportunity both to calibrate its effectiveness, to work out how to make improvements and, if it is ambitious, to identify targets for improve- ment. Governments and other donors are more likely to help fund the necessary expenditure to improve forecasts and warnings of natural disaster if this information is available.
In the fields of meteorology and hydrology, forecasts and warnings are regularly reviewed nationally and internationally. Table 1 lists the current warning times and levels of accuracy of long-term forecasts of the key meteorological events that may lead to natural disas- ters; these are provided by a major National Meteoro- logical Service. Estimates are also given of the improve- ments that might be expected by the year 2005. There is a steady level of investment in the service. Note that the level of improvements vary considerably from one event to another; for certain short-range forecasts greater investment will lead directly to improvements, while for other longer-range forecasts, even with greater investent, there may be fundamental reasons why substantial improvements are not currently pos- sible based on our current scientific and technical understanding. The 20% reduction of the error in the location of landfall of hurricanes is consistent with the expected general reduction in error of global forecasts by several NMHS. By the use of novel technology, such as remotely guided aircraft to take soundings in hurricanes, these errors could be further reduced (Lighthill, 1993).
As explained in section 4, warnings differ from forecasts, and have to be given in a form appropriate to different communities, which perceive and react to disasters quite differently. For example, a WMO working group has found that quite different values of
62
Table 1. Advanced short-term warnings and forecast services
Proposed 1993 2005
Flash flood warnings Period of warnings (minutes) 15 40 Accuracy of magnitude (%) 55 90 Events with no warning (“A) 70 20
Severe thunderstorm warnings Period of warning (minutes) 13 25 Accuracy of magnitude (Yo) 70 95
Temperature Percentage of correct forecasts 82 90 Forecast accuracy of the onset of
freezing temperatures 65 90
Snow amount Forecast accuracy of heavy snowfall 35 75
Precipitation forecasts Period of warning for I-inch
precipitation forecast with same accuracy as a 1-day forecast in 1971 (days in advance) 1.8 3.0
Tropical cycloneslhuwicanes Accuracy of landfall (km) with 24-hour
lead time 185 150
wind speed and rates of rainfall are deemed to be ‘severe’ in different countries (even within a single geo- graphical zone such as Europe). There is no generally agreed way (yet) of establishing the effectiveness and accuracy of warnings in different countries. Such stud- ies should help in making the ‘business case’ for improvements of disaster services.
In the UK, warnings to the public emergency (or ‘disaster’) services are issued from six hours up to five days ahead of severe weather events. In 1992/93, 14 warnings were issued of which only three were not justified. The New Zealand Met. Service has a similar false alarm rate. It is expected that there will be about a 10% reduction in this rate over the next five years, as well as corresponding increases in accuracy of the ‘confidence level’, which is now also communicated along with the warnings.
These are examples of establishing baselines and tar- gets for improving forecasts and warnings. They need to be extended and applied to all types of event and natural disaster. It might be worth considering whether the baselines and targets should be classified according to whether they refer to primary or sec- ondary events.
Deciding on these targets is dependent on the levels of technical and human resources that will be available, which in turn usually depend on the estimates of the economic and social benefit to the whole nation of
Forecasts and warnings of natural disasters
introducing these improvements. Some developed countries have assessed these benefits as being five ten times greater than the costs (Friday, 1994).
Friday, E. W. (1994). The modernization and associated restructuring of the national weather service: an overview. Bull. Am. Meteorol. SOC., 75: 43-52.
Grimes, D., Dugdale, G., McDougall, V., Milford, J. R. & Thorne. V. (1992). Calibration of satellite cold cloud stat-
In developing countries more communities are increas- ingly located in areas subject to severe geophysical events, e.g. o n hillsides or deltas, etc. T h e rapidly growing population concentrated in these areas means that there are fewer resources available per person for prevention against natural disasters, which further increases the vulnerability of these communities. Therefore, the effects of natural disasters must be mit- igated by the most cost-effective methods, which the evidence shows certainly include better forecast and warning systems. This point was included in the text of the final statement of the UN Yokohama conference on IDNDR.
Acknowledgements
It is a pleasure t o thank many colleagues for their help in preparing this paper, including particularly those from other National Meteorological and Hydrological Services, and also G. Wadge, J. Rodda, A. Askew, E. W. Friday, D. Griggs, A. Radford, A. Kent, the editor and a referee.
References
Askew, A. J., Miller, J. B. & Rodda, J. C. (1993). Countering natural disasters - a global view. In Natural Disasters, Pro- tecting Vulnerable Communities, ed. Merriman, P. A. & Browitt, C. W. A., pp. 130-139. Thomas Telford, London.
Aysan, Y. F. (1993). Vulnerability assessment. In Natuml Disasters, Protecting Vulnerable Communities, ed. Merri- man, I?. A. & Browitt, C. W. A., pp. 1-14. Thomas Tel- ford, London.
Buisson, L. & Charlier, C. (1989). Avalanche starting zone analysis with a knowledge based system. Ann. Glaciol.,
Chan, J. C. L. & Kay, Wai-Kau (1993). Performance of the United Kingdom Meteorological Office Global Model in predicting the movement of tropical cyclones. Wed. Forecasting, 8: 326-336.
Collier, C. G., Dixon, J., Harrison, M. S. J., Mitchell, J. F. B., Richardson, D. S. & Hunt, J. C. R. (1994). Extreme surface winds in mid-latitude climates. J. Wind Eng. Ind. Aero., 52: 1-27.
Davis, I. R. & Bickmore, D. (1993). Data management for disaster planning. In Natural Disasters, Protecting Vulner- able Communities, ed. Merriman, P. A. & Browitt, C. W. A., pp. 547-565. Thomas Telford, London.
Dawson, A. G., Shi, S., Smith, D. E. & Long, D. (1993). Geological investigations of tsunami generation and long- term tsunami frequency. In Natural Disasters, Protecting Vulnerable Communities, ed. Merriman, P. A. & Browitt, C. W. A., pp. 140-146. Thomas Telford, London.
13: 27-30.
I , I
istics in terms of rainfall over tropical Africa. Proceedings 9th Meteosat Users’ Meeting, Locarno, Switzerland.
Harrison, M. S. J., Ballentine, V. M., Buchanan, P. & Stobbs, R. J. (1991). Value of long-range forecasts to commercial users in the United Kingdom. Extended abstracts submit- ted to the ICTP/WMO International Technical Confer- ence on Long-Range Weather Forecasting Research, Long- Range Forecasting Research Report No. 14. WMO/TD
Heming, J. T., Chan, J. C. L. & Radford, A. M. (1995). A new scheme for the initiation of Tropical cyclones in the UK Meteorological Office global model. Meteorol. Appl. (Accepted for publication).
Houghton, J. T., Callender, B. A. & Varney, S. K. (1992). Climate Change: The Supplementary Report to the IPCC Scientific Assessment. Cambridge University Press, Cam- bridge, 200 pp.
Houghton, J. T., Jenkins, G. J. & Ephraums, J. J. (1990). Ciimate Change: The IPCC Scient4c Assessment. Cam- bridge University Press, Cambridge, 365 pp.
Kitchen, M., Brown, R. & Davies, A. G. (1994). Real-time correction of weather radar data for the effects of bright band, range and orographic growth in widespread rain. Q. J . R. Meteorol. SOC., 120: 1231-1254.
Lighthill, M. J. (1993). Final recommendations of the sympo- sium. In Tropical Cyclone Disasters, ed. Lighthill, M. J., Holland, G., Zhemin, 2. & Emanuel, K., pp. 582-587. Peking University Press, Beijing.
Main, I. G. (1993). The new physics and earthquake predic- tion. In Natural Disasters, Protecting Vulneraable Com- munities, ed. Merriman, P. A. & Browitt, C. W. A., pp. 238-251. Thomas Telford, London.
Mathess, G. & Rump-Schenk, B. (1993). Mass transports. In Naturkatastrophen und Katastrophen - Verbeugung, ed. Plate, E., et al., pp. 409-466. VCH, Weinheim (Germany).
Palmer, T. (1993). A nonlinear dynamical perspective on cli- mate change. Weather, 48: 314-326.
Plate, E., Clausen, L., de Haar, U., Kleeberg, H. B., Klein, G. Mathess, G., Roth, R. & Schmincke, H. U. (1993). Naturkatastrophen und Katastrophen - Verbeugung. VCH, Weinheim (Germany).
Punongbayan, R. S. (1994). A warning system for active vol- canoes and response to warnings. Proc. of Technical Comms. on Warning Systems at World Conf. on Natural Disaster Reductions, Yokohama, p. 85. World Met. Organ- isation, Geneva.
Schmincke, H. U., Behncke, B., Dehn, J. & Ippach, P. (1993). Volcanoes. In Naturkatastrophen und Katas- trophen - Verbeugung, ed. Plate, E., et al., pp. 353-408. VCH, Weinheim (Germany).
Simiu, E. & Scanlan, R. H. (1978). Wind Effects on Struc- tures. Wiley.
Wadge, G. (ed.) (1994). Natural Hazards and Remote Sens- ing. Proceedings of Royal Society, Royal Academy of Engineering Conference.
Wadge, G. & McKendrick, I. (1993). Computer simulation and zonation of lava flow hazards. In Natural Disasters, Protecting Vulnerable Communities, ed. Merriman, P. A. & Browitt, C. W. A., pp. 282-291. Thomas Telford, London.
NO. 395, 105-108.
63