forecasting with collaboration? - lancaster university · forecasting with collaboration? ... best...
TRANSCRIPT

Forecasting with Collaboration? © 2013 Crone & Weller, Lancaster Centre for Forecasting Page 1
Forecasting with Collaboration? The Gap between Theory and Practice
23 April 2013, The Work Foundation, London, UK
Dr. Sven F. CronePhD candidate Matt Weller
Assistant Professor - Director
Note: a complete written report is available! Please contact Dr. Sven F. Crone [email protected] to receive it
23 April 2013, The Work Foundation, London, UK
Dr. Sven F. CronePhD candidate Matt Weller
Assistant Professor - Director

This material has been created and copyrighted © by Lancaster Centre for Forecasting, Lancaster University Management School, all rights reserved.
You may use this material for your private educational purposes, so long as they are clearly identified as being created and copyrighted © by Lancaster Centre for Forecasting, Lancaster University Management School. You are not permitted to alter, change, or enhance them.
You may not use any of the content, text and images, in full or in part, in a tutorial, training, education, written papers, videos or other recordings. You are not permitted to distribute or make available directly or indirectly, within or outside your company, nor exploit them without explicit prior written permission from Lancaster Centre for Forecasting, Lancaster University Management School, email: [email protected]
Forecasting with Collaboration? © 2013 Crone & Weller, Lancaster Centre for Forecasting Page 2
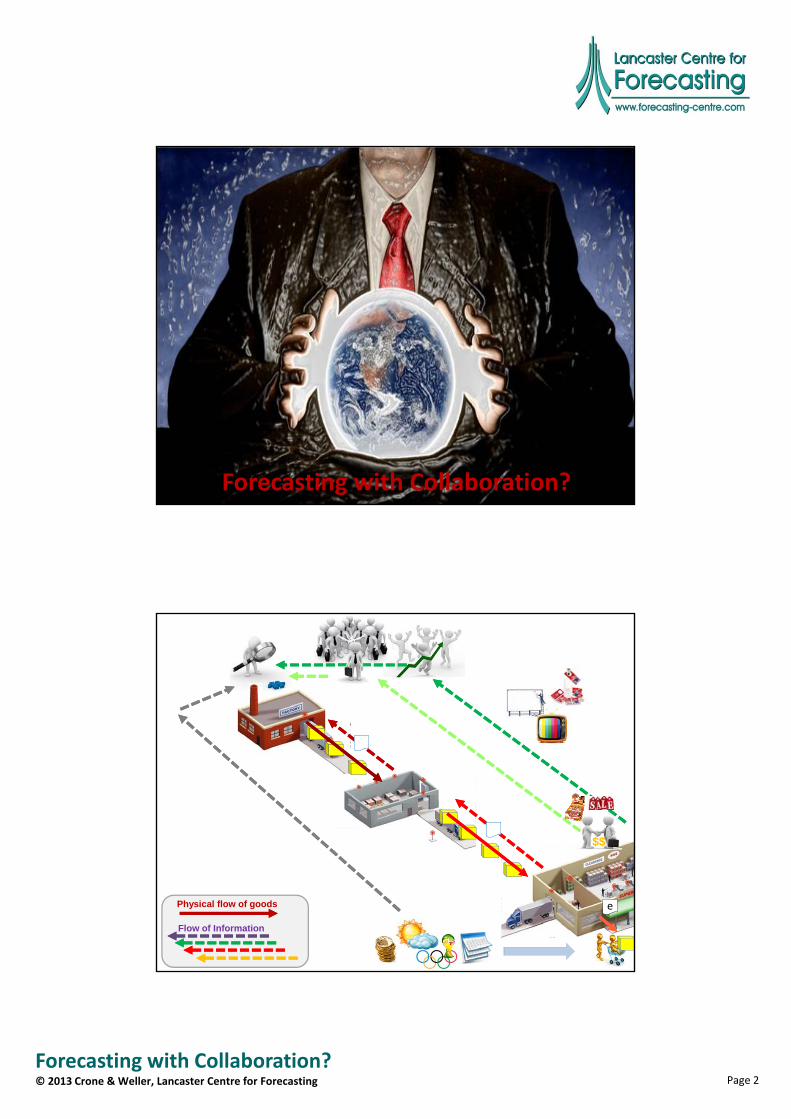
Forecasting with Collaboration?
ePhysical flow of goods
Flow of Information
$$

Forecasting with Collaboration? © 2013 Crone & Weller, Lancaster Centre for Forecasting Page 3
e
$$
Forecasting in Silos
e
$$
S&OP
Sales & Operations Planning

Forecasting with Collaboration? © 2013 Crone & Weller, Lancaster Centre for Forecasting Page 4
7‐Eleven, Inc.AAA HangersAbility Counts Incorporated CompanyAcme Distribution CentersADT SensormaticAIT Trimmings, Inc.Alfred Dunner, Inc.Alliance Hangers (Far East) LimitedArmy & Air Force Exchange ServiceBanner PharmacapsBest Buy Co., Inc.Black & Decker CorporationBon‐Ton Stores, Inc., TheBoscov's Inc.BraiformBrown Shoe Company, Inc.Byer CaliforniaCabela's, Inc.California Label ProductsCapco Wai Shing, LLCChevron Phillips Chemical CompanyColgate‐Palmolive CompanyCVS Caremark | CVS/pharmacyDefense Logistics AgencyDellDick's Sporting Goods, Inc.Dillard's, Inc.DIY HangersDonna Karan InternationalDynamic Worldwide Logistics, Inc.e‐Long Asia LimitedElizabeth Arden ‐Makeup, Cosmetics & SkincareERA GROUP INC.Ermenegildo Zegna CorporationEsquel Enterprises Ltd.Estee Lauder CompaniesEvergreen Plastic Bags Trading LimitedFedEx Freight
FineLine TechnologiesFishman & Tobin, Inc.Garmin InternationalGOH International, Ltd.Greatwide Logistics Services CompanyH.H. Brown Shoe Company, Inc.Hanesbrands, Inc.Hangerlogic, Inc. (formerly Batts Canada)Hangers PlusHewlett‐Packard CompanyHo Fat Hangers & Button Products Co., Ltd.Holt Renfrew & Company LimitedHome Depot, Inc., TheHudson's Bay CompanyIdeavillage Products Corp.JCPenneyJDM Sorting LLCJockey International, Inc.Johnson & Johnson Sales & Logistics Co.KANE IS ABLE INC.KDS AccessoriesKimberly‐Clark CorporationKohl's Department Stores Inc.Kraft Foods North AmericaLevi Strauss & Co.LF USA Inc.Limited Brands, Inc.Liz Claiborne Inc.Lowe's Companies, Inc.LVMH GroupMacy's, Inc.Mainetti GroupMark Bric, Inc.Meijer, Inc.Michael Kors LLCMotorola, Inc.National Retail Systems, Inc.NEO Zipper Co., Ltd.Nestle' PurinaNew Wide Group
Nike, Inc.Nintendo of America, IncNordstrom, Inc.Nygard International PartnershipOld Dominion Freight Line, Inc.Perry Ellis International Inc.Phillips‐Van Heusen Corp.Polo Ralph Lauren CorporationPoly‐Pak Industries, Inc.Procter & Gamble Company, TheQVC, Inc.r‐pac International Corp.Remac, Inc.RG Barry CorporationRyder Systems, Inc.Saks Inc.Samsung Electronics AmericaSauder Woodworking Co.Schering‐Plough Healthcare ProductsSchneider National, Inc.Sears Holdings CorporationSewing Collection, Inc.Sheen Master Industrial (Hong Kong) LimitedSimmons Bedding CompanySony Electronics, Inc.Sourcing Solutions InternationalSun Wing Hanger & Button Mfy. Ltd.SZKJ Plastic Corp.Target CorporationTerpac Plastics International Inc.The Accessory Corp / Hanger HeadquartersThe Clorox CompanyThe Jones GroupThe TJX Companies, Inc.TIC GROUP USA LLCUnileverUniplast Industries Inc.UPSUSA TACOMVF CorporationVisconti Garment Hangers, Inc.Wai Yip Plastic Mfy.Walmart Stores, Inc.Warnaco Group, Inc., TheWest Marine, Inc.West Point Home, Inc.William Carter CompanyWise Well Plastic Products Trading LimitedYRC Worldwide Corporation
Associate
AccentureAlixPartners, LLPAvery Dennison CorporationCheckpoint Systems, Inc.Data2 CorporationDemandTec, Inc.DICentral Corp.eBizprise Inc.GXSIBMJDA Software Group, Inc.Kurt SalmonManhattan Associates, Inc.Oliver Wight Americas, Inc.Oracle America, Inc.PTCRedPrairie CorporationSeeonic, Inc.SPS CommerceTrade & Standards
American Apparel & Footwear AssociatioChina National Textile and Apparel CounCouncil of Supply Chain Management Professionals (CSCMP)EPCglobal USGS1 CanadaGS1 USNational Retail FederationRetail Council of Canada (RCC)Retail Industry Leaders Association (RILARosettaNetOther
Edgewood Consulting GroupItem‐Level RFID Committee
VICS Members
S&OP is well established & Best Practices exists:
• Use statistics for baseline forecasting• Limit & constrain expert Judgment • Segment assortment ABC XYZ and focus on important items (in S&OP)
• Measure & track accuracy (FVA …)• …
S&OP focusses on exchangeof company internal information lack of external (downstream) information! How to integrate this?

Forecasting with Collaboration? © 2013 Crone & Weller, Lancaster Centre for Forecasting Page 5
e
$$
Sales & Operations Planning plus Contiinuous Replenishment
ePOS
Manufacturer receives ePOS data of consumer sales from retailer• Uses ePOS data to improve forecasting & reduce lead time
• Synchronises internal production scheduling & inventory activities with actual sales at retailers
• Retailer still prepares their individual

Forecasting with Collaboration? © 2013 Crone & Weller, Lancaster Centre for Forecasting Page 6
e
$$
Vendor managed Inventory(& Consignment Selling)
Manufacturer decides on appropriate inventory levels & policies of products • Manufacturer is responsible for creating & maintaining inventory plan
• Manufacturer creates orders (within previously agreed upon bounds)
• Ownership of inventory remains with downstream (Retail / 3PL) partner
Stocks
e
$$
Collaborative Planning, Forecastingand Replenishment
Forecasting with Collaboration? © 2013 Crone & Weller, Lancaster Centre for Forecasting Page 7
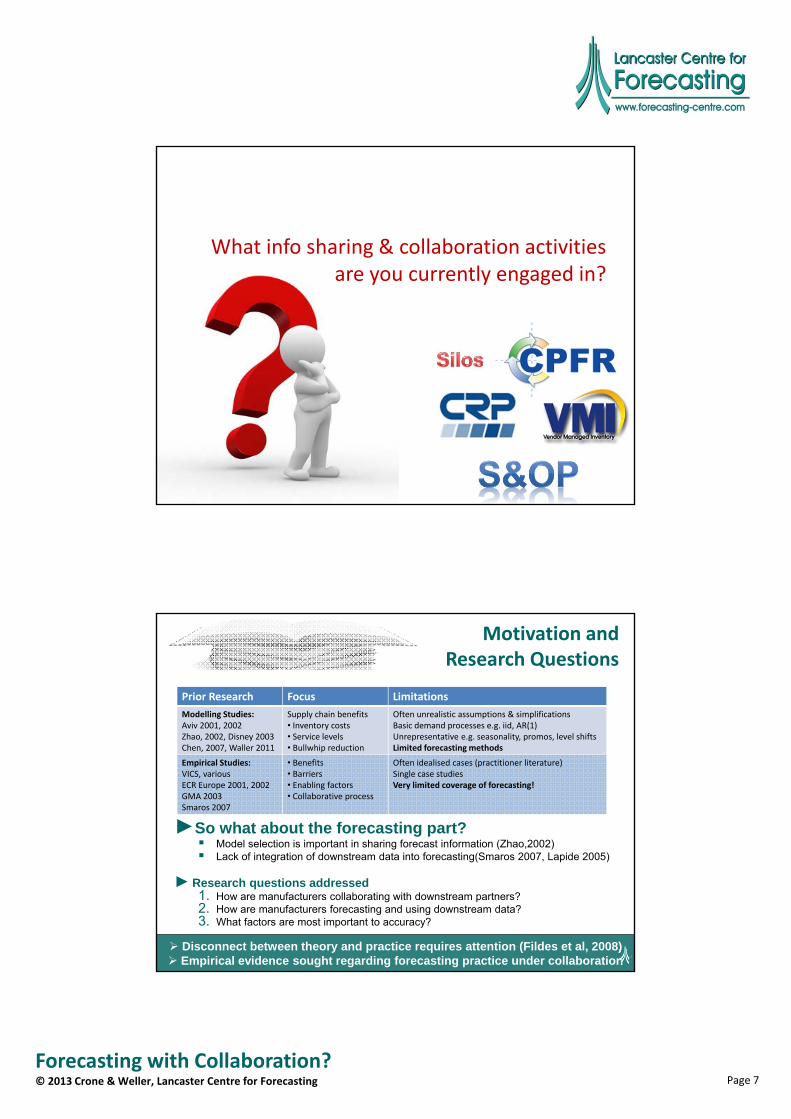
What info sharing & collaboration activitiesare you currently engaged in?
Disconnect between theory and practice requires attention (Fildes et al, 2008) Empirical evidence sought regarding forecasting practice under collaboration
Motivation and Research Questions
►So what about the forecasting part? Model selection is important in sharing forecast information (Zhao,2002) Lack of integration of downstream data into forecasting(Smaros 2007, Lapide 2005)
►Research questions addressed1. How are manufacturers collaborating with downstream partners?2. How are manufacturers forecasting and using downstream data?3. What factors are most important to accuracy?
Prior Research Focus Limitations
Modelling Studies:Aviv 2001, 2002Zhao, 2002, Disney 2003Chen, 2007, Waller 2011
Supply chain benefits• Inventory costs• Service levels• Bullwhip reduction
Often unrealistic assumptions & simplificationsBasic demand processes e.g. iid, AR(1)Unrepresentative e.g. seasonality, promos, level shiftsLimited forecasting methods
Empirical Studies:VICS, variousECR Europe 2001, 2002GMA 2003Smaros 2007
• Benefits• Barriers• Enabling factors• Collaborative process
Often idealised cases (practitioner literature)Single case studiesVery limited coverage of forecasting!

Forecasting with Collaboration? © 2013 Crone & Weller, Lancaster Centre for Forecasting Page 8
200 complete surveys from forecasters in Manufacturing 173 classified in comprehensive group of collaboration
• Questionaire Design– Pilot study in 2011 (to ensure validity)– Final version pre‐tested with 18 FMCG forecasters– Questionnaire implemented online– Conducted January 2012‐August 2012
• Survey Sample Design– Specified target group: demand planning &
forecasting professionals (in manufacturing)– LCF Mailing list, forecasting lists / blogs (ISF, SAS)– 100s of LinkedIn Groups – 2000+ personalised LinkedIn invites– Multiple reminders sent
• Response– 540 responses
• 260 incomplete (reminders send, to only speculative interest, unwilling to give email address (although not mandatory), Atrophy (number of repeated questions), unsuitable respondent (industry sector & position)
• 15 complete responses discarded (Consultants/academics, rushed surveys (10‐15 mins), highly inconsistent answers, middle‐clicking { same answer for every question in groups)
Study MethodologySurvey of Practitioners
mostly large manufacturers active in the FMCG / CPG industry
Study MethodologyDemographics of Respondents

Forecasting with Collaboration? © 2013 Crone & Weller, Lancaster Centre for Forecasting Page 9
OrganisationalView
Data View
FunctionalView
Control(Process) View
Survey ResultsOrganisational Setup
Companies are engaged in multiple organisational schemes
85% of companies are engaged in multiple schemes(S&OP plus >>Info >>CPFR >>VMI)
Still forecasting in Silos? You are the last one … ;‐)
Most companies are engaged in S&OP (unclear how formalised)
O
D FP
Companies are most strongly
engaged in S&OP(least in CPFR)

Forecasting with Collaboration? © 2013 Crone & Weller, Lancaster Centre for Forecasting Page 10
grouped responses : CPFR and S&OP dominate sample reponses
6259
2718
277
27 responses did not clearly fit a scheme & were
excluded
Survey ResultsOrganisational Setup
O
D FP
most companies are engaged in multiple collaboration schemes in parallel … should receive substantial amounts of internal + external data!
… run multiple planning processes in parallel. SUPRISING!
8%
6%
34%
52%
Number of IS&C Schemes engaged in
No external IS&C
S&OP + 1 externalIS&C scheme
S&OP + 2 externalIS&C schemes
S&OP + 3 externalIS&C schemes
Over half of companies
engage in S&OP, IS, VMI and CPFR simultaneously!
ResultsO
D FP

Forecasting with Collaboration? © 2013 Crone & Weller, Lancaster Centre for Forecasting Page 11
Planners run S&OP, CRP, VMI, CPFR … in parallel!
(different data exchanged, different client contacts, different planning frequencies …)
… requires goodMultitasking!
(It can be done, with standardised Data & supporting IT Systems)
O
D FP
On average, more internal data is available than external (despite IS&C) (as expected) IS&C schemes have more external data available
Survey ResultsData Exchange
Less for silos ….
Internal data widely available (across schemes, effect of S&OP)
**
Never for silos ….
O
D FP
External info shows different availability by CPFR >> VMI …
External info shows different availability by CPFR >> VMI …
External info shows different availability by CPFR >> VMI …

Forecasting with Collaboration? © 2013 Crone & Weller, Lancaster Centre for Forecasting Page 12
…
Survey ResultsData Exchange
Company internal data soucres!
VMI has least info on DC orders & shipments (?!?) Ta
nsa
ctio
nal
Dat
aC
au
sa
lDa
ta
Silos have only little/least internal
info available
CPFR (Marketing focused) receives more Promo info
Silos have only little/least internal
info available
Silos have only little/least internal
info available
VMI has least info on DC orders & shipments (?!?)
CPFR (Marketing focused) receives more Promo info
CPFR (Marketing focused) receives more Promo info
O
D FP
…
Survey ResultsData Exchange
Company external data soucres!
Surprisingly many external data
types available !
CPFR has more info available
> VMI > IS > S&OP
essential VMI info is not available
essential VMI info is not available
Limited ePOS data available across schemes
S&OP receives little external information Surprisingly many
external data types available !
Surprisingly many & heterogeneous external data
types available !
No external data is always available (Promos for CPFR. DC stock for VMI) !
O
D FP

Forecasting with Collaboration? © 2013 Crone & Weller, Lancaster Centre for Forecasting Page 13
Choice of 6 transactional data sources is always available Up to 18 (5 internal + 13 external) data sources sometimes available
Survey ResultsData Exchange
Internal info more available than external info
Internal info more available than external info
Myriad of information is available!
O
D FP
Amount of information = Information overload!
How do I chase the missing data?
What else do I expect will likely happen?
What will rather not happen?
Why do I have to spend my time on this?
I should be out there making forecasts!
Maybe next month ….

Forecasting with Collaboration? © 2013 Crone & Weller, Lancaster Centre for Forecasting Page 14
What data do you share?
…
Survey ResultsData Exchange
Info is shared only medium horizons of 5‐8 weeks out
Data is exchanged by unstructured means (eMail …)
Structured Data is mostly for CPFR & VMI (but still rare for a standard)
O
D FP

Forecasting with Collaboration? © 2013 Crone & Weller, Lancaster Centre for Forecasting Page 15
…
Survey ResultsData Exchange
Data is not exchanged in a standardised or consistent form
O
D FP
Data arrives in heterogeneous formats …
… how to harmonise& integrate into systems?

Forecasting with Collaboration? © 2013 Crone & Weller, Lancaster Centre for Forecasting Page 16
Repetitive data collection & transformation
(productive) Value Added activity?
… rather a time killer!

Forecasting with Collaboration? © 2013 Crone & Weller, Lancaster Centre for Forecasting Page 17
…
Survey ResultsData Exchange
Spreadsheets are most widely & regularly used
O
D FP
…
Survey ResultsData Exchange
Few individuals are really happy
;‐)
O
D FP

Forecasting with Collaboration? © 2013 Crone & Weller, Lancaster Centre for Forecasting Page 18
What systems do you use?
25% of all judgment + 76% of stats (57%) 82 % of forecasts are made with simple Methods
25% pure expert
Judgment
43% use simplest methods only for level time series
(28% MA+15% Naive)
43% use simplest methods only for level time series
(28% MA+15% Naive)
Only 10% of methods are capable to integrate causal
drivers in forecasting (Promos, DC stock …)
Only 10% of methods are capable to integrate causal
drivers in forecasting (Promos, DC stock …)
Survey ResultsAlgorithm Usage
O
D FP

Forecasting with Collaboration? © 2013 Crone & Weller, Lancaster Centre for Forecasting Page 19
What algorithms do you use?
Use of judgment on myriad of data sources?
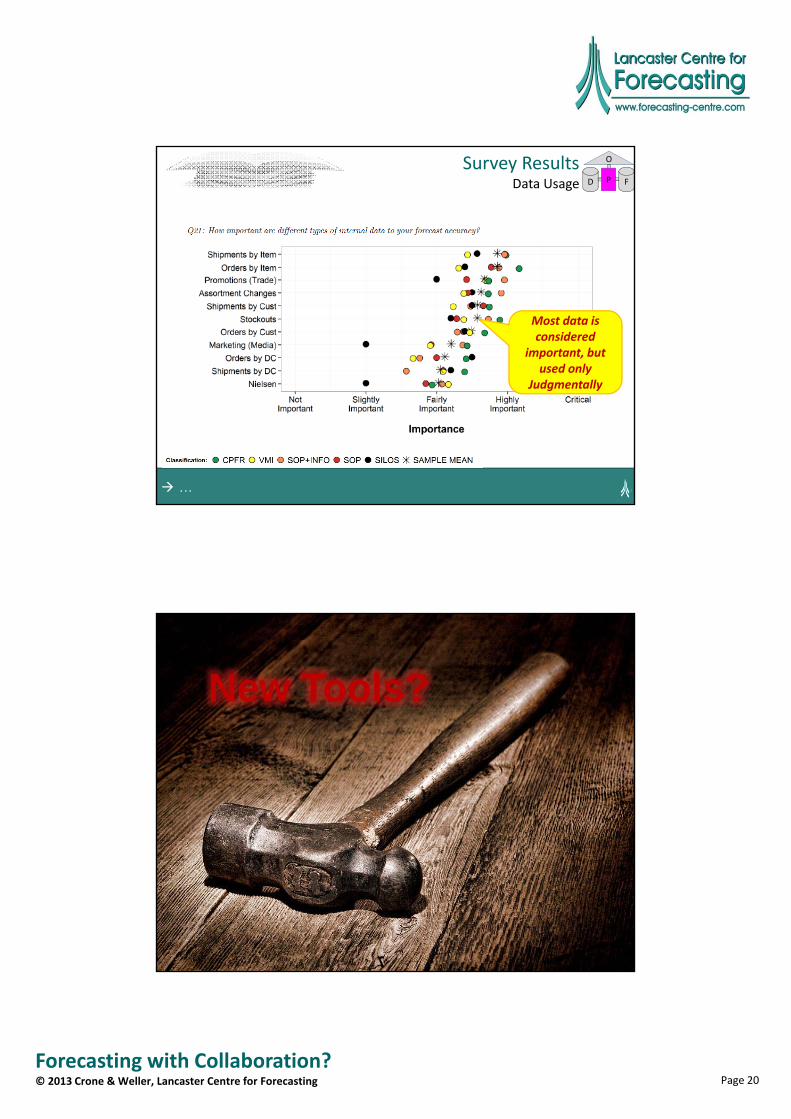
Survey ResultsData Usage
O
D FP
NONE of the data is not used purely
statistically!
Forecasting with Collaboration? © 2013 Crone & Weller, Lancaster Centre for Forecasting Page 20
…
Survey ResultsData Usage
O
D FP
Most data is considered
important, but used only
Judgmentally
New Tools?

Forecasting with Collaboration? © 2013 Crone & Weller, Lancaster Centre for Forecasting Page 21
Naive Method(s)
New Tools!
“It can drive a 6‐D nail thru a
2 X 4 at 200 yards”

Forecasting with Collaboration? © 2013 Crone & Weller, Lancaster Centre for Forecasting Page 22
Brown (1956)
Box & Jenkins (1970)
Rumelhart & McClelland (1986).
“the number of components in integrated circuits (IC) has doubled every year from its invention in 1958 until 1965” predicted that the trend would continue "for at least ten years"
Moore (1965)
Breiman(1996)
Breiman(2001)
Freund & Schapire(1997)
Boser, Guyon, and Vapnik (1992)
Pearl & Reed (1920)!
Does your vehicle fleet look like this?
BMW Isetta (1956-1962)
Austin Healey 3000 (1959)

Forecasting with Collaboration? © 2013 Crone & Weller, Lancaster Centre for Forecasting Page 23
Man and woman shown working with IBM type 704 electronic data processing machine used for making computations for aeronautical research.
Date 21 March 1957Working with IBM type 704 electronic data processing machine used for making computations for aeronautical research.21 March 1957, NASA
Does your hardware look like this?
Do your employees look like this?

Forecasting with Collaboration? © 2013 Crone & Weller, Lancaster Centre for Forecasting Page 24
Then why do youralgorithms look like this?
∙ ∙
∙ ∙
∙ ∙
∙ ∙
© Scorcher publications (1956) Pamphlet reproduction on the revolution in Hungary 1956, Series of Council Communist Pamphlets.

Forecasting with Collaboration? © 2013 Crone & Weller, Lancaster Centre for Forecasting Page 25
… talking about TECHNOLOGY!
Ask yourself …
Can you affordto ignore 60 years
of progress?

Forecasting with Collaboration? © 2013 Crone & Weller, Lancaster Centre for Forecasting Page 26
ARE you asking yourself?(… just checking!)
Review youralgorithm‘s
maturity!

Forecasting with Collaboration? © 2013 Crone & Weller, Lancaster Centre for Forecasting Page 27
Upgrade to 1970s technology … ?
Siemens System 4004
Intel 4004 (4-bit bus, 108-KHz CPU chip, 1971)
OCC1 Osborne 1 Personal Business Computer
busicom calculator 141P(Intel 4004 powered Datapoint 2200 (1972)
…ARIMAX
Multiple Regression
…
Survey ResultsAccuracy
O
D FP

Forecasting with Collaboration? © 2013 Crone & Weller, Lancaster Centre for Forecasting Page 28
…
Survey ResultsAccuracy
O
D FP
…
Survey ResultsHow to improve?
O
D FP

Forecasting with Collaboration? © 2013 Crone & Weller, Lancaster Centre for Forecasting Page 29
…
Survey ResultsHow to improve?
O
D FP
Take aways
• Companies are engaging in multiple Info Sharing & Collaboration schemes simultaneously does this Multitasking add value?
• Demand Planners are overloaded with Data which data sources add value & Information?
• Demand planners receive unstructured Data tedious data processing jobs kill valuable time
• Lack of systems support Excel is great for data gathering, not forecasting!
• Comanies ignore newer algorithsm that can help! algorithms exist to integrate data automatically
• Review your Collaborative practices try new approaches to forecasting & using info!
… making Collaboration work !

Forecasting with Collaboration? © 2013 Crone & Weller, Lancaster Centre for Forecasting Page 30
… Discussion?
Matt Weller
Dr. Sven F. CroneAssistant Professor, Director
Lancaster University Management SchoolResearch Centre for Forecasting
Lancaster, LA1 4YXTel. +44 1524 5‐92991
Questions?

Forecasting with Collaboration? © 2013 Crone & Weller, Lancaster Centre for Forecasting Page 31
Matt WellerDr. Sven F. Crone
Assistant Professor, DirectorLancaster University Management School
Research Centre for Forecasting
Lancaster, LA1 4YXTel. +44 1524 5‐92991
Copyright
These slides are from a workshop on collaborative forecasting.
You may use these slides for internal purpose, so long as they are clearly identified as being created and copyrighted © by Matt Weller and Dr. Sven F. Crone, Lancaster Centre for Forecasting.
You may not use the text and images in a paper, tutorial or external training without explicit prior permission from the centre.