forecasting tropical cyclones: overview and issues for
TRANSCRIPT

Forecasting Tropical Cyclones:
Overview and Issues for Congress
Updated August 11, 2020
Congressional Research Service
https://crsreports.congress.gov
R46416

Congressional Research Service
SUMMARY
Forecasting Tropical Cyclones: Overview and Issues for Congress Timely tropical cyclone forecasts can provide early and accurate warnings to parts of the U.S. coastline vulnerable to tropical cyclone impacts. Recent hurricane seasons have
included several major hurricanes—such as Dorian in 2019 and Florence, Lane,
Michael, and Olivia in 2018—which resulted in multiple deaths and billions of dollars
of damage in the southeastern United States and Hawaii, among other places. The
National Oceanic and Atmospheric Administration (NOAA) is the federal agency responsible for tropical cyclone forecasts, including track, intensity, storm surge, and rainfall forecasts. NOAA defines tropical cyclones as
tropical depressions, tropical storms, hurricanes, and major hurricanes, and the agency makes tropical cyclone
forecasts using data from multiple observational tools—satellites, reconnaissance aircraft, ships, radar, and buoys, among others.
Each year, NOAA releases outlooks for three ocean regions—Atlantic, eastern Pacific, and central Pacific .
Although the outlooks typically cover all types of tropical cyclones, the agency uses the term “hurricane” in the
outlook title. The north Atlantic and eastern Pacific outlooks include the predicted number of named storms (with
winds 39 miles per hour or greater), hurricanes, and major hurricanes. The central Pacific outlook forecasts the total number of tropical cyclones expected.
In May 2020, NOAA released its 2020 hurricane season outlooks for the Atlantic, eastern Pacific, and central
Pacific regions. NOAA predicted an above-normal season in the Atlantic, with 13 to 19 named storms, 6 to 10 hurricanes, and 3 to 6 major hurricanes. (Some nonfederal entities predicted a near-normal to above-normal
Atlantic hurricane season.) In August 2020, NOAA updated its Atlantic outlook, calling for 19 to 25 named
storms, 7 to 11 hurricanes, and 3 to 6 major hurricanes. In its May outlook, the agency anticipated that the eastern
and central Pacific regions would most likely experience a near-normal season. The forecasts included 11 to 18
named storms, 5 to 10 hurricanes, and 1 to 5 major hurricanes in the eastern Pacific and between 2 and 6 tropical cyclones in the central Pacific. The agency does not release an updated outlook for the eastern and central Pacific regions.
In 2017, Congress enacted the Weather Research and Forecasting Act (P.L. 115-25), which included provisions regarding hurricane forecasting and warnings. Members of Congress continue to be interested in the potential
impacts of climate change on tropical cyclones and the challenges in accurately forecasting certain aspects—such
as intensity, storm surge, and precipitation—of tropical cyclones. Some Members also may consider potential
impacts on tropical cyclone forecasting due to shifts in the NOAA’s and private sector’s roles in the weather
enterprise. Some stakeholders advocate for retaining the current distribution of responsibilities; other stakeholders believe changes in responsibility are already occurring and should, in some cases, continue or expand. Members
also may continue to consider the potential for interference from fifth-generation telecommunications (5G)
technology on NOAA and other federal satellite sensors. For instance, some stakeholders have argued that
interference could impact the quality of data used for hurricane forecasting, among other activities. Others have rejected interference claims altogether, among other views.
R46416
August 11, 2020
Eva Lipiec Analyst in Natural
Resources Policy

Forecasting Tropical Cyclones: Overview and Issues for Congress
Congressional Research Service
Contents
Forecasting Tropical Cyclones .......................................................................................... 1
Collecting Data ......................................................................................................... 2 Analyzing the Data .................................................................................................... 3 Forecasts and Warnings .............................................................................................. 4
NOAA’s Seasonal Hurricane Outlooks ............................................................................... 6
2020 Hurricane Season Outlooks ................................................................................. 7
Issues for Congress ......................................................................................................... 9
Impacts of Climate Change on Tropical Cyclones ........................................................... 9 Forecasting Certain Aspects of Tropical Cyclones......................................................... 10 NOAA Interactions with the Private Sector Weather Enterprise....................................... 14 Potential 5G Technology Interference with Satellite Sensors........................................... 17
NOAA’s Use of the 23.8 Gigahertz Frequency........................................................ 17 Federal Frequency Management ........................................................................... 18 NOAA and Other Stakeholder Concerns—Selected Timeline .................................... 18
Figures
Figure 1. 96 Hour Track Error vs. Consistency .................................................................... 4
Figure 2. Storm Surge and Storm Tide ................................................................................ 6
Figure 3. NHC Official Average Track Errors Comparison .................................................. 11
Figure 4. NHC Official Average Intensity Errors Comparison .............................................. 12
Figure A-1. Hurricane Dorian’s Track .............................................................................. 26
Figure A-2. Hurricane Humberto’s Track .......................................................................... 28
Figure A-3. Hurricane Lorenzo’s Track ............................................................................ 30
Figure B-1. Hurricane Florence’s Track ............................................................................ 34
Figure B-2. Hurricane Michael’s Track............................................................................. 37
Figure B-3. Hurricane Lane’s Track ................................................................................. 41
Figure B-4. Hurricane Olivia’s Track ............................................................................... 43
Tables
Table 1. Seasonal Means and Ranges for Atlantic Named Storms ........................................... 7
Table 2. Seasonal Means for Eastern Pacific Named Storms .................................................. 7
Table 3. 2020 Atlantic Hurricane Season Seasonal Outlooks .................................................. 8
Table 4. 2020 Eastern Pacific Hurricane Season Seasonal Outlook.......................................... 9
Table A-1. 2019 Atlantic Hurricane Season: Comparison Between Seasonal Outlook and
Actual Storms ............................................................................................................ 23

Forecasting Tropical Cyclones: Overview and Issues for Congress
Congressional Research Service
Table A-2. NHC Official Track Forecast Errors for Hurricane Dorian Compared with the
2014-2018 Average..................................................................................................... 26
Table A-3. NHC Official Intensity Forecast Errors for Hurricane Dorian Compared with
the 2014-2018 Average................................................................................................ 27
Table A-4. NHC Official Track Forecast Errors for Hurricane Humberto Compared with
the 2014-2018 Average................................................................................................ 29
Table A-5. NHC Official Intensity Forecast Errors for Hurricane Humberto Compared
with the 2014-2018 Average......................................................................................... 29
Table A-6. NHC Official Track Forecast Errors for Hurricane Lorenzo Compared with the
2014-2018 Average..................................................................................................... 31
Table A-7. NHC Official Intensity Forecast Errors for Hurricane Lorenzo Compared with
the 2014-2018 Average................................................................................................ 31
Table A-8. 2019 Eastern Pacific Hurricane Season: Comparison Between Seasonal
Outlook and Actual Storms .......................................................................................... 32
Table B-1. 2018 Atlantic Hurricane Season: Comparison Between Seasonal Outlook and
Actual Storms ............................................................................................................ 33
Table B-2. NHC Official Track Forecast Errors for Hurricane Florence Compared with
the 2013-2017 Average................................................................................................ 35
Table B-3. NHC Official Intensity Forecast Errors for Hurricane Florence Compared with
the 2013-2017 Average................................................................................................ 35
Table B-4. NHC Official Track Forecast Errors for Hurricane Michael Compared with the
2013-2017 Average..................................................................................................... 38
Table B-5. NHC Official Intensity Forecast Errors for Hurricane Michael Compared with
the 2013-2017 Average................................................................................................ 38
Table B-6. 2018 Eastern Pacific Hurricane Season: Comparison Between Seasonal
Outlook and Actual Storms .......................................................................................... 39
Table B-7. NHC Official Track Forecast Errors for Hurricane Lane Compared with the
2013-2017 Average..................................................................................................... 41
Table B-8. NHC Official Intensity Forecast Errors for Hurricane Lane Compared with the
2013-2017 Average..................................................................................................... 42
Table B-9. NHC Official Track Forecast Errors for Hurricane Olivia Compared with the
2013-2017 Average..................................................................................................... 44
Table B-10. NHC Official Intensity Forecast Errors for Hurricane Olivia Compared with
the 2013-2017 Average................................................................................................ 44
Table B-11. 2018 Central Pacific Tropical Cyclone Season:
Comparison Between Seasonal Outlook and Actual Storms .............................................. 45
Appendixes
Appendix A. 2019 Hurricane Season Outlooks and Overviews ............................................. 23
Appendix B. 2018 Hurricane Season Outlooks and Overviews ............................................. 33
Contacts
Author Information ....................................................................................................... 45

Forecasting Tropical Cyclones: Overview and Issues for Congress
Congressional Research Service

Forecasting Tropical Cyclones: Overview and Issues for Congress
Congressional Research Service 1
he potential for widespread destruction to parts of the U.S. coastline underscores the value
of timely hurricane—or more broadly, tropical cyclone—forecasts as a means for
providing early and accurate warnings to affected communities. The National Oceanic and
Atmospheric Administration (NOAA) is the federal agency responsible for tropical cyclone
forecasting, including track, intensity, storm surge, and rainfall forecasts. The agency reports on how accurate the forecasts are compared with the actual events, calculates damages, and more.
A variety of terms can be used to describe these types of storms (see text box below). This report
uses the terms storm and tropical cyclone and provides a description of how NOAA’s National Hurricane Center (NHC) forecasts tropical cyclone tracks, intensities, and effects. The report also
discusses potential issues for Congress, including challenges with tracking and forecasting
tropical cyclones and the potential impacts of climate change on tropical cyclones. The report
then provides an overview of forecasts for the 2020 hurricane season. The report includes two
appendices (Appendix A and Appendix B) with information about the 2019 and 2018 hurricane seasons.
Forecasting Tropical Cyclones NHC, part of NOAA’s National Weather Service (NWS), is responsible for forecasting tropical
cyclones, including hurricanes in the Atlantic and Pacific Oceans.1 NHC provides estimates of the
path or track, intensity or wind speed, size, and structure of the storm, as well as predictions of
storm surge, precipitation, and tornadoes associated with these storms.2 NOAA may use this information to issue a hurricane watch or a hurricane warning and public advisories.3
1 National Oceanic and Atmospheric Administration (NOAA) National Hurricane Center (NHC), “About the National
Hurricane Center,” at https://www.nhc.noaa.gov/aboutintro.shtml. 2 University of Rhode Island Graduate School of Oceanography (URI GSO), “ National Hurricane Center Forecast
Process,” at http://www.hurricanescience.org/science/forecast/forecasting/forecastprocess/. Hereafter URI GSO,
“National Hurricane Center Forecast Process.”
3 A hurricane watch is an announcement that hurricane conditions—sustained winds 74 miles per hour (mph) or
greater—are possible within a specified coastal area, usually issued 48 hours in advance of the onset of tropical storm
force winds. A hurricane warning is issued when hurricane conditions are expected somewhere within the specified
coastal area. URI GSO, “National Hurricane Center Forecast Process.”
T
Tropical Cyclones, Storms, and Hurricanes
The National Oceanic and Atmospheric Administration (NOAA) defines a tropical cyclone as a “rotating, organized
system of clouds and thunderstorms that originates over tropical or subtropical waters and has a closed low-level
circulation.” Cyclones rotate counterclockwise in the Northern Hemisphere and clockwise in the Southern
Hemisphere. Tropical cyclones that form between 5o and 30o North latitude typically move westward. According
to NOAA, tropical cyclones include the following:
Tropical Depression—a tropical cyclone with maximum sustained winds of 38 miles per hour (mph) or less.
Tropical Storm—a tropical cyclone with maximum sustained winds of 39 to 73 mph.
Hurricane—a tropical cyclone with maximum sustained winds of 74 mph or higher. Hurricanes are called
typhoons in the western North Pacific Ocean and cyclones in the Indian Ocean and South Pacific Ocean.
Major Hurricane—a tropical cyclone with maximum sustained winds of 111 mph or higher, corresponding to
a category 3, 4, or 5 on the Saffir-Simpson Hurricane Wind Scale.
Source: National Hurricane Center, “Tropical Cyclone Climatology,” at https://www.nhc.noaa.gov/climo/.

Forecasting Tropical Cyclones: Overview and Issues for Congress
Congressional Research Service 2
Collecting Data
Storm forecasts involve many components and use a broad array of resources and capabilities within NOAA and NWS, all of which are coordinated and interpreted by NHC.4 The process
begins with observations; satellites, aircraft, ships, buoys, radar, and other sources provide data
used to create storm-track and intensity predictions. Most Atlantic hurricanes, for example, begin
to form west of Africa over the ocean.5 NOAA weather satellites, including two Geostationary
Operational Environmental Satellites (GOES; known as GOES-East and GOES-West) and polar-orbiting weather satellites, provide remote-sensing observations in the Atlantic and Pacific basins.6
NOAA and U.S. Air Force aircraft, known as “Hurricane Hunters,” fly directly into and above the storm to collect real-time data if a tropical cyclone is judged to pose a threat to the U.S.
coastline.7 The Chief, Aerial Reconnaissance Coordination, All Hurricanes (CARCAH) unit
coordinates all tropical cyclone operation reconnaissance in accordance with the National
Hurricane Operations Plan.8 Data collected from the Hurricane Hunters and other aircraft (e.g.,
the National Aeronautics and Space Administration [NASA] Global Hawk) are checked at the CARCAH and provided to NHC forecasters.9 Land-based radars begin to provide NHC with
precipitation and wind-velocity data once the storm is approximately 280 miles from the coast.
Automated Surface Observation Systems instruments provide additional ground-based
measurements when the storm is close to shore or makes landfall.10 Information from other systems, such as ships and buoys, is also included in forecasts.
4 Although the entire federal hurricane forecast effort is broader than NOAA, this report focuses on NHC’s. The
National Hurricane Operations Plan outlines various agency responsibilit ies across the federal government. See Office
of the Federal Coordinator for Meteorology (OFCM), National Hurricane Plan, at https://www.ofcm.gov/publications/
nhop/nhop2.htm. Hereafter OFCM, National Hurricane Operations Plan. 5 For more information about why hurricanes may threaten the U.S. East Coast and not the U.S. West Coast, see “Why
Do Hurricanes Hit the East Coast of the U.S. but Never the West Coast?,” Scientific American, October 21, 1999, at
https://www.scientificamerican.com/article/why-do-hurricanes-hit-the-east-coast-of-the-u-s-but-never-the-west-coast/.
6 URI GSO, “National Hurricane Center Forecast Process.” Generally, Geostationary Operational Environmental
Satellite-West (GOES-West) covers the east and central Pacific Ocean and GOES-East covers most of the Atlantic
Ocean. The Japanese Himawari 8 satellite covers the west and central Pacific Ocean, and the Japan Meteorological
Agency shares the satellite’s images with NOAA and the public. URI GSO, “Geostationary Satellites,” at
http://www.hurricanescience.org/science/observation/satellites/geostationary/; email correspondence with NOAA
Office of Legislative Affairs, January 24, 2020; and NOAA, “Full Disk: Himawari-8,” at https://www.goes.noaa.gov/
f_himawari-8.html. 7 NOAA Hurricane Hunters are specially equipped aircraft that collect data during hurricanes. The NOAA fleet
includes two Lockheed WP-3D Orion four-engine turboprop aircraft and one Gulfstream IV-SP jet aircraft. The WP-3D
aircraft fly directly into hurricanes during the storms and collect in-situ data on winds and atmospheric pressures,
among other measurements. The IV-SP jet flies at higher altitudes and collects critical information on the “steering”
winds that affect the hurricane track, among other data. NOAA, Office of Marine and Aviation Operations, “ NOAA
Hurricane Hunters,” at https://www.omao.noaa.gov/learn/aircraft-operations/about/hurricane-hunters. The 53rd Weather
Reconnaissance Squadron, a component of the 403 rd Wing of the U.S. Air Force located at Keesler Air Force Base in
Biloxi, MS, flies 10 WC-130J Hercules aircraft into hurricanes during weather reconnaissance missions. 403 rd Wing,
“53rd Weather Reconnaissance Squadron ‘Hurricane Hunters,’” at http://www.403wg.afrc.af.mil/About/Fact-Sheets/
Display/Article/192529/53rd-weather-reconnaissance-squadron-hurricane-hunters/. 8 The Chief, Aerial Reconnaissance Coordination, All Hurricanes (CARCAH) is a subunit of the 53 rd Weather
Reconnaissance Squadron, U.S. Air Force. OFCM, National Hurricane Operations Plan.
9 National Aeronautics and Space Administration (NASA) , Armstrong Flight Research Center, “ Global Hawk,” at
https://www.nasa.gov/centers/armstrong/aircraft/GlobalHawk/index.html.
10 URI GSO, “Automated Surface Observation Systems (ASOS),” at http://www.hurricanescience.org/science/
observation/landbased/automatedsurfaceobssystems/.

Forecasting Tropical Cyclones: Overview and Issues for Congress
Congressional Research Service 3
Analyzing the Data
NHC gathers observational data as a tropical cyclone approaches the U.S. coastline and uses the data to generate a series of forecast computer model simulations.11 Tropical cyclone forecast
model simulations typically predict the track (the path) and intensity (the wind speeds) over a
period of three to five days.12 Available observational data provide a baseline for the model, which then uses mathematical equations to produce forecasts.
Tropical cyclone forecast models vary. They may differ in how they process information, such as
when observations are fed into the model, which equations they use, how they make forecasts
from the solutions to the equations, and other factors. These differences explain why NHC
forecasts may differ from those of other countries or institutions (e.g., the European Center for Medium-Range Forecasts produces Atlantic forecasts, as do some research institutions within the United States, such as the National Center for Atmospheric Research).13
NHC forecasters analyze the model results and use their experience and expertise to adjust model forecasts. NHC measures forecast skill by comparing the adjusted forecasts, model-only forecasts,
and a baseline forecast.14 For example, NHC-adjusted forecasts of Atlantic tropical cyclone tracks
at the 96-hour mark have been more accurate than specific model-only forecasts for the last three
years (Figure 1).15 NHC-adjusted forecasts have also been more consistent than model-only
forecasts in the last three years, meaning the NHC forecast “holds steady more than the models” between predictions made every 12 hours, avoiding large track shifts or storm speed changes (Figure 1).16
11 URI GSO, “Hurricane Forecast Models,” at http://www.hurricanescience.org/science/forecast/models/. Hereafter
URI GSO, “Hurricane Forecast Models.” 12 Hurricane intensity generally is measured as highest sustained wind speeds. However, that measurement does not
take into consideration the storm-surge or precipitation-caused flooding, both of which may be among the most
dangerous elements of a hurricane.
13 The European Centre for Medium-Range Weather Forecasts (ECMWF) is an independent, intergovernmental
organization supported by 34 countries. It produces global numerical weather forecasts using weather models.
ECMWF, “Advancing Global NWP Through International Collaboration,” at https://www.ecmwf.int/; and URI GSO,
“Hurricane Forecast Models.” 14 According to NOAA, the baseline model “makes forecasts based on a combination of what past storms with similar
characteristics—like location, intensity, forward speed, and the time of year—have done ... and a continuation of what
the current storm has been doing.... This model contains no information about the current state of the atmosphere and
represents a ‘no-skill’ level of accuracy.” NOAA, “Skill or Luck? How NHC’s Hurricane Track Forecasts Beat the
Models,” April 9, 2020, at https://noaanhc.wordpress.com/2020/04/09/skill-or-luck-how-nhcs-hurricane-track-
forecasts-beat-the-models/. Hereafter NOAA, “Skill or Luck?”
15 NOAA, “Skill or Luck?” 16 NOAA, “Skill or Luck?”

Forecasting Tropical Cyclones: Overview and Issues for Congress
Congressional Research Service 4
Figure 1. 96 Hour Track Error vs. Consistency
2017-2019 in the Atlantic basin
Source: National Oceanic and Atmospheric Administration (NOAA), “Skill or Luck? How NHC’s Hurricane
Track Forecasts Beat the Models,” April 9, 2020, at https://noaanhc.wordpress.com/2020/04/09/skill-or-luck-
how-nhcs-hurricane-track-forecasts-beat-the-models/.
Notes: n mi = nautical miles; ECMWF = European Centre for Medium Range Weather Forecasts, GFS = U.S.
Global Forecast System, NHC = National Hurricane Center, UKMET = United Kingdom Meteorological Office
model.
According to NOAA, these three models are “the three best individual track models.”
Forecasts and Warnings
The NWS, as delegated by the Secretary of Commerce, has statutory authority for weather
forecasting and for issuing storm warnings.17 Using the results from hurricane forecast models,
different components inside and outside of NHC contribute to the hurricane forecast process.
These components include the Hurricane Specialist Unit (HSU), the Tropical Analysis and
Forecast Branch (TAFB), and the Hurricane Liaison Team (HLT).18 Of these, the HSU produces
17 15 U.S.C. §313.
18 The Tropical Analysis and Forecast Branch (TAFB) and Hurricane Specialist Unit (HSU) are within NHC; the
Hurricane Liaison Team (HLT) is within the Federal Emergency Management Agency (FEMA). HLT is comprised of federal, state, and local emergency managers, FEMA personnel, and National Weather Service (NWS) forecasters and
hydrologists. On or before the beginning of hurricane season, the NHC director is to request that FEMA activate HLT,
which remains active throughout the hurricane season. If a tropical cyclone in the Atlantic or eastern Pacific basin
Forecasting Tropical Cyclones: Overview and Issues for Congress
Congressional Research Service 5
the final, official public forecast products, issued every six hours after a storm forms and more
frequently if a hurricane watch or hurricane warning is issued.19 The HSU also provides briefings
on tropical storms to emergency managers and to the public, and it cooperates with
meteorological services in other countries (e.g., Mexico). The TAFB supports the HSU by
providing tropical cyclone position and intensity estimates, conducting media interviews, and assisting in tropical cyclone operations.20
Forecasts and warnings generally are coordinated between the NWS national centers and the local
forecast offices. When NHC issues its forecast, local NWS Weather Forecast Offices use the information for their own forecasts, which take into consideration local conditions , and help disseminate the forecast through established local networks.
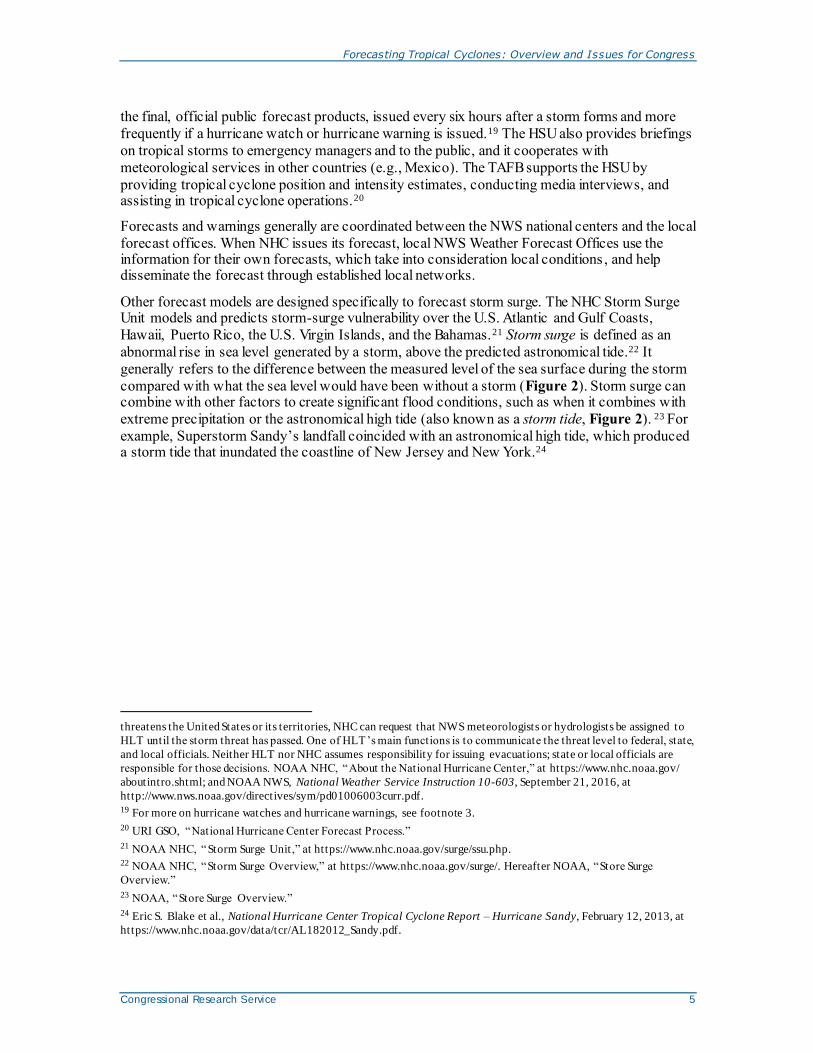
Other forecast models are designed specifically to forecast storm surge. The NHC Storm Surge Unit models and predicts storm-surge vulnerability over the U.S. Atlantic and Gulf Coasts,
Hawaii, Puerto Rico, the U.S. Virgin Islands, and the Bahamas.21 Storm surge is defined as an
abnormal rise in sea level generated by a storm, above the predicted astronomical tide.22 It
generally refers to the difference between the measured level of the sea surface during the storm
compared with what the sea level would have been without a storm (Figure 2). Storm surge can combine with other factors to create significant flood conditions, such as when it combines with
extreme precipitation or the astronomical high tide (also known as a storm tide, Figure 2). 23 For
example, Superstorm Sandy’s landfall coincided with an astronomical high tide, which produced a storm tide that inundated the coastline of New Jersey and New York.24
threatens the United States or its territories, NHC can request that NWS meteorologists or hydrologists be assigned to
HLT until the storm threat has passed. One of HLT’s main functions is to communicate the threat level to federal, state,
and local officials. Neither HLT nor NHC assumes responsibility for issuing evacuations; state or local officials are
responsible for those decisions. NOAA NHC, “About the National Hurricane Center,” at https://www.nhc.noaa.gov/
aboutintro.shtml; and NOAA NWS, National Weather Service Instruction 10-603, September 21, 2016, at
http://www.nws.noaa.gov/directives/sym/pd01006003curr.pdf. 19 For more on hurricane watches and hurricane warnings, see footnote 3.
20 URI GSO, “National Hurricane Center Forecast Process.”
21 NOAA NHC, “Storm Surge Unit ,” at https://www.nhc.noaa.gov/surge/ssu.php. 22 NOAA NHC, “Storm Surge Overview,” at https://www.nhc.noaa.gov/surge/. Hereafter NOAA, “Store Surge
Overview.”
23 NOAA, “Store Surge Overview.”
24 Eric S. Blake et al., National Hurricane Center Tropical Cyclone Report – Hurricane Sandy, February 12, 2013, at
https://www.nhc.noaa.gov/data/tcr/AL182012_Sandy.pdf.

Forecasting Tropical Cyclones: Overview and Issues for Congress
Congressional Research Service 6
Figure 2. Storm Surge and Storm Tide
Source: National Hurricane Center, “Storm Surge Overview,” at https://www.nhc.noaa.gov/surge/. (Modified by
CRS.)
Note: The 17-foot storm tide (top arrow) indicates the sum of the 2-foot normal astronomical high tide and the
15-foot storm surge.
NOAA’s Seasonal Hurricane Outlooks25 NOAA releases its seasonal outlooks for the Atlantic, eastern Pacific, and central Pacific prior to
the start of each respective hurricane season.26 The Atlantic and central Pacific hurricane seasons
each run from June 1 to November 30, and the eastern Pacific hurricane season runs from May 15
through November 30; however, tropical cyclones may form outside of these time frames.27
NOAA typically provides an update to the Atlantic outlook in August of each year but does not do so for the Pacific regions. NOAA includes several disclaimers when issuing its seasonal hurricane
outlook. For example, NOAA does not make a seasonal hurricane landfall forecast, and it does not predict levels of hurricane activity for any particular area.28
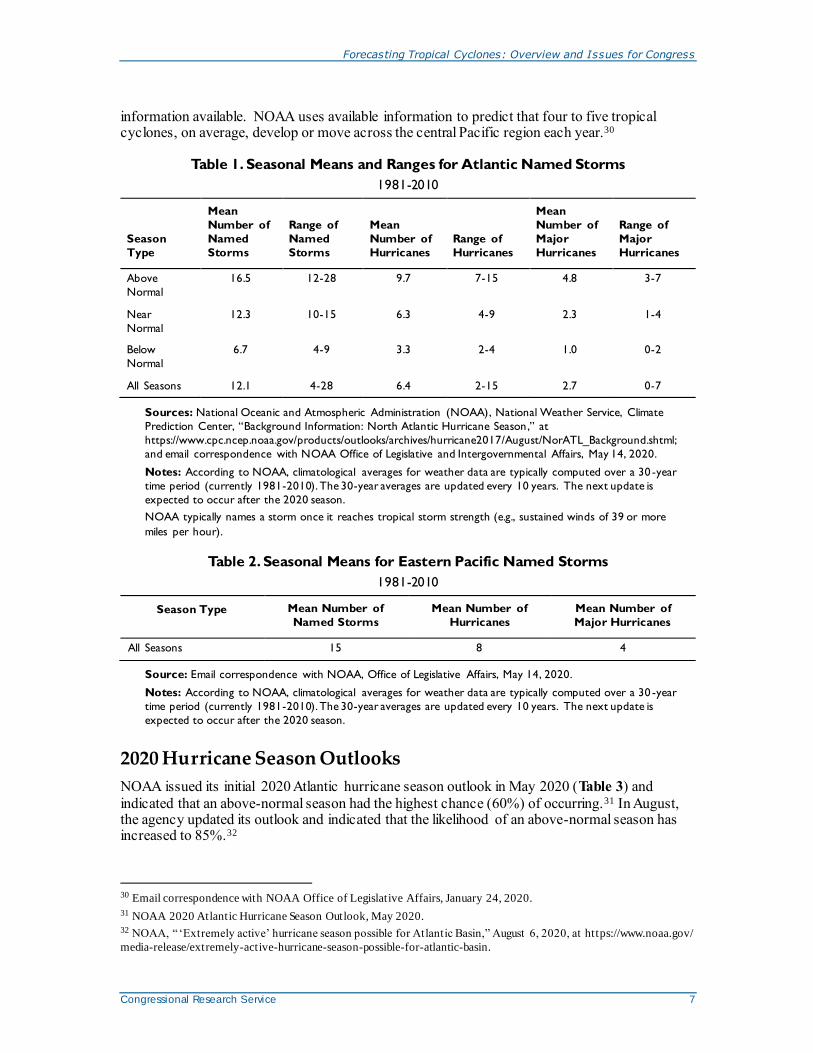
NOAA provides information about seasonal means and ranges for Atlantic named storms (Table
1) and seasonal means for eastern Pacific named storms (Table 2).29 For the central Pacific
Ocean, a shorter observational record of hurricanes and major hurricanes limits the statistical
25 NOAA’s outlooks typically cover all types of tropical cyclones, but the agency uses the term “hurricane” in outlook
t it les.
26 NOAA, NWS Climate Prediction Center (CPC), “Expert Assessments,” at https://www.cpc.ncep.noaa.gov/products/
expert_assessment/. The Eastern Pacific hurricane region covers the eastern Pacific Ocean east of 140 oW north of the
equator, and the Central Pacific hurricane region covers the areas between 140oW and 180o.
27 According to NOAA, “ When the Weather Bureau organized its new hurricane warning network in 1935 it scheduled a special telegraph line to connect the various centers to run from June 15 th through November 15 th. Those remained the
start and end dates of the ‘official’ season until 1965, when it was decided to start at the beginning of the month of June
and run until the end of November.” NOAA Atlantic Oceanographic and Meteorological Laboratory
28 NOAA, NWS CPC, “NOAA 2020 Atlantic Hurricane Season Outlook,” press release, May 21, 2020, at
https://www.cpc.ncep.noaa.gov/products/outlooks/hurricane.shtml. Hereafter NOAA 2020 Atlantic Hurricane Season
Outlook, May 2020
29 NOAA typically names a storm once it reaches tropical storm strength (e.g., sustained winds of 39 or more mph).
Forecasting Tropical Cyclones: Overview and Issues for Congress
Congressional Research Service 7
information available. NOAA uses available information to predict that four to five tropical cyclones, on average, develop or move across the central Pacific region each year.30
Table 1. Seasonal Means and Ranges for Atlantic Named Storms
1981-2010
Season
Type
Mean
Number of
Named
Storms
Range of
Named
Storms
Mean
Number of
Hurricanes
Range of
Hurricanes
Mean
Number of
Major
Hurricanes
Range of
Major
Hurricanes
Above
Normal
16.5 12-28 9.7 7-15 4.8 3-7
Near
Normal
12.3 10-15 6.3 4-9 2.3 1-4
Below
Normal
6.7 4-9 3.3 2-4 1.0 0-2
All Seasons 12.1 4-28 6.4 2-15 2.7 0-7
Sources: National Oceanic and Atmospheric Administration (NOAA), National Weather Service, Climate
Prediction Center, “Background Information: North Atlantic Hurricane Season,” at
https://www.cpc.ncep.noaa.gov/products/outlooks/archives/hurricane2017/August/NorATL_Background.shtml;
and email correspondence with NOAA Office of Legislative and Intergovernmental Affairs, May 14, 2020.
Notes: According to NOAA, climatological averages for weather data are typically computed over a 30 -year
time period (currently 1981-2010). The 30-year averages are updated every 10 years. The next update is
expected to occur after the 2020 season.
NOAA typically names a storm once it reaches tropical storm strength (e.g., sustained winds of 39 or more
miles per hour).
Table 2. Seasonal Means for Eastern Pacific Named Storms
1981-2010
Season Type Mean Number of
Named Storms
Mean Number of
Hurricanes
Mean Number of
Major Hurricanes
All Seasons 15 8 4
Source: Email correspondence with NOAA, Office of Legislative Affairs, May 14, 2020.
Notes: According to NOAA, climatological averages for weather data are typically computed over a 30 -year
time period (currently 1981-2010). The 30-year averages are updated every 10 years. The next update is
expected to occur after the 2020 season.
2020 Hurricane Season Outlooks
NOAA issued its initial 2020 Atlantic hurricane season outlook in May 2020 (Table 3) and
indicated that an above-normal season had the highest chance (60%) of occurring.31 In August, the agency updated its outlook and indicated that the likelihood of an above-normal season has increased to 85%.32
30 Email correspondence with NOAA Office of Legislative Affairs, January 24, 2020.
31 NOAA 2020 Atlantic Hurricane Season Outlook, May 2020. 32 NOAA, “‘Extremely active’ hurricane season possible for Atlantic Basin,” August 6, 2020, at https://www.noaa.gov/
media-release/extremely-active-hurricane-season-possible-for-atlantic-basin.

Forecasting Tropical Cyclones: Overview and Issues for Congress
Congressional Research Service 8
Table 3. 2020 Atlantic Hurricane Season Seasonal Outlooks
NOAA Seasonal Outlook
(May 2020)
NOAA Seasonal Outlook
(August 2020) Actual
Named Storms: 13-19 Named Storms: 19-25 Named Storms: NA
Hurricanes: 6-10 Hurricanes: 7-11 Hurricanes: NA
Major Hurricanes: 3-6 Major Hurricanes: 3-6 Major Hurricanes: NA
Source: NOAA, “Busy Atlantic hurricane season predicted for 2020 ,” May 21, 2020, at https://www.noaa.gov/
media-release/busy-atlantic-hurricane-season-predicted-for-2020; and NOAA, “‘Extremely active’ hurricane
season possible for Atlantic Basin,” August 6, 2020, at https://www.noaa.gov/media-release/extremely-active-
hurricane-season-possible-for-atlantic-basin.
Notes: NA = not available.
For comparison, the 1981 to 2010 seasonal averages include 12 named storms, 6 hurricanes, and
3 major hurricanes.33 For the sixth year in a row, a tropical cyclone formed before the June 1 start
of the hurricane season—Tropical Storm Arthur formed on May 16, 2020, and Tropical Storm Bertha formed on May 27, 2020.34
Several nonfederal entities also have published their outlooks for the season. For example, the
private weather forecasting company AccuWeather published its 2020 Atlantic hurricane outlook
in March 2020, predicting 14 to 18 named storms, 7 to 9 hurricanes, and 2 to 4 major hurricanes.35 Accuweather released an updated outlook in May, predicting 14 to 20 named storms,
7 to 11 hurricanes, and 4 to 6 major hurricanes.36 The Department of Atmospheric Science at
Colorado State University (CSU) issued its forecast in early April 2020. CSU predicted above-
normal activity, with 16 named storms, 8 hurricanes, and 4 major hurricanes in the Atlantic. 37
CSU has released several updates, the most recent in August, which predicted 24 named storms,
12 hurricanes, and 5 major hurricanes.38 In late April 2020, the Penn State Earth System Science Center released its 2020 forecast, predicting 15 to 24 named storms.39 All three forecasts rely, in part, on information collected and shared by NOAA.
33 According to NOAA, climatological averages for weather data are typically computed over a 30 -year time period
(currently 1981 to 2010). The 30-year averages are updated every 10 years, with the next update expected to occur after
the 2020 season. Email correspondence with NOAA Office of Legislative and Intergovernmental Affairs, May 14,
2020.
34 NHC, “Arthur Graphics Archive,” at https://www.nhc.noaa.gov/archive/2020/ARTHUR_graphics.php; and NHC,
“Bertha Graphics Archive,” at https://www.nhc.noaa.gov/archive/2020/BERTHA_graphics.php. 35 Jillian MacMath, “AccuWeather’s 2020 Atlantic hurricane season forecast is out,” AccuWeather, March 25, 2020, at
https://www.accuweather.com/en/hurricane/accuweathers-2020-atlantic-hurricane-season-forecast/705233.
AccuWeather’s forecast also estimated two to four “high-impact storms affecting the United States.”
36 John Roach, “AccuWeather increases number of hurricanes predicted for ‘very active’ 2020 Atlantic season,”
AccuWeather, May 25, 2020, at https://www.accuweather.com/en/hurricane/accuweather-issues-2020-atlantic-
hurricane-season-forecast-update/735844. 37 Phil Klotzbach et al., “Extended range forecast of Atlantic seasonal hurricane activity and landfall strike probability
for 2020,” April 2, 2020, at https://tropical.colostate.edu/media/sites/111/2020/04/2020-04.pdf. Unlike the NOAA
hurricane forecasts, Klotzbach, et al.’s outlook includes an estimate of landfall probability —for 2020 the researchers
predict an above-average probability for major hurricanes to make landfall along the conterminous United States and
the Caribbean.
38 Philip J. Klotzbach, Michael M. Bell, and Jhordanne Jones, Forecast of Atlantic Seasonal Hurricane Activity and
Landfall Strike Probability for 2020 , Colorado State University Department of Atmospheric Science, August 2020, at
https://tropical.colostate.edu/Forecast/2020-08.pdf. 39 Penn State Earth System Science Center, “The 2020 North Atlantic Hurricane Season: Penn State ESSC Forecast,”

Forecasting Tropical Cyclones: Overview and Issues for Congress
Congressional Research Service 9
NOAA also released its 2020 outlooks for the eastern and central Pacific hurricane seasons in
May 2020.40 NOAA anticipated that both basins would most likely experience a near-normal
(40% chance of occurring) to a below-normal (35%) season, with an above-normal season less
likely to occur (25%).41 See Table 4 for the eastern Pacific outlook. NOAA predicted the central
Pacific would experience two to six tropical cyclones. NOAA does not publish updates to its
eastern and central Pacific region outlooks. On average, the eastern Pacific basin experiences 15 named storms, 8 hurricanes, and 4 major hurricanes each year, and the central Pacific averages 4 to 5 tropical cyclones each year.
Table 4. 2020 Eastern Pacific Hurricane Season Seasonal Outlook
NOAA Seasonal Outlook
(May 2020)
Named Storms: 11-18
Hurricanes: 5-10
Major Hurricanes: 1-5
Source: NOAA, “NOAA’s 2020 Hurricane Season Outlooks,” at https://www.cpc.ncep.noaa.gov/products/
Epac_hurr/Slide1.JPG.
Issues for Congress Congress has considered and may continue to consider issues around federal activities related to
tropical cyclone forecasting and impacts. Some issues, including the effects of climate change on
tropical cyclones and forecasting certain aspects of these storms, are directly linked to federal
tropical cyclone activities. Other issues, such as federal government interactions with the private sector weather enterprise and potential fifth-generation (5G) interference with satellite sensors,
may affect the existing weather data structure, potentially leading to indirect impacts on federal tropical cyclone activities.
Impacts of Climate Change on Tropical Cyclones
As of February 2020, NOAA has identified several potential changes related to tropical cyclones, including that
all else equal, coastal inundation levels associated with tropical cyclones should
increase with sea level rise;42
tropical cyclone rainfall rates will likely increase in the future;
April 2020, at http://www.essc.psu.edu/essc_web/research/Hurricane2020.html.
40 NOAA, “NOAA’s 2020 Hurricane Season Outlooks,” at https://www.cpc.ncep.noaa.gov/products/Epac_hurr/
Slide1.JPG. Hereafter NOAA’s 2020 Hurricane Outlooks, Slide 1. 41 NOAA’s 2020 Hurricane Outlooks, Slide 1.
42 NOAA Geophysical Fluid Dynamics Laboratory (GFDL), “Global Warming and Hurricanes,” last revised February
5, 2020, at https://www.gfdl.noaa.gov/global-warming-and-hurricanes/. Hereafter NOAA GFDL, “Global Warming
and Hurricanes,” 2020. According to the report, the average rate of global sea level rise over the 21 st century will very
likely exceed that observed during 1971-2010 for a range of future emission scenarios. NOAA’s terminology for its
likelihood statements (for the assessed likelihood of an outcome or result) generally follows the conventions used by
the Intergovernmental Panel on Climate Change. In this case, very likely denotes a greater than 90% probability of
occurring and likely denotes a greater than 66% probability of occurring.

Forecasting Tropical Cyclones: Overview and Issues for Congress
Congressional Research Service 10
tropical cyclone intensities (wind speeds) globally will likely increase on average;
and
the global proportion of tropical cyclones that reach very intense (category 4 and
5) levels will likely increase.43
NOAA continues to support research into the effects of climate change on tropical cyclones under
its current authorities. Members of Congress may consider whether additional federal resources
should be allocated to study the potential impacts of climate change on certain aspects of tropical cyclones, such as storm surge and precipitation. At the House Science, Space, and Technology
Committee hearing entitled “Weathering the Storm: Improving Resiliency through Research” in
Houston, TX, on July 22, 2019, several participants spoke of work being done at federal and
nonfederal organizations and the need to better understand how storm surge and precipitation may change with climate change.44
For example, NOAA’s Assistant Administrator for Weather Services and Director of NWS Dr.
Louis Uccellini stated that NWS has been accommodating “that background, the changing
background state, into storm surge and potential impacts of intense storms,” and the agency needs “to account for [the changing background state] with respect to [NWS] watches and warnings.”45
Representative Sheila Jackson Lee noted that “we need to focus our time understanding how
impactful climate change is.” University of Houston Director of the Hurricane Resilience
Research Institute Dr. Hanadi Rifai, noted that “much more effort” is needed to further develop
storm surge models into “robust predictive platforms” that incorporate climate change, among other factors.46
Forecasting Certain Aspects of Tropical Cyclones
The ability to forecast the potential path a storm may take, also known as its track, has improved
steadily since the 1960s (Figure 3). For example, track errors in the current decade are less than
half of what they were in the 1990s.47 According to NOAA, the 2019 five-day track forecast was
better than the 1970s 36-hour forecast.48 Accuracy over an extended forecast time frame has
improved. In the 1990s, forecasts were available only on a three-day time frame; today forecasts typically extend out to five days.49 Some stakeholders argue that after years of significant
advances, improvements in track forecasting may be slowing.50 The slowdown, these researchers
43 NOAA GFDL, “Global Warming and Hurricanes,” 2020.
44 U.S. Congress, House Committee on Science, Space, and Technology, Subcommittee on Environmen t, Field
Hearing: Weathering the Storm: Improving Hurricane Resiliency through Research , 116th Cong., 1st sess., July 22,
2019 (Washington, DC: GPO, 2019), pp. 85-86, 94. Hereafter House Committee hearing, Improving Hurricane
Resiliency through Research, 2019.
45 House Committee hearing, Improving Hurricane Resiliency through Research, 2019, p. 85. 46 House Committee hearing, Improving Hurricane Resiliency through Research, 2019, pp. 29-30, 94.
47 Forecast errors indicate the difference between the forecast track and the actual t rack in nautical miles (n mi). The
forecast period is shown in hours (h).
48 Written testimony of Assistant Administrator for Weather Services and Director of the NWS, Dr. Louis Uccellini in U.S. Congress, House Committee on Science, Space, and Technology, Subcommittee on Environment, Field Hearing:
Weathering the Storm: Improving Hurricane Resiliency through Research , 116th Cong., 1st sess., July 22, 2019.
Hereafter, Uccellini, written testimony, 2019.
49 In other words, five-day forecasts today are as good as three-day forecasts were 25 years ago.
50 Christopher W. Landsea and John P. Cangialosi, “ Have we reached the limits of predictability for tropical cyclone
track forecasting?,” Bulletin of the American Meteorological Society, vol. 99, no. 11 (November 2018), pp. 2237-2243.
Hereafter Landsea and Cangialosi, “Limits of Predictability,” 2018.

Forecasting Tropical Cyclones: Overview and Issues for Congress
Congressional Research Service 11
contend, may be due to the limit of predicting how the most minor meteorological factors may change over the course of a forecast.51
Figure 3. NHC Official Average Track Errors Comparison
by decade for Atlantic basin tropical storms and hurricanes
Source: Written testimony of Assistant Administrator for Weather Services and Director of the National
Weather Service Dr. Louis Uccellini, in U.S. Congress, House Committee on Science, Space, and Technology,
Subcommittee on Environment, Field Hearing: Weathering the Storm: Improving Hurricane Resiliency through
Research, 116th Cong., 1st sess., July 22, 2019.
Notes: Forecast errors indicate the difference between the forecast track and the actual track in nautical miles
(n mi); forecast period shown in hours (h). The National Hurricane Center (NHC) issues official forecasts every
6 h; each forecast has projections valid 12, 24, 36, 48, 72, 96, and 120 h after the forecast’s initial time.
Forecasting a storm’s wind speeds, also known as its intensity, is considered to be more difficult
than forecasting its track. The last decade brought advances in intensity forecasting (Figure 4).
The largest incremental improvements since the 1970s occurred between 2010 and 2018, especially at the three-day and longer forecasts.52 Some researchers identify the need for
51 Landsea and Cangialosi, “Limits of Predictability,” 2018.
52 The 2010 to 2018 average intensity error for Atlantic basin tropical storms and hurricanes was close to 15 knots,
which corresponds roughly to a difference of one hurricane category on the Saffir -Simpson Hurricane Wind Scale.
NOAA encourages communities that may be affected by these storms to prepare for a storm one category stronger th an
what is forecasted to account for the expected average intensity error. NOAA NHC, “The State of Hurricane
Forecasting,” March 9, 2018, at https://noaanhc.wordpress.com/2018/03/09/the-state-of-hurricane-forecasting/.

Forecasting Tropical Cyclones: Overview and Issues for Congress
Congressional Research Service 12
improved models, enhanced observations, and better understanding of a storm’s inner core to
further improve the accuracy of intensity forecasts.53 The increased accuracy and extended time
frame provide useful information to local, state, and federal emergency managers faced with decisions about evacuating coastlines and staging emergency equipment and supplies.
Figure 4. NHC Official Average Intensity Errors Comparison
by decade for Atlantic basin tropical storms and hurricanes
Source: Written testimony of Assistant Administrator for Weather Services and Director of the National
Weather Service Dr. Louis Uccellini, in U.S. Congress, House Committee on Science, Space, and Technology,
Subcommittee on Environment, Field Hearing: Weathering the Storm: Improving Hurricane Resiliency through
Research, 116th Cong., 1st sess., July 22, 2019.
Notes: Intensity errors expressed as wind speed measured in knots (kts). Forecast period shown in hours (h).
The National Hurricane Center (NHC) issues official forecasts every 6 h, and each forecast has projections valid
12, 24, 36, 48, 72, 96, and 120 h after the forecast’s initial time.
Track and intensity forecasts do not consider storm surge or precipitation-caused flooding, both of
which may be among the most dangerous elements of a storm. The amount of rainfall produced by a storm may not necessarily be related to the intensity of the hurricane.54 For example, record
levels of precipitation and subsequent flooding during Hurricane Harvey continued even after the
53 Mark DeMaria, “Tropical Cyclone Intensity Analysis and Forecasting,” paper presented at the WMO RA -IV
Workshop on Hurricane Forecasting and Warning, Miami, FL, March 7, 2017, at https://severeweather.wmo.int/
TCFW/RAIV_Workshop2017/19c_TC_Intensity_Forecasting_MarkDeMaria.pdf.
54 NOAA NHC, “Hurricane Preparedness-Hazards,” at https://www.nhc.noaa.gov/prepare/hazards.php.
Forecasting Tropical Cyclones: Overview and Issues for Congress
Congressional Research Service 13
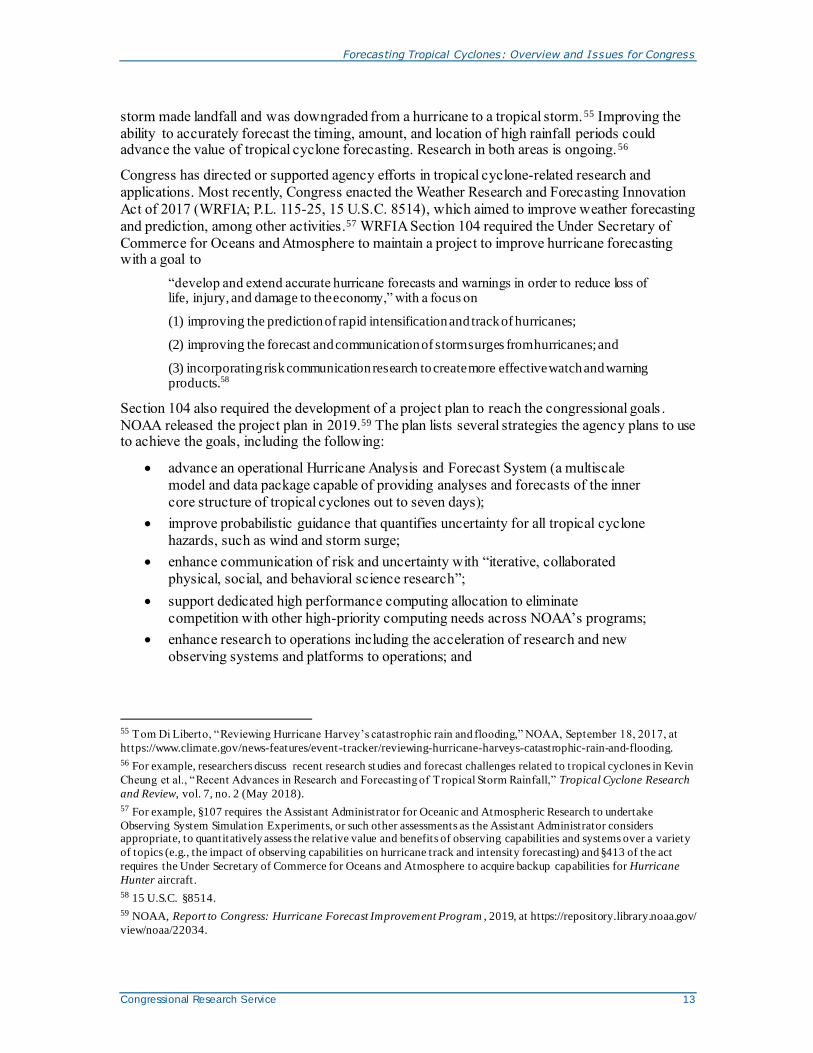
storm made landfall and was downgraded from a hurricane to a tropical storm.55 Improving the
ability to accurately forecast the timing, amount, and location of high rainfall periods could advance the value of tropical cyclone forecasting. Research in both areas is ongoing.56
Congress has directed or supported agency efforts in tropical cyclone-related research and
applications. Most recently, Congress enacted the Weather Research and Forecasting Innovation
Act of 2017 (WRFIA; P.L. 115-25, 15 U.S.C. 8514), which aimed to improve weather forecasting
and prediction, among other activities.57 WRFIA Section 104 required the Under Secretary of
Commerce for Oceans and Atmosphere to maintain a project to improve hurricane forecasting with a goal to
“develop and extend accurate hurricane forecasts and warnings in order to reduce loss of life, injury, and damage to the economy,” with a focus on
(1) improving the prediction of rapid intensification and track of hurricanes;
(2) improving the forecast and communication of storm surges from hurricanes; and
(3) incorporating risk communication research to create more effective watch and warning products.58
Section 104 also required the development of a project plan to reach the congressional goals .
NOAA released the project plan in 2019.59 The plan lists several strategies the agency plans to use to achieve the goals, including the following:
advance an operational Hurricane Analysis and Forecast System (a multiscale
model and data package capable of providing analyses and forecasts of the inner
core structure of tropical cyclones out to seven days);
improve probabilistic guidance that quantifies uncertainty for all tropical cyclone
hazards, such as wind and storm surge;
enhance communication of risk and uncertainty with “iterative, collaborated
physical, social, and behavioral science research”;
support dedicated high performance computing allocation to eliminate
competition with other high-priority computing needs across NOAA’s programs;
enhance research to operations including the acceleration of research and new
observing systems and platforms to operations; and
55 Tom Di Liberto, “Reviewing Hurricane Harvey’s catastrophic rain and flooding,” NOAA, September 18, 2017, at
https://www.climate.gov/news-features/event-tracker/reviewing-hurricane-harveys-catastrophic-rain-and-flooding.
56 For example, researchers discuss recent research st udies and forecast challenges related to tropical cyclones in Kevin
Cheung et al., “Recent Advances in Research and Forecasting of Tropical Storm Rainfall,” Tropical Cyclone Research
and Review, vol. 7, no. 2 (May 2018).
57 For example, §107 requires the Assistant Administrator for Oceanic and Atmospheric Research to undertake
Observing System Simulation Experiments, or such other assessments as the Assistant Administrator considers appropriate, to quantitatively assess the relative value and benefits of observing capabilities and systems over a variety
of topics (e.g., the impact of observing capabilities on hurricane track and intensity forecasting) and §413 of the act
requires the Under Secretary of Commerce for Oceans and Atmosphere to acquire backup capabilities for Hurricane
Hunter aircraft .
58 15 U.S.C. §8514.
59 NOAA, Report to Congress: Hurricane Forecast Improvement Program , 2019, at https://repository.library.noaa.gov/
view/noaa/22034.

Forecasting Tropical Cyclones: Overview and Issues for Congress
Congressional Research Service 14
broaden expertise and expand interaction with the nonfederal community through
the Scientific Review Committee, a grants and contracts program, and outreach
and education.
The plan includes objectives for each strategy. It is unclear how NOAA has specifically
implemented each of the strategies and objectives and how much progress has been made in
reaching the goals established in P.L. 115-25. For example, the agency has continued to develop
and release a variety of tropical cyclone-related storm surge products for the public.60 NOAA
plans to release additional products in 2020, including storm surge watch/warning graphics for Puerto Rico and the U.S. Virgin Islands and experimental peak storm surge forecast graphics for
the U.S. East and Gulf Coasts, Puerto Rico and the U.S. Virgin Islands.61 In another instance,
NOAA indicated in an annual report required under WRFIA that the U.S. Weather Research
Program currently supports several tropical cyclone projects, primarily focused on storm
development and intensity.62 In both cases, it is unclear if these new products or projects are in
response to congressional direction in WRFIA or were planned or in development before WRFIA’s enactment.
Congress continues to consider tropical cyclone forecasting in the 116th Congress. For example, the House Science, Space, and Technology Committee held a hearing on July 22, 2019 (see the
section entitled “Impacts of Climate Change on Tropical Cyclones”). Several participants noted
potential areas of storm forecasting improvement, including short- and long-term forecasting and
predicting storm surge and rainfall flooding.63 In S.Rept. 116-127, the appropriations committee
“encourage[d] NWS to reduce errors in tracking and intensity forecasts of hurricanes by identifying technology and methods available to significantly improve hurricane forecasting.”64
NOAA Interactions with the Private Sector Weather Enterprise
NOAA recognizes that the “nation’s environmental information enterprise,” including the
weather enterprise, is conducted by many parties (i.e., the government, private sector entities, and
the academic and research community), and the agency has the “responsibility” to foster growth
of the enterprise to serve the public interest and the nation’s economy.65 Under statute, the Secretary of Commerce is responsible for
forecasting of weather, the issue of storm warnings, the display of weather and flood
signals for the benefit of agriculture, commerce, and navigation, ... the distribution of meteorological information in the interests of agriculture and commerce, and the taking of such meteorological observations as may be necessary to establish and record the climatic
60 For example, NOAA has released experimental storm surge watch/warning graphics for the U.S. Atlantic and Gulf
Coasts since 2017. NHC, “Prototype Storm Surge Watch/Warning Graphic,” at https://www.nhc.noaa.gov/
experimental/surgewarning/. 61 Michael Brennan, “National Hurricane Center Product Changes for 2020,” online video presentation, April 29, 2020,
at https://www.youtube.com/watch?v=oWfh_iJcfv0&feature=youtu.be.
62 NOAA, Report to Congress: United States Weather Research Program Annual Project Report, 2020, at
https://repository.library.noaa.gov/view/noaa/23647.
63 House Committee hearing, Improving Hurricane Resiliency through Research, 2019, pp. 10 and 92. 64 U.S. Congress, Senate Committee on Appropriations, Departments of Commerce and Justice, Science, and Related
Agencies Appropriations Bill, 2020 , report to accompany S. 2584, 116th Cong., 1st sess., S.Rept. 116-127, September
26, 2019 (Washington, DC: GPO, 2019), p. 54.
65 NOAA, “Policy on Partnerships in the Provision of Environmental Information ,” NAO 216-112, last reviewed
January 31, 2019, at https://www.corporateservices.noaa.gov/ames/administrative_orders/chapter_216/216-112.html.
Hereafter NOAA, NAO 216-112.

Forecasting Tropical Cyclones: Overview and Issues for Congress
Congressional Research Service 15
conditions of the United States, or as are essential for the proper execution of the foregoing duties.66
To complete these activities, the federal government invests in physical infrastructure, shares
information with other federal agencies and nonfederal groups, and contracts services and data from the private sector, among other sectors.67 According to NOAA, the private sector uses
agency information; develops and maintains an infrastructure of observation, communication, and
prediction systems; and provides a “critical private sector role” in working with the agency to communicate forecasts and warnings that may affect public safety.68
In 2016 and 2017, NWS “conducted a study to better understand the current and future landscape of the broader weather enterprise in the United States.”69 NWS’s findings stated the following:
The NWS has an important role as the impartial and authoritative voice on public safety
and is a trusted partner to emergency managers, but could seek to collaborate more with the private industry in this role by looking for opportunities to harness commercial
capabilities, engaging with companies to address risks, and identifying areas where private industry services can complement core NWS services.
The NWS plays a key role in enabling the weather enterprise by providing weather, water, and climate data at the forefront of science, and by partnering with the private industry and
academia to drive innovation – especially to operationalize emerging technologies and foster community model development.
While many in the private industry have built upon the NWS’s infrastructure, products and services thus far, there is potential for this paradigm to shift as private industry capabilities
increase and businesses become more dependent on weather, water, and climate information.70
Congress has considered and may continue to consider whether federal government and private sector roles in the weather enterprise should change.71 For example, in 2016, Congress directed that NOAA
66 15 U.S.C. §313.
67 NWS, National Weather Service Enterprise Analysis Report: Findings on changes to the private weather industry ,
June 8, 2017, p. 5, at https://www.weather.gov/media/about/
Final_NWS%20Enterprise%20Analysis%20Report_June%202017.pdf . (hereafter NWS, Enterprise Analysis Report);
and NOAA, Acquisition of Space-based Scientific Data from Commercial Sources to Supplement NOAA’s Weather and
Climate Observation Requirements: Report to Congress, 2010, at https://www.space.commerce.gov/wp-content/uploads/2010-03-commercial-observations.pdf. Congress has limited the private sector’s role in the federal weather
enterprise in at least one aspect. Under statute, neither the President nor any other government official can “lease, sell
or transfer to the private sector, or commercialize” any weather satellite systems operated by the Department of
Commerce. See P.L. 111-314 §60161.
68 NOAA, NAO 216-112.
69 NWS, Enterprise Analysis Report, p. 2. 70 NWS, Enterprise Analysis Report, p. 3.
71 NOAA and other stakeholders have considered the appropriate roles for the federal government and private sector in
other NOAA activities. For example, NOAA released a request for information on the private sector’s role, among
other sectors, in mapping, exploring, and characterizing the U.S. exclusive economic zone (EEZ), and NOAA’s
FY2021 budget proposal notes that the agency “will continue its mapping of the U.S. EEZ utilizing Federal, academic,
philanthropic, and private research vessels.” NOAA, “Strategy for Mapping, Exploring, and Characterizing the U.S.
Exclusive Economic Zone,” 85 Federal Register 7734, February 11, 2020; and NOAA, Budget Estimates Fiscal Year
2021, p. 530, at https://www.commerce.gov/sites/default/files/2020-02/
fy2021_noaa_congressional_budget_justification.pdf.

Forecasting Tropical Cyclones: Overview and Issues for Congress
Congressional Research Service 16
shall, through an open competitive process, seek to enter into at least one pilot contract to assess the potential viability of commercial weather data in its weather modeling and forecasting. This funding shall be used to purchase, evaluate, and calibrate available data,
which meets the standards and specifications set by NOAA in its Commercial Data Policy.72
In its post-pilot report, required under WRFIA Section 302, NOAA stated that the “commercial
sector was not able to provide the quality and quantity of [radio occultation (RO)] data that NOAA requires for use in operational weather forecasting” in the initial round.73 However,
NOAA further asserted that “commercial RO systems show potential and, if progress continues,
could serve in the future as complementary sources to existing and future government systems,” warranting further pilot project purchases for a more thorough evaluation.74
Congress and the Trump Administration have indicated their support for increased agency
procurement and utilization of data and services from the private sector. In S.Rept. 116-127,
accompanying FY2020 appropriations legislation, Congress stated that FY2020 appropriations
would “support the assessment and potential use of commercial data in NOAA’s weather modeling and forecasting through pilot purchases of commercial data.”75 NOAA’s FY2021
budget proposal states that “NOAA will engage private and academic institutions ... ultimately
leveraging their expertise and innovative cultures to reclaim and maintain international leadership in the area of numerical weather prediction.”76
The private sector has also expanded its role in the weather enterprise. For example,
AccuWeather, a private company that develops and publishes its own hurricane forecasts, began
using a new scale for conveying the severity of hurricanes, rather than the historically used Saffir-
Simpson scale.77 Some stakeholders have expressed that the creation and use of a new scale could potentially cause public confusion during an emergency; others believe the new scale provides more comprehensive information about a storm.78
Some stakeholders believe the current distribution of roles and responsibilities between and the government and the private sector should be maintained.79 Others note that the private sector’s
role will continue to shift as private companies launch their own observational systems and run
their own forecasting models.80 Still others have suggested that government and private sector
72 P.L. 114-113. 73 NOAA, Report to Congress: Commercial Weather Data Pilot Program , 2018, p. 6, at
https://repository.library.noaa.gov/view/noaa/23645. Hereafter NOAA, CWDPP, 2018.
74 NOAA, CWDPP, 2018, p. 6.
75 S.Rept. 116-127, p. 62. 76 NOAA, Budget Estimates Fiscal Year 2021 , p. 488, at https://www.commerce.gov/sites/default/files/2020-02/
fy2021_noaa_congressional_budget_justification.pdf.
77 AccuWeather, “AccuWeather’s New RealImpact (TM) Scale for Hurricanes will Revolutionize Damage Predictions
for Greater Public Safety,” January 9, 2019, at https://www.accuweather.com/en/press/83423274. 78 Our Daily Planet, “Private Weather Company to Use Different Hurricane Severity Scale,” January 15, 2019, at
https://www.ourdailyplanet.com/story/private-weather-company-to-use-different-hurricane-severity-scale/; and Angela
Fritz, “AccuWeather developed a hurricane category scale, and it worries some meteorologists,” The Washington Post,
January 10, 2019, at https://www.washingtonpost.com/weather/2019/01/11/accuweather-developed-hurricane-category-
scale-it-worries-some-meteorologists/.
79 Jim Foerster, “What’s the difference between private weather companies and the National Weather Service?,”
Forbes, January 24, 2020, at https://www.forbes.com/sites/jimfoerster/2020/01/24/whats-the-difference-between-
private-weather-companies-and-the-national-weather-service/#5645031c4a29. 80 Andrew Freedman, “Weather is turning into big business. And that could be trouble for the public,” The Washington
Post, November 25, 2019, https://www.washingtonpost.com/business/2019/11/25/weather-is-big-business-its-veering-

Forecasting Tropical Cyclones: Overview and Issues for Congress
Congressional Research Service 17
roles may change. For example, some have advocated for private and public entities to “continue
to promote adoption of open data policies and common alerting protocols while also encouraging
the use of new technologies and procurement approaches to help increase the reliability of equipment.” 81
Potential 5G Technology Interference with Satellite Sensors
NOAA’s Use of the 23.8 Gigahertz Frequency
NOAA utilizes certain radio frequencies or bands for weather sensing, monitoring, forecasting,
and warning. For instance, water vapor emits microwave radiation at the 23.8 gigahertz (GHz)
frequency. An instrument known as the Advanced Technology Microwave Sounder (ATMS),
which is a part of several existing and planned NOAA satellites, passively measures 23.8 GHz frequency to obtain data on water vapor, clouds, and precipitation.82 According to NOAA, ATMS
collects “essential data for accurate near-term weather predictions needed for farming,
commercial and defense aircraft flight path planning, terrestrial extreme weather preparedness and oceanographic inputs for civilian and defense ships.”83
Passive sensors, such as the ATMS, only receive signals, whereas active sensors (e.g., active radar
instruments) both emit and receive signals. Thus, passive sensors rely on the strength or
“emissivity” of natural sources. The inherent low-level emissivity of natural sources, such as
water vapor, makes the signals “particularly vulnerable” to active sources of signals close to the same frequency as the natural source.84 Measuring natural sources using alternative frequencies is
“usually not feasible,” as natural sources of electromagnetic radiation, such as water vapor, emit only in specific frequencies (as a matter of physics).85
According to NOAA, the 23.8 GHz frequency is the sole frequency used to measure water vapor
for the entire vertical atmospheric profile between the satellite and the Earth’s surface; other
spectrum bands may complement this data.86 Measurements taken at the 23.8 GHz frequency are
used in numerical weather prediction models and storm forecasting and tracking, among other
toward-collision-with-federal-government/.
81 Mary Glackin, “Improving the Forecast: Value and Public-Private Collaboration in Data Driven Weather Insights,”
World Meteorological Organization Bulletin, vol 68 (1) (2019), at https://public.wmo.int/en/resources/bulletin/
improving-forecast-value-and-public-private-collaboration-data-driven-weather. 82 Email correspondence with NOAA Office of Legislative Affairs on August 13, 2019. Additional U.S. satellite
missions that have used passive sensors to measure at the 23.8 gigahertz (GHz) band include NEMS/SCAMS, AMSU-
A, TMI, JASON-1 JMR, AMSR-E, AMSR, Jason-2 AMR, AMSR-2, and GMI. National Research Council (NRC),
Spectrum Management for Science in the 21 st Century, (Washington, DC: National Academies Press, 2010), pp. 56-57
(hereafter NRC, Spectrum Management, 2010) and Joint Polar Satellite System (JPSS), “Advanced Technology
Microwave Sounder (ATMS),” at https://www.jpss.noaa.gov/atms.html (hereafter JPSS, “ATMS”).
83 JPSS, “ATMS.”
84 Sandra Cruz-Pol et al., “Spectrum Management and the Impact of RFI on Science Sensors,” 2018 IEEE 15 th Specialist Meeting on Microwave Radiometry and Remote Sensing of the Environment (MicroRad) , p. 53. Hereafter
Cruz-Pol et al., 2018.
85 Cruz-Pol et al., 2018.
86 Telephone conversation with NOAA Senior Policy Advisor, August 2, 2019 and email correspondence with NOAA
Office of Legislative Affairs on August 13, 2019. According to NOAA, water vapor measurements are also calibrated
using the 50 GHz spectrum band, another spectrum band being considered by the Federal Communications
Commission (FCC) for fifth-generation (5G) use.

Forecasting Tropical Cyclones: Overview and Issues for Congress
Congressional Research Service 18
activities.87 According to the National Research Council, global water vapor profiles are
“essential” to predicting rainfall and drought.88 Water vapor data can help forecasters determine how likely a storm is to develop and the locations with the heaviest rainfall.89
Federal Frequency Management
In 2018, telecommunications providers began deploying 5G networks to meet growing demands for data from consumer and industrial users. As more people use more mobile devices for more
purposes, the segment of the spectrum typically used for mobile communications (i.e., below 6
GHz) has become crowded. Proposed 5G expansion includes use of the 24 GHz band. The
Federal Communications Commission (FCC) manages spectrum allocation for nonfederal users
in the United States. The agency allocates spectrum for specific users and can assign frequencies
to entities or auction rights to use the spectrum.90 All users who are assigned frequencies must adhere to technical requirements to limit interference to users operating nearby, including limits
on out-of-band emissions—when high-power signals transmitted in one band disrupt signals in an adjacent band.
Spectrum use is coordinated globally through the International Telecommunications Union (ITU),
an agency of the United Nations. The member-nations of the ITU adopt standards and requirements for use, including emission limits to advance the ability to communicate globally.
NOAA and Other Stakeholder Concerns—Selected Timeline
According to NOAA, in 2016, ITU encouraged NOAA to complete studies of the impacts of 5G
expansion and emission interference on the 23.8 GHz frequency, among other frequencies. 91 In
2017, NOAA began working with FCC on initial 23.8 GHz studies and models using pre-
packaged modeling software and a limited set of input parameters determined by the software
specifications. After voicing concerns about the inherent assumptions used by the pre-packaged
software, FCC requested NOAA create its own model to allow the agencies to control the programming code and input parameters.92 NOAA partnered with NASA to do so.93
NOAA has expressed concerns over interference in the 23.8 GHz band from use of nearby bands. In a February 28, 2019, letter to FCC, Commerce Secretary Wilbur Ross and NASA
Administrator Jim Bridenstine noted that the “current FCC proposal would have a significant
negative impact on the transmission of critical science data.”94 NOAA and NASA provided their
87 NRC, Spectrum Management, 2010, pp. 54-55.
88 NRC, Spectrum Management, 2010, p. 29. 89 NASA, TERRA, “Atlantic’s Hurricane Oscar’s Water Vapor Measured by NASA’s Terra Satellite,” October 29,
2018, at https://terra.nasa.gov/news/atlantics-hurricane-oscars-water-vapor-measured-by-nasas-terra-satellite.
90 For example, FCC may allocate spectrum to public safety use, and license specific frequencies to specific public
safety agencies. FCC may also auction rights to use certain bands and frequencies; once the bidding process has
concluded, FCC may enter into licensing agreements with winners. For more information about 5G and spectrum
allocation, see CRS Report R45485, Fifth-Generation (5G) Telecommunications Technologies: Issues for Congress, by
Jill C. Gallagher and Michael E. DeVine.
91 Telephone conversation with NOAA Senior Policy Advisor, August 2, 2019. 92 U.S. Congress, House Committee on Science, Space, and Technology, Subcommittee on Environment, The Future of
Forecasting: Building a Stronger U.S. Weather Enterprise, 116th Cong., 1st sess., May 16, 2019 (Washington, DC:
GPO, 2019), at https://plus.cq.com/doc/congressionaltranscripts-5544078?1&searchId=HPjfb3fd (accessed July 29,
2019). Hereafter House Committee hearing, The Future of Forecasting, 2019.
93 House Committee hearing, The Future of Forecasting, 2019. 94 Debra Werner, “5G trumps weather in spectrum debate,” Space News, March 8, 2019, at https://spacenews.com/5g-

Forecasting Tropical Cyclones: Overview and Issues for Congress
Congressional Research Service 19
joint study to FCC in March 2019 and advocated for an emission limit near -50 decibel watts (dBW) per 200 megahertz (MHz).95
FCC opened the 24 GHz auction to bidders on March 14, 2019, and closed the auction on May 28, 2019.96 In a March 13, 2019, letter, Chairwoman Eddie Bernice Johnson and ranking member
Frank Lucas of the House Committee on Science, Space, and Technology requested that FCC
“delay the auction of 5G spectrum until NOAA, NASA, and the [Department of Defense] have
been adequately consulted and their concerns have been addressed.”97 FCC Chairman Ajit Pai
responded that the agency had established emission limits to protect passive service operations for other nearby bands and had “not been presented with any evidence of harmful interference
from these existing services nor a validated study suggesting that operations in accordance with
these rules would adversely affect use of the 23.6-24 GHz allocation, including for weather
forecasting.”98 In a May 13, 2019, letter, ranking member Ron Wyden of the Senate Committee
on Finance and ranking member Maria Cantwell of the Senate Committee on Commerce, Science, and Transportation requested FCC Chairman Pai
not to award any final licenses to winning bidders for the future commercial broadband use in the 24 GHz spectrum until the FCC approves the passive band protection limits that
[NASA] and [NOAA] determine are necessary to protect critical satellite-based measurements of atmospheric water vapor needed to forecast the weather.99
FCC Chairman Pai’s letter in response to the Senators provided information about the interagency
coordination process, timeline for of federal agency consideration, and thoughts on existing study claims, including that “adopting the limits suggested by the Department of Commerce would undeniably render the 24 GHz band unusable for 5G.”100
trumps-weather-in-spectrum-debate/. 95 NOAA Acting Under Secretary of Oceans and At mosphere Neil Jacobs testified that NOAA and NASA had shared
the study with FCC in March 2019, but the report is undated. According to FCC Chairman Ajit Pai, NOAA shared the
study with FCC on March 11, 2019. A decibel watt (dBW) is a unit of power in decibel scale referenced to 1 watt. The
decibel scale is logarithmic, therefore a -50 dBW limit would allow about three orders of magnitude less interference
than a -20 dBW limit. A 50 dBW limit would allow about three orders of magnitude more interference than a 20 dBW
limit. NOAA and NASA, Results from NASA/NOAA Sharing Studies on WRC-19 Agenda Item 1.13, undated, at
https://science.house.gov/imo/media/doc/Study%20prepared%20by%20NOAA%20and%20NASA%20-
%20Results%20from%20NASANOAA%20Sharing%20Studies%20on%20WRC-19%20Agenda%20Item%201.13.pdf
(hereafter NOAA and NASA joint study); House Committee hearing, The Future of Forecasting, 2019; and letter
correspondence from FCC Chairman Pai to Senate Committee on Commerce, Science, and Transportation ranking
member Maria Cantwell, June 11, 2019, at https://docs.fcc.gov/public/attachments/DOC-358166A1.pdf. 96 FCC, “Public Notice: Upfront Payment Deadline and Instructions and Other Dates for the Auction of 24 GHz Upper
Microwave Flexible Use Service Licenses (Auction 102),” January 31, 2019, at https://docs.fcc.gov/public/attachments/
DA-19-24A1.pdf and FCC, “Public Notice: Auction of 24 GHz Upper Microwave Flexible Use Service Licenses
Closes,” June 3, 2019, at https://docs.fcc.gov/public/attachments/DA-19-485A1.pdf
97 Letter correspondence from House Committee on Science, Space, and Technology Chairwoman Eddie Bernice
Johnson and ranking member Frank Lucas to FCC Chairman Pai, March 13, 2019, at https://docs.fcc.gov/public/
attachments/DOC-357582A2.pdf. 98 Letter correspondence from FCC Chairman Pai to House Committee on Science, Space, and Technology
Chairwoman Johnson and ranking member Lucas, April 29, 2019, at https://docs.fcc.gov/public/attachments/DOC-
357582A1.pdf.
99 Letter correspondence from Senate Committee on Finance ranking member Ron Wyden and Senate Committee on
Commerce, Science, and Transportation ranking member Cantwell to FCC Chairman Pai, May 13, 2019, at
https://www.wyden.senate.gov/imo/media/doc/
05132019%20FINAL%20Wyden%20Cantwell%20Letter%20to%20FCC%20re%205G%2024%20GHz%20Spectrum.
pdf. 100 Letter correspondence from FCC Chairman Pai to Senate Committee on Commerce, Science, and Transportation

Forecasting Tropical Cyclones: Overview and Issues for Congress
Congressional Research Service 20
In a May 16, 2019, House Science, Space, and Technology committee hearing, NOAA Acting
Under Secretary of Oceans and Atmosphere Neil Jacobs stated that the NOAA and NASA joint
study found that the emission limit proposed by FCC (-20 dBW per 200 MHz) “would result in
roughly a 77 percent data loss from [NOAA] passive microwave sounders.”101 According to Jacobs, the loss would
degrade the forecast scale by up to 30 percent, so if you look back in time to see when our
forecast goes roughly 30 percent less than it was today, it’s somewhere around 1980. This would result in the reduction of hurricane track forecast lead time by roughly two to three days.
A good example of this is a data denial study that the European Center did, where they
withheld the microwave sounder data during the forecast for Superstorm Sandy and a model, which is the most accurate model in the world right now, kept the storm out to sea.102
When asked if other instruments and observations could offset the loss, Jacobs testified that there
were currently no existing capabilities to mitigate the loss of information.103 According to NOAA,
data losses of 2% or more due to emission interference would likely force NOAA to issue a stop-work order to contractors working on the next generation of satellites, as the onboard instruments would no longer be able to meet mission requirements.104
Jacobs also stated that NOAA had not identified scientific evidence to support FCC’s proposed emissions limit, and NOAA had instead advocated for an emissions limit near -50 dBW per 200
MHz, which “would result in roughly zero data loss.”105 According to NOAA, its proposed
emission limit relied on the NOAA and NASA joint study, in concurrence with the U.S. Navy and
a study by the European Space Agency, which found that a more restrictive emissions limit was needed.106
A July 2019 National Academy of Sciences meeting to discuss the “implications of proposed 5G
service in 24 GHz bands for remote sensing of atmospheric water vapor” was canceled reportedly
due to a reluctance to participate by “many of the ‘most knowledgeable about the topic.’”107 In a July 2019 letter to FCC Chairman Pai, Senator John Kennedy wrote to “commend [FCC] for the
ranking member Cantwell, June 11, 2019, at https://docs.fcc.gov/public/attachments/DOC-358166A1.pdf. 101 House Committee hearing, The Future of Forecasting, 2019. The House Committee on Science, Space, and
Technology has since released NOAA’s report. NOAA and NASA joint study.
102 House Committee hearing, The Future of Forecasting, 2019.
103 House Committee hearing, The Future of Forecasting, 2019. 104 House Committee hearing, The Future of Forecasting, 2019.
105 House Committee hearing, The Future of Forecasting, 2019. The decibel scale is logarithmic, therefore a -50 dBW
limit would allow about three orders of magnitude less interference than the proposed -20 dBW limit. American
Institute of Physics, “NOAA Warns 5G Spectrum Interference Presents Majo r Threat to Weather Forecasts,” May 22,
2019, at https://www.aip.org/fyi/2019/noaa-warns-5g-spectrum-interference-presents-major-threat-weather-forecasts. 106 House Committee hearing, The Future of Forecasting, 2019. Senator Wyden released a document from the Navy
regarding “operational impacts from potential loss of NOAA/NASA METOC satellite data resulting from the FCC
spectrum auction for 5G.” Captain Marc Eckardt, Operational impacts from potential loss of NOAA/NASA METOC
satellite data resulting from the FCC spectrum auction for 5G, Information Brief, March 27, 2019, at
https://www.wyden.senate.gov/imo/media/doc/Navy%2024Hz%205G%20Spectrum%20Impacts.pdf .
107 Hal Bernton, “High-stakes dispute turns nasty, pits 5G technology against weather forecasting,” The Seattle Times,
August 5, 2019, at https://www.seattletimes.com/seattle-news/will-5g-satellite-deployment-undermine-noaa-weather-
forecasting/; and workshop cancellation notice at National Academy of Sciences Board on Atmospheric Science and
Climate, “Upcoming Workshop,” at http://dels.nas.edu/Upcoming-Workshop/Implications-Proposed-Service/AUTO-6-
14-56-P?bname=basc.
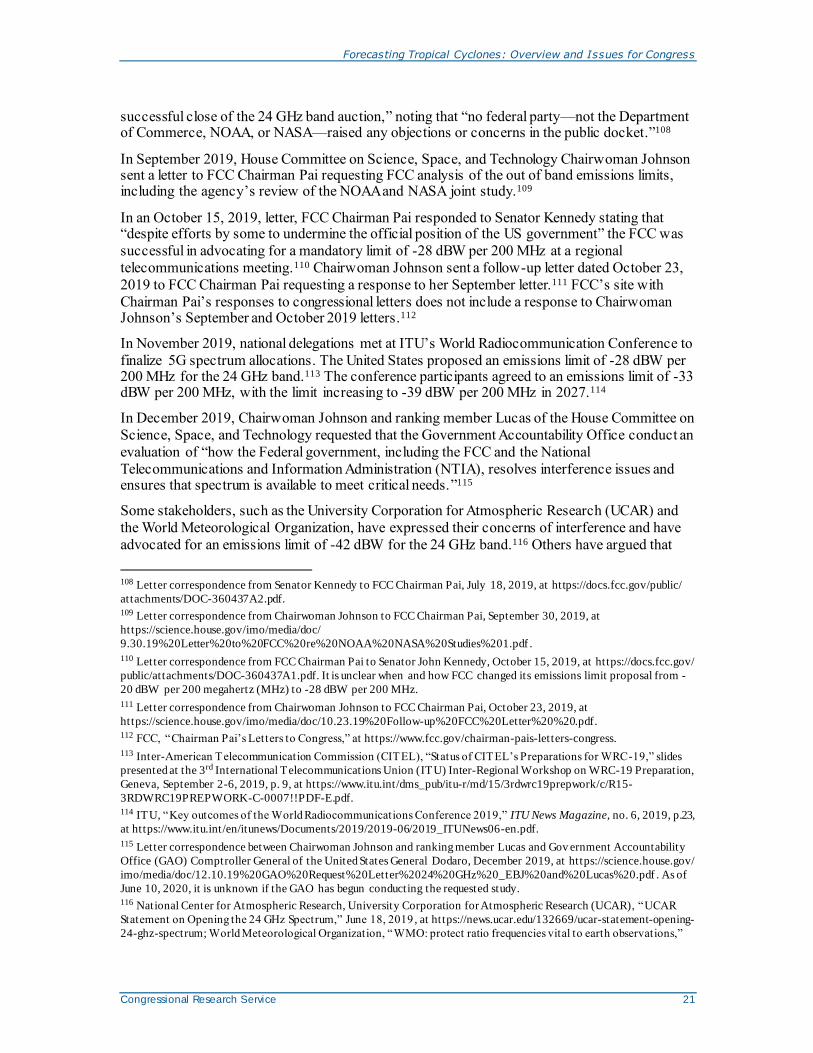
Forecasting Tropical Cyclones: Overview and Issues for Congress
Congressional Research Service 21
successful close of the 24 GHz band auction,” noting that “no federal party—not the Department of Commerce, NOAA, or NASA—raised any objections or concerns in the public docket.”108
In September 2019, House Committee on Science, Space, and Technology Chairwoman Johnson sent a letter to FCC Chairman Pai requesting FCC analysis of the out of band emissions limits, including the agency’s review of the NOAA and NASA joint study.109
In an October 15, 2019, letter, FCC Chairman Pai responded to Senator Kennedy stating that “despite efforts by some to undermine the official position of the US government” the FCC was
successful in advocating for a mandatory limit of -28 dBW per 200 MHz at a regional
telecommunications meeting.110 Chairwoman Johnson sent a follow-up letter dated October 23,
2019 to FCC Chairman Pai requesting a response to her September letter.111 FCC’s site with
Chairman Pai’s responses to congressional letters does not include a response to Chairwoman Johnson’s September and October 2019 letters.112
In November 2019, national delegations met at ITU’s World Radiocommunication Conference to
finalize 5G spectrum allocations. The United States proposed an emissions limit of -28 dBW per 200 MHz for the 24 GHz band.113 The conference participants agreed to an emissions limit of -33 dBW per 200 MHz, with the limit increasing to -39 dBW per 200 MHz in 2027.114
In December 2019, Chairwoman Johnson and ranking member Lucas of the House Committee on
Science, Space, and Technology requested that the Government Accountability Office conduct an
evaluation of “how the Federal government, including the FCC and the National
Telecommunications and Information Administration (NTIA), resolves interference issues and ensures that spectrum is available to meet critical needs.”115
Some stakeholders, such as the University Corporation for Atmospheric Research (UCAR) and
the World Meteorological Organization, have expressed their concerns of interference and have
advocated for an emissions limit of -42 dBW for the 24 GHz band.116 Others have argued that
108 Letter correspondence from Senator Kennedy to FCC Chairman Pai, July 18, 2019, at https://docs.fcc.gov/public/
attachments/DOC-360437A2.pdf. 109 Letter correspondence from Chairwoman Johnson to FCC Chairman Pai, September 30, 2019, at
https://science.house.gov/imo/media/doc/
9.30.19%20Letter%20to%20FCC%20re%20NOAA%20NASA%20Studies%201.pdf .
110 Letter correspondence from FCC Chairman Pai to Senator John Kennedy, October 15, 2019, at https://docs.fcc.gov/
public/attachments/DOC-360437A1.pdf. It is unclear when and how FCC changed its emissions limit proposal from -
20 dBW per 200 megahertz (MHz) to -28 dBW per 200 MHz.
111 Letter correspondence from Chairwoman Johnson to FCC Chairman Pai, October 23, 2019, at
https://science.house.gov/imo/media/doc/10.23.19%20Follow-up%20FCC%20Letter%20%20.pdf. 112 FCC, “Chairman Pai’s Letters to Congress,” at https://www.fcc.gov/chairman-pais-letters-congress.
113 Inter-American Telecommunication Commission (CITEL), “Status of CITEL’s Preparations for WRC-19,” slides
presented at the 3rd International Telecommunications Union (ITU) Inter-Regional Workshop on WRC-19 Preparation,
Geneva, September 2-6, 2019, p. 9, at https://www.itu.int/dms_pub/itu-r/md/15/3rdwrc19prepwork/c/R15-
3RDWRC19PREPWORK-C-0007!!PDF-E.pdf. 114 ITU, “Key outcomes of the World Radiocommunications Conference 2019,” ITU News Magazine, no. 6, 2019, p.23,
at https://www.itu.int/en/itunews/Documents/2019/2019-06/2019_ITUNews06-en.pdf.
115 Letter correspondence between Chairwoman Johnson and ranking member Lucas and Gov ernment Accountability
Office (GAO) Comptroller General of the United States General Dodaro, December 2019, at https://science.house.gov/
imo/media/doc/12.10.19%20GAO%20Request%20Letter%2024%20GHz%20_EBJ%20and%20Lucas%20.pdf . As of
June 10, 2020, it is unknown if the GAO has begun conducting the requested study. 116 National Center for Atmospheric Research, University Corporation for Atmospheric Research (UCAR), “UCAR
Statement on Opening the 24 GHz Spectrum,” June 18, 2019 , at https://news.ucar.edu/132669/ucar-statement-opening-
24-ghz-spectrum; World Meteorological Organization, “WMO: protect ratio frequencies vital to earth observations,”
Forecasting Tropical Cyclones: Overview and Issues for Congress
Congressional Research Service 22
NOAA’s claims are based on flawed studies, fail to consider new technologies, and were
introduced at the last minute.117 Concerns over emission limits and degradation of satellite data
are likely to continue as FCC plans to open up several other spectrum bands for auction in the next few years.
June 14, 2019, at https://public.wmo.int/en/media/news/wmo-protect-radio-frequencies-vital-earth-observations; and
Debra Werner, “International weather agencies object to 5G spectrum decision,” Space News, November 27, 2019, at
https://spacenews.com/international-weather-agencies-object-to-5g-spectrum-decision/.
117 Liam Siguad, “5G won’t ruin your weather forecast,” The Hill, June 18, 2019, at https://thehill.com/opinion/technology/449060-5g-wont-ruin-your-weather-forecast; letter correspondence from members of several organizations
to FCC Chairman Pai, December 16, 2019, at https://www.ccagw.org/sites/default/files/L-
Band%20Coalition%20letter.pdf; and CTIA, “How 5G will improve weather forecasting & preparedness,” July 2,
2019, at https://www.ctia.org/news/how-5g-will-improve-weather-forecasting-preparedness.

Forecasting Tropical Cyclones: Overview and Issues for Congress
Congressional Research Service 23
Appendix A. 2019 Hurricane Season Outlooks and
Overviews
2019 Atlantic Hurricane Season Outlook and Overview
The National Oceanic and Atmospheric Administration (NOAA) issued its 2019 Atlantic
hurricane season outlook in May 2019 and published an updated outlook in August 2019 (Table
A-1). In the May outlook, NOAA indicated that a near-normal season had the highest chance
(40%) of occurring.118 The August update indicated an increased chance (45%) that the 2019
hurricane season would be above-normal, with a 35% chance of a near-normal season and a 20% chance of a below-normal season.119 For comparison, the 1981 to 2010 seasonal averages include 12 named storms, 6 hurricanes, and 3 major hurricanes.
Table A-1. 2019 Atlantic Hurricane Season: Comparison Between Seasonal Outlook and Actual Storms
NOAA Seasonal Outlook
(May 2019)
NOAA Seasonal Outlook
(August 2019) Actual
Named Storms: 9-15 Named Storms: 10-17 Named Storms: 18
Hurricanes: 4-8 Hurricanes: 5-9 Hurricanes: 6
Major Hurricanes: 2-4 Major Hurricanes: 2-4 Major Hurricanes: 3
Sources: National Oceanic and Atmospheric Administration (NOAA), National Weather Service (NWS)
Climate Prediction Center (CPC) , “NOAA 2019 Atlantic Hurricane Season Outlook,” May 23, 2019, at
https://www.cpc.ncep.noaa.gov/products/outlooks/hurricane2019/May/hurricane.shtml; NOAA, NWS CPC,
“NOAA 2019 Atlantic Hurricane Season Outlook,” August 8, 2019, at https://www.cpc.ncep.noaa.gov/products/
outlooks/hurricane2019/August/hurricane.shtml; and NOAA, “Hurricanes and Tropical Storms – November
2019,” at https://www.ncdc.noaa.gov/sotc/tropical-cyclones/201911.
In its August update, NOAA provided two reasons for a more active 2019 hurricane season than originally predicted in May 2019:120
El Niño conditions dissipated in July, and El Niño conditions were expected to
remain neutral. (El Niño conditions typically suppress factors that may lead to
hurricanes, so neutral conditions could favor increased hurricane activity.)121
The conducive conditions associated with the ongoing high-activity era for
Atlantic hurricanes that began in 1995 remained in effect.122
118 National Oceanic and Atmospheric Administration (NOAA), National Weather Service (NWS) Climate Prediction
Center (CPC), “NOAA 2019 Atlantic Hurricane Season Outlook,” May 23, 2019, at https://www.cpc.ncep.noaa.gov/
products/outlooks/hurricane2019/May/hurricane.shtml.
119 NOAA NWS CPC, “NOAA 2019 Atlantic Hurricane Season Outlook ,” August 8, 2019, at https://www.cpc.ncep.noaa.gov/products/outlooks/hurricane2019/August/hurricane.shtml. Hereafter NOAA, “August
2019 Atlantic Hurricane Outlook.”
120 NOAA, “August 2019 Atlantic Hurricane Outlook.”
121 For more information about El Niño, see NOAA, “El Niño,” at https://www.noaa.gov/education/resource-
collections/weather-atmosphere-education-resources/el-nino. 122 For more information about the ongoing high-activity era, see NOAA, “Atlantic high-activity eras: What does it
mean for hurricane season?,” at https://www.noaa.gov/stories/atlantic-high-activity-eras-what-does-it-mean-for-
Forecasting Tropical Cyclones: Overview and Issues for Congress
Congressional Research Service 24
In 2019, for the fifth consecutive year, hurricane activity began prior to June 1, with the formation
of Subtropical Storm Andrea on May 20, 2019.123 Eighteen named storms formed in the north
Atlantic basin between May 20 and November 30, 2019, three of which reached major hurricane
strength (Dorian, Humberto, and Lorenzo).124 Tropical Storm Imelda produced historic rainfall
totals and devastating flooding over parts of eastern Texas, similar to that of Hurricane Harvey in
2017.125 The 2019 Atlantic hurricane season marks the fourth consecutive above-normal Atlantic hurricane season (1998-2001 is the only other period on record with four consecutive above-normal seasons).126 Forecasts for each of the three major hurricanes are discussed below.
Hurricane Dorian
Hurricane Dorian was the first major hurricane of the 2019 season (Figure A-1). The category 5
storm tied with three other hurricanes as the second strongest hurricane on record in the Atlantic basin in terms of wind speed.127 The storm caused catastrophic storm surge flooding in the
Bahamas and various levels of storm surge flooding along the coast of the southeastern United
States.128 The storm also resulted in high rainfall in parts of the Bahamas, South Carolina, North
Carolina, and later in Nova Scotia.129 It spawned 21 tornadoes, mostly in North Carolina, of
assorted intensities.130 After stalling over the northwestern Bahamas for several days, Hurricane Dorian brushed the southeast U.S. coast and made landfall on the Outer Banks of North Carolina
as a category 1 hurricane.131 Hurricane Dorian was responsible for four indirect deaths in the
United States, in addition to multiple deaths reported in the Bahamas.132 The storm caused estimated damages of $3.4 billion in the Bahamas and $1.6 billion in the United States. 133
The National Hurricane Center (NHC) track forecast for Hurricane Dorian was better than
average, meaning the forecast errors were lower than the average official forecast errors for
hurricanes during the previous five-year (2014-2018) period (Table A-2). According to NOAA,
the reformation of Dorian’s center after crossing St. Lucia resulted in a significant shift in track,
hurricane-season. 123 NOAA, “Active 2019 Atlantic hurricane season comes to an end,” at https://www.noaa.gov/media-release/active-
2019-atlantic-hurricane-season-comes-to-end. Hereafter NOAA, “Active 2019 Atlantic.”
124NOAA, “Active 2019 Atlantic.”
125 NOAA, “Hurricanes and Tropical Storms – September 2019,” at https://www.ncdc.noaa.gov/sotc/tropical-cyclones/201909 (hereafter NOAA, “Hurricanes and Tropical Storms – September 2019”); and Andy Latto and Robbie Berg,
National Hurricane Center Tropical Cyclone Report: Tropical Storm Imelda, NOAA, 2019, at
https://www.nhc.noaa.gov/data/tcr/AL112019_Imelda.pdf.
126 NOAA, “Active 2019 Atlantic”; and NOAA, “Hurricanes and Tropical Storms – September 2019.”
127 NOAA, “Hurricanes and Tropical Storms – August 2019,” at https://www.ncdc.noaa.gov/sotc/tropical-cyclones/
201908. Hereafter NOAA, “Hurricanes and Tropical Storms – August 2019.” 128 Lixion A. Avila et al., National Hurricane Center Tropical Cyclone Report: Hurricane Dorian, 2020, pp. 6-8 at
https://www.nhc.noaa.gov/data/tcr/AL052019_Dorian.pdf. Hereafter Avila et al., Hurricane Dorian, 2020.
129 Avila et al., Hurricane Dorian, 2020, p. 8.
130 Avila et al., Hurricane Dorian, 2020, p. 8. 131 NOAA, “Hurricanes and Tropical Storms – August 2019.”
132 According to NOAA, “deaths occurring from such factors as heart attacks, house fires, electrocutions from downed
power lines, vehicle accidents on wet roads, etc., are considered ‘indirect’ deaths.” Avila et al., Hurricane Dorian,
2020, pp. 8-10.
133 Avila et al., Hurricane Dorian, 2020, pp. 8-9.

Forecasting Tropical Cyclones: Overview and Issues for Congress
Congressional Research Service 25
resulting in a “lack of adequate warning for some of the islands of the northeastern Caribbean Sea” and an intensity forecast that underestimated the storm’s expected wind speeds.134
The official NHC intensity forecasts for Hurricane Dorian were worse than the previous five-year average in all forecast periods (Table A-3). NHC noted that “most of the large errors are related
to the fact that Dorian’s center did not move over Hispaniola, and the failure in forecasting rapid intensification (RI) when Dorian was near the Bahamas.”135
NHC issued storm surge watches and warnings at various times along the coasts of the Bahamas
and the southeastern United States. NHC forecasted storm surge of peak storm surge of 18 to 23
feet above normal tide level in parts of the Bahamas; according to NHC, “eye witness accounts
indicate that at least 20 feet of inundation occurred.”136 Storm surge of at least 3 feet occurred
along some parts of the southeastern shore of the United States, however, other portions of the warning area did not “verify,” with inundation less than 3 feet above ground level.137 According
to NHC, “although a sizeable portion of the Storm Surge Warning area did not verify, the issuance
of the watch and warning was justified given that a slight westward deviation of Dorian’s track,
or an expansion of its wind field, would have caused significant storm surge flooding to occur along a larger proportion of the coast.”138
134 Avila et al., Hurricane Dorian, 2020, p. 10. 135 Avila et al., Hurricane Dorian, 2020, p. 11.
136 Avila et al., Hurricane Dorian, 2020, p. 12.
137 Avila et al., Hurricane Dorian, 2020, p. 12. 138 Avila et al., Hurricane Dorian, 2020, p. 12.

Forecasting Tropical Cyclones: Overview and Issues for Congress
Congressional Research Service 26
Figure A-1. Hurricane Dorian’s Track
August 24, 2019, through September 7, 2019
Source: Lixion A. Avila et al., National Hurricane Center Tropical Cyclone Report: Hurricane Dorian, 2020, p. 56, at
https://www.nhc.noaa.gov/data/tcr/AL052019_Dorian.pdf.
Notes: Numbers along the hurricane track indicate dates (e.g., 14 equals September 14, 2019). The small arrow
indicates the point where the hurricane reached its lowest recorded pressure (910 millibars).
Table A-2. NHC Official Track Forecast Errors for Hurricane Dorian Compared with the 2014-2018 Average
in nautical miles
Forecast Forecast Period
12 Hours 24 Hours 36 Hours 48 Hours 72 Hours 96 Hours 120 Hours
NHC
Official 14.3 27.0 38.9 49.5 70.6 109.4 159.7
2014-2018
Averages
23.6 35.5 47.0 61.8 96.0 136.0 179.6
Sources: Lixion A. Avila et al., National Hurricane Center Tropical Cyclone Report: Hurricane Dorian, 2020, p. 39, at
https://www.nhc.noaa.gov/data/tcr/AL052019_Dorian.pdf; and email correspondence with NOAA Office of
Legislative Affairs, May 14, 2020.
Notes: Forecast errors indicate the difference between the forecast track and the actual track in nautical miles.
The National Hurricane Center (NHC) issues official forecasts every 6 hours, and each forecast has projections
valid 12, 24, 36, 48, 72, 96, and 120 hours after the forecast’s initial time.

Forecasting Tropical Cyclones: Overview and Issues for Congress
Congressional Research Service 27
According to NOAA, forecast errors are compared with a five-year period of average errors, as the five-year
period is 1) recent with respect to the state of the science and 2) includes a large number of tropical cyclones to
allow for robust statistical analysis.
Table A-3. NHC Official Intensity Forecast Errors for Hurricane Dorian Compared with the 2014-2018 Average
in nautical miles per hour, or knots
Forecast Forecast Period
12 Hours 24 Hours 36 Hours 48 Hours 72 Hours 96 Hours 120 Hours
NHC
Official
6.6 10.7 13.1 14.3 17.8 25.7 38.9
2014-2018
Averages 5.3 7.9 9.9 11.2 13.3 14.4 14.2
Sources: Lixion A. Avila et al., National Hurricane Center Tropical Cyclone Report: Hurricane Dorian, 2020, p. 41, at
https://www.nhc.noaa.gov/data/tcr/AL052019_Dorian.pdf; and email correspondence with NOAA Office of
Legislative Affairs, May 14, 2020.
Notes: Forecast errors indicate the difference between the forecast intensity and the actual intensity in nautical
miles per hour, or knots.
NHC issues official forecasts every 6 hours, and each forecast has projections valid 12, 24, 36, 48, 72, 96, and
120 hours after the forecast’s initial time.
According to NOAA, forecast errors are compared with a five-year period of average errors, as the five-year
period is 1) recent with respect to the state of the science and 2) includes a large number of tropical cyclones to
allow for robust statistical analysis.
Hurricane Humberto
Hurricane Humberto was a category 3 hurricane that passed the eastern portions of the Bahamas, days after Hurricane Dorian’s impacts (Figure A-2).139 The storm brought hurricane-force winds
to Bermuda and large swells and rip currents to the southeast United States.140 Hurricane
Humberto was responsible for two deaths in the United States and over $25 million in damages in
Bermuda.141 According to NOAA, rainfall amounts associated with the storm were relatively light compared with most tropical cyclones.142
139 Stacy R. Stewart, National Hurricane Center Tropical Cyclone Report: Hurricane Humberto, 2019, at
https://www.nhc.noaa.gov/data/tcr/AL092019_Humberto.pdf. Hereafter Stewart, Hurricane Humberto, 2019.
140 Stewart, Hurricane Humberto, 2019.
141 Stewart, Hurricane Humberto, 2019, pp. 6-7. 142 Stewart, Hurricane Humberto, 2019, p. 6.

Forecasting Tropical Cyclones: Overview and Issues for Congress
Congressional Research Service 28
Figure A-2. Hurricane Humberto’s Track
September 13, 2019, through September 19, 2019
Source: Stacy R. Stewart, National Hurricane Center Tropical Cyclone Report: Hurricane Humberto, 2019, p. 26, at
https://www.nhc.noaa.gov/data/tcr/AL092019_Humberto.pdf.
Notes: Numbers along the hurricane track indicate dates (e.g., 14 denotes September 14, 2019). The small
arrow indicates the point where the hurricane reached its lowest recorded pressure (950 millibars).
The NHC track forecast for Hurricane Humberto was better than average, meaning the forecast
errors were lower than the average official forecast errors for hurricanes during the previous five-year (2014-2018) period (Table A-4). According to NOAA, once Hurricane Humberto became a tropical cyclone, track forecasts improved “significantly.”143
The accuracy of the official NHC intensity forecast for Hurricane Humberto was better than the previous five-year average forecasts in the 12 hour to 72 hour periods but worse than the averages
in the 96 hour and 120 hour periods (Table A-5). NHC noted that forecasts did not anticipate
Hurricane Humberto’s continued strengthening in high wind shear conditions, which led to the
larger than average errors at the 96 hour and 120 hour marks.144 The forecast also did not capture
the storm’s rapid weakening. NHC did not issue any storm surge watches or warnings for this storm.
143 Stewart, Hurricane Humberto, 2019, p. 7. 144 Stewart, Hurricane Humberto, 2019, p. 8.

Forecasting Tropical Cyclones: Overview and Issues for Congress
Congressional Research Service 29
Table A-4. NHC Official Track Forecast Errors for Hurricane Humberto
Compared with the 2014-2018 Average
in nautical miles
Forecast Forecast Period
12 Hours 24 Hours 36 Hours 48 Hours 72 Hours 96 Hours 120 Hours
NHC
Official
17.5 29.2 44.6 58.8 93.2 75.5 122.8
2014-2018
Averages 23.6 35.5 47.0 61.8 96.0 136.0 179.6
Sources: Stacy R. Stewart, National Hurricane Center Tropical Cyclone Report: Hurricane Humberto, 2019, p. 26, at
https://www.nhc.noaa.gov/data/tcr/AL092019_Humberto.pdf; and email correspondence with NOAA Office of
Legislative Affairs, May 14, 2020.
Notes: Forecast errors indicate the difference between the forecast track and the actual track in nautical miles.
NHC issues official forecasts every 6 hours, and each forecast has projections valid 12, 24, 36, 48, 72, 96, and
120 hours after the forecast’s initial time.
According to NOAA, forecast errors are compared with a five-year period of average errors, as the five-year
period is 1) recent with respect to the state of the science and 2) includes a large number of tropical cyclones to
allow for robust statistical analysis.
Table A-5. NHC Official Intensity Forecast Errors for Hurricane Humberto Compared with the 2014-2018 Average
in nautical miles per hour, or knots
Forecast Forecast Period
12 Hours 24 Hours 36 Hours 48 Hours 72 Hours 96 Hours 120 Hours
NHC
Official
5.2 6.2 5.3 8.5 10.8 17.2 21.0
2014-2018
Averages
5.3 7.9 9.9 11.2 13.3 14.4 14.2
Source: Stacy R. Stewart, National Hurricane Center Tropical Cyclone Report: Hurricane Humberto, 2019, p. 28, at
https://www.nhc.noaa.gov/data/tcr/AL092019_Humberto.pdf; and email correspondence with NOAA Office of
Legislative Affairs, May 14, 2020.
Notes: Forecast errors indicate the difference between the forecast intensity and the actual intensity in nautical
miles per hour, or knots.
NHC issues official forecasts every 6 hours, and each forecast has projections valid 12, 24, 36, 48, 72, 96, and
120 hours after the forecast’s initial time.
According to NOAA, forecast errors are compared with a five-year period of average errors, as the five-year
period is 1) recent with respect to the state of the science and 2) includes a large number of tropical cyclones to
allow for robust statistical analysis.
Hurricane Lorenzo
Hurricanes typically become major hurricanes in the western portion of the north Atlantic Ocean;
Hurricane Lorenzo was one of the strongest hurricanes on record in the eastern or central Atlantic and the farthest east of any category 5 hurricane in the Atlantic on record (Figure A-3).145 The
145 David A. Zelinsky, National Hurricane Center Tropical Cyclone Report: Hurricane Lorenzo, 2019, at
https://www.nhc.noaa.gov/data/tcr/AL132019_Lorenzo.pdf (hereafter Zelinsky, Hurricane Lorenzo, 2019); and

Forecasting Tropical Cyclones: Overview and Issues for Congress
Congressional Research Service 30
storm remained a category 1 hurricane as it passed the Azores Islands.146 The hurricane generated
hazardous surf and marine conditions along the U.S. East Coast and strong winds and powerful
waves in the Azores and Ireland.147 Hurricane Lorenzo was responsible for 19 deaths in total, including 8 people along the U.S. East Coast.148
Figure A-3. Hurricane Lorenzo’s Track
September 22, 2019, through October 4, 2019
Source: David A. Zelinsky, National Hurricane Center Tropical Cyclone Report: Hurricane Lorenzo, 2019, at
https://www.nhc.noaa.gov/data/tcr/AL132019_Lorenzo.pdf.
Notes: Numbers along the hurricane track indicate dates (e.g., 24 denotes September 14, 2019). The small
arrow indicates the point where the hurricane reached its lowest recorded pressure (925 millibars) .
The NHC track forecast errors for Hurricane Lorenzo were lower than the average official
forecast errors during the previous five-year (2014-2018) period (Table A-6).149 The NHC
intensity forecast for Hurricane Lorenzo had greater errors in the 12 hour and 24 hour periods
than the mean official errors for the previous five-year period but the errors decreased at 36 hours
and beyond (Table A-7). 150 NHC noted that the relatively high errors in the short-term forecasts
NOAA, “Hurricanes and Tropical Storms – September 2019.”
146 NOAA, “Hurricanes and Tropical Storms – September 2019.”
147 Zelinsky, Hurricane Lorenzo, 2019, pp. 4-5. 148 The other 11 deaths account for the crewmembers of the Bourbon Rhode. NHC provided 35 forecasts in support of
the U.S. Coast Guard’s search and rescue mission. Zelinsky, Hurricane Lorenzo, 2019, pp. 4 and 6.
149 Zelinsky, Hurricane Lorenzo, 2019, p. 5.
150 Zelinsky, Hurricane Lorenzo, 2019, p. 6.

Forecasting Tropical Cyclones: Overview and Issues for Congress
Congressional Research Service 31
were primarily associated with Hurricane Lorenzo’s rapid intensification (RI) and weakening at
the storm’s onset.151 None of the intensity models reviewed captured the storm’s large intensity swings.152
Table A-6. NHC Official Track Forecast Errors for Hurricane Lorenzo Compared with the 2014-2018 Average
in nautical miles
Forecast Forecast Period
12 Hours 24 Hours 36 Hours 48 Hours 72 Hours 96 Hours 120 Hours
NHC
Official
19.0 25.2 34.0 45.2 68.2 90.5 102.0
2014-2018
Averages
23.6 35.5 47.0 61.8 96.0 136.0 179.6
Sources: David A. Zelinsky, National Hurricane Center Tropical Cyclone Report: Hurricane Lorenzo, 2019, p. 12, at
https://www.nhc.noaa.gov/data/tcr/AL132019_Lorenzo.pdf; and email correspondence with NOAA Office of
Legislative Affairs, May 14, 2020.
Notes: Forecast errors indicate the difference between the forecast track and the actual track in nautical miles.
NHC issues official forecasts every 6 hours, and each forecast has projections valid 12, 24, 36, 48, 72, 96, and
120 hours after the forecast’s initial time.
According to NOAA, forecast errors are compared with a five-year period of average errors, as the five-year
period is 1) recent with respect to the state of the science and 2) includes a large number of tropical cyclones to
allow for robust statistical analysis.
Table A-7. NHC Official Intensity Forecast Errors for Hurricane Lorenzo Compared with the 2014-2018 Average
in nautical miles per hour, or knots
Forecast Forecast Period
12 Hours 24 Hours 36 Hours 48 Hours 72 Hours 96 Hours 120 Hours
NHC
Official 7.6 10.7 8.6 8.7 12.7 11.6 11.4
2014-2018
Averages
5.3 7.9 9.9 11.2 13.3 14.4 14.2
Sources: David A. Zelinsky, National Hurricane Center Tropical Cyclone Report: Hurricane Lorenzo, 2019, p. 14, at
https://www.nhc.noaa.gov/data/tcr/AL132019_Lorenzo.pdf; and email correspondence with NOAA Office of
Legislative Affairs, May 14, 2020.
Notes: Forecast errors indicate the difference between the forecast intensity and the actual intensity in nautical
miles per hour, or knots.
NHC issues official forecasts every 6 hours, and each forecast has projections valid 12, 24, 36, 48, 72, 96, and
120 hours after the forecast’s initial time.
According to NOAA, forecast errors are compared with a five-year period of average errors, as the five-year
period is 1) recent with respect to the state of the science and 2) includes a large number of tropical cyclones to
allow for robust statistical analysis.
151 Zelinsky, Hurricane Lorenzo, 2019, p. 6. 152 Zelinsky, Hurricane Lorenzo, 2019, p. 6.
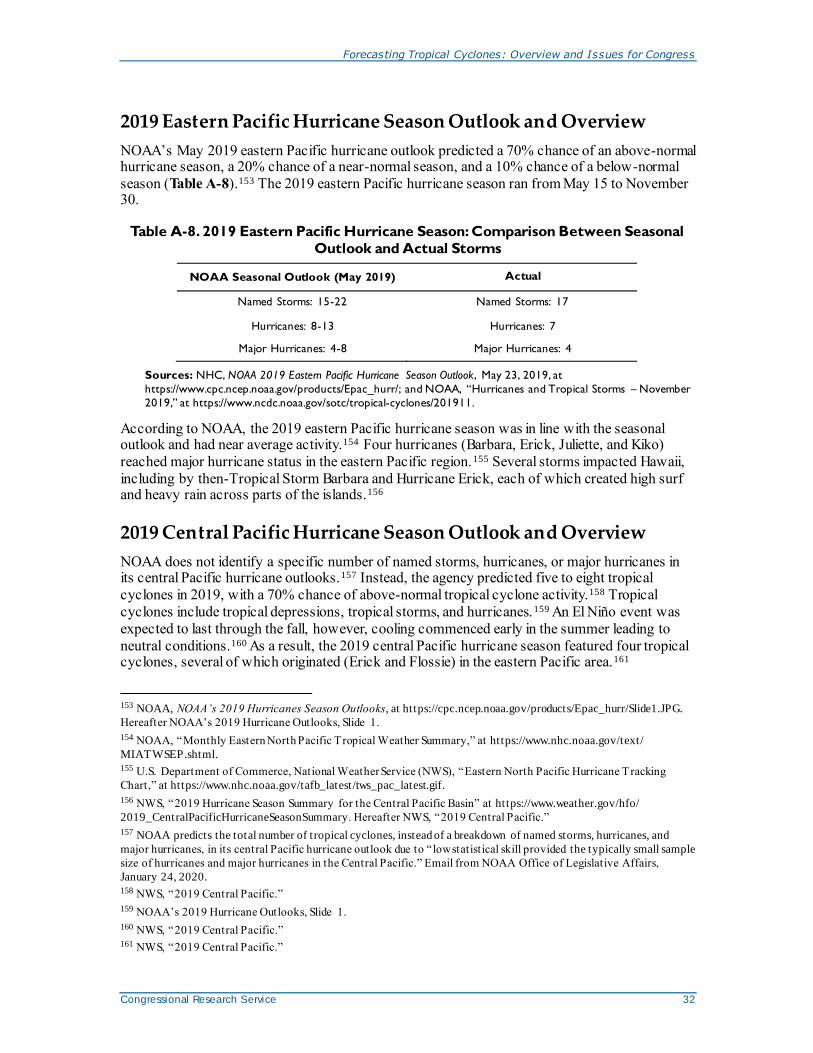
Forecasting Tropical Cyclones: Overview and Issues for Congress
Congressional Research Service 32
2019 Eastern Pacific Hurricane Season Outlook and Overview
NOAA’s May 2019 eastern Pacific hurricane outlook predicted a 70% chance of an above-normal hurricane season, a 20% chance of a near-normal season, and a 10% chance of a below-normal
season (Table A-8).153 The 2019 eastern Pacific hurricane season ran from May 15 to November 30.
Table A-8. 2019 Eastern Pacific Hurricane Season: Comparison Between Seasonal Outlook and Actual Storms
NOAA Seasonal Outlook (May 2019) Actual
Named Storms: 15-22 Named Storms: 17
Hurricanes: 8-13 Hurricanes: 7
Major Hurricanes: 4-8 Major Hurricanes: 4
Sources: NHC, NOAA 2019 Eastern Pacific Hurricane Season Outlook, May 23, 2019, at
https://www.cpc.ncep.noaa.gov/products/Epac_hurr/; and NOAA, “Hurricanes and Tropical Storms – November
2019,” at https://www.ncdc.noaa.gov/sotc/tropical-cyclones/201911.
According to NOAA, the 2019 eastern Pacific hurricane season was in line with the seasonal outlook and had near average activity.154 Four hurricanes (Barbara, Erick, Juliette, and Kiko)
reached major hurricane status in the eastern Pacific region.155 Several storms impacted Hawaii,
including by then-Tropical Storm Barbara and Hurricane Erick, each of which created high surf and heavy rain across parts of the islands.156
2019 Central Pacific Hurricane Season Outlook and Overview
NOAA does not identify a specific number of named storms, hurricanes, or major hurricanes in its central Pacific hurricane outlooks.157 Instead, the agency predicted five to eight tropical
cyclones in 2019, with a 70% chance of above-normal tropical cyclone activity.158 Tropical
cyclones include tropical depressions, tropical storms, and hurricanes.159 An El Niño event was
expected to last through the fall, however, cooling commenced early in the summer leading to
neutral conditions.160 As a result, the 2019 central Pacific hurricane season featured four tropical cyclones, several of which originated (Erick and Flossie) in the eastern Pacific area.161
153 NOAA, NOAA’s 2019 Hurricanes Season Outlooks, at https://cpc.ncep.noaa.gov/products/Epac_hurr/Slide1.JPG.
Hereafter NOAA’s 2019 Hurricane Outlooks, Slide 1.
154 NOAA, “Monthly Eastern North Pacific Tropical Weather Summary,” at https://www.nhc.noaa.gov/text/
MIATWSEP.shtml. 155 U.S. Department of Commerce, National Weather Service (NWS), “Eastern North Pacific Hurricane Tracking
Chart,” at https://www.nhc.noaa.gov/tafb_latest/tws_pac_latest.gif.
156 NWS, “2019 Hurricane Season Summary for the Central Pacific Basin” at https://www.weather.gov/hfo/
2019_CentralPacificHurricaneSeasonSummary. Hereafter NWS, “2019 Central Pacific.”
157 NOAA predicts the total number of tropical cyclones, instead of a breakdown of named storms, hurricanes, and
major hurricanes, in its central Pacific hurricane outlook due to “ low statistical skill provided the typically small sample
size of hurricanes and major hurricanes in the Central Pacific.” Email from NOAA Office of Legislative Affairs,
January 24, 2020. 158 NWS, “2019 Central Pacific.”
159 NOAA’s 2019 Hurricane Outlooks, Slide 1.
160 NWS, “2019 Central Pacific.” 161 NWS, “2019 Central Pacific.”

Forecasting Tropical Cyclones: Overview and Issues for Congress
Congressional Research Service 33
Appendix B. 2018 Hurricane Season Outlooks and
Overviews
2018 Atlantic Hurricane Season Outlook and Overview
NOAA predicted a total of 10-16 named storms in its May 2018 outlook and downgraded the total
named storms to 9-13 storms in the August update.162 The number and strength of actual storms exceeded the upper range of NOAA’s seasonal outlook (Table B-1).
Table B-1. 2018 Atlantic Hurricane Season: Comparison Between Seasonal Outlook
and Actual Storms
NOAA Seasonal Outlook
(May 2018)
NOAA Seasonal Outlook
(August 2018) Actual
Named Storms: 10-16 Named Storms: 9-13 Named Storms: 15
Hurricanes: 5-9 Hurricanes: 4-7 Hurricanes: 8
Major Hurricanes: 1-4 Major Hurricanes: 0-2 Major Hurricanes: 2
Sources: NOAA, NOAA’s 2018 Hurricane Season Outlooks, at https://www.cpc.ncep.noaa.gov/products/outlooks/
hurricane2018/May/Slide1.JPG; NOAA, NOAA’s Updated 2018 Atlantic Hurricane Season Outlook, at
https://www.cpc.ncep.noaa.gov/products/outlooks/hurricane2018/August/Slide1.JPG; and NOAA, “Destructive
2018 Atlantic Hurricane Season Draws to an End,” November 28, 2018, at https://www.noaa.gov/media-release/
destructive-2018-atlantic-hurricane-season-draws-to-end.
In 2018, for the fourth consecutive year, hurricane activity began prior to June 1, with Tropical
Storm Alberto forming on May 25.163 The 2018 hurricane season also featured four named storms active at the same time.164 Two major hurricanes affected the continental United States in 2018,
causing severe damage: Hurricane Florence and Hurricane Michael.165 Forecasts for each of the two major hurricanes are discussed below.
Hurricane Florence
Hurricane Florence was the first major hurricane of the 2018 season, making landfall near Wrightsville Beach, NC, on September 14, 2018 (Figure B-1). It achieved category 4 strength
before making landfall. The maximum total rainfall of 35.93 inches was reported about 6 nautical
miles (n mi) northwest of Elizabethtown, NC.166 In total, Hurricane Florence is linked to 52
deaths (direct and indirect) and $24 billion in wind and water damage.167 Hurricane Florence
resulted in state rainfall records for both North Carolina and South Carolina, at 35.93 inches and 23.63 inches, respectively. Hurricane Florence also set record peak water levels in the Waccamaw
162 NOAA, “NOAA 2018 Atlantic Hurricane Season Outlook .”
163 NOAA, “Destructive 2018 Atlantic Hurricane Season Draws to an End,” November 28, 2018, at
https://www.noaa.gov/media-release/destructive-2018-atlantic-hurricane-season-draws-to-end. Hereafter NOAA,
“Destructive 2018,” 2018.
164 NOAA, “Destructive 2018,” 2018. 165 NOAA NHC, “2018 Atlantic Hurricane Season,” at https://www.nhc.noaa.gov/data/tcr/index.php?season=2018&
basin=atl. Hereafter NHC, “2018 Atlantic Hurricane Season.”
166 Stewart and Berg, Hurricane Florence, 2019.
167 Stewart and Berg, Hurricane Florence, 2019, pp. 8-9.

Forecasting Tropical Cyclones: Overview and Issues for Congress
Congressional Research Service 34
River in Freeland, NC, and the Little Pee Dee River in Galivants Ferry, SC, with the river reaching peak flood levels a month after Hurricane Florence made landfall.168
Figure B-1. Hurricane Florence’s Track
August 31, 2018, through September 17, 2018
Source: Stacy R. Stewart and Robbie Berg, National Hurricane Center Tropical Cyclone Report: Hurricane Florence,
2019, at https://www.nhc.noaa.gov/data/tcr/AL062018_Florence.pdf.
Notes: Numbers along the hurricane track indicate dates (e.g., 14 denotes September 14, 2018). The small
arrow indicates the point where the hurricane reached its lowest recorded pressure (937 millibars).
The NHC track forecast for Florence was better than average, meaning the forecast errors were
lower than the average official forecast errors for hurricanes during the previous five-year period (2013-2017, Table B-2). The accuracy of the official NHC intensity forecast for Hurricane
Florence generally had higher forecast errors than the previous five-year average forecasts (Table
B-3). The previous five-year average intensity forecasts were better than the Hurricane Florence
forecasts for all but the 120 hour period.169 NHC indicated that the errors were due to the storm’s
unexpected first rapid intensification (RI) and its unanticipated rapid weakening. NHC noted that
“the second RI period was anticipated and thus better forecast, albeit the time of peak intensity was about 18h later and 10 kt higher than what occurred.”170
168 Stewart and Berg, Hurricane Florence, 2019, p. 7, and NOAA, “ Destructive 2018,” 2018.
169 A knot (kt) is 1 nautical mile per hour (mph), equivalent to approximately 1.15 mph. 170 Stewart and Berg, Hurricane Florence, 2019, p. 15.
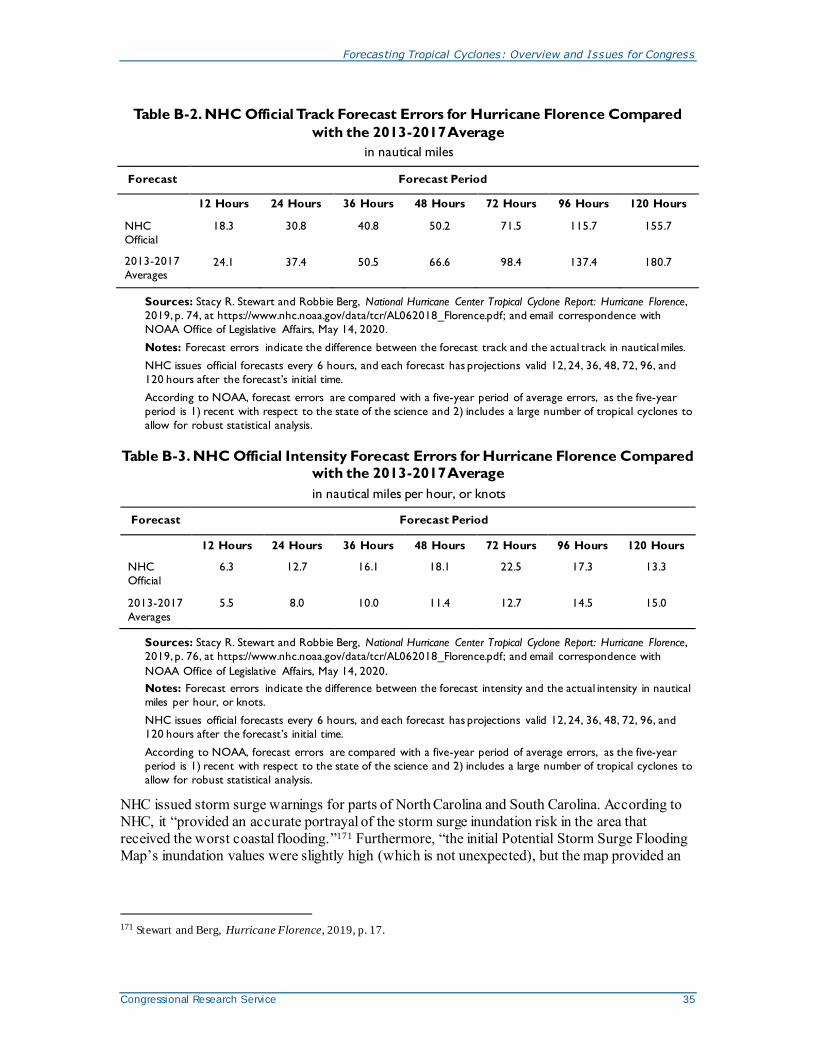
Forecasting Tropical Cyclones: Overview and Issues for Congress
Congressional Research Service 35
Table B-2. NHC Official Track Forecast Errors for Hurricane Florence Compared
with the 2013-2017 Average
in nautical miles
Forecast Forecast Period
12 Hours 24 Hours 36 Hours 48 Hours 72 Hours 96 Hours 120 Hours
NHC
Official
18.3 30.8 40.8 50.2 71.5 115.7 155.7
2013-2017
Averages 24.1 37.4 50.5 66.6 98.4 137.4 180.7
Sources: Stacy R. Stewart and Robbie Berg, National Hurricane Center Tropical Cyclone Report: Hurricane Florence,
2019, p. 74, at https://www.nhc.noaa.gov/data/tcr/AL062018_Florence.pdf; and email correspondence with
NOAA Office of Legislative Affairs, May 14, 2020.
Notes: Forecast errors indicate the difference between the forecast track and the actual track in nautical miles.
NHC issues official forecasts every 6 hours, and each forecast has projections valid 12, 24, 36, 48, 72, 96, and
120 hours after the forecast’s initial time.
According to NOAA, forecast errors are compared with a five-year period of average errors, as the five-year
period is 1) recent with respect to the state of the science and 2) includes a large number of tropical cyclones to
allow for robust statistical analysis.
Table B-3. NHC Official Intensity Forecast Errors for Hurricane Florence Compared with the 2013-2017 Average
in nautical miles per hour, or knots
Forecast Forecast Period
12 Hours 24 Hours 36 Hours 48 Hours 72 Hours 96 Hours 120 Hours
NHC
Official
6.3 12.7 16.1 18.1 22.5 17.3 13.3
2013-2017
Averages
5.5 8.0 10.0 11.4 12.7 14.5 15.0
Sources: Stacy R. Stewart and Robbie Berg, National Hurricane Center Tropical Cyclone Report: Hurricane Florence,
2019, p. 76, at https://www.nhc.noaa.gov/data/tcr/AL062018_Florence.pdf; and email correspondence with
NOAA Office of Legislative Affairs, May 14, 2020.
Notes: Forecast errors indicate the difference between the forecast intensity and the actual intensity in nautical
miles per hour, or knots.
NHC issues official forecasts every 6 hours, and each forecast has projections valid 12, 24, 36, 48, 72, 96, and
120 hours after the forecast’s initial time.
According to NOAA, forecast errors are compared with a five-year period of average errors, as the five-year
period is 1) recent with respect to the state of the science and 2) includes a large number of tropical cyclones to
allow for robust statistical analysis.
NHC issued storm surge warnings for parts of North Carolina and South Carolina. According to
NHC, it “provided an accurate portrayal of the storm surge inundation risk in the area that
received the worst coastal flooding.”171 Furthermore, “the initial Potential Storm Surge Flooding
Map’s inundation values were slightly high (which is not unexpected), but the map provided an
171 Stewart and Berg, Hurricane Florence, 2019, p. 17.

Forecasting Tropical Cyclones: Overview and Issues for Congress
Congressional Research Service 36
accurate representation of the ultimate storm surge footprint and a depiction of the areas most at risk of the highest storm surge despite the hurricane’s evolving structure and intensity.”172
Hurricane Michael
Hurricane Michael was the second major hurricane to strike the conterminous U.S. coast in 2018,
making landfall near Mexico Beach and Tyndall Air Force Base, FL, at category 5 strength—which was unprecedented for the region—on October 10, 2018 (Figure B-2). Hurricane Michael
was originally recorded as a high-end category 4 storm, but upon post-storm analysis, it was
upgraded to category 5.173 According to NHC, Hurricane Michael was “the strongest hurricane on
record to strike the Florida panhandle, and was the third-most-intense hurricane to make landfall
in the continental U.S. in terms of central pressure (919 mb) and the fourth-strongest in terms of
maximum sustained winds (155 mph).”174 In total, 59 deaths (direct and indirect) and $25 billion in wind and water damages were linked to Hurricane Michael.175 Hurricane Michael’s landfall
marks the latest date of a category 5 hurricane landfall in the United States.176 Hurricane Michael
produced high storm surge, peaking at about 14 feet near Mexico Beach, FL, in addition to significant wave activity along the shoreline.177
172 Stewart and Berg, Hurricane Florence, 2019, p. 17.
173 NOAA, “Hurricane Michael Upgraded to a Category 5 at t ime of U.S. Landfall,” April 19, 2019, at
https://www.noaa.gov/media-release/hurricane-michael-upgraded-to-category-5-at-time-of-us-landfall. Hereafter
NOAA, “Hurricane Michael Upgraded,” 2019. 174 NOAA, “Destructive 2018,” 2018.
175 John L. Beven II, Robbie Berg, and Andrew Hagan, National Hurricane Center Tropical Cyclone Report:
Hurricane Michael, NOAA, 2019, p. 11, at https://www.nhc.noaa.gov/data/tcr/AL142018_Michael.pdf. Hereafter
Beven, Berg, and Hagan, Hurricane Michael, 2019.
176 Beven, Berg, and Hagan, Hurricane Michael, 2019, p. 6. 177 Beven, Berg, and Hagan, Hurricane Michael, 2019, p. 8.
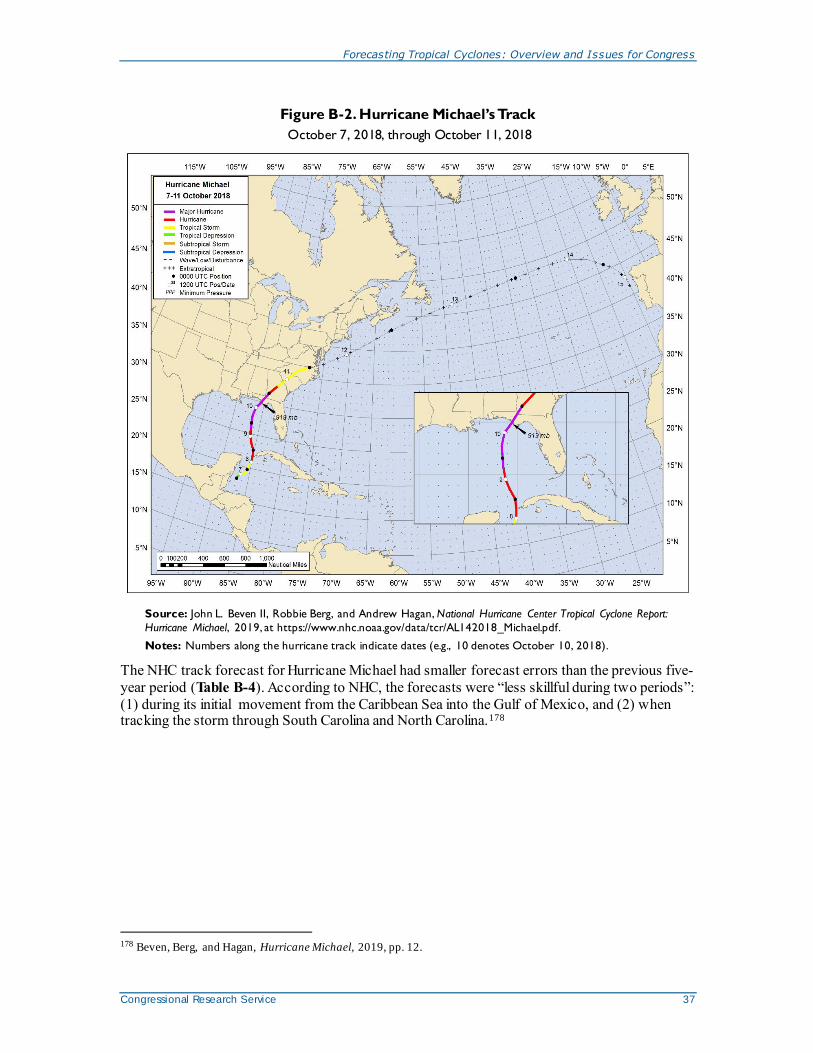
Forecasting Tropical Cyclones: Overview and Issues for Congress
Congressional Research Service 37
Figure B-2. Hurricane Michael’s Track
October 7, 2018, through October 11, 2018
Source: John L. Beven II, Robbie Berg, and Andrew Hagan, National Hurricane Center Tropical Cyclone Report:
Hurricane Michael, 2019, at https://www.nhc.noaa.gov/data/tcr/AL142018_Michael.pdf.
Notes: Numbers along the hurricane track indicate dates (e.g., 10 denotes October 10, 2018).
The NHC track forecast for Hurricane Michael had smaller forecast errors than the previous five-
year period (Table B-4). According to NHC, the forecasts were “less skillful during two periods”:
(1) during its initial movement from the Caribbean Sea into the Gulf of Mexico, and (2) when tracking the storm through South Carolina and North Carolina.178
178 Beven, Berg, and Hagan, Hurricane Michael, 2019, pp. 12.

Forecasting Tropical Cyclones: Overview and Issues for Congress
Congressional Research Service 38
Table B-4. NHC Official Track Forecast Errors for Hurricane Michael Compared with
the 2013-2017 Average
in nautical miles
Forecast Forecast Period
12 Hours 24 Hours 36 Hours 48 Hours 72 Hours 96 Hours
120
Hours
NHC
Official
20.0 34.5 47.1 45.9 64.4 85.2 N/A
2013-2017
Averages 24.1 37.4 50.5 66.6 98.4 137.4 N/A
Sources: John L. Beven II, Robbie Berg, and Andrew Hagan, National Hurricane Center Tropical Cyclone Report:
Hurricane Michael, 2019, p. 66, at https://www.nhc.noaa.gov/data/tcr/AL142018_Michael.pdf; and email
correspondence with NOAA Office of Legislative Affairs, May 14, 2020.
Notes: Forecast errors indicate the difference between the forecast track and the actual track in nautical miles.
NHC issues official forecasts every 6 hours, and each forecast has projections valid 12, 24, 36, 48, 72, 96, and
120 hours after the forecast’s initial time.
According to NOAA, forecast errors are compared with a five-year period of average errors, as the five-year
period is 1) recent with respect to the state of the science and 2) includes a large number of tropical cyclones to
allow for robust statistical analysis.
The intensity forecast errors for Hurricane Michael were greater than the five-year period
averages in all cases except the 96-hour period (Table B-5). NHC acknowledged that Hurricane
Michael intensified more quickly than anticipated, despite a moderate-to-strong wind shear,
which may have undermined later predictions, as the forecasted intensity was greater than the actual storm intensity.179
Table B-5. NHC Official Intensity Forecast Errors for Hurricane Michael Compared with the 2013-2017 Average
in nautical miles per hour, or knots
Forecast Forecast Period
12 Hours 24 Hours 36 Hours 48 Hours 72 Hours 96 Hours 12 Hours
NHC
Official
6.8 12.3 14.6 19.1 24.3 3.3 N/A
2013-2017
Averages
5.5 8.0 10.1 11.4 12.7 14.5 N/A
Sources: John L. Beven II, Robbie Berg, and Andrew Hagan, National Hurricane Center Tropical Cyclone Report:
Hurricane Michael, 2019, p. 68, at https://www.nhc.noaa.gov/data/tcr/AL142018_Michael.pdf; and email
correspondence with NOAA Office of Legislative Affairs, May 14, 2020.
Notes: Forecast errors indicate the difference between the forecast intensity and the actual intensity in nautical
miles per hour, or knots.
NHC issues official forecasts every 6 hours, and each forecast has projections valid 12, 24, 36, 48, 72, 96, and
120 hours after the forecast’s initial time.
179 Beven, Berg, and Hagan, Hurricane Michael, 2019, p. 13. Wind shear refers to how wind changes speed and
direction with height. NWS, “Severe Weather Topics,” at https://www.weather.gov/ilx/swop-springtopics.

Forecasting Tropical Cyclones: Overview and Issues for Congress
Congressional Research Service 39
According to NOAA, forecast errors are compared with a five-year period of average errors, as the five-year
period is 1) recent with respect to the state of the science and 2) includes a large number of tropical cyclones to
allow for robust statistical analysis.
NHC issued several storm surge watches and warnings along the coasts of North Carolina and
Florida related to Hurricane Michael. NHC did not comment on the accuracy of its storm surge warnings in its post-hurricane report.180
2018 Eastern Pacific Hurricane Season Overview
NOAA predicted 14-20 named storms for the 2018 eastern Pacific hurricane season (Table B-6). The actual total was 22 named storms.
Table B-6. 2018 Eastern Pacific Hurricane Season: Comparison Between Seasonal Outlook and Actual Storms
NOAA Seasonal Outlook (May 2018) Actual
Named Storms: 14-20 Named Storms: 22
Hurricanes: 7-12 Hurricanes: 12
Major Hurricanes: 3-7 Major Hurricanes: 9
Sources: NOAA, “Forecasters predict a near- or above-normal 2018 Atlantic hurricane season,” at
https://www.noaa.gov/media-release/forecasters-predict-near-or-above-normal-2018-atlantic-hurricane-season;
and NOAA, “2018 Monthly Tropical Cyclone Summary,” at https://www.nhc.noaa.gov/archive/tws/?yyyy=2018&
bb=EP&mm=11.
Notes: Other NOAA sources include an additional storm, Hurricane Walaka, in their total actual numbers for
2018. Hurricane Walaka formed in the central Pacific and passed over Johnson Atoll and several northwestern
Hawaiian Islands. Hurricane Walaka is neither included in the counts above nor described in the rest of the
report. NOAA National Centers for Environmental Information, “Hurricanes and Tropical Storms – Annual
2018,” at https://www.ncdc.noaa.gov/sotc/tropical-cyclones/201813#pac.
According to NOAA, the 2018 eastern Pacific hurricane season was very active, with the number
of named storms, hurricanes, and major hurricanes higher than the May 2018 seasonal outlook
and 1981 to 2010 averages.181 The year 2018 ties with the years 1982 and 1985, as years with the
second highest number of named storms in a season for the eastern Pacific.182 No major hurricanes made landfall in Hawaii in 2018, although several damaging tropical cyclones (Lane
and Olivia, described below) passed near or over the islands.183 Both of the storms originated in
the eastern Pacific and moved westward into the central Pacific. According to NOAA, the 2018
eastern Pacific hurricane season had the highest recorded accumulated cyclone energy (ACE)
index, a wind energy index calculated from maximum sustained surface wind speed measurements taken every six hours for all named storms while they are at least tropical storm
180 Beven, Berg, and Hagan, Hurricane Michael, 2019. 181 NOAA, “Forecasters predict a near- or above-normal 2018 Atlantic hurricane season,” at https://www.noaa.gov/
media-release/forecasters-predict-near-or-above-normal-2018-atlantic-hurricane-season; and NOAA National Centers
for Environmental Information, “Hurricanes and Tropical Storms – Annual 2018,” at https://www.ncdc.noaa.gov/sotc/
tropical-cyclones/201813#pac. Hereafter NOAA, “Annual 2018.”
182 NOAA, “Annual 2018.”
183 NOAA, “Annual 2018.” Four major Pacific Ocean hurricanes did make landfall in Mexico in 2018.

Forecasting Tropical Cyclones: Overview and Issues for Congress
Congressional Research Service 40
intensity.184 The ACE index for the eastern Pacific basin during 2018 was 316, almost three times the 1981 to 2010 average of 132.
Hurricane Lane
Hurricane Lane was the first major storm of the 2018 eastern Pac ific hurricane season to affect
the United States.185 Hurricane Lane passed close to Hawaii from August 23 to August 26 as a category 4 storm (Figure B-3). According to NOAA, Hurricane Lane set the state of Hawaii
record for tropical cyclone total rainfall, with one location on the Big Island measuring 58 inches
of total rainfall from the storm.186 As the storm moved across the islands, it produced freshwater
flooding and gusty winds, causing at least $20 million in damage to public infrastructure on the
Big Island, another $2 million in damage on Maui, and over $1.5 million in damage to Kauai. 187
In addition to the rains, strong winds preceding the storm helped spread wildfires on Maui that resulted in over $4 million in damage.188
184 NOAA, “Annual 2018.”
185 John L. Beven II, National Hurricane Center Tropical Cyclone Report - Hurricane Lane, NOAA, April 2, 2019, at
https://www.nhc.noaa.gov/data/tcr/EP142018_Lane.pdf. Hereafter Beven, Hurricane Lane, 2019. 186 NOAA, “2018 Summary for the Central Pacific Basin.”
187 NOAA, “2018 Summary for the Central Pacific Basin.”
188 NOAA, “2018 Summary for the Central Pacific Basin.”

Forecasting Tropical Cyclones: Overview and Issues for Congress
Congressional Research Service 41
Figure B-3. Hurricane Lane’s Track
August 15, 2018 - August 28, 2018
Source: John L. Beven II, National Hurricane Center Tropical Cyclone Report - Hurricane Lane, April 2, 2019, at
https://www.nhc.noaa.gov/data/tcr/EP142018_Lane.pdf.
Notes: Numbers along the hurricane track indicate dates (e.g., 23 denotes August 23, 2018). The small arrow
indicating 926 milllibars indicates the lowest pressure recorded for the storm along this track.
The NHC track forecast was more accurate than the previous five-year period. NHC does not
offer an explanation for the results (Table B-7).189 According to NOAA, the NHC track forecasts performed better than most other models, with several exceptions.190
Table B-7. NHC Official Track Forecast Errors for Hurricane Lane Compared with the 2013-2017 Average
in nautical miles
Forecast Forecast Period
12 Hours 24 Hours 36 Hours 48 Hours 72 Hours 96 Hours 120 Hours
NHC
Official
18.9 25.9 28.4 30.3 50.2 71.7 82.1
2013-2017
Averages
21.8 33.2 43.0 53.9 80.7 111.1 150.5
189 Beven, Hurricane Lane, 2019, pp. 3-4. 190 Beven, Hurricane Lane, 2019, p. 4.

Forecasting Tropical Cyclones: Overview and Issues for Congress
Congressional Research Service 42
Sources: John L. Beven II, National Hurricane Center Tropical Cyclone Report - Hurricane Lane, NOAA, April 2,
2019, p. 14, at https://www.nhc.noaa.gov/data/tcr/EP142018_Lane.pdf; and email correspondence with NOAA
Office of Legislative Affairs, May 14, 2020.
Notes: Forecast errors indicate the difference between the forecast track and the actual track in nautical miles.
NHC issues official forecasts every 6 hours, and each forecast has projections valid 12, 24, 36, 48, 72, 96, and
120 hours after the forecast’s initial time.
According to NOAA, forecast errors are compared with a five-year period of average errors, as the five-year
period is 1) recent with respect to the state of the science and 2) includes a large number of tropical cyclones to
allow for robust statistical analysis.
The NHC intensity forecasts for Hurricane Lane were more accurate than the previous five-year period for the first 48 hours, and they were less accurate than the previous five-year period
between 72 and 120 hours out (Table B-8). According to NHC, the forecasts anticipated
Hurricane Lane’s rapid intensification into a major hurricane in the eastern Pacific (with
subsequent weakening) but did not expect the hurricane’s reintensification in the central Pacific.191
Table B-8. NHC Official Intensity Forecast Errors for Hurricane Lane
Compared with the 2013-2017 Average
in nautical miles per hour, or knots
Forecast Forecast Period
12 Hours 24 Hours 36 Hours 48 Hours 72 Hours 96 Hours 120 Hours
NHC
Official
3.2 6.9 7.8 7.5 15.9 26.9 35.9
2013-2017
Averages 5.8 9.6 11.8 13.2 15.1 15.1 14.6
Sources: John L. Beven II, National Hurricane Center Tropical Cyclone Report - Hurricane Lane, NOAA, April 2,
2019, p. 16, at https://www.nhc.noaa.gov/data/tcr/EP142018_Lane.pdf; and email correspondence with NOAA
Office of Legislative Affairs, May 14, 2020.
Notes: Forecast errors indicate the difference between the forecast intensity and the actual intensity in nautical
miles per hour, or knots.
NHC issues official forecasts every 6 hours, and each forecast has projections valid 12, 24, 36, 48, 72, 96, and
120 hours after the forecast’s initial time.
According to NOAA, forecast errors are compared with a five-year period of average errors, as the five-year
period is 1) recent with respect to the state of the science and 2) includes a large number of tropical cyclones to
allow for robust statistical analysis.
Hurricane Olivia
Hurricane Olivia reached a category 4 at its peak in the eastern Pacific Ocean (Figure B-4).192 It weakened as it crossed into the central Pacific Ocean and moved across Hawaii as a tropical
storm. Tropical Storm Olivia made landfall on September 12, 2018, twice: (1) 10 nm northwest of
Kahului, Maui, and (2) 6 nm north-northwest of Lanai City, Lanai.193 Tropical Storm Olivia
resulted in an extended period of heavy rainfall and flash flooding across the state, including 11 to
191 Beven, Hurricane Lane, 2019, p. 4.
192 John P. Cangialosi and Jon Jelsema, National Hurricane Center Tropical Cyclone Report – Hurricane Olivia,
NOAA, July 25, 2019, at https://www.nhc.noaa.gov/data/tcr/EP172018_Olivia.pdf, p. 6. Hereafter Cangialosi and
Jelsema, Hurricane Olivia, 2019
193 Cangialosi and Jelsema, Hurricane Olivia, 2019, p. 6.
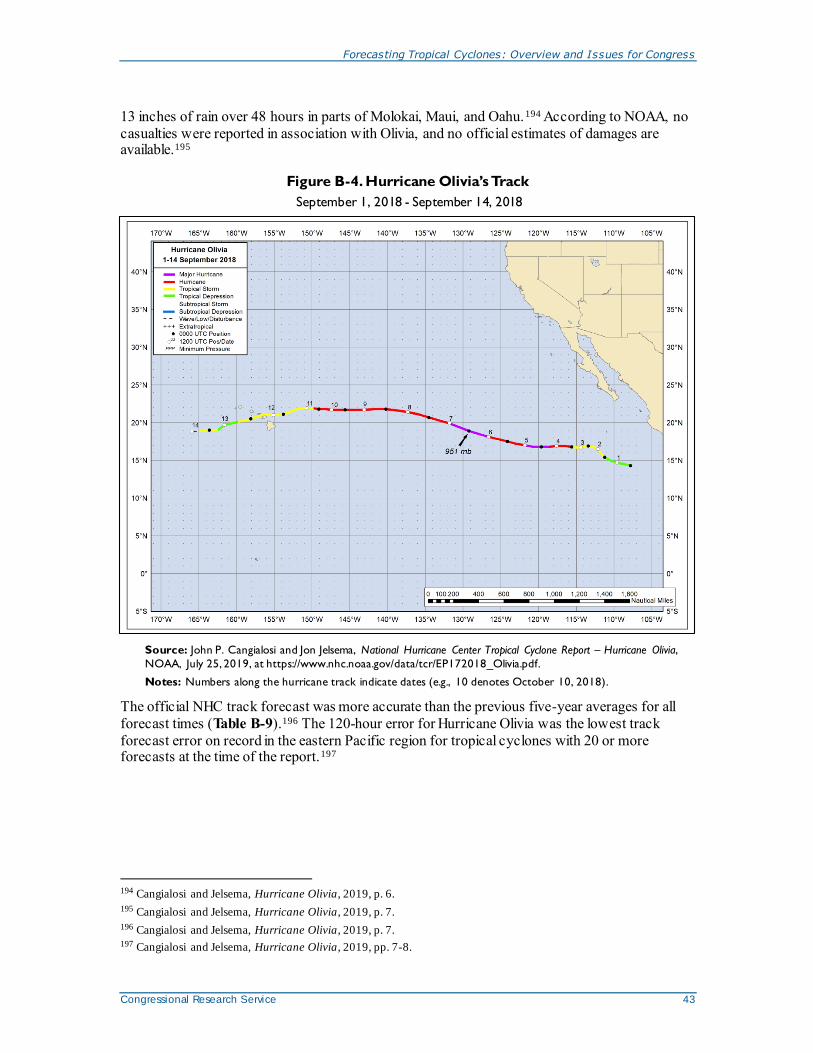
Forecasting Tropical Cyclones: Overview and Issues for Congress
Congressional Research Service 43
13 inches of rain over 48 hours in parts of Molokai, Maui, and Oahu.194 According to NOAA, no
casualties were reported in association with Olivia, and no official estimates of damages are available.195
Figure B-4. Hurricane Olivia’s Track
September 1, 2018 - September 14, 2018
Source: John P. Cangialosi and Jon Jelsema, National Hurricane Center Tropical Cyclone Report – Hurricane Olivia,
NOAA, July 25, 2019, at https://www.nhc.noaa.gov/data/tcr/EP172018_Olivia.pdf.
Notes: Numbers along the hurricane track indicate dates (e.g., 10 denotes October 10, 2018).
The official NHC track forecast was more accurate than the previous five-year averages for all
forecast times (Table B-9).196 The 120-hour error for Hurricane Olivia was the lowest track
forecast error on record in the eastern Pacific region for tropical cyclones with 20 or more forecasts at the time of the report.197
194 Cangialosi and Jelsema, Hurricane Olivia, 2019, p. 6.
195 Cangialosi and Jelsema, Hurricane Olivia, 2019, p. 7.
196 Cangialosi and Jelsema, Hurricane Olivia, 2019, p. 7. 197 Cangialosi and Jelsema, Hurricane Olivia, 2019, pp. 7-8.
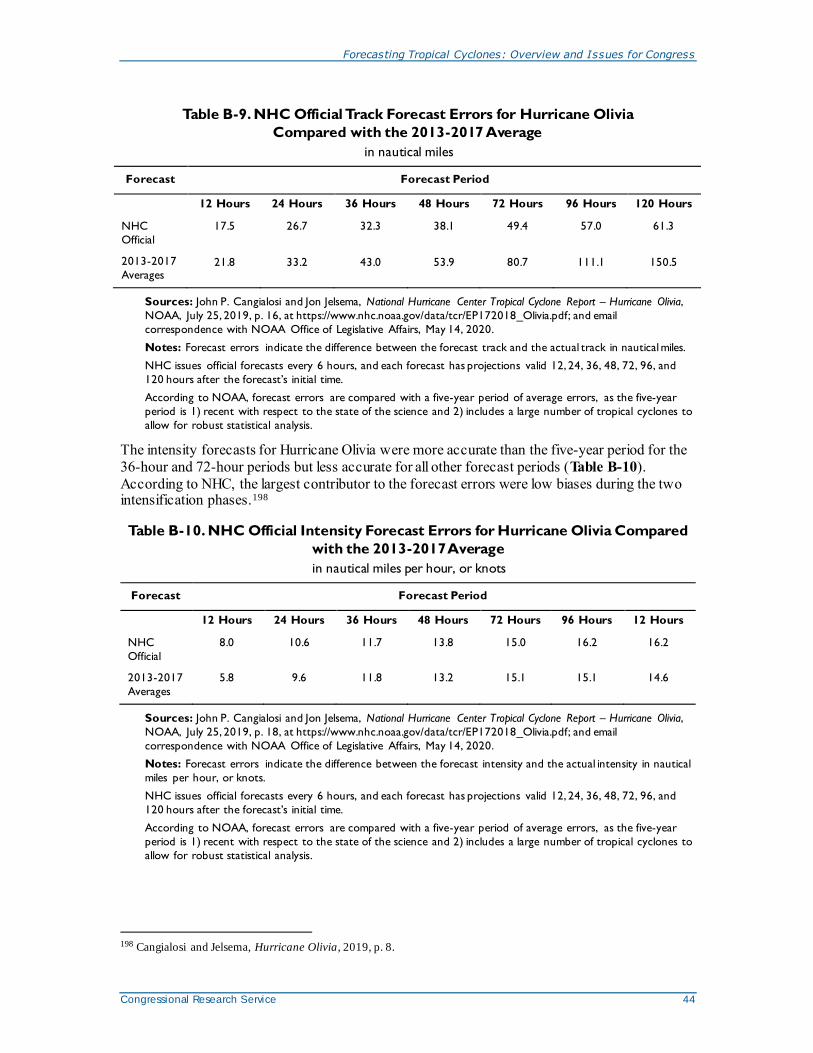
Forecasting Tropical Cyclones: Overview and Issues for Congress
Congressional Research Service 44
Table B-9. NHC Official Track Forecast Errors for Hurricane Olivia
Compared with the 2013-2017 Average
in nautical miles
Forecast Forecast Period
12 Hours 24 Hours 36 Hours 48 Hours 72 Hours 96 Hours 120 Hours
NHC
Official
17.5 26.7 32.3 38.1 49.4 57.0 61.3
2013-2017
Averages 21.8 33.2 43.0 53.9 80.7 111.1 150.5
Sources: John P. Cangialosi and Jon Jelsema, National Hurricane Center Tropical Cyclone Report – Hurricane Olivia,
NOAA, July 25, 2019, p. 16, at https://www.nhc.noaa.gov/data/tcr/EP172018_Olivia.pdf; and email
correspondence with NOAA Office of Legislative Affairs, May 14, 2020.
Notes: Forecast errors indicate the difference between the forecast track and the actual track in nautical miles.
NHC issues official forecasts every 6 hours, and each forecast has projections valid 12, 24, 36, 48, 72, 96, and
120 hours after the forecast’s initial time.
According to NOAA, forecast errors are compared with a five-year period of average errors, as the five-year
period is 1) recent with respect to the state of the science and 2) includes a large number of tropical cyclones to
allow for robust statistical analysis.
The intensity forecasts for Hurricane Olivia were more accurate than the five-year period for the
36-hour and 72-hour periods but less accurate for all other forecast periods (Table B-10).
According to NHC, the largest contributor to the forecast errors were low biases during the two intensification phases.198
Table B-10. NHC Official Intensity Forecast Errors for Hurricane Olivia Compared
with the 2013-2017 Average
in nautical miles per hour, or knots
Forecast Forecast Period
12 Hours 24 Hours 36 Hours 48 Hours 72 Hours 96 Hours 12 Hours
NHC
Official
8.0 10.6 11.7 13.8 15.0 16.2 16.2
2013-2017
Averages
5.8 9.6 11.8 13.2 15.1 15.1 14.6
Sources: John P. Cangialosi and Jon Jelsema, National Hurricane Center Tropical Cyclone Report – Hurricane Olivia,
NOAA, July 25, 2019, p. 18, at https://www.nhc.noaa.gov/data/tcr/EP172018_Olivia.pdf; and email
correspondence with NOAA Office of Legislative Affairs, May 14, 2020.
Notes: Forecast errors indicate the difference between the forecast intensity and the actual intensity in nautical
miles per hour, or knots.
NHC issues official forecasts every 6 hours, and each forecast has projections valid 12, 24, 36, 48, 72, 96, and
120 hours after the forecast’s initial time.
According to NOAA, forecast errors are compared with a five-year period of average errors, as the five-year
period is 1) recent with respect to the state of the science and 2) includes a large number of tropical cyclones to
allow for robust statistical analysis.
198 Cangialosi and Jelsema, Hurricane Olivia, 2019, p. 8.

Forecasting Tropical Cyclones: Overview and Issues for Congress
Congressional Research Service R46416 · VERSION 5 · UPDATED 45
2018 Central Pacific Hurricane Season Overview
In 2018, NOAA predicted the formation of three to six tropical cyclones, including tropical
depressions, named storms, and hurricanes for the central Pacific region, in near- to above-normal conditions (Table B-11). A near-normal season in the central Pacific has three to five tropical cyclones, and an above-normal season has six or more tropical cyclones.199
A total of six tropical cyclones formed or impacted the central Pacific region in 2018. 200 Of the six tropical cyclones, two storms—Lane and Olivia, described in the sections entitled “Hurricane
Lane” and “Hurricane Olivia”—originated in the eastern Pacific, moved west, and had impacts on Hawaii.
Table B-11. 2018 Central Pacific Tropical Cyclone Season: Comparison Between Seasonal Outlook and Actual Storms
NOAA Seasonal Outlook (May 2018) Actual
Tropical Cyclones: 3-6 Tropical Cyclones: 6
Sources: NOAA, “NOAA Predicts a near- or above-normal 2018 hurricane season in the Central Pacific,” May
23, 2018, at https://www.noaa.gov/media-release/noaa-predicts-near-or-above-normal-2018-hurricane-season-in-
central-pacific; and NHC, “Tropical Cyclone Climatology: Central Pacific Climatology,” at
https://www.nhc.noaa.gov/climo/#cpac.
Author Information
Eva Lipiec
Analyst in Natural Resources Policy
Disclaimer
This document was prepared by the Congressional Research Service (CRS). CRS serves as nonpartisan
shared staff to congressional committees and Members of Congress. It operates solely at the behest of and under the direction of Congress. Information in a CRS Report should not be relied upon for purposes other than public understanding of information that has been provided by CRS to Members of Congress in
connection with CRS’s institutional role. CRS Reports, as a work of the United States Government, are not subject to copyright protection in the United States. Any CRS Report may be reproduced and distributed in
its entirety without permission from CRS. However, as a CRS Report may include copyrighted images or material from a third party, you may need to obtain the permission of the copyright holder if you wish to copy or otherwise use copyrighted material.
199 NOAA, “NOAA Predicts a near- or above-normal 2018 hurricane season in the Central Pacific,” May 23, 2018, at
https://www.noaa.gov/media-release/noaa-predicts-near-or-above-normal-2018-hurricane-season-in-central-pacific. 200 NHC, “Tropical Cyclone Climatology: Central Pacific Climatology,” at https://www.nhc.noaa.gov/climo/#cpac.