impact of tropical cyclones and storm surges on … of tropical cyclones and storm surges on...
TRANSCRIPT

Impact of Tropical Cyclones and Storm Impact of Tropical Cyclones and Storm Surges on Agriculture in IndiaSurges on Agriculture in India
Akhilesh GuptaNational Centre for Medium RangeNational Centre for Medium Range
Weather ForecastingWeather ForecastingNoidaNoida, India , India
Email: Email: [email protected]@ncmrwf.gov.in

Topics
• India- some salient features• Tropical Cyclones in Indian Region• Storm Surges and their Prediction• Case studies of impact of TCs in the coastal
regions of India• Agromet Advisory Service and Economic
Impact Assessment

INDIA: ECONOMIC GEOGRAPHYINDIA: ECONOMIC GEOGRAPHYAgriculture: Primary Sector• Indian agriculture is inefficient and labor intensive. • Animals are frequently used for power. • The village is the focus of life for 74 percent of the Indian
population with an estimated 580,000 villages. • Approximately 2/3 of India's huge working population (63 percent)
depends directly on the land for its livelihood.• Substantial progress toward modernization has been made in the
Punjab's wheat zone. • Half of all rural families either owned as little as a half hectare
(1.25 acres) or less, or no land at all. • Land consolidation efforts have had only limited success, except in
the states of Punjab, Haryana, and Uttar Pradesh.

INDIA: ECONOMIC GEOGRAPHYINDIA: ECONOMIC GEOGRAPHYMajor crop zones:1. Wheat. Dry northwest notably in the Punjab and neighboring areas of the
Upper Ganges. Many gains from the Green Revolution through the introduction of high-yielding varieties developed in Mexico.
2. Rice. Moist east and a summer monsoon drenched south. More than 1/4 of all of India's farmland lies under rice cultivation, most of it in the states of Assam, West Bengal, Bihar, Orissa, and eastern Uttar Pradesh. This area has more than 100 cm (40 inches) of rainfall. India has the largest acreage of rice among the world's countries. Yields per hectare are still low at below 1,000 kg (900 lbs./acre), however.
3. Coconut. Malabar Coast. (Kerala)4. Millet. Southwestern India. A cereal grass, Setaria italica, extensively
cultivated in the East and in southern Europe for its small seed or grain, used as food for man and fowls, but in the U.S. grown chiefly for fodder.
5. Groundnut. Kathiawar Peninsula.6. Cotton. West-Central India (Deccan Plateau).7. Chick Peas. Northwest.8. Plantation. Northeast.
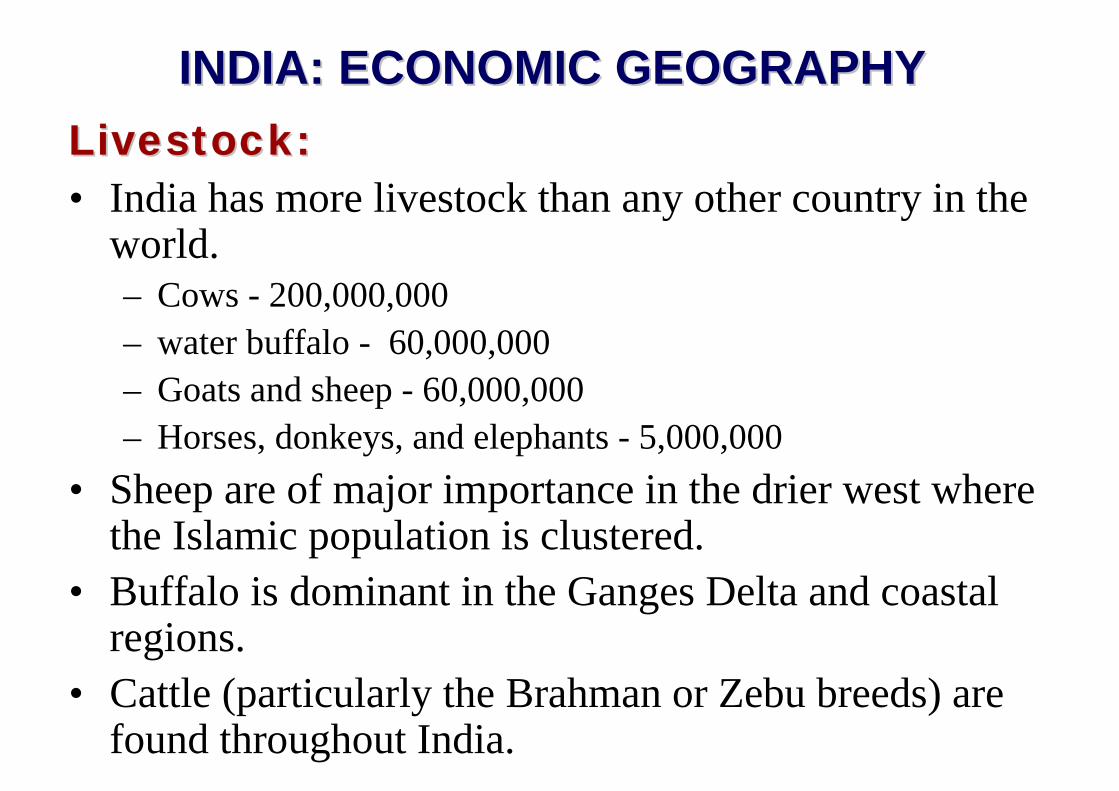
INDIA: ECONOMIC GEOGRAPHYINDIA: ECONOMIC GEOGRAPHYLivestock:Livestock:• India has more livestock than any other country in the
world. – Cows - 200,000,000– water buffalo - 60,000,000 – Goats and sheep - 60,000,000 – Horses, donkeys, and elephants - 5,000,000
• Sheep are of major importance in the drier west where the Islamic population is clustered.
• Buffalo is dominant in the Ganges Delta and coastal regions.
• Cattle (particularly the Brahman or Zebu breeds) are found throughout India.

Average TC Movement in Different Basins
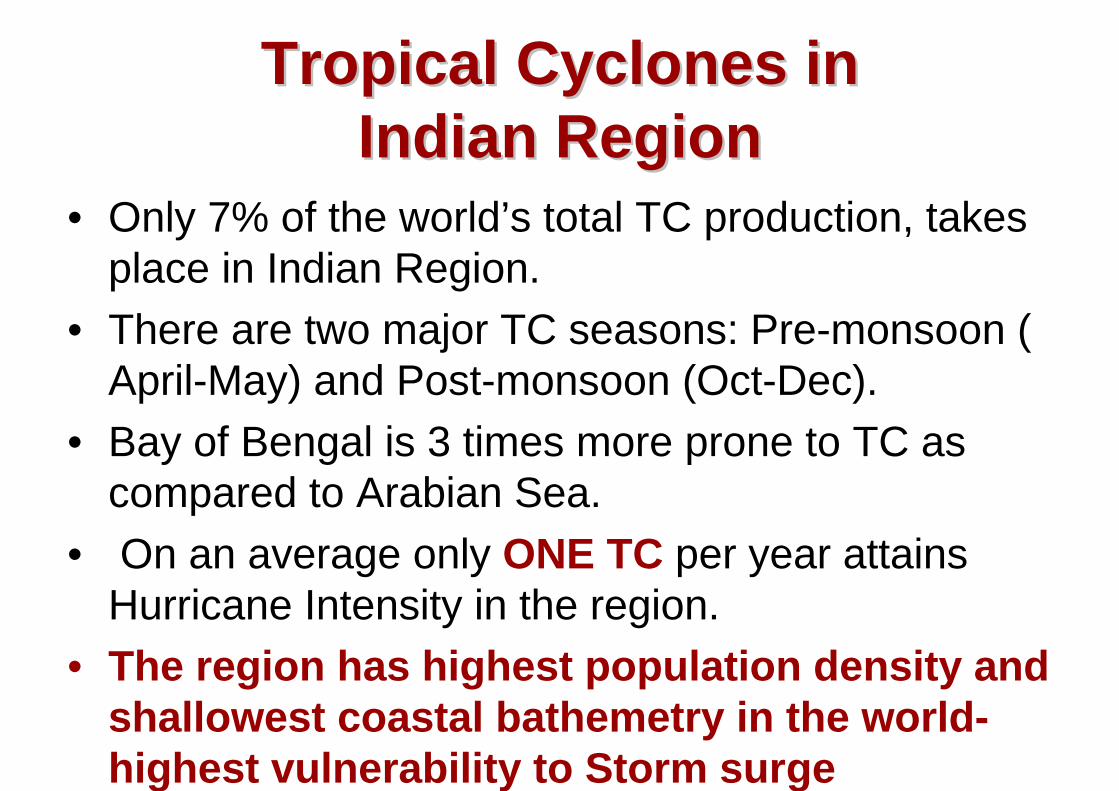
Tropical Cyclones in Tropical Cyclones in Indian RegionIndian Region
• Only 7% of the world’s total TC production, takes place in Indian Region.
• There are two major TC seasons: Pre-monsoon ( April-May) and Post-monsoon (Oct-Dec).
• Bay of Bengal is 3 times more prone to TC as compared to Arabian Sea.
• On an average only ONE TC per year attains Hurricane Intensity in the region.
• The region has highest population density and shallowest coastal bathemetry in the world-highest vulnerability to Storm surge

TROPICAL CYCLONE VULNERABILITYTROPICAL CYCLONE VULNERABILITYSTATES OF INDIASTATES OF INDIA
• West Bengal• Orissa• Andhra Pradesh• Tamilnadu• Pondicherry• Kerala• Lakshadweep• Karnataka • Goa• Maharashtra• Gujarat• Andaman & Nicobar Islands• Diu & Daman

Effect of local TidesEffect of local Tides
Effect of local Effect of local Coastal Coastal ConfigurationConfiguration
Low Atmospheric Pressure in the Centre
WindWind
Rain
Storm SurgeStorm Surge
FloodingFlooding
Loss of Loss of Human Human Life: Life: InjuriesInjuries
Damage to Damage to structures & structures & ContinentContinent
Flooding of LowFlooding of Low--Lying Coastal Lying Coastal AreasAreas
Erosion of BeachesErosion of Beaches
Damage to onshore Damage to onshore & offshore & offshore installationsinstallations
Damage to Shipping Damage to Shipping & Fishing Facilities& Fishing Facilities
Loss of Loss of CommunicationCommunications & Powers & Power
Urban Urban BushfireBushfire
Loss of Soil Loss of Soil Fertility Fertility from Saline from Saline IntrusionIntrusion
Land Land SubsidenceSubsidence
ContaminatiContamination of on of Domestic Domestic Water Water SupplySupply
Destruction Destruction of of Vegetation, Vegetation, Crops, Crops, LivestockLivestock
Potential Impact upon Landfall of a Tropical CyclonePotential Impact upon Landfall of a Tropical Cyclone
A Storm Surge is an abnormal rise of sea level caused by a cyclone moving over a continental shelf

Storm SurgeStorm Surge

DEATHS IN TROPICAL CYCLONESYEAR COUNTRIES DEATHS1970 Bangladesh 300,0001737 India 300,0001886 China 300,0001923 Japan 250,0001876 Bangladesh 200,0001897 Bangladesh 175,0001991 Bangladesh 140,0001833 India 50,0001864 India 50,0001822 Bangladesh 40,0001780 Antilles(West Indies) 22,0001965 Bangladesh 19,2791999 India 15,0001963 Bangladesh 11,5201961 Bangladesh 11,4661985 Bangladesh 11,0691971 India 10,0001977 India 10,0001966 Cuba 7,1961900 USA 6,0001960 Bangladesh 5,1491960 Japan 5,0001972 India 5,000
•74% events in the Bay of Bengal
•59% of Bay events in Bangladesh
•70% Deaths in Bangladesh

Year Country Fatalities
190019061928194619591963197019741977197919841985198819891991199119941994199619981998199819992000
USAHong Kong
USAJapanJapanHaiti
BangladeshHonduras
IndiaCaribbean/USA
PhilippinesBangladeshBangladesh
ThailandBangladeshPhilippines
ChinaHaitiIndiaIndia
Nicaragua/HondurasCaribbean
IndiaMuzambique
6,00010,0002,0001,4004,6005,100
300,0008,000
20,0001,4001,000
11,0005,7081,000
140,0005,0001,1001,0002,000
10,0009,2004,000
15,0001,000
List of Cyclone Disasters with more than 999 Fatalities List of Cyclone Disasters with more than 999 Fatalities
(1900(1900--2001)2001)
•34% events in the Bay of Bengal
•50% of Bay events in Bangladesh
•91% Deaths in Bangladesh

Year Country Total Damage MillionUS $
Insurance Damage Million US $
197719791979198019831988198919911991199119921992199319941995199519961996199619981998199819981998199919992001
IndiaIndiaCaribbean/USA
USACaribbean/USA
USAJamaica, MexicoCaribbean/USA
BangladeshBangladeshUSA
JapanUSA
HawaiiUSA, Cuba
ChinaUSA
CaribbeanUSAIndiaIndiaChinaUSA
CaribbeanNicaragua/Honduras
JapanUSA
JapanIndiaIndiaUSA
1,0002,0002,3001,5001,6502,0009,0001,4001,0006,000
30,0003,0001,0001,8003,0002,5003,0005,4001,5004,500
10,0007,0001,5001,5005,0002,5006,000
No information25075258
1,275800
4,500No information
6205,200
20,0001,600
No informationNo information
2,1001,5001,600
No informationNo information
2,9003,400150700350
3,000115
3,500
Damage due to Cyclones in excess of 1 billion US $ (1976-2001)

Case Studies of TC ImpactCase Studies of TC Impact

A case study of Andhra Pradesh Cyclone of December 2003

CYCLONE


• Population to be affected
• Densely populated villages
•Areas under threat
• Threat to Crops
• Damage to Structures
• Rail and Road network in the affected areas
• Vulnerable points
• Cyclone shelters
Information From DSS include …


DWS CROPS


Wind Vectors
Maximum Instantaneous Wind Speeds1990 Cyclone

Inundation Maps For 1996 Kakinada Cyclone

DSS Generating Sample Maps

Rainfall Data from Cyclone ModelTelemetry DataIMD NetworkSatellite Derived (region)
Inflow into River Mouths
Developed and Calibrated 1:1MilTo develop for 1:250000 and 1:50000
Additional Inputs from:Measured Telemetry and DischargesGauge Network from CWC, Hydrology Network from I&CAD
MIKE 11
River Channel SurveyBank Levels
From cyclone models
3D-DEMCompleted 1: 50KProcess: 1:25 K (Coastal 20Km stretch only)
Decision Support SystemDecision Support SystemFlood Watch
GIS OfflineInterface (Overlaying, Zooming and Other Data Input
Advisories/ Bulletins
Simulated Flow Levels and possibleBank Overflows
VALUE ADDITION•Damage Quantification, •Advisories for facilitating relief routing, •Increase in Lead time •Delta Water Management and Water Quality Management •Flood Control Strategies (long-term and short term mitigation plans)
Hazard Mitigation Modeling System for Floods
UP Model
Quantification of FloodingFlood areasDepth/Duration/Extent

Andhra Pradesh flood modelling• 24 Rivers Modelled, including Godavari,
Krishna, and Pennar• Flood forecasting covering 14 districts• Network of real-time river and rainfall
gauges • Rain gauges – 55 Nos• River gauges/Tide Flow – 49 Nos• Meteorological Stations – 5 Nos• Real-Time Monitoring of River Flows

UP Model• Upscaled Physically-based model designed:
– to simulate water exchanges between the land surface and the atmosphere
– to simulate lateral transfer of water, solutes and sediment
– to be applicable from catchment-scale to continental-scale

UP Element
• Precipitation• Evapotranspiration• Soil water storage• Surface runoff
1 PRECIPITATION2 THROUGHFALL & SNOWMELT3 EVAPORATION & TRANSPIRATION4 INTERFLOW DISCHARGE5 GROUNDWATER DISCHARGE6 SURFACE RUNOFF7 PERCOLATION & CAPILLARY RISE8 INTER-ELEMENT EXCHANGES
5
3
7
1
3
GROUNDWATER
24
3
INTERFLOW
SOIL WATER
CANOPYSNOW PACK
5
6SURFACEWATER
MAINCHANNELNETWORK
An UP Element
8

MIKE 11 GIS• Flood Mapping: MIKE 11-GIS• Fully integrated GIS based flood modelling• Centred on ArcView GIS • Leverages full power of GIS for modelling• Pre-processing: Floodplain schematization• Post-processing: Inundation maps
Comparison mapsDuration maps
• Analysis with other GIS data

Basic data requirements for modelling
• River cross-sections• Maps of floodplains• Historical river flow data• Tidal variations• Data on structures along river that affect
flow

River PennarModel
• Model extends from Somasila to Bay of Bengal
• The total modelled length of the River Penneru is around 117 km
• Major structure is Somasila dam
• One existing CWC station at Nellore is present within model reach

Schematic diagram of Pennar model with UP inputs

Inundation map for October 2001 flood event

Inundation map of Nellore District (Units:Cm)

A Management System for Real-Time Flood Forecasting and Warning
MIKE Flood Watch is a decision support system for real-time flood forecasting combining an
advanced time series data base with the MIKE 11 hydro- dynamic modeling and real-time forecasting
system, MIKE11 FF together with the Geographical Information System (GIS), Arc View
GIS
FLOOD WATCH

The Strengths of MIKE Flood Watch
A fast and reliable system for real-time operation Direct-access time series database
Integration with external databases, e.g. Oracle Automatic import of telemetric data
Data quality control and data processing facilities GIS presentation facilities
Automatic forecasting and storage of results Dissemination of flood maps, flood warnings,
bulletins and graphics on the World

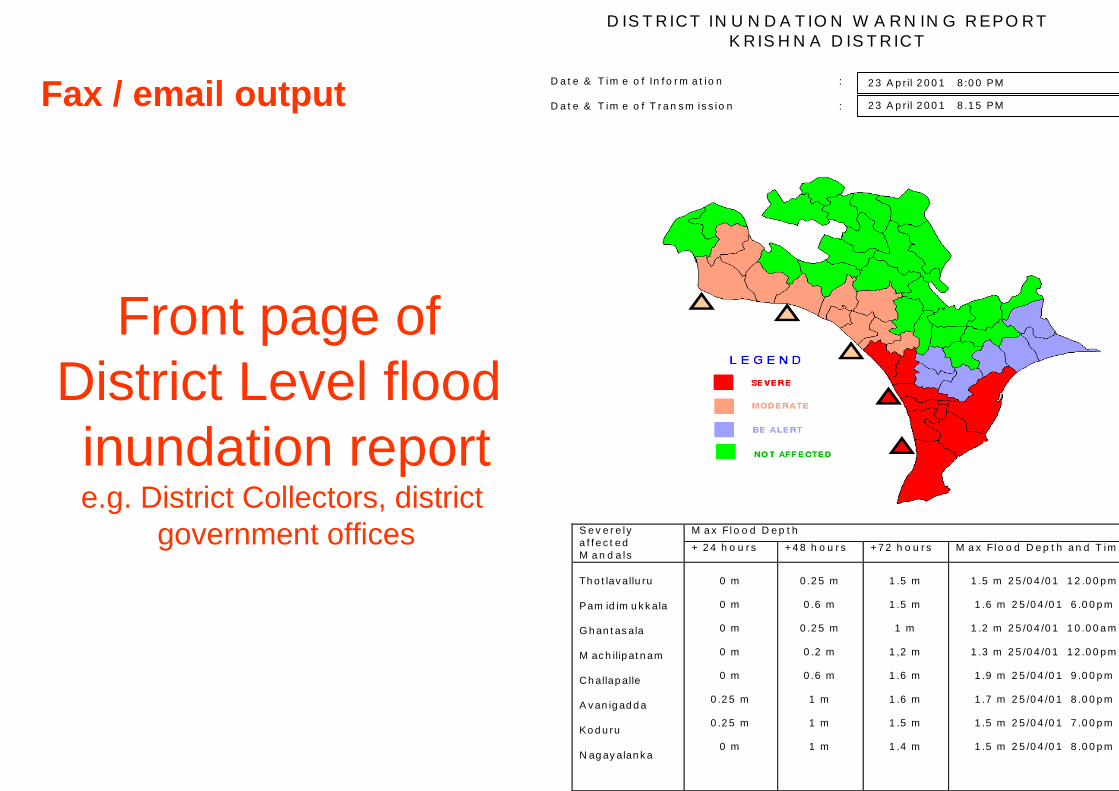
D IS T R IC T IN U N D A T IO N W A R N IN G R EPO R T
K R IS H N A D IS T R IC T
D a t e & T im e o f In f o r m a t i o n : D a t e & T im e o f T r a n s m is s io n :
M a x Fl o o d D e p t h S e v e r e l y a f f e c t e d M a n d a l s
+ 2 4 h o u r s + 4 8 h o u r s + 7 2 h o u r s M a x Flo o d D e p t h a n d T im
Th o t lav allu ru Pam id im u k k ala G h an t as ala M ac h ilip at n am Ch allap alle A v an ig ad d a Ko d u ru N ag ay alan k a
0 m
0 m
0 m
0 m
0 m
0 .2 5 m
0 .2 5 m
0 m
0 .2 5 m
0 .6 m
0 .2 5 m
0 .2 m
0 .6 m
1 m
1 m
1 m
1 .5 m
1 .5 m
1 m
1 ,2 m
1 .6 m
1 .6 m
1 .5 m
1 .4 m
1 .5 m 2 5 /0 4 /0 1 1 2 .0 0 p m
1 .6 m 2 5 /0 4 /0 1 6 .0 0 p m
1 .2 m 2 5 /0 4 /0 1 1 0 .0 0 a m
1 .3 m 2 5 /0 4 /0 1 1 2 .0 0 p m
1 .9 m 2 5 /0 4 /0 1 9 .0 0 p m
1 .7 m 2 5 /0 4 /0 1 8 .0 0 p m
1 .5 m 2 5 /0 4 /0 1 7 .0 0 p m
1 .5 m 2 5 /0 4 /0 1 8 .0 0 p m
2 3 A p r il 2 0 0 1 8 :0 0 PM
2 3 A p r il 2 0 0 1 8 .1 5 PM
Front page of District Level flood inundation reporte.g. District Collectors, district
government offices
Fax / email output

Nellore District Flood Inundation Map
River Pennar
River Kandaleru
River Swarnamukhi
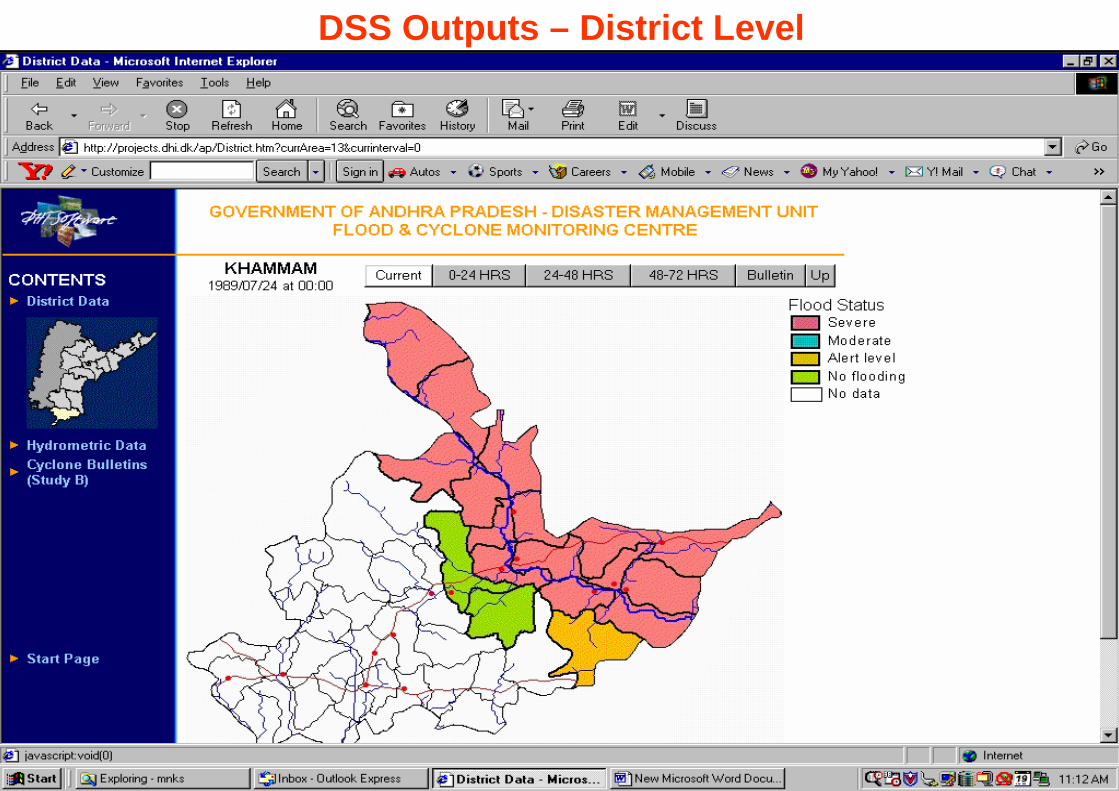
DSS Outputs – District Level

DSS Outputs - Bulletin

Bulletin Types
B U L L E T IN N o . C O N T E N T
1
R o u t in e D a ily S ta te -w id e R e p o r t b a s e d o n b o th D is t r ic ts a n d C a tc h m e n ts /A re a s
2 S p e c if ic D is t r ic t R e p o r t w ith M a n d a l fo re c a s t in fo rm a t io n
3 D is t r ic t R e p o r t w ith in d ic a t iv e M a n d a l in u n d a t io n d a ta
4 D is t r ic t R e p o r t w ith in d ic a t iv e M a n d a l ‘a s s e ts a t r is k ’ a s s e s s m e n t
5 C a tc h m e n t /A re a b a s e d F lo o d F o re c a s t in g S ta t io n R e p o r t


HMISHazard Mitigation Information
System is a network connecting all the district and Mandal Head
quarters with Secretariat and other Heads of Departments through APSWAN for faster and efficient
dissemination of information throughout the Andhra Pradesh

Dissemination of Model Outputs
The outputs of all the models analysedthrough DSS with the help of GIS database are linked to HMIS for faster dissemination to the concerned authorities

Asia: Issues for TC impact on Agriculture
• Data collection and storage from the region• Early Warning System for Agriculture?• Multi-sectoral, multi-country, multi-
institutions participation• Vulnerability and disaster mapping• Insurance

Regional Groupings / Fora
• SAARC• AASIAN• BIMSTEC• WMO/ESCAP Panel

BIMSTECBIMSTECBBay of Bengal ay of Bengal IInitiatives nitiatives for for MMultiulti--SSectoralectoralTTechnical and echnical and EEconomic conomic CCooperation ooperation
Medium Range Prediction and Medium Range Prediction and Drought Monitoring in IndiaDrought Monitoring in India

Agromet Advisory Service (AAS) in India

AgrometAgromet Advisory Advisory Service (AAS) NetworkService (AAS) Network
Total Units: 107

Salient Features of Salient Features of AgrometAgrometAdvisory Service (AAS)Advisory Service (AAS)
• At present in 107, but plans to cover all 127 agro-climatic zones.
• Units are opened in State Agricultural Universities and ICAR Institutes.
• NCMRWF issues location specific quantitative weather forecasts upto one week in advance twice a week.
• AAS Units translate these forecasts into Agro-advisories anddisseminate them to Media and also directly to farmers.
• Units run Crop Weather Models and include output in the Day today advisories.

NCMRWF FORECAST PRODUCTS NCMRWF FORECAST PRODUCTS DISSEMINATED TO AAS UNITSDISSEMINATED TO AAS UNITS
24 HR PRECIPITATION (MM)
AVERAGE CLOUDINESS (OKTA)
AVERAGE WIND SPEED (KMPH) AT 10 FT HEIGHT
PREDOMINANT WIND DIRECTION (DEG.) AT 10 FT HEIGHT
MAXIMUM TEMPERATURE TREND (DEG. C) AT 4.5 FT HEIGHT
MINIMUM TEMPERATURE TREND (DEG. C) AT 4.5 FT HEIGHT
Frequency of Forecast : Twice-a-weekDissemination : On Tuesday and FridayPeriod covered : 4 days

AGROMETEOROLOGICAL ADVISORY SERVICE OF NCMRWF
NCMRWF
VSATFAX
PHONEAAS UNITS (SAUs / ICAR institutes)
AIR T.V. PERSONALPRINT CONTACT
FARMERS
PREPARATION OF LOCATION SPECIFIC FORECAST
PREPARATION OF AGROMET ADVISORY BULLETINFARMERS’FEEDBACK
FEEDBACK FROM FARMERS/AAS UNIT

FORMAT FOR AGROMET ADVISORY BULLETIN
WEATHER INFORMATION- Weather summary of preceding week, - Climatic normal for the week, - Weather forecast and - Crop moisture index, Drought severity index etc.
CROP INFORMATION- Type, state and phenological stages of the crops- Information on pest and disease and - Information on crop stresses
ADVISORY BULLETIN- Crop-wise farm management information tailored to weather sensitive agricultural practices like sowing, irrigation scheduling, p & d control operation, fertilizer use etc.
- Spraying condition for insect, weed and their products- Wildfire rating forecasts in wildfire prone areas- Livestock managemnet information for housing, health and nutrition etc.

Weather Events covered in AASWeather Events covered in AAS
Frost / Cold Wave
Heat Wave
Heavy Rain / Snowfall
Dry Spell
Strong Winds
Hail
Cyclone

Crops/ Livestock covered under AASCrops/ Livestock covered under AAS
Field crops Vegetables Horticultural LivestockRice Tomato Apple Avian BirdsWheat Cauliflower Mango Sheep/ Goat (wool, meat)Sorghum Potato Grapes Cow / Buffalow (milk)Millet Toria OrangeMaize Onion CoconutBarley Beans GuauaGram Ginger PapayaSoybean PeasGroundnutSesamCowpeaMustard

Major Agricultural Operations covered under AASMajor Agricultural Operations covered under AAS
Sowing / TransplantingRainfedIrrigated
Pest & DiseaseSpraying
Water ManagementIrrigation
Fertiliser Application
Harvesting
Post Harvesting / Storage

ECONOMIC IMPACT ASSESSMENT OF AAS
FIELD UNIT Crops/ Livestock Weather Events/ Management Practices
Kovilpatti Sorghum, Cotton Early sowing
Ludhiana Potato, Tomato Frost
Coimbatore Sorghum, Maize, Banana, Onion
Early sowing, Wind speed, Cloudiness
Madras Poultry Thermal stress, Pest & Disease management
Namakkal Poultry Heat stroke, Disease management
Pune Sorghum Dry sowing
Raipur Chilli, Potato Irrigation, Wind speed, Cloudiness
Anand Pigeonpea, Cotton, Potato Pesticide application
Based on Farmer's feedback, Field visits by scientists, Objective techniques(Crop cutting and Saving due to reduction in farm inputs) and Notional savings
SAVINGS ACHIEVED: 2-20%
Medium Range Forecast and Medium Range Forecast and Drought Monitoring during Drought Monitoring during
MONSOONMONSOON--20052005

Late onset over Late onset over KeralaKerala by about 4 by about 4 days (5days (5thth June)June)
Delayed advance over northeast India Delayed advance over northeast India by about two weeks (16by about two weeks (16thth June)June)
Monsoon arrived over Mumbai late by Monsoon arrived over Mumbai late by 9 days (199 days (19thth June)June)
MON
SOON
MON
SOON
-- 200
520
05Onset and Advance of MonsoonOnset and Advance of Monsoon

Onset over central India Delayed by about 10-15 days (20th -24th June)Delayed onset over northern plains by about 7 to 10 daysNormal Onset over parts of Northwest India including DelhiMonsoon covered entire country by 30th June, 15 days ahead of normal date.
Onset and Advance of MonsoonOnset and Advance of MonsoonM
ONSO
ONM
ONSO
ON-- 2
005
2005

Progress of Monsoon over Progress of Monsoon over different parts of the Countrydifferent parts of the Country
MON
SOON
MON
SOON
-- 200
520
05

Country as a whole rainfall Distribution: Normal for 1 June-28 September = 884.4 mmActual rainfall = 872.8 mm% Dep. From Normal = -1%
Zone-wise rainfall distributionNormal Actual % Dep
North-west 608.7 550.0 - 10%Central 985.6 1092.2 +11%South Peninsula 711.2 798.5 + 12%North-east India 1415.7 1122.9 - 21%
Sub-Division wise rainfall distributionExcess = 9 (25%)Normal = 23 (64%)Deficient = 4 (11%)Scanty = 0
District wise rainfall distributionExcess = 110 (22%)Normal = 249 (50%)Deficient = 133 (26%)Scanty = 11 (2%) No Rain = 0 (0%)
MonsoonMonsoon--2005: A Glimpse2005: A Glimpse

MONSOON-2005

MonsoonMonsoon--2005:2005: MonthMonth--wise rainfall performancewise rainfall performance

Exceptionally Heavy rains in Exceptionally Heavy rains in Indian MetrosIndian Metros--20052005
Mumbai: 26 JulyVisakhapatnam: 16 October
BangaloreBangalore--22 October22 October Chennai: 26 OctoberChennai: 26 October
Delhi: 15 September
Kolkata: 21 October


Chattisgarh
East UP
Orissa1-22 June

S. No.
Met Sub-divisions
%Cumulative Rainfall Dep. From normal
as on 24 Aug.,2005
%Cumulative Rainfall Dep. From normal
as on 31 Aug.,2005
Change of
Status
1 West U.P. -20% (D) -26% (D) D 2 West Rajasthan -28% (D) -34% (D) D 3 East Rajasthan -10% (N) -17% (N) D 4 Haryana, Chandigarh
and Delhi -12% (N) -18% (N) D
5 West Madhya Pradesh -12% (N) -19% (N) D 6 East Madhya Pradesh +32% (E) +22% (E) D 7 Gujarat +42% (E) +33% (E) D 8 Orissa -5% (N) -10% (N) D 9 Chattisgarh -11% (N) -17% (N) D 10 Telangana +14% (N) +9% (N) D 11 Marathwada +12% (N) +6% (N) D 12 Vidarbha +7% (N) 0% (N) D 13 Bihar -20% (D) -11% (N) I 14 Rayalaseema +16% (N) +26% (E) I 15 South Interior
Karnataka +27% (E) +34% (E) I
16 Tamilnadu & Pondicherry
-30% (D) -11% (N) I


Future Plans:Future Plans:Proposed District Proposed District
Level Forecast and AASLevel Forecast and AAS

NCMRWF
107 AAS UNITS
DISTRICT AGRICULTURE OFFICES OF STATE
GOVERNMENTS
PREPARATION OF DISTRICT WISE MEDIUM RANGE WEATHER FORECAST
PREPARATION OF AGRO-CLIMATIC
ZONE LEVEL AGRO-ADVISORIES
PREPARATION OF DISTRICT LEVEL
AGRO-ADVISORIES
FARMERS(THROUGH MEDIA, EXTENSION
SERVICES, PERSONAL CONTACT)
District-wise Agro-met data
Agro-climate level agro-met data
Feedback analysis

602 Stations602 Stations
Proposed DistrictProposed District--Level Level Medium Range ForecastMedium Range Forecast

Pilot Initiative for Village Pilot Initiative for Village Information System Information System
A new A new programmeprogramme launched by DST in launched by DST in collaboration with AP Govt.collaboration with AP Govt.

Pilot Initiative for Village Pilot Initiative for Village Information SystemInformation System
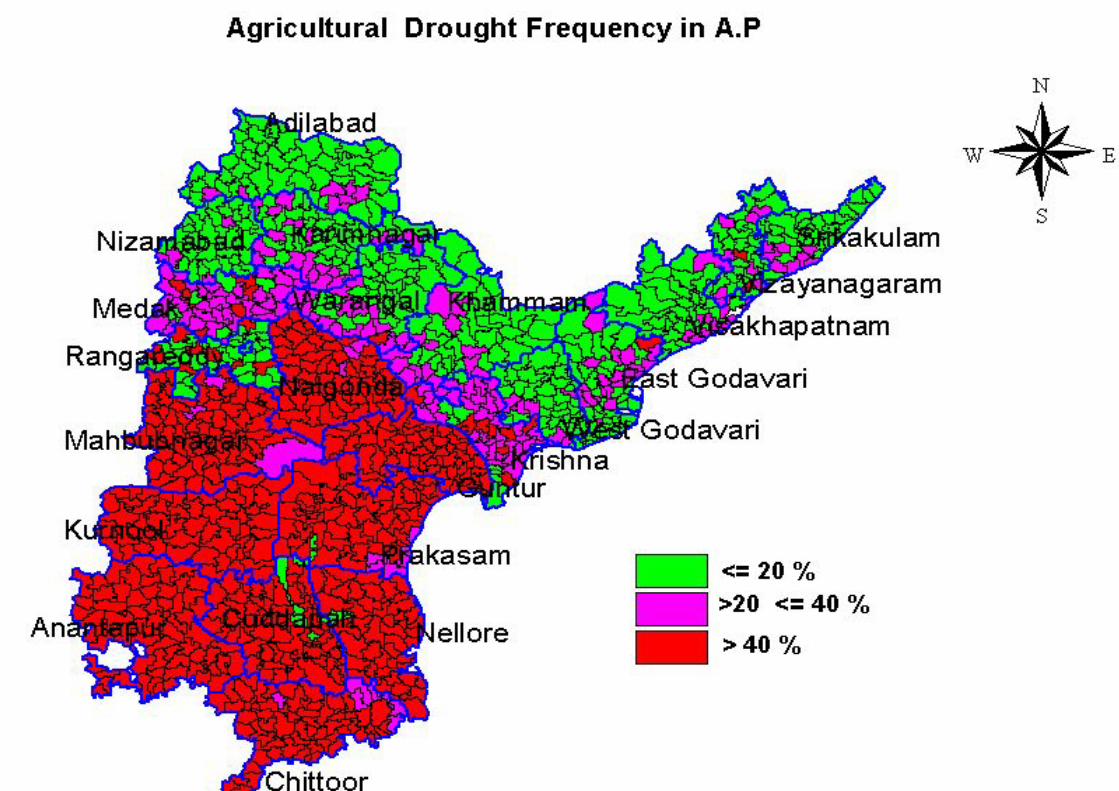
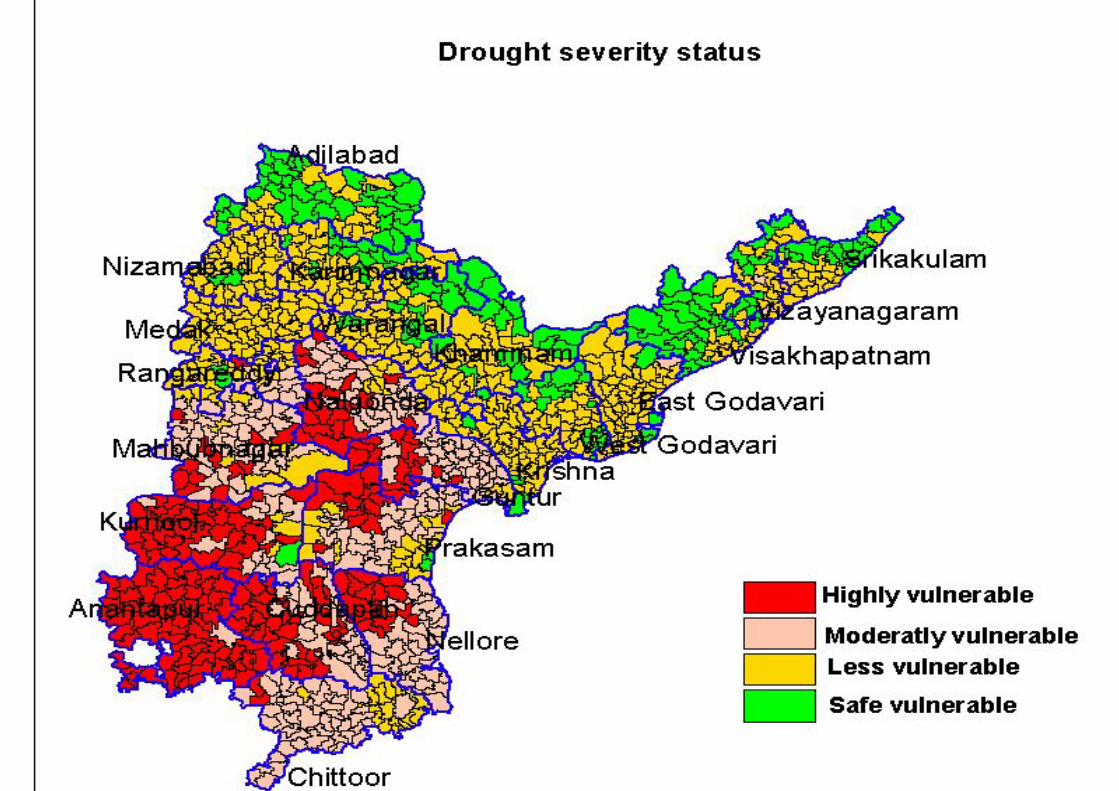
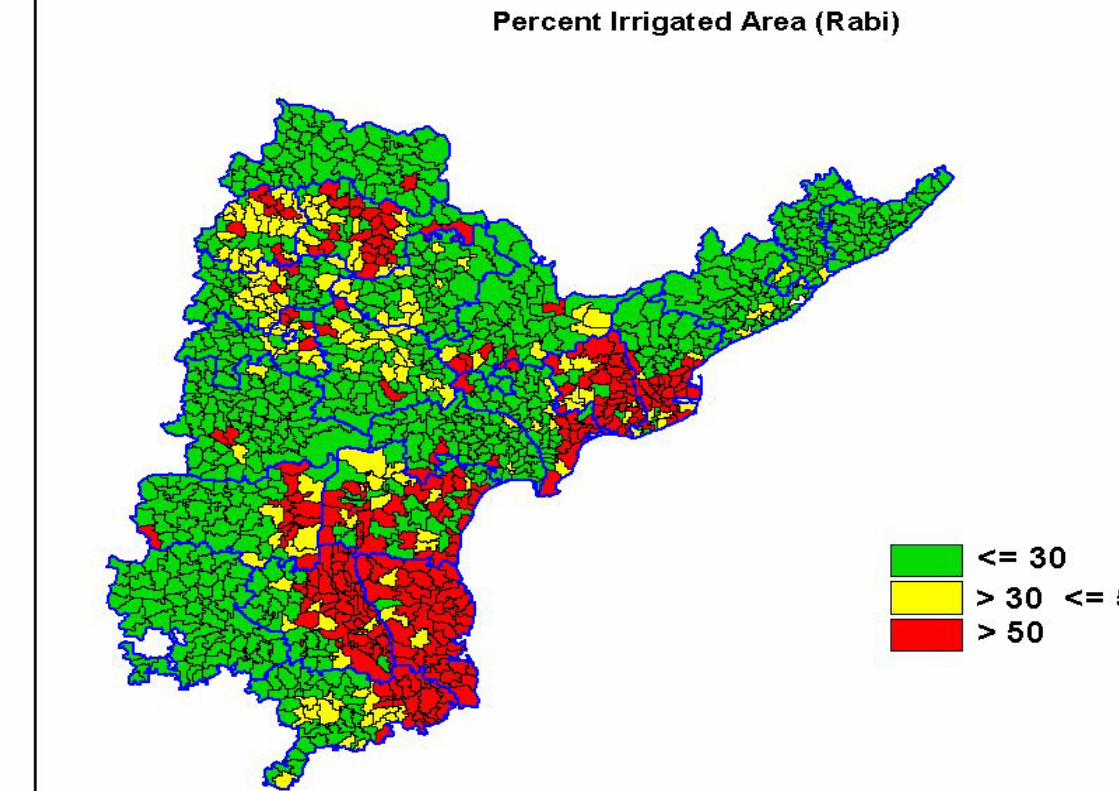
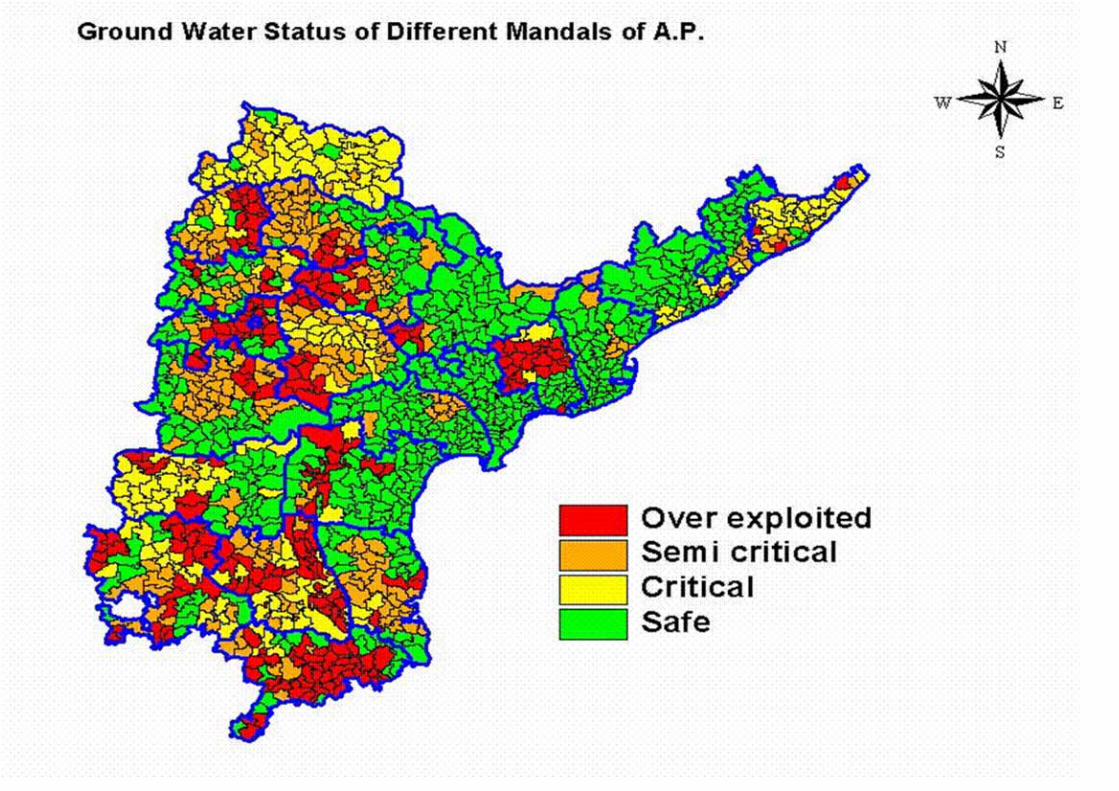
(Jointly with NRDMS, SOI, APSRAC, APCOST)1. Study Area: 10 Villages of Nellore Districts of AP for Cyclone & flood
vulnerability assessment 10 Villages of Cuddapa District of AP for drought vulnerability assessment
2. Information to be bundled in addition to existing resources and other data at Village level-
a. Risk & vulnerability assessmentb. Mapping of Village scale risk & vulnerabilityc. Details of best practices in respect of effective
community level response to the disaster scenariod. Risk Mapping of infrastructure, houses, crops, &
other common facilitiese. Mitigation Plans to reduce risk & vulnerability
for evolving suitable developmental plans3. Computing & Network infrastructure establishment

A Typical Layout of REVENUE VILLAGES

Topographic Layers•• HabitationHabitation
•• Revenue VillageRevenue Village
•• SettlementsSettlements
•• RoadsRoads
•• Rail NetworkRail Network
•• CanalCanal
•• Drainage LinesDrainage Lines
•• Water BodiesWater Bodies
•• WellsWells
•• ForestForest
•• ContourContour
•• ElevationElevation
•• SymbolSymbol

Thematic Layers from Satellite ImagesThematic Layers from Satellite Images
•• HydrogeomorphologyHydrogeomorphology
•• SlopeSlope
•• SoilSoil
•• Land Use / Land CoverLand Use / Land Cover
•• Land and Water Resources Development Plans Land and Water Resources Development Plans

NonNon--Spatial Data for every HabitationSpatial Data for every Habitation
CensusCensus
Land InformationLand Information
InfrastructureInfrastructure

Census
No.of Households No.of Households Population Population Male/Female Male/Female Age Age Caste Caste Literacy Literacy Work ForceWork Force

Land Use
Total Geographical AreaForest AreaBarren and Unculturable Waste LandLand put to Non-Agricultural UsesCulturable Waste LandPermanent Pastures / Grazing LandsLand put to Miscellaneous use (Trees/Groves)Fallow landNet Area SownIrrigated Land (Canals, Tanks, Tube wells,Wells, Check dams, L.I. Schemes)
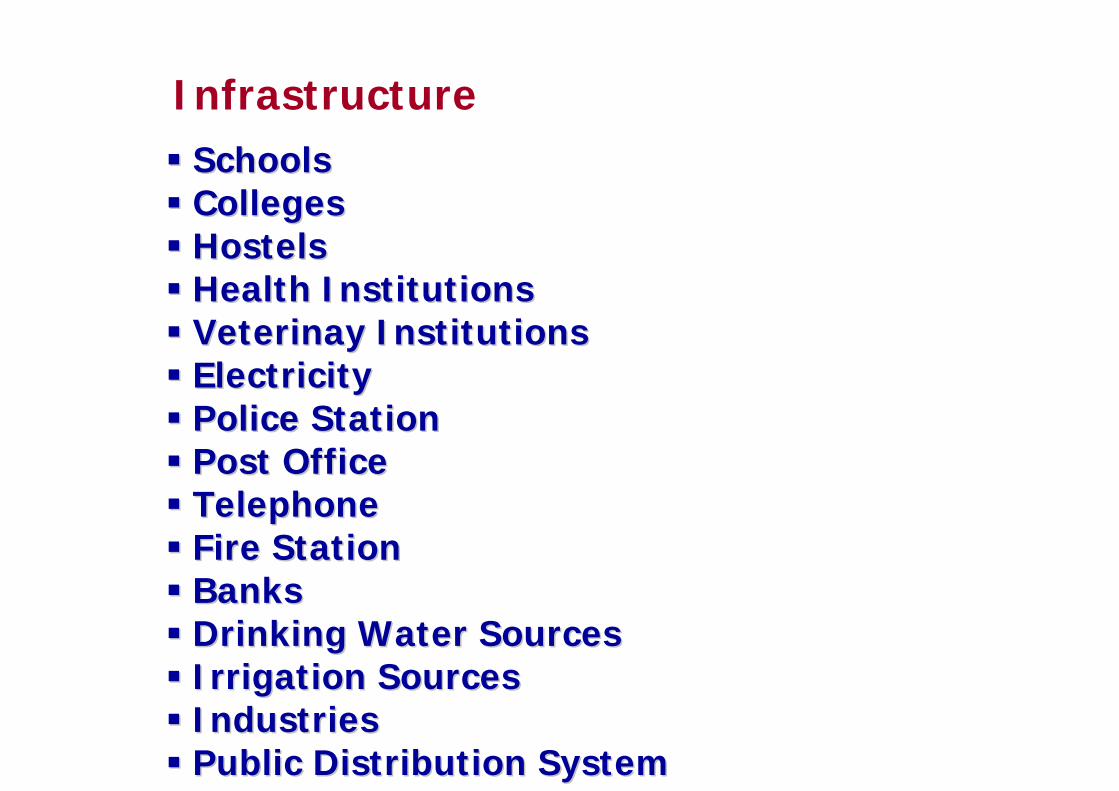
InfrastructureSchoolsSchoolsCollegesCollegesHostelsHostelsHealth InstitutionsHealth InstitutionsVeterinayVeterinay InstitutionsInstitutionsElectricityElectricityPolice StationPolice StationPost OfficePost OfficeTelephoneTelephoneFire StationFire StationBanks Banks Drinking Water SourcesDrinking Water SourcesIrrigation SourcesIrrigation SourcesIndustriesIndustriesPublic Distribution SystemPublic Distribution System

Infrastructure
Bus ServicesBus ServicesWomen & Child Development Women & Child Development CentresCentresNonNon--formal Education formal Education CentresCentresVillage Library Village Library Rail ServicesRail ServicesMarket YardsMarket YardsCooperative InstitutionsCooperative InstitutionsSelf Help GroupsSelf Help GroupsRural Connectivity Rural Connectivity Cable T.V.Cable T.V.Burial GroundBurial GroundGarbage YardGarbage YardCommunity LatrinesCommunity Latrines