forecasting tourist arrivals in greece and the effect of global … · 2016-02-18 · forecasting...
TRANSCRIPT
Forecasting Tourist Arrivals in Greece and the Impact of
Macroeconomic Shocks from the Countries of Tourists’ Origin
Dimitrios Gounopoulos
University of Surrey, UK
Dimitris Petmezas
University of Surrey, UK
Daniel Santamaria Canterbury Christ Church University
Abstract: This paper generates short-term forecasts on tourist arrivals in Greece and performs
impulse response analysis to measure the impact of macroeconomic shocks from the origin country
on future tourism demand. We find the ARIMA (1, 1, 1) model outperforms exponential smoothing
models in forecasting the direction of one year out of sample forecasts. However, this does not
translate into point forecasting accuracy. Impulse response analysis on the impact of unemployment
and tourists’ cost of living shocks shows that the source of downside risk to future tourism numbers
is limited in scope, magnitude, and duration. Shocks to consumer confidence from the origin
countries have no impact on future tourism demand. Our results offer important insights and
implications for policymakers and tourist operators.
Keywords: Tourist Arrivals, Macroeconomic Shocks, ARIMA, Holt’s Exponential Model With
Trend, Double Exponential Smoothing, Impulse Response Function
Dimitrios Gounopoulos, (Surrey Business School, University of Surrey, Guildford, United Kingdom, GU2 7XH;
Email: <[email protected]>), is a Lecturer in Accounting and Finance in the Faculty of Business
Economics and Law at the University of Surrey; Dimitris Petmezas, is a Professor in Finance in the Faculty of Business Economics and Law of the University of Surrey, UK; and Daniel Santamaria, is a Senior Lecturer in
Finance in the Faculty of Business and Management, Canterbury Christ Church University, Canterbury, Kent, CT1
1QU, UK.
1
INTRODUCTION
The tourism industry is one of the most crucial sectors for a thriving economy as it
accounts for a large part of some countries’ Growth Domestic Product (GDP) and employment
figures. Tourism is characterized by large variations in numbers on a yearly basis and, as a result,
predicting future arrivals is a very difficult task. Forecasts of tourist arrivals are essential for
planning, policy making and budgeting purposes by tourism operators (Uysal and O’Leary
(1986)).
In response to this, a growing body of literature has focused on tourism demand and
arrivals’ forecasts in several countries (for instance, Law (2000) for Taiwan and Hong Kong,
Burger et al. for South Africa, Chu (2008) for nine major tourist destinations in the Asian-Pacific
region, Dharmaratne (1995) and Dalrymple and Greenidge (1999) for Barbados, González and
Moral (1996) for Spain, Chu (2004), Song and Witt (2006), Chu (2009) for Asian-Pacific
countries, Lim and McAleer (2001), Athanasopoulos and Hyndman (2008) for Australia, Smeral
and Weber (2000) and Papatheodorou and Song (2005) for international tourism trends and
Shen et al. (2010) for the United Kingdom outbound tourism demand) under the research
framework that the tourism industry is a key sector in the economic development strategy of
many developing countries.
A second strand of literature that has emerged in recent years is the use of
macroeconomic factors to explain tourism demand using structural time series models. For
instance, Metzgen-Quemarez (1990) used real GDP figures from the United States, amongst
other factors; Var et al. (1990) and Icoz et al. (1998) employed Turkish Consumer Price Index
(CPI) figures and the Turkish Lira currency exchange rate against the currency units from the
tourists’ country of origin, respectively; Greenidge (2001), used real GDP and CPI of the country
of origin as well as the price index of tourism in Barbados and finally, Song et al. (2010)
employed GDP data of the country of origin and CPI in Hong Kong relative to the country of
origin adjusted by the exchange rate.
This paper seeks to break new ground by analyzing, for first time in the literature, the
impact of macroeconomic shocks from the country of origin on future short term tourism
demand to Greece. We examine the effect of tourists’ cost of living, unemployment and
consumer confidence in the country of origin as the source of macroeconomic shocks.
2
Particularly, the two latter variables have not been considered in the prior related literature.
Tourists’ cost of living is used as a measure of price competitiveness of the destination and, as
such, has a major impact on tourism demand. Unemployment and the consumer confidence
indicator serve as useful proxies for the state of the economy in the origin country, which implies
an impact to future demand for tourism. The intuition behind unemployment lies in two avenues
of research which have focused on the wage curve hypothesis and the psychological impact on
the level of happiness. Both explanations imply a negative impact on future tourism numbers in
periods of high unemployment. The consumer confidence indicator reflects the level of
economic uncertainty and/or expectations on future income and the level of precautionary
savings. The build up of precautionary savings feeds into falling levels in tourism demand as
consumers postpone or cancel vacations.
Additionally, no study to our knowledge has attempted to forecast future arrivals in
Greece, which is one of the most popular tourist destinations worldwide. According to the
National Statistical Service of Greece, in 2002 the country welcomed 14.9 million international
tourists placing Greece the 12th
place most visited destination internationally. This yielded an
income of $9.74 billion, boosting Greece in the top ten in the world. It is therefore of paramount
importance for policy makers and industry that forecasting models are developed and tested to
provide an accurate and reliable picture of future tourism arrivals in Greece. As a result, unlike
previous studies, we use an array of forecasting models to generate short term predictions on
tourism arrivals in Greece.
The identification and analysis of the impact of macroeconomic shocks from the country
of origin on tourism flows in Greece introduces an added dimension by recognizing the main
source of risk to future arrivals. In this paper, we identify the potential risk coming from
unemployment, tourists’ cost of living, defined as the CPI of Greece relative to the CPI of the
country of origin, and the consumer confidence indicator.1 Although relative CPI has been used
1 Although we recognize the importance of the CPI of other major competitors in determining tourism flows to
Greece, the underlying assumption in this paper is that travelling to domestic destinations is a viable substitute. The
intuition behind this notion lies in the countries of origin used in this study (U.K., France, Germany, Italy, the
Netherlands, Japan and the U.S.) which account for 510 million domestic trips per annum in the E.U. (Peeters et al.
(2007). Furthermore, according to the WTO (2005), domestic tourism in the U.S. amounted to more than a billion
trips per year. As a consequence, the CPI of the origin country is viewed as the CPI of potential competitors that is
incorporated into the tourists’ cost of living used in this paper.
3
in past papers as a driver of tourism demand (Song et al. (2010) and Abbas and Ibrahim (2011)),
no study has considered the impact of unemployment and consumer confidence as
macroeconomic inputs. Macroeconomic shocks from these factors are introduced into a Vector
Autoregressive (VAR) system of equations from which one can gauge the reaction and time it
takes to impact on future arrivals.
Apart from investigating the impact of random macroeconomic shocks on future tourism
arrivals, this paper also provides a methodological contribution by utilizing impulse response
function within a VAR framework. This involves simulating impulse responses from the
macroeconomic shock to provide information on the size of the reaction and the duration of the
effects on future arrivals. Confidence bands are computed using Monte Carlo Simulation to
determine the statistical reliability of the response.
Our results reveal a number of interesting observations. First, preliminary analysis
reveals that the ARIMA (1, 1, 1) model outperforms the double exponential smoothing and the
Holt’s exponential smoothing model with trend as a short-term directional forecasting tool.
However, the success rate of the ARIMA model in capturing long term trends does not translate
into forecasting accuracy. Instead, based on the Mean Absolute Error (MAE), Mean Absolute
Percentage Error (MAPE) and Root Mean Square Error (RMSE) measures, the Holt’s
exponential smoothing approach is the best performing model as point forecasting tool.
The next set of results focused on how random macroeconomic shocks, introduced into a
system of equations, could impact on future tourism demand in the short term. Initial findings
show that random unemployment shocks, as well as shocks to the tourists’ cost of living, have
profound, yet time varying, effects on short term tourism demand in Greece. In contrast, shocks
to consumer confidence from the country of origin have a benign impact on tourism demand.
Closer inspection of the results indicate that despite the lack of diversification in the sources of
tourism demand to Greece, downside risk in the two main countries of origin, the United
Kingdom and Germany, is limited.
To sum up, this paper has two main contributions to the literature. First, we consider
tourist arrivals in Greece and provide a preliminary analysis on initial short term forecasts in
future tourism demand. Given the importance of the tourism industry in Greece and the level of
tourism demand, this addresses a major gap in the literature. The second contribution, and one
4
that forms the overriding objective of this paper, is that it explores the impact of macroeconomic
shocks of various sources from the country of origin on future tourism demand.
The rest of the paper is structured as follows. Section 1 reviews the related literature on
the importance of the macroeconomic variables used in this study. Section 2 discusses the data
used and provides descriptive statistics. Section 3 presents the methodology. Section 4 analyses
the empirical results, followed by a discussion of the findings in Section 5. Section 6 discusses
the implications of this study. Finally, Section 7 summarises and concludes the paper.
1. RELATED LITERATURE
Although no studies have yet to document the impact of macroeconomic shocks on future
tourists’ arrivals, reviewing the wider literature on the impact of unemployment, changes in the
tourists’ cost of living, and consumer confidence could provide useful inferences on potential
effects to international tourism flows.2
1.1. Unemployment
In this paper, unemployment is defined as a proxy used for the state of the economy in
the origin country which might have a potential impact on future arrivals. The intuition behind
this partially lies in the literature on “the wage curve” hypothesis. This theorem is based on the
relationship between unemployment in the local labour market and the level of pay, where real
wages are suggested to be negatively related to the unemployment rate. Lower real wages imply
falling numbers going abroad. Early studies have reported convincing evidence that the level of
pay is lower in areas of high unemployment across different countries (Blanchflower and Oswald
((19/90), (1994) and (2006)) based on the unemployment elasticity of wages measure.3 On the
2 We recognize the use of GDP used in previous studies as a determinant of tourism demand. However, we have
restricted our database to include macroeconomic variables available monthly to maximize the number of data
observations used when generating short to medium term impulse responses on future tourism demand. As a result,
GDP figures, only released on a quarterly basis, would lead to meaningless results in generating one year ahead
impulse response paths that would ensure consistency with short term forecasts analyzed later in the paper.
Moreover, although tourists’ cost of living is a variable used in previous studies, an important innovation of this
paper is the use of unemployment and consumer confidence as alternative proxies for the state of the economy in the country of origin. 3 Further support is provided from studies that examine European countries which document an elasticity of
approximately -0.01 (Wagner (1994), Estevao and Nargis (2002) and Montuenga, Garcia and Fernandez (2003), and
Sanz de Galdeano and Turunen (2005)). Similarly, Deller and Tsai (1998) reach the same conclusion for the United
States.
5
other hand, Malley and Moutos (1996) provided another angle by analyzing unemployment as a
measure of aggregate income uncertainty. Using quarterly data from the United States, they find
an inverse relationship between the level of consumption and unemployment that is attributable
to an increase in precautionary savings during periods of high unemployment.
Further intuition behind the use of unemployment as a proxy lies in the growing body of
work on the psychological effect of unemployment on the level of happiness and well being. One
conclusive finding that was held relatively unchallenged is that the level of unemployment
reduces the level of happiness and well being significantly. For instance, Blanchflower ((1996),
(2001)), amongst others, reaches this conclusion after investigating twenty-three different
countries. Further support for this finding is provided by Ahn et al. (2004) who examine this
effect for all countries in the European Community. They find evidence that unemployment
reduces the level of satisfaction both in financial terms and vocational activity. This finding
varies across countries, with unemployment in Denmark and the Netherlands having the least
sensitive impact on well being.
1.2. Cost of Living-Consumer Price Index (CPI)
The only variable considered in this study that has been used in the international tourism
literature is the tourists’ cost of living (or relative CPI) defined as the CPI for the destination
country relative to the origin country (Habibi and Rahim (2009), Arsad and Johor (2010), Song
et al. (2010) and Abbas and Ibrahim (2011) among others). There is recognition amongst
academics and the tourism industry on the relevance of price competitiveness of the destination
country (Dwyer et al. ((2000a), (2000b), (2002)). Theoretically, a proxy for the tourists’ cost of
living should include travel cost to and from the destination, in addition to the cost of
accommodation, tour services and restaurants. However, due to a lack of data, most studies have
omitted travel costs. Hence, the question mark posed by previous studies is whether the CPI in
the destination country is a reasonable proxy for tourism prices.
Morley (1994) investigated the reliability of the CPI as a proxy for tourism prices for 10
major destinations. Tourist expenditures estimated were found to correlate with the CPI in the
country of destination, a finding that was found to be robust to the removal of linear time trends
6
from the series. A similar conclusion was reported in a more recent study by Salman et al. (2007)
in relation to formulating and testing the demand function for tourism in Sweden. In view of the
importance of price competitiveness in the country of destination, shocks to relative CPI could
have profound implications for future tourism arrivals.
1.3. Consumer Confidence
The final macroeconomic variable considered in this study is the consumer confidence
indicator as providing inferences on the degree of uncertainty associated with future economic
conditions in the country of origin. According to Ludvigson (2004), high consumer confidence
reflects reduced uncertainty on future economic conditions, which translates into reduced
precautionary savings and increased present consumption at the expense of future consumption.
However, economic theory surrounding consumer confidence extends beyond precautionary
savings and current consumption. Theory also judges consumer confidence as a means of
capturing expectation on future income and wealth and, as such, it could impact on future
consumption (Ludvigson (2004)).
In this paper, the consumer confidence indicator is used as a second proxy for the state of
the wider economy. The intuition behind this notion is provided by Matsusaka and Sbordone
(1995), who report evidence that consumer confidence has a statistically significant impact on
macroeconomic fluctuations. Based on the above analysis, we argue that high consumer
confidence in the country of origin implies a fall in the level of precautionary savings and
therefore may feed into increased tourism flows from that country; whether it has an immediate
impact depends on which theoretical explanation holds.
The implication of past studies considering the role of consumer confidence was to
examine whether the indicator merely serves as a proxy for a broader economic cycle
(Matsusaka and Sbordone (1995)). Doms and Morin (2004) added to this notion by reporting
evidence that the consumer confidence indicator is more volatile in times during and after
recessions, when news coverage is greater coinciding with a willingness to adjust expectations.
However, the vast majority of studies have investigated whether consumer confidence can be
used to forecast future household spending and consumption. The general consensus formed is
that it adds predictive power to short term forecasts (Carroll et al. (1994), Bram and Ludvigson
7
(1998) and Howrey (2001)). Eppright et al. (1998) find negative shocks have an adverse impact
on consumer confidence that in turn translates into lower consumption.
Taken together, it is plausible to argue that unemployment levels, having a major effect
on real wages, as well as people’s level of happiness and well being, could affect the level of
tourism activity. Additionally, the notion that tourists’ cost of living as a reflection of price
competitiveness of the destination country, in addition to consumer confidence proxies for
economic uncertainty and future income, could have far reaching implications on future tourism
arrivals to Greece. With no evidence available from previous studies, this will provide a more
complete picture for policymakers on future arrivals especially in times of recession when poor
economic fundamentals could feed into short to medium term forecasts. As a matter of fact, this
study is of particular interest, given that Greece has been in a recession recently.
2. DATA
2.1. Sample
To conduct this study, our database consists of monthly data on tourist numbers to
Greece as well as unemployment levels, Consumer Price Indices (CPI) and Consumer
Confidence Indicators from the country of origin for the period January 1977 to December 2009.
Macroeconomic variables for the United Kingdom, United States, France, Germany, Italy and
the Netherlands were downloaded from Datastream. In addition to the countries of origin, we
also collected CPI data for Greece to compute relative CPI as a proxy for tourists’ cost of living.
Consistent with previous studies,4 the relative CPI (CP) is defined as:
where tiCPI , and tjCPI , are the consumer price indexes of Greece (the destination country i) and
the countries of origin j, respectively.
Tourism data was collected from a variety of different sources. First, data regarding the
arrivals in Greece and countries of tourists’ origin were obtained from the Hellenic Statistical
Authority. Cross checks and additional information were extracted from airlines, cruise
4 See Daniel and Ramos (2002), Garin-Munoz (2006) and Garin-Munoz and Montero-Martin (2007), among others,
in relation to Portugal and Spain respectively.
tj
ti
tCPI
CPICP
,
,
8
companies, travel industry sources, big tourism operators, such as the Association of British
Travel Agents (ABTA), the International Air Transport Association (IATA), the Greek National
Tourism Organisation (GNTO), the Association of Greek Tourist Enterprises (SETE), the
Hellenic Association of Travel & Tourist Agencies, the European Travel Commission (ETC), the
General Secretariat of National Statistical Service of Greece (NSSG) – Ministry of Economy and
Finance, Athens International Airport (Eleftherios Venizelos), Mediterranean Cruise Ports
(MedCruise), Piraeus Port Authority and the United Kingdom Office for National Statistics.
Figure 1 illustrates the importance of the origin countries chosen in this paper as the
source of tourism demand in Greece. These countries are: France, Germany, the United
Kingdom, Italy, the Netherlands, and the United States. The countries selected make up on
average more than 50% of the total arrivals in Greece throughout the entire sample period.
[Please Insert Figure 1 About Here]
2.2. Descriptive Statistics
2.2.1. Tourist Arrivals
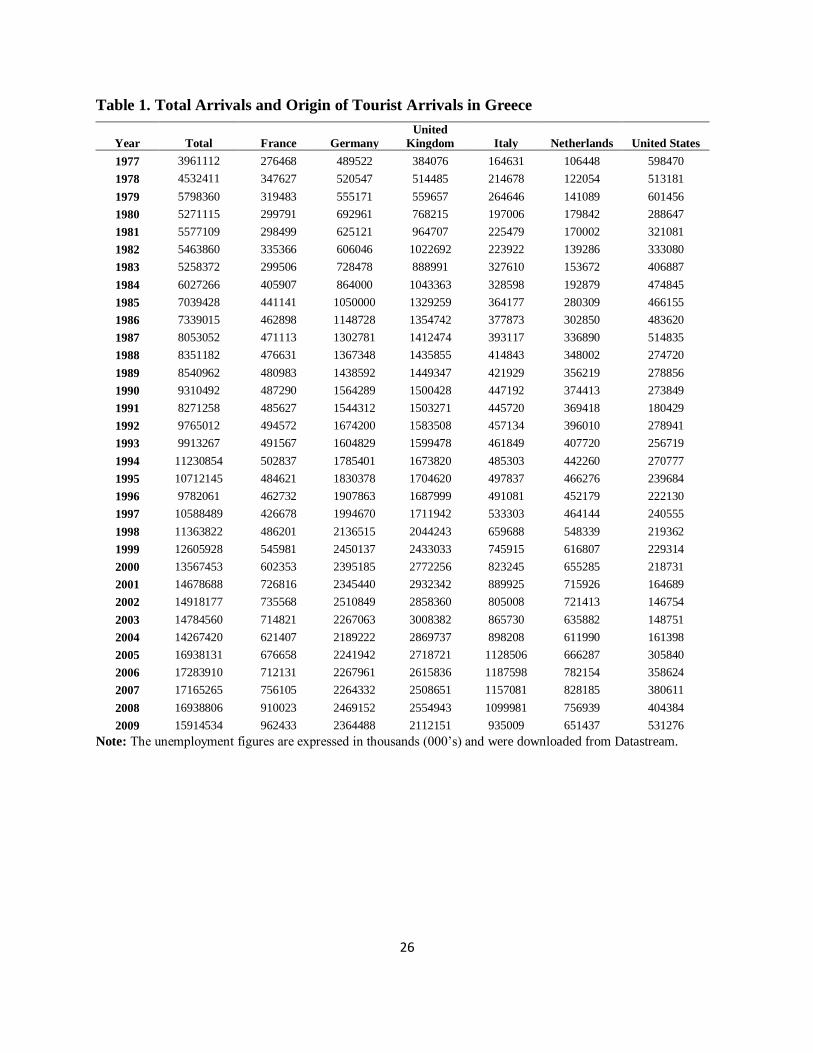
The total number of tourist arrivals in Greece from 1977-2009 are presented in Table 1.
The table considers tourist arrivals from the countries of origin considered in the paper. The
statistics generally indicate a rapidly increasing trend that began in the 1980’s and reached a
peak of 17.2 million tourists in 2006. It is worth mentioning that Greek tourism underwent much
development during this period in which increases in tourism arrivals were registered for twelve
out of the thirteen years mostly due to spatial polarization, the intensification of seasonality, and
the production and distribution of tourism consumption (Galani-Moutafi (2004)). The two years
that followed (2008 – 2009) clearly showed a decline due to the global financial crisis and
increased competition from newer holiday hot spots, such as Montenegro, Croatia and Turkey
offering similar attractions. Greece has a high percentage of repeat customers, but as a member
of the Eurozone, it is more expensive than some of the up-and-coming destinations and less
appealing to those on a fixed income (retirees for instance) or families seeking a budget holiday
(Alegre et al. (2010)).
Table 1 also reveals that tourist arrivals from Europe comprise the majority of foreign
9
tourists in Greece. For instance, Germany and the United Kingdom, two important sources of
tourism, reported an average annual growth rate of approximately six percent. Arrivals from the
United Kingdom peaked at over three million in 2003. However, since then, there has been a
steady drop of over 100,000 arrivals per year mainly due to intense competition from other
destinations, including domestic, offered by tour operators as well as the internet (Miller,
Rathouse, Scarles, Holmes, and Tribe (2010)).
However, further analysis of Table 1 reveals clear evidence that the source of tourism
arrivals is undiversified and heavily reliant on the United Kingdom, followed by Germany. Both
countries contribute, on average. 16.5% and 15.2% respectively, to total tourism demand
between 1977 and 2009.5 As a result, establishing the United Kingdom and Germany as the main
source of tourism demand has implications in identifying the greatest source of risk when
impulse response analysis is performed later in the study.
[Please Insert Table 1 About Here]
2.2.2. Macroeconomic Factors
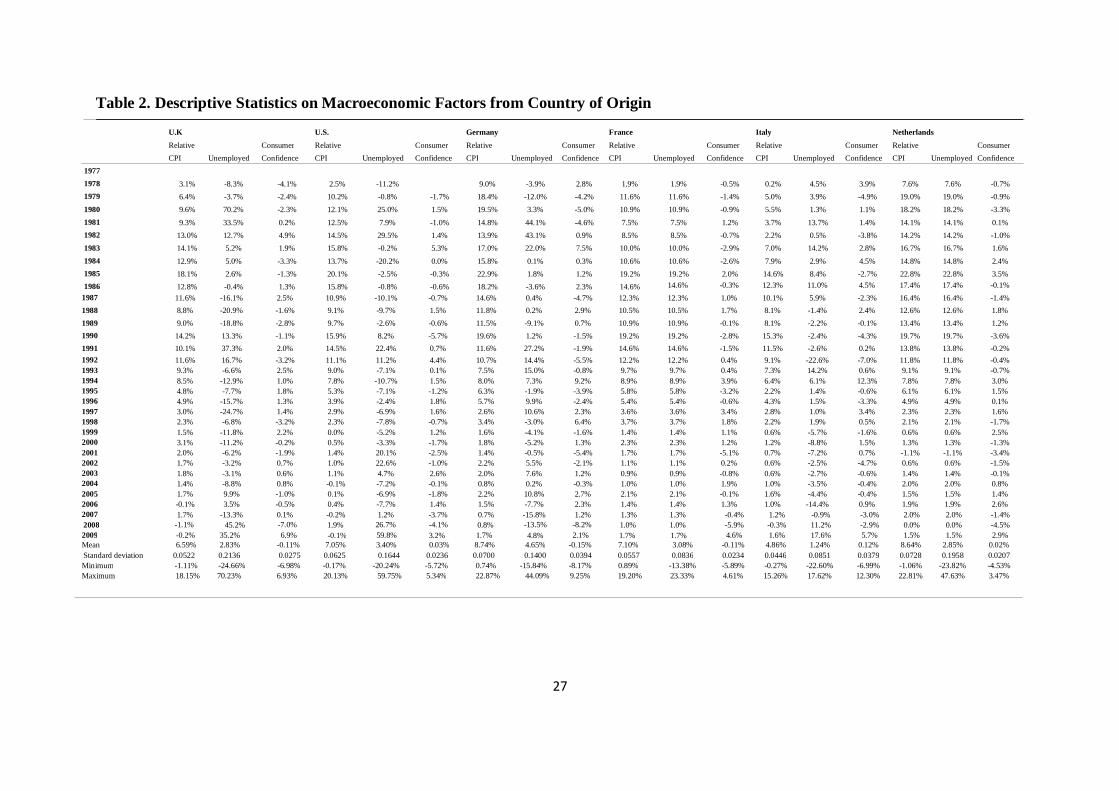
Table 2 provides descriptive statistics on the macroeconomic variables for the country of
origin from 1977 to 2009. Relative CPI, from a low of about five percent in Italy to almost nine
percent in Germany, indicates that the cost of living in Greece has increased significantly relative
to all countries of origin over the sample period. As a result, high inflation in Greece relative to
other countries seems as a potential source of risk to future arrivals. Unemployment appears to
be the most volatile macroeconomic factor considered even though it has increased over the
period, from just over one percent in Italy to around five percent in Germany, thus suggesting
another potential source of risk to future tourism demand in the short term. On the other hand,
despite showing greater variability, as implied by the minimum and maximum values, the
consumer confidence indicator has remained relatively stable over the sample period.
5 Further evidence of a lack of diversification in the source of tourism demand is provided when we performed the same analysis (not reported for space purposes) to non-EU countries and regions. Non-EU countries such as Russia,
Turkey and Japan contributed only 0.9%, 0.8% and 0.9%, respectively, over the same period. For regions, we looked
at the E.U. block, Asia, Africa and Oceania zones, only to find unequivocal evidence that the source of tourism
demand is undiversified with 66.3% arrivals coming from E.U. block countries, 4.2% from Asia, 0.9% from Africa
and 1.1% from the Oceania zone.
10
2.2.2.1 Unemployment Trends
Table 2 also provides inferences on annual trends in the macroeconomic factors by taking
the year on year percentage change as of December of each year. Focusing on unemployment
trends in relation to table 1, the United Kingdom, regarded as the most important source of
tourism, appears to be insensitive to increases in annual unemployment except during 2008 –
2009. Contrary to the general conclusions of Malley and Moutos (1996), significant increases in
unemployment between 1980–1982 and 1990–1992 were associated with increases in tourists’
numbers. According to unreported data from Laborsta organisation, this may be attributable to
the upward trend in employment levels over the past three decades, as from approximately 24.8
million people being employed in 1977, the number increased to around 30.8 million people by
2005. However, the significant fall in unemployment between 1993 and 2000 was associated
with the largest increase in tourist numbers in Greece over the same period. The increase in
unemployment during 2008–2009 coincided with a 19.26% reduction of British tourists who
visited Greece.
Germany, the second most important source of tourism demand, experienced the highest
unemployment increases during 1981 – 1983, 1990 – 1993 and 2003 – 2005. Despite this, table 1
shows that tourism from Germany increased during the first period and little changed in the
second period; this was followed by a fall of 10% in 2003 relative to the previous year. Tourism
flow appears to be insensitive to upward trends in unemployment in Italy between 1978 and
1987. According to Table 1, the greatest increase in tourism numbers coincided with a
sustainable period of declining unemployment from 1999 to 2007. Similar patterns occur in
relation to France and the Netherlands whereby tourist arrivals from both countries appear to be
relatively insensitive to increases in unemployment.
2.2.2.2 Relative CPI Trend – Tourists’ Cost of Living
Table 2 provides also information on the trend in the tourists’ cost of living defined as the
CPI in Greece relative to the countries of origin. Double digit increases in the cost of living in
Greece was observed relative to the countries of origin between 1980 and 1992. Interestingly, the
rate of increase declined quite dramatically later in the sample to the extent that, in some cases,
the cost of living in the country of origin increased relative to Greece (United Kingdom, United
11
States, Italy and the Netherlands). Despite this, tourism demand to Greece increased dramatically
over the same period. Germany, the second most important source of tourism, increased tourist
arrivals in Greece by 106%, followed by 99% from the Netherlands, 80% from Italy, 57% from
France, 56% from the United Kingdom and, finally, 25% from the United States.
On the other hand, the declining rate of increase in the relative CPI from 1993 has been
associated with marked shifts in the tourism arrivals. For instance, tourism arrivals from the
United States increased by 103% due to a major surge in numbers in 2005. Tourism arrivals from
Italy increased by 81% followed by 75% from France and 57% the Netherlands. Tourism arrivals
from the largest contributor, the United Kingdom, only increased by 36% over the same period.
2.2.2.3 Consumer Confidence Indicator
One of the key characteristics of the consumer confidence indicator is the stability and
lack of trend. However, closer inspection of the results, in relation to Table 1, reveals some
interesting findings. The largest year on year increases in tourism arrivals between 1984 and
1985, followed by 1998 and 2000, coincided with little or no increase in the consumer
confidence indicator. Evidence of declining consumer confidence, translating into declining
tourism arrivals, is restricted to Italy and the Netherlands at the height of the financial crisis in
2008, as shown in table 2. On the other hand, the same period was related with similar falls in
consumer confidence in France and Germany, and tourism arrivals increased by 20% and 9%,
respectively.
[Please Insert Table 2 About Here]
3. METHODOLOGY
In this paper we use the impulse response function to measure the impact of
macroeconomic shocks on future tourism demand. The implication of generating impulse
responses is to identify the source of risk to future tourism numbers due to the arrival of
macroeconomic shocks. There is a body of work in the tourism literature which uses
macroeconomic inputs into structural time series models to explain future tourism demand. For
instance, Metzgen-Quemarez (1990) used real Growth Domestic Product figures from the United
12
States, amongst other factors; Var et al. (1990) and Icoz et al. (1998) employed Turkish CPI
figures and the Turkish Lira currency exchange rate against the currency units from the tourist’s
country of origin, respectively; Greenidge (2001), used real Growth Domestic Product and CPI
of the country of origin as well as the price index of tourism in Barbados and finally, Song et al.
(2010) employed Growth Domestic Product data of the country of origin and CPI in Hong Kong
relative to the country of origin adjusted by the exchange rate.
However, unlike previous studies, we do not use macroeconomic inputs to explain the
demand function of tourism arrivals. Instead, we generate macroeconomic shocks from these
variables through the impulse response function by utilizing the Vector Autoregressive (VAR)
Model, first introduced by Sims (1980). Since its introduction, it has been widely used in the
economics literature in the use of macroeconomic variables. For instance, within the
unemployment literature, the VAR has been used extensively to generate forecasts of the natural
rate (Groenewold and Hagger (2000) and King and Morley (2007)) and turning points in the rate
of unemployment (Edlund and Karlsson, (2002)), just to list a few.
However, in the context of this paper, the VAR approach is only used to set up a system
by which one would introduce random macroeconomic shocks and analyze its impact on future
tourism demand. To determine the statistical reliability of the response, Monte Carlo Simulation
is used to construct confidence bands around the impulse response. This is of paramount
importance to policy makers and industry, as it provides useful inferences on the sensitivity of
future tourism arrivals to macroeconomic shocks and the potential source of risk from the
country of origin.
3.1. The Impulse Response Function
The impulse response function is a valuable tool that can be used to isolate the impact of
a macroeconomic shock from the country of origin on future tourists’ arrivals to Greece,
assuming other variables are held constant. For the purpose of this study, consider the simple
VAR model consisting of tourism demand in destination i denoted as tiY , and macroeconomic
inputs tjX , from the country of origin j at time t:
tjntintjtj
tintjntiti
uYXX
uXYY
,,22,2120,
,,12,1110,
(1)

13
in which,
jijjtj CONCPUNfX ,,,
where jUN , ijCP and jCON represent unemployment, tourists’ cost of living and consumer
confidence indicators from each country of origin, respectively. The term denotes the vector
of coefficients that represent the effect of ntjX , and ntiY , on tiY , and vice versa, and n is the
number of lags in the system.
The model of equation (1) is a VAR(n) specification given that the variables in the
system have a lag of n. A change in the innovation ui t, will immediately change all future values
of Y and X , since lagged Y appears in both equations. Assuming that the innovations ui t, and
u j t, are uncorrelated, the interpretation of the impulse response is straightforward. The ui t, is the
innovation for Y and u j t, is the innovation for X . The impulse response functions for u j t,
measure the impact of a random macroeconomic shock on future tourism demand.
The innovations ui t, and u j t, are, however, usually correlated, so that they have a
common component that cannot be associated with a specific variable. A common, but arbitrary,
method of dealing with this issue is to attribute the full impact of any common component to the
variable that comes first in the VAR system. In this case, the common component of ui t, and u j t,
is ui t, given that the innovation ui t, precedes u j t, . Hence, ui t, becomes the Y and X
innovations, which are transformed to remove the common component. We transform the
innovations by orthogonalising the errors using the Cholesky factorisation. This is a popular
method of transforming the covariance matrix of the resulting innovations in the VAR residuals
into a vector of orthogonal innovations defined as et .
E e ei t j t, , 0 where i j (2)
To transform the error terms, a N N lower matrix defined as V is chosen and the
orthogonalised innovations et are obtained to satisfy the following equation:
e uV 1 (3)
where, the innovation ut has an identity covariance matrix such that:
TEee (4)
14
and
VV T (5)
Upon making the transformation of the orthogonalised innovation and replacing the ut with
e Vt , the VAR model, expressed as a moving average representation, can be rewritten as follows:
0n
ntnt VeAY (6)
By defining B A Vn n , equation (7) becomes:
0n
ntnt eBY (7)
where, Bn represents the impulse response of the market in the future to a shock of one standard
deviation in time t. Hence, the elements of Bn are the impact multipliers. Assuming that tourism
demand Y is stationary, the impulse response should tend towards zero as n increases.
4. EMPIRICAL RESULTS
4.1. Preliminary Analysis – Forecasting Tourism Arrivals
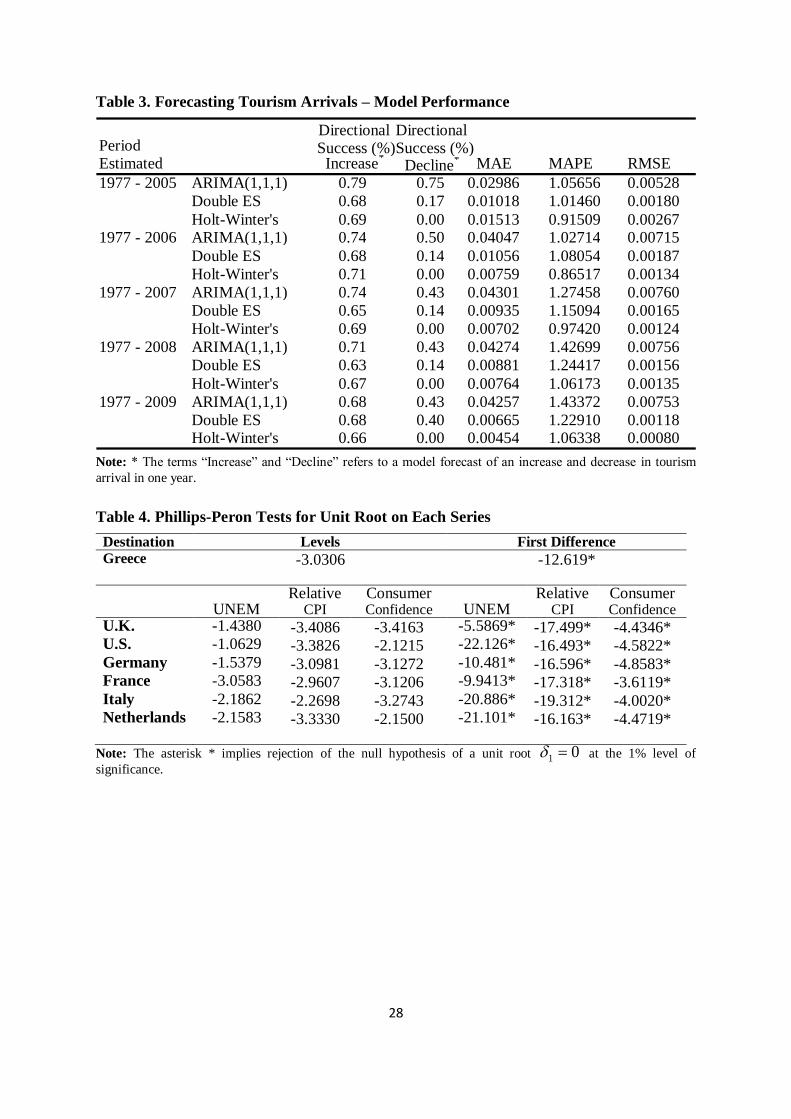
Table 3 presents the performance of one year out of sample forecasts for tourism demand
Y in Greece using the ARIMA (1, 1, 1), double exponential smoothing, and the Holt’s
exponential smoothing model with trend.6 The statistics relate to the performance of all models
since the estimation period expands when the model forecasts are updated as new data becomes
available. This includes statistics on the success rate at which the model captures the directional
forecasts and measures of forecasting accuracy using the Mean Absolute Error (MAE), Mean
Absolute Percentage Error (MAPE) and Root Mean Square Error (RMSE).7 Intuitively, this
6 Before implementing the forecasting models, we tested annual total arrivals series for a unit root using the Phillips-
Perron (1988) test. The results are not reported in the paper, but are available upon request. We find the null
hypothesis of a unit root accepted in the log levels Y but rejected after taking the first differences Y . Therefore,
we uncover stationarity in the transformed series Y . 7 The Mean Absolute Error (MAE) measures the degree to which forecasts and the outcomes are close together. The
Mean Absolute Percentage Error (MAPE) is similar except that it presents a measure of forecasting accuracy
relative to the eventual outcome in terms of a percentage, whereas, the Root Mean Square Error (RMSE) is a
measure of precision based on the residuals aggregated over the back-test period. All three measures of accuracy are
frequently used in the literature (for instance, Preez and Witt (2003), Song et al (2003) and Chu (2009) to list a few).
15
would enable one to identify the forecastability of tourism demand to Greece in light of the
potential risks to future numbers.
[Please Insert Table 3 About Here]
In general, the ARIMA (1, 1, 1) model outperforms other exponential smoothing models
as a directional forecasting tool over an expanding estimation period. The performance is most
impressive when it forecasts an increase in tourists’ numbers in one year’s time. The success rate
ranges from 79% to 68%. Despite this, the directional forecasting performance of the ARIMA
model does not translate into superior accurate forecasts. Based on the Mean Absolute Error
(MAE), Mean Absolute Percentage Error (MAPE) and Root Mean Square Error (RMSE)
measures, the most consistent performing model as a point forecasting tool is the Holt’s
exponential smoothing model with trend.
On the other hand, the worst performing model based on these criteria is the ARIMA (1,
1, 1) model, a finding that is robust as the estimation period expands. These findings are
consistent with the results of Smeral and Wuger (2005) who reported that the naïve model
outperformed the ARIMA model. On the other hand, our results contrasts with the early findings
of Chu (1998), followed by Preez and Witt (2003), in which the superior performance of the
ARIMA model in relation to other approaches was highlighted. Finding differences in model
performance using different approaches is also not surprising. For instance, Clements and
Hendry (1998) argue that the performance of econometric models is determined by the
methodology used to generate forecasts.
4.2. The Impact of Macroeconomic Shocks on Future Tourism Arrivals
4.2.1. The VAR Model
In this section, we address the impact of macroeconomic shocks on future tourism
demand for Greece. Firstly, we utilize the VAR (n) model on monthly data of tourists’ arrivals to
Greece, unemployment, tourists’ cost of living, and consumer confidence from the countries of
origin from 1977 to 2009. Given that VAR models are modelled on a stationary time series, the
first step requires the implementation of unit root tests on each series. Instead of using the
16
Augmented Dickey-Fuller (ADF) test, we employ the Phillips-Perron (1988) approach on the
level series first followed by the transformed series.
The intuition behind the use of the Phillips-Perron (1988) approach is that it has more
power than the Augmented Dickey-Fuller test. One issue that arises with the Augmented Dickey-
Fuller is the selection of the number of lags that could lead to a bias towards rejection of the null
hypothesis of a unit root in the event of selecting too few lags. Conversely, bias towards
accepting the null hypothesis tends to arise in the event of selecting too many lags. This problem
has been overcome by this approach, as it applies a non-parametric correction to deal with any
serial dependencies in the dataset. Table 4 presents the Phillips-Perron (1988) test results for
each series. As expected, rejection of the null hypothesis of a unit root is reported when the
series is differenced.8
[Please Insert Table 4 About Here]
With the detection of stationarity in the transformed series ( Y and X ), the following
VAR model, used as the system of equations from equation (1), is estimated:
tl
nl
ltl
nl
ltl
nl
ltllt
nl
lt
tk
nk
ktk
nk
ktk
nk
ktkkt
nk
kt
tj
nj
jtj
nj
jtj
nj
jtjjt
nj
t
ti
ni
iti
ni
iti
ni
itiit
ni
it
uCONeCPdUNcARRbaCON
uCONeCPdUNcARRbaCP
uCONeCPdUNcARRbjaUN
uCONeCPdUNcARRbaARR
,
,...,1,...,1,...,1,...,1
4
,
,...,1,...,1,...,1,...,1
3
,
,...,1,...,1,...,1,...,1
2
,
,...,1,...,1,...,1,...,1
1
(8)
where, ARR is the change in total tourism arrivals to Greece and a, b, c, d, e are coefficients to
be estimated within the VAR system. Before estimating equation (8), we performed the Akaike
(1974). Information Criterion test to determine the optimal number of lags (n) used in each
8 Given the finding of non-stationarity in the log series and stationarity in the transformed series, we tested whether
there exist a long run equilibrium relationship between tourism flows to Greece and the macroeconomic factors from
the country of origin using the Johansen (1988) and Johansen and Juselius (1990) maximum likelihood approaches.
The test results report overwhelming evidence of multiple co-integrating relationships between tourism flows and
macroeconomic variables as implied by theory discussed earlier. Owing to the volume of results generated, our
findings are not presented, but are available upon request.
17
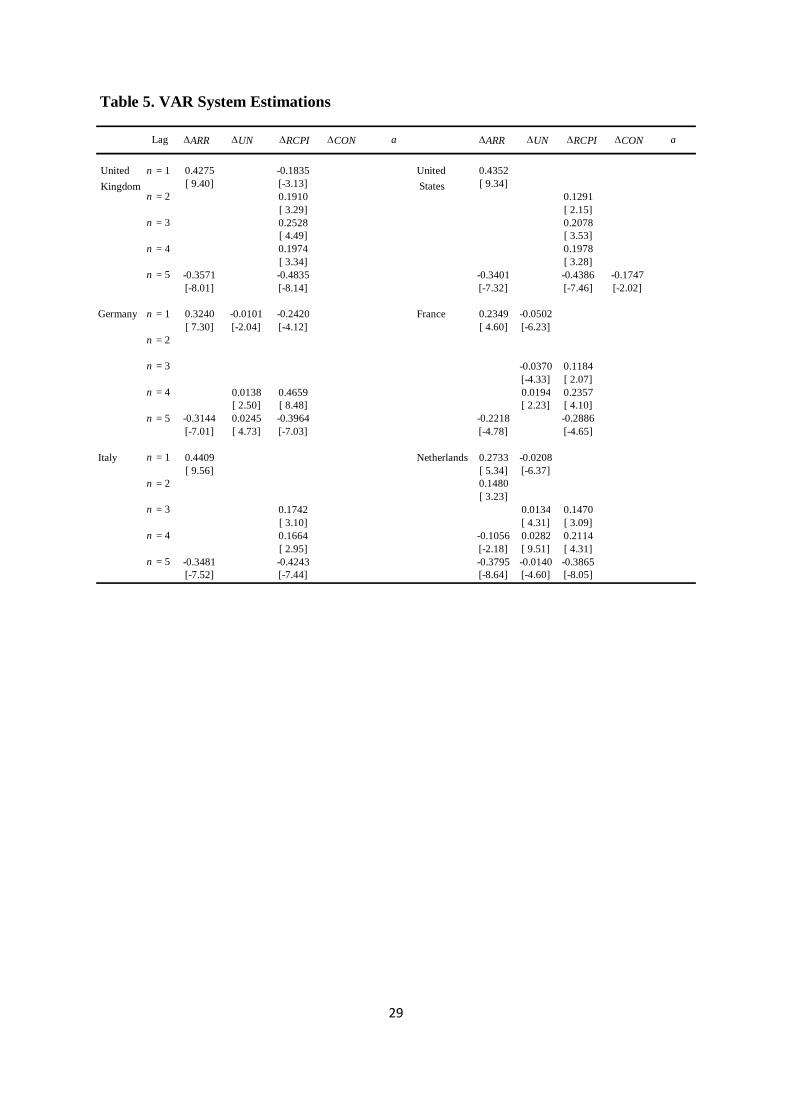
model system. We find that lag 5 is the optimal number of lags chosen for each system.9 Table 5
presents the VAR estimations for the total number of arrivals to Greece. Only coefficients that
are statistically significant at the five per cent level are reported given the volume of output. In
brief, the results suggest that changes in tourism demand are sensitive to changes in
unemployment (UN) in the origin country, and tourists’ cost of living relative to the country of
origin (CP), but least sensitive to changes in the consumer confidence indicator (CON). The
United Kingdom, being one of the important sources of tourism flows, is most sensitive to
changes in the tourists’ cost of living. On the other hand, Germany, with the second highest
number of arrivals, is subject to changes in unemployment and tourists’ cost of living. Tourism
flows appear to be most sensitive to changes in macroeconomic factors in the Netherlands.
[Please Insert Table 5 About Here]
4.2.2. Impulse Response Results
An issue with the VAR system estimations of Table 5 are the difficulties associated in
interpreting the coefficients owing to complications arising from correlation feedbacks in
addition to fluctuations of estimations at different lags. Following the estimation of the VAR, the
next step is to consider the system’s response to shocks originating from macroeconomic
surprises and the extent to which these shocks continue to have an impact on future tourism
arrivals. To be consistent with the one year forecasts in tourism arrivals analyzed earlier, we
focus on impulse responses for the next twelve months. In undertaking such an exercise, we
could identify the potential source of risk to future tourists’ arrivals. To this effect, impulse
responses take into account the variations in the velocity to which the effects of macroeconomic
shocks are transmitted, as well as the duration and rate of decay.
In order to determine the robustness and reliability of the response, we compute
confidence bands using Monte Carlo Simulation that is simulated 5000 times as a robustness test
of the impulse response. Large confidence intervals around the impulse response call into
question the credibility of the measurement information, and as such, the robustness of the
9 The results from the Akaike (1974) Information Criterion test are not presented in this paper for brevity; however,
they are available upon request.

18
response. In Figure 2 we generate time paths of impulse responses on future arrivals in each
destination to a one standard deviation unemployment shock in the country of origin. To ensure
consistency with the annual forecasts reported earlier, we generate impulse responses in future
tourists’ arrivals twelve months ahead.
The results provide a clear picture on the impact of macroeconomic shocks on future
tourism demand to Greece. Consistent with the conclusions implied by previous studies, a one
standard deviation unemployment shock originating from France and the Netherlands has an
immediate negative impact on future tourists’ arrivals although its duration is very temporary.
However, more interestingly future tourists’ arrivals appear to react positively after a delay of
four to six months following the unemployment shock from the country of origin (Germany,
France and the Netherlands). Tourists’ arrivals are forecasted to return to pre-shock levels around
ten months after the shock. In the case of Germany, the impulse response does become negative
ten months after the unemployment shock to continue beyond the twelve month horizon period.
The impulse response results show that tourists’ cost of living have a consistent impact
on future short term tourists’ arrivals with varying degrees of velocity and rate of decay. Closer
inspection of the results reveals that the response is asymmetric and differs in magnitude across
countries of origin. For instance, future tourists’ arrivals respond to a shock in relative CPI in a
positive manner subject to a lag of three to four months. However, in some cases the initial
positive response of future arrivals does become negative on average around five months after
the introduction of the shock only for arrivals to return to their pre-shock levels two months later.
The positioning of the confidence bands suggests that the impulse response is reliable and robust.
The results on unemployment and tourist’s cost of living are in marked contrast to the consumer
confidence indicator. Shocks to consumer confidence in the origin country appear to have no
impact on future tourism demand, although the positioning of the bands raises questions on the
reliability of the response.
[Please Insert Figure 2 About Here]
19
5. FURTHER DISCUSSION OF THE RESULTS
The combination of one year ahead forecast and measurement of the duration, at which
future tourism arrivals return to pre-shock levels in the twelve month horizon, provide important
information to policy makers for short term planning and budgeting purposes. We find all
forecasting models being useful short term directional forecasting tools as long as the models
forecast a year on year increase in arrivals. In combining the impulse response of an
unemployment shock into the VAR system, the delayed positive response in future tourist
numbers is consistent to the success rate in forecasting an increase in tourists’ arrivals in Table 3.
For Germany, being the second most important source of tourism demand, the
unemployment shock appears to have the greatest positive response. The finding of a delayed
positive response could be attributed to tourists deeming Greece as a relatively cheap destination
that people travel at a time when economic fundamentals are deteriorating in the origin country.
The immediate negative response to an unemployment shock, whilst consistent with the
conclusions inferred by the wage curve hypothesis and the psychological aspects of
unemployment (Blanchflower ((1996), (2001)) and Ahn, Garcia and Jimeno (2004)), is a major
source of downside risk to forecasting future projections of tourism arrivals. Despite this, when
combined with the delayed positive response, downside risk from an unemployment shock
appears to be limited.
Another source of risk to future tourism demand is the delayed negative response
recorded following the introduction of a shock to the tourists’ cost of living. This source of risk
tends to materialize six months after the introduction of the shock in France, Italy and the
Netherlands. However, the risk from this source appears to be limited due to the positive
response from shocks originating from the United Kingdom, and Germany that are not forecasted
to be reversed at least in the short run.
The impulse response analysis reports evidence that shocks to consumer confidence have
no bearing on future tourists’ arrivals. This finding has major implications in the light of
previous studies which have tested the theory surrounding the importance of the consumer
confidence indicator. Theory implies that falls in consumer confidence from the viewpoint of
increased uncertainty of future economic conditions or pessimism regarding future income leads
to an increase in precautionary savings and hence, negative reaction in future tourism arrivals.

20
According to our results, this hypothesis is rejected. Furthermore, the implication of our impulse
response results is to question the empirical finding that the predictive power of consumption and
household expenditure models is improved by the information contained in the consumer
confidence indicator (Carroll et al. (1994), Bram and Ludvigson (1998), and Howrey (2001)).
Such a conclusion is reached by the inference that a high reading on the consumer confidence
index should translate into increased expenditure and a willingness to go on vacation. This also
appears to be rejected by our results.
Taken together, finding limited downside risk to future demand from shocks to tourists’
cost of living and unemployment is indicative of customer loyalty irrespective of macroeconomic
shocks in the tourists’ country of origin and is consistent with the results reported by Garin-
Munoz (2006) and later, by Garin-Munoz and Montero-Martin (2007). Using lagged
consumption in the destination country as a dependent variable, both studies found compelling
evidence of high customer loyalty that is attributable to “word of mouth” effect in relation to the
Canary and Balearic Islands. Overall, our analysis provides an added dimension, not considered
in prior studies that unforeseen macroeconomic shocks from the origin country play an important
role in understanding potential risks to future tourism arrivals. Our results highlight the need for
third parties to perform impulse response analysis on total tourists’ arrivals to Greece as the size
of the response, the rate of decay and velocity and the duration of the response, vary
considerably.
6. IMPLICATIONS ON TOURIST ARRIVALS
The above analysis has a number of implications. Table 1 highlights the lack of
diversification in the sources of tourism in Greece since 1977. Negative macroeconomic shocks
to the United Kingdom and Germany pose major risks to the Greek tourism industry. Although
the impulse response results suggest that future tourism numbers may increase following
macroeconomic shocks, there is downside risk that could coincide with the peak times of the
year. With the source of potential risk confined to countries in the European Union, the results
suggest that the Greek authorities would be benefited by diversifying the sources of tourism as
21
means of reducing the risk of global macroeconomic shocks from the countries of origin.10
This
involves attracting a greater number of tourists from countries outside the European Union, such
as China, India, Russia and the United States. For instance, indications on arrivals from China
are very positive as over the studied period there is an average annual growth rate of 19.22%.11
As a result of the impact of macroeconomic shocks in the countries of origin, a potential
source of risk to future tourists’ arrivals has been identified by our findings. Safeguarding the
Greek tourism industry requires short, medium and long term planning and investment on the
brand itself, in addition to promoting Greece to countries beyond the European Union as a means
of diversifying away global economic risk. The results in this paper should provide important
insights that will be useful to short and medium term planning process. A similar exercise for
longer term planning will provide inferences on where to target future additional investment in
promoting the brand to new countries and/or regions in addition to its traditional sources of
tourism.
7. CONCLUSION
This paper opens a new avenue of research in tourism forecasting by investigating the
impact of random macroeconomic shocks on short term forecasts for tourist arrivals. This
approach differs from the established literature of investigating the demand function for tourists.
Our study addresses a major gap in the literature by forecasting tourism arrivals in Greece.
Forecasting tourists’ arrivals comes in two levels; first, we utilize an array of forecasting models,
firmly established in the literature, to generate one year out of sample forecasts. Secondly, we
estimate a VAR system from which we introduce random macroeconomic shocks to gauge the
reaction of future tourism arrivals in terms of the sign, magnitude and duration. Macroeconomic
factors used include unemployment, tourists’ cost of living, and finally, the consumer confidence
indicator with the latter two variables acting as proxies for the state of the economy in the origin
country. Undertaking such an exercise breaks new ground by identifying the greatest source of
the risk to future tourism demand, both in terms of the variable and location.
10 This view is given added importance given additional analysis reported earlier in footnote 4, where 66.3% of
tourists over the 1977 to 2009 period arrive from E.U. countries. This contrasts with 4.1% from Asia, 0.9% from
Africa and 1.1% from the Oceania region. 11 Source: Hellenic Association of Travel and Tourist Agencies (2010).
22
To begin with, our forecasting results were mixed. According to the preliminary analysis,
the ARIMA (1, 1, 1) model outperforms other exponential smoothing models as a directional
forecasting tool. This finding is robust on an ever expanding estimation period. However, the
directional forecasting performance of the ARIMA fails to translate into forecasting accuracy.
Instead, the Holt’s exponential smoothing model with trend generates the most accurate
forecasts.
In identifying the source of risk, we established that the source of tourists’ arrivals to
Greece is undiversified and heavily over-weighted towards the United Kingdom and Germany.
Despite this, the impulse response analysis yielded some interesting results. Consistent with the
implications of previous studies on unemployment, there is some evidence that shocks have an
immediate temporary negative impact on future tourists’ arrivals that is reversed four to six
months after the shock. Furthermore, future tourists’ arrivals appear to react to shocks on the
tourists’ cost of living, regardless of the country of origin, subject to a lag of three to four
months. This contrasts with the lack of response in future tourism demand to a shock in
consumer confidence index in the origin country. Taken together, despite the undiversified
nature in the source of tourism flow to Greece, the impulse response results suggest that
downside risk to future arrivals is limited, at least in the short term.
The impulse response results presented in this study open a new dimension in the type of
macroeconomic factors used and how these shocks impact on tourism demand in the future. As a
result, our comprehensive evidence offers important implications and insights to policymakers
and tourist operators regarding future tourism demand.
23
REFERENCES Abbas, M., & Ali-Ibrahim, M.A. (2011), The determinants of international tourism demand for Egypt: Panel Data
Evidence, European Journal of Economics Finance and Administrative Sciences 30, 50-58.
Ahn, N., Garcia, J.R. & Jimeno, J.F. (2004), The impact of unemployment on individual well-being in the EU,
ENEPRI Working Paper No. 29, 1-18.
Akaike, H. (1974), A new look at the statistical model identification, IEEE Transactions on Automatic Control 19
(6), 716-723.
Alegre, J. Mateo, S. & Pou, L. (2010), An analysis of households' appraisal of their budget constraints for potential
participation in tourism, Tourism Management 31(1), 45-54.
Arsad, Z., & Johor, N.B.M., (2010), Estimating European tourism demand for Malaysia, World Academy of Science,
Engineering and Technology 66, 1606–1611.
Athanasopoulos, G., & Hyndman, R.J. (2008), Modelling and forecasting Australian domestic
tourism, Tourism Management 29, 19-31. Blanchflower, D.G & Oswald, A.J. (1990), The wage curve, Scandinavian Journal of Economics 92(2), 215-235.
Blanchflower, D.G & Oswald, A. J. (1994), The wage curve, Cambridge and London: MIT Press.
Blanchflower, D.G. & Oswald, A.J. (2006), The wage curve, An Entry Written for The New Palgrave, 2nd Edition.
Blanchflower, D.G. (1996), Youth labor markets in twenty three countries: A comparison using micro data, in D.
Stern (ed.), School to Work Policies and Practices in Thirteen Countries, Hampton Press, 23-68
Blanchflower, D.G. (2001), Unemployment, well-being, and wage curves in eastern and central Europe. Journal of
the Japanese and International Economies, 15, 364-402.
Bram, J., & Ludvigson, S. (1998), Does consumer confidence forecast household expenditure? A sentiment index
horse race, FRBNY Economic Policy Review, 59-78.
Briassoulis, H. (1993), Tourism in Greece, in W. Pompl, and L. Lavery, eds.: In tourism in Europe: Structures and
Development, (CAB International, Wellington), 285-301.
Burger, C.J.S.C., Dohnal, M., Kathada, M. & Law, R. (2001), A practitioners guide to time-series methods for
tourism demand forecasting: a case study of Durban, South Africa, Tourism Management 22, 403-409.
Carroll, C., Fuhrer, J., Wilcox, D. (1994), Does consumer sentiment forecast household spending? If So, Why?,
American Economic Review 84(5), 1397-1408.
Chu, F.L. (1998), Forecasting tourism demand in Asian-Pacific countries, Annals of Tourism Research 25, 597-615.
Chu, F.L. (2004), Forecasting tourism demand: a cubic polynomial approach, Tourism Management 25, 209-218.
Chu, F.L. (2008), Analyzing and forecasting tourism demand with ARAR algorithm, Tourism Management 29,
1185-1196.
Chu, F.L. (2009), Forecasting tourism demand with ARMA-based methods, Tourism Management 30, 740-751.
Clements, M.P., & Hendry, D.F. (1998), Forecasting economic time series (Cambridge University Press,
Cambridge).
Dalrymple, K., & Greenidge, K. (1999), Forecasting arrivals to Barbados, Annals of Tourism Research 26, 188-191.
Daniel, A.C.M., & Ramos, F.F.R. (2002), Modelling inbound international tourism demand to Portugal,
International Journal of Tourism Research 4(3), 193-209.
Deller, S.C., & Tsai, Tsung-Hsiu, S. (1998), An examination of the wage curve: A Research Note, JRAP 28, 3-12.
Dharmaratne, G. (1995), Forecasting tourist arrivals in Barbados, Annals of Tourism Research 22, 804-818.
Doms, M., & Morin, N. (2004), Consumer sentiment, the economy and the news media, Working Papers in Applied
Economic Theory - Federal Reserve Bank of San Francisco, 1-61.
Dwyer, L., Forsyth, P., & Rao, P. (2000a), Price competitiveness of package tourism: Beyond the Big Mac
approach, Asia Pacific Journal of Tourism Research 5(2), 50-56.
Dwyer, L., Forsyth, P., & Rao, P. (2000b), Sectoral analysis of price competitiveness of tourism: An international
comparison, Tourism Analysis, 5(1), 1-12.
Dwyer, L., Forsyth, P., & Rao, P. (2002), Destination price competitiveness: Exchange rate changes versus inflation
rates, Journal of Travel Research, 40(3), 340-48.
Edlund, P.O., & Karlsson, S. (2002), Forecasting the Swedish unemployment rate VAR vs. transfer function
modeling, International Journal of Forecasting 9, 61-76.
24
Eppright, D.R., Arguea, N.M., & Huth, W.L. (1998), Aggregate consumer expectation indexes as indicators of
future consumer expenditures, Journal of Economic Psychology 19, 215-235.
Estevao, M. & Nargis. N. (2002), Wage moderation in France, IMF Working Paper 02/151.
Galani-Moutafi, V. (2004), Tourism research on Greece, Annals of Tourism Research 31, 157-179.
Garin-Munoz, T. (2006), Inbound international tourism to Canary Islands: A dynamic panel data model, Tourism
Management, 27(2), 281-291.
Garin-Munoz, T., & Montero-Martin, L.F. (2007), Tourism in the Balearic Islands: A dynamic model for
international demand using panel data, Tourism Management 28, 1224-1235.
Greenidge, K. (2001), Forecasting tourism demand: An STM approach, Annals of Tourism Research 28, 98-112.
Groenewold, N., & Hagger, A.J. (2000), The natural rate of unemployment in Australia: Estimates from a structural
Var, Australian Economic Papers 39, 121-137.
Habibi, F., & Rahim, K.A., (2009), A bound test approach to cointegration of tourism demand, American Journal of
Economics and Business Administration 1(2), 165-172.
Howrey, E. P. (2001), The predictive power of the index of consumer sentiment, Brookings Papers on Economic
Activity 1, 175–207.
Icoz, O., Kozak, M. & Var, T. (1998), Tourism demand in Turkey, Annals of Tourism Research 25, 236-240.
Johansen, S. (1988), Statistical Analysis of Co-integration Vectors, Journal of Economic Dynamics and Control, 12,
231-254.
Johansen, S. and Juselius, K. (1990), Maximum Likelihood Estimation and Inference on Co-integration – With
Applications to the demand for Money, BULLETIN, 52, 169-210.
King, T.B., & Morley, J. (2007), In search of the natural rate of unemployment, Journal of Monetary Economics 54,
550-564.
Law, R. (2000), Back-propagation learning in improving the accuracy of neural network-based tourism demand
forecasting, Tourism Management 21, 331-340.
Lim, C. & McAleer, M. (2001), Monthly seasonal variations: Asian tourism to Australia, Annals of Tourism
Research 28, 68-82.
Ludvigson, S.C. (2004), Consumer confidence and consumer spending, Journal of Economic Perspectives 18, (2),
29–50.
Malley, J., & Moutos, T. (1996), Unemployment and consumption, Oxford Economic Papers 48, 584-600.
Matsusaka, J. G., & Sbordone, A.M., (1995), Consumer confidence and economic fluctuations, Economic Inquiry
33(2), 296-318.
Metzgen-Quemarez, Y. (1990), Estimating the demand for international tourist service: The US and the Caribbean
(Princeton University).
Miller, G., Rathouse, K., Scarles, C., Holmes, K. & Tribe, J. (2010), Public understanding of sustainable tourism,
Annals of Tourism Research 37, 627–645.
Montuenga, V., Garcia, I., & Fernandez, M. (2003), Wage Flexibility: Evidence from five EU countries based on the
wage curve, Economics Letters 78, (2), 169-74.
Morley, C.L. (1994), The use of CPI for tourism prices in demand modeling, Tourism Management, 15, (5), 342-
346.
Papatheodorou, A., & Song, H. (2005), International tourism forecasts: A time series analysis of world and regional
data, Tourism Economics 11, 11-24.
Peeters, P., Szimba, E., & Duijnisveld, M. (2007), Major environmental impacts of European tourist transport.
Journal of Transport Geography, 15, 83-93.
Phillips, P.C.B & Perron, P. (1988), Testing for a unit root in time series regression, Biometrika 75, 335-346.
Preez du, J., & Witt, S.F. (2003), Univariate versus multivariate time series forecasting: an application to
international tourism demand, International Journal of Forecasting 19, 435-451.
Salman, A., Shukur, G., Bergmann-Winberg, M. (2007), Comparison of econometric modelling of demand for
domestic and international tourism: Swedish Data, Current Issues in Tourism 10(4), 323-342.
Sanz de Galdeano, A. & Turunen, J. (2005), Real wages and local unemployment in the Euro area, European
Central Bank Working Paper, 471.
Shen, S., Li, G. & Song, H. (2010), Combination forecasts of international tourism demand, Annals of Tourism
Research 38(1), 72-90.
25
Sims, C.A. (1980). Macroeconomics and Reality, Econometrica 48(1), 1-48.
Smeral, E., & Weber, A. (2000), Forecasting international tourism trends to 2010, Annals of Tourism Research 27,
982-1006.
Smeral, E., & Wüger, M. (2005), Does complexity matter? Methods for improving forecasting accuracy in
tourism: The case of Australia. Journal of Travel Research, 44, 100-110.
Song, H., Witt, S.F., Jensen, T.C. (2003), Tourism forecasting: accuracy of alternative economic models,
International Journal of Forecasting 19, 123-141.
Song, H., & Witt, S.F. (2006), Forecasting international tourist flows to Macau, Tourism Management 27(2), 214-
224.
Song, H., Li, G., Witt, S.F. & Athanasopoulos, G. (2010), Forecasting tourist arrivals using time-varying parameter
structural time series models, International Journal of Forecasting 27 3, 855-869.
Uysal, M., & O'Leary, J. (1986), A canonical analysis of international tourism demand, Annals of Tourism Research
13, 651-655.
Var, T., Golam, M. & Icoz, O. (1990), A tourism demand model, Annals of Tourism Research 17, 622-626.
Wagner, J. (1994), German Wage Curves 1979-1990, Economics Letters 44(3), 307-311.
WTO (2005) Tourism market trends. World overview and tourism topics. 2004 Edition Madrid: World Tourism
Organisation.
26
Table 1. Total Arrivals and Origin of Tourist Arrivals in Greece
Note: The unemployment figures are expressed in thousands (000’s) and were downloaded from Datastream.
Year Total France Germany
United
Kingdom Italy Netherlands United States
1977 3961112 276468 489522 384076 164631 106448 598470
1978 4532411 347627 520547 514485 214678 122054 513181
1979 5798360 319483 555171 559657 264646 141089 601456
1980 5271115 299791 692961 768215 197006 179842 288647
1981 5577109 298499 625121 964707 225479 170002 321081
1982 5463860 335366 606046 1022692 223922 139286 333080
1983 5258372 299506 728478 888991 327610 153672 406887
1984 6027266 405907 864000 1043363 328598 192879 474845
1985 7039428 441141 1050000 1329259 364177 280309 466155
1986 7339015 462898 1148728 1354742 377873 302850 483620
1987 8053052 471113 1302781 1412474 393117 336890 514835
1988 8351182 476631 1367348 1435855 414843 348002 274720
1989 8540962 480983 1438592 1449347 421929 356219 278856
1990 9310492 487290 1564289 1500428 447192 374413 273849
1991 8271258 485627 1544312 1503271 445720 369418 180429
1992 9765012 494572 1674200 1583508 457134 396010 278941
1993 9913267 491567 1604829 1599478 461849 407720 256719
1994 11230854 502837 1785401 1673820 485303 442260 270777
1995 10712145 484621 1830378 1704620 497837 466276 239684
1996 9782061 462732 1907863 1687999 491081 452179 222130
1997 10588489 426678 1994670 1711942 533303 464144 240555
1998 11363822 486201 2136515 2044243 659688 548339 219362
1999 12605928 545981 2450137 2433033 745915 616807 229314
2000 13567453 602353 2395185 2772256 823245 655285 218731
2001 14678688 726816 2345440 2932342 889925 715926 164689
2002 14918177 735568 2510849 2858360 805008 721413 146754
2003 14784560 714821 2267063 3008382 865730 635882 148751
2004 14267420 621407 2189222 2869737 898208 611990 161398
2005 16938131 676658 2241942 2718721 1128506 666287 305840
2006 17283910 712131 2267961 2615836 1187598 782154 358624
2007 17165265 756105 2264332 2508651 1157081 828185 380611
2008 16938806 910023 2469152 2554943 1099981 756939 404384
2009 15914534 962433 2364488 2112151 935009 651437 531276
27
Table 2. Descriptive Statistics on Macroeconomic Factors from Country of Origin
U.K U.S. Germany France Italy Netherlands Relative Consumer Relative Consumer Relative Consumer Relative Consumer Relative Consumer Relative Consumer CPI Unemployed Confidence CPI Unemployed Confidence CPI Unemployed Confidence CPI Unemployed Confidence CPI Unemployed Confidence CPI Unemployed Confidence
1977 1978 3.1% -8.3% -4.1% 2.5% -11.2% 9.0% -3.9% 2.8% 1.9% 1.9% -0.5% 0.2% 4.5% 3.9% 7.6% 7.6% -0.7% 1979 6.4% -3.7% -2.4% 10.2% -0.8% -1.7% 18.4% -12.0% -4.2% 11.6% 11.6% -1.4% 5.0% 3.9% -4.9% 19.0% 19.0% -0.9% 1980 9.6% 70.2% -2.3% 12.1% 25.0% 1.5% 19.5% 3.3% -5.0% 10.9% 10.9% -0.9% 5.5% 1.3% 1.1% 18.2% 18.2% -3.3% 1981 9.3% 33.5% 0.2% 12.5% 7.9% -1.0% 14.8% 44.1% -4.6% 7.5% 7.5% 1.2% 3.7% 13.7% 1.4% 14.1% 14.1% 0.1% 1982 13.0% 12.7% 4.9% 14.5% 29.5% 1.4% 13.9% 43.1% 0.9% 8.5% 8.5% -0.7% 2.2% 0.5% -3.8% 14.2% 14.2% -1.0% 1983 14.1% 5.2% 1.9% 15.8% -0.2% 5.3% 17.0% 22.0% 7.5% 10.0% 10.0% -2.9% 7.0% 14.2% 2.8% 16.7% 16.7% 1.6% 1984 12.9% 5.0% -3.3% 13.7% -20.2% 0.0% 15.8% 0.1% 0.3% 10.6% 10.6% -2.6% 7.9% 2.9% 4.5% 14.8% 14.8% 2.4% 1985 18.1% 2.6% -1.3% 20.1% -2.5% -0.3% 22.9% 1.8% 1.2% 19.2% 19.2% 2.0% 14.6% 8.4% -2.7% 22.8% 22.8% 3.5% 1986 12.8% -0.4% 1.3% 15.8% -0.8% -0.6% 18.2% -3.6% 2.3% 14.6% 14.6% -0.3% 12.3% 11.0% 4.5% 17.4% 17.4% -0.1%
1987 11.6% -16.1% 2.5% 10.9% -10.1% -0.7% 14.6% 0.4% -4.7% 12.3% 12.3% 1.0% 10.1% 5.9% -2.3% 16.4% 16.4% -1.4% 1988 8.8% -20.9% -1.6% 9.1% -9.7% 1.5% 11.8% 0.2% 2.9% 10.5% 10.5% 1.7% 8.1% -1.4% 2.4% 12.6% 12.6% 1.8% 1989 9.0% -18.8% -2.8% 9.7% -2.6% -0.6% 11.5% -9.1% 0.7% 10.9% 10.9% -0.1% 8.1% -2.2% -0.1% 13.4% 13.4% 1.2% 1990 14.2% 13.3% -1.1% 15.9% 8.2% -5.7% 19.6% 1.2% -1.5% 19.2% 19.2% -2.8% 15.3% -2.4% -4.3% 19.7% 19.7% -3.6% 1991 10.1% 37.3% 2.0% 14.5% 22.4% 0.7% 11.6% 27.2% -1.9% 14.6% 14.6% -1.5% 11.5% -2.6% 0.2% 13.8% 13.8% -0.2% 1992 11.6% 16.7% -3.2% 11.1% 11.2% 4.4% 10.7% 14.4% -5.5% 12.2% 12.2% 0.4% 9.1% -22.6% -7.0% 11.8% 11.8% -0.4% 1993 9.3% -6.6% 2.5% 9.0% -7.1% 0.1% 7.5% 15.0% -0.8% 9.7% 9.7% 0.4% 7.3% 14.2% 0.6% 9.1% 9.1% -0.7% 1994 8.5% -12.9% 1.0% 7.8% -10.7% 1.5% 8.0% 7.3% 9.2% 8.9% 8.9% 3.9% 6.4% 6.1% 12.3% 7.8% 7.8% 3.0% 1995 4.8% -7.7% 1.8% 5.3% -7.1% -1.2% 6.3% -1.9% -3.9% 5.8% 5.8% -3.2% 2.2% 1.4% -0.6% 6.1% 6.1% 1.5% 1996 4.9% -15.7% 1.3% 3.9% -2.4% 1.8% 5.7% 9.9% -2.4% 5.4% 5.4% -0.6% 4.3% 1.5% -3.3% 4.9% 4.9% 0.1% 1997 3.0% -24.7% 1.4% 2.9% -6.9% 1.6% 2.6% 10.6% 2.3% 3.6% 3.6% 3.4% 2.8% 1.0% 3.4% 2.3% 2.3% 1.6% 1998 2.3% -6.8% -3.2% 2.3% -7.8% -0.7% 3.4% -3.0% 6.4% 3.7% 3.7% 1.8% 2.2% 1.9% 0.5% 2.1% 2.1% -1.7% 1999 1.5% -11.8% 2.2% 0.0% -5.2% 1.2% 1.6% -4.1% -1.6% 1.4% 1.4% 1.1% 0.6% -5.7% -1.6% 0.6% 0.6% 2.5% 2000 3.1% -11.2% -0.2% 0.5% -3.3% -1.7% 1.8% -5.2% 1.3% 2.3% 2.3% 1.2% 1.2% -8.8% 1.5% 1.3% 1.3% -1.3% 2001 2.0% -6.2% -1.9% 1.4% 20.1% -2.5% 1.4% -0.5% -5.4% 1.7% 1.7% -5.1% 0.7% -7.2% 0.7% -1.1% -1.1% -3.4% 2002 1.7% -3.2% 0.7% 1.0% 22.6% -1.0% 2.2% 5.5% -2.1% 1.1% 1.1% 0.2% 0.6% -2.5% -4.7% 0.6% 0.6% -1.5% 2003 1.8% -3.1% 0.6% 1.1% 4.7% 2.6% 2.0% 7.6% 1.2% 0.9% 0.9% -0.8% 0.6% -2.7% -0.6% 1.4% 1.4% -0.1% 2004 1.4% -8.8% 0.8% -0.1% -7.2% -0.1% 0.8% 0.2% -0.3% 1.0% 1.0% 1.9% 1.0% -3.5% -0.4% 2.0% 2.0% 0.8% 2005 1.7% 9.9% -1.0% 0.1% -6.9% -1.8% 2.2% 10.8% 2.7% 2.1% 2.1% -0.1% 1.6% -4.4% -0.4% 1.5% 1.5% 1.4% 2006 -0.1% 3.5% -0.5% 0.4% -7.7% 1.4% 1.5% -7.7% 2.3% 1.4% 1.4% 1.3% 1.0% -14.4% 0.9% 1.9% 1.9% 2.6% 2007 1.7% -13.3% 0.1% -0.2% 1.2% -3.7% 0.7% -15.8% 1.2% 1.3% 1.3% -0.4% 1.2% -0.9% -3.0% 2.0% 2.0% -1.4% 2008 -1.1% 45.2% -7.0% 1.9% 26.7% -4.1% 0.8% -13.5% -8.2% 1.0% 1.0% -5.9% -0.3% 11.2% -2.9% 0.0% 0.0% -4.5%
-0.2% 35.2% 6.9% -0.1% 59.8% 3.2% 1.7% 4.8% 2.1% 1.7% 1.7% 4.6% 1.6% 17.6% 5.7% 1.5% 1.5% 2.9% Mean 6.59% 2.83% -0.11% 7.05% 3.40% 0.03% 8.74% 4.65% -0.15% 7.10% 3.08% -0.11% 4.86% 1.24% 0.12% 8.64% 2.85% 0.02% Standard deviation 0.0522 0.2136 0.0275 0.0625 0.1644 0.0236 0.0700 0.1400 0.0394 0.0557 0.0836 0.0234 0.0446 0.0851 0.0379 0.0728 0.1958 0.0207 Minimum -1.11% -24.66% -6.98% -0.17% -20.24% -5.72% 0.74% -15.84% -8.17% 0.89% -13.38% -5.89% -0.27% -22.60% -6.99% -1.06% -23.82% -4.53% Maximum 18.15% 70.23% 6.93% 20.13% 59.75% 5.34% 22.87% 44.09% 9.25% 19.20% 23.33% 4.61% 15.26% 17.62% 12.30% 22.81% 47.63% 3.47%
2009
28
Table 3. Forecasting Tourism Arrivals – Model Performance
Note: * The terms “Increase” and “Decline” refers to a model forecast of an increase and decrease in tourism
arrival in one year.
Table 4. Phillips-Peron Tests for Unit Root on Each Series
Destination Levels First Difference Greece -3.0306 -12.619* Relative Consumer Relative Consumer UNEM CPI Confidence UNEM CPI Confidence U.K. -1.4380 -3.4086 -3.4163 -5.5869* -17.499* -4.4346* U.S. -1.0629 -3.3826 -2.1215 -22.126* -16.493* -4.5822* Germany -1.5379 -3.0981 -3.1272 -10.481* -16.596* -4.8583* France -3.0583 -2.9607 -3.1206 -9.9413* -17.318* -3.6119* Italy -2.1862 -2.2698 -3.2743 -20.886* -19.312* -4.0020* Netherlands -2.1583 -3.3330 -2.1500 -21.101* -16.163* -4.4719*
Note: The asterisk * implies rejection of the null hypothesis of a unit root 01 at the 1% level of
significance.
Directional Directional Period Success (%) Success (%) Estimated Increase
* Decline
* MAE MAPE RMSE
1977 - 2005 ARIMA(1,1,1) 0.79 0.75 0.02986 1.05656 0.00528
Double ES 0.68 0.17 0.01018 1.01460 0.00180
Holt-Winter's 0.69 0.00 0.01513 0.91509 0.00267 1977 - 2006 ARIMA(1,1,1) 0.74 0.50 0.04047 1.02714 0.00715
Double ES 0.68 0.14 0.01056 1.08054 0.00187
Holt-Winter's 0.71 0.00 0.00759 0.86517 0.00134
1977 - 2007 ARIMA(1,1,1) 0.74 0.43 0.04301 1.27458 0.00760
Double ES 0.65 0.14 0.00935 1.15094 0.00165
Holt-Winter's 0.69 0.00 0.00702 0.97420 0.00124
1977 - 2008 ARIMA(1,1,1) 0.71 0.43 0.04274 1.42699 0.00756
Double ES 0.63 0.14 0.00881 1.24417 0.00156
Holt-Winter's 0.67 0.00 0.00764 1.06173 0.00135
1977 - 2009 ARIMA(1,1,1) 0.68 0.43 0.04257 1.43372 0.00753
Double ES 0.68 0.40 0.00665 1.22910 0.00118 Holt-Winter's 0.66 0.00 0.00454 1.06338 0.00080
29
Table 5. VAR System Estimations
Figure 1. Percentage of Total Arrivals to Greece
From the Country's of Origin
40.0%
42.0%
44.0%
46.0%
48.0%
50.0%
52.0%
54.0%
56.0%
58.0%
60.0%
1977
1979
1981
1983
1985
1987
1989
1991
1993
1995
1997
1999
2001
2003
2005
2007
2009
Lag a a
United
Kingdom
n = 1 0.4275 -0.1835 United
States 0.4352
[ 9.40] [-3.13] [ 9.34] n = 2 0.1910 0.1291
[ 3.29] [ 2.15] n = 3 0.2528 0.2078
[ 4.49] [ 3.53] n = 4 0.1974 0.1978
[ 3.34] [ 3.28] n = 5 -0.3571 -0.4835 -0.3401 -0.4386 -0.1747
[-8.01] [-8.14] [-7.32] [-7.46] [-2.02]
Germany n = 1 0.3240 -0.0101 -0.2420 France 0.2349 -0.0502 [ 7.30] [-2.04] [-4.12] [ 4.60] [-6.23]
n = 2
n = 3 -0.0370 0.1184 [-4.33] [ 2.07]
n = 4 0.0138 0.4659 0.0194 0.2357 [ 2.50] [ 8.48] [ 2.23] [ 4.10]
n = 5 -0.3144 0.0245 -0.3964 -0.2218 -0.2886 [-7.01] [ 4.73] [-7.03] [-4.78] [-4.65]
Italy n = 1 0.4409 Netherlands 0.2733 -0.0208 [ 9.56] [ 5.34] [-6.37]
n = 2 0.1480 [ 3.23]
n = 3 0.1742 0.0134 0.1470 [ 3.10] [ 4.31] [ 3.09]
n = 4 0.1664 -0.1056 0.0282 0.2114 [ 2.95] [-2.18] [ 9.51] [ 4.31]
n = 5 -0.3481 -0.4243 -0.3795 -0.0140 -0.3865 [-7.52] [-7.44] [-8.64] [-4.60] [-8.05]
ARR UN RCPI CON ARR UN RCPI CON

30
Figure 1
Figure 1. Percentage of Total Arrivals to Greece
From the Country's of Origin
40.0%
42.0%
44.0%
46.0%
48.0%
50.0%
52.0%
54.0%
56.0%
58.0%
1977
1979
1981
1983
1985
1987
1989
1991
1993
1995
1997
1999
2001
2003
2005
2007
2009
Percentage of Total Arrivals to Greece
From the Country's of Origin: 1977 - 2009
(France, Germany, U.K., Italy, Netherlands, Japan and U.S.)
40.0%
42.0%
44.0%
46.0%
48.0%
50.0%
52.0%
54.0%
56.0%
58.0%
60.0%
1977
1979
1981
1983
1985
1987
1989
1991
1993
1995
1997
1999
2001
2003
2005
2007
2009
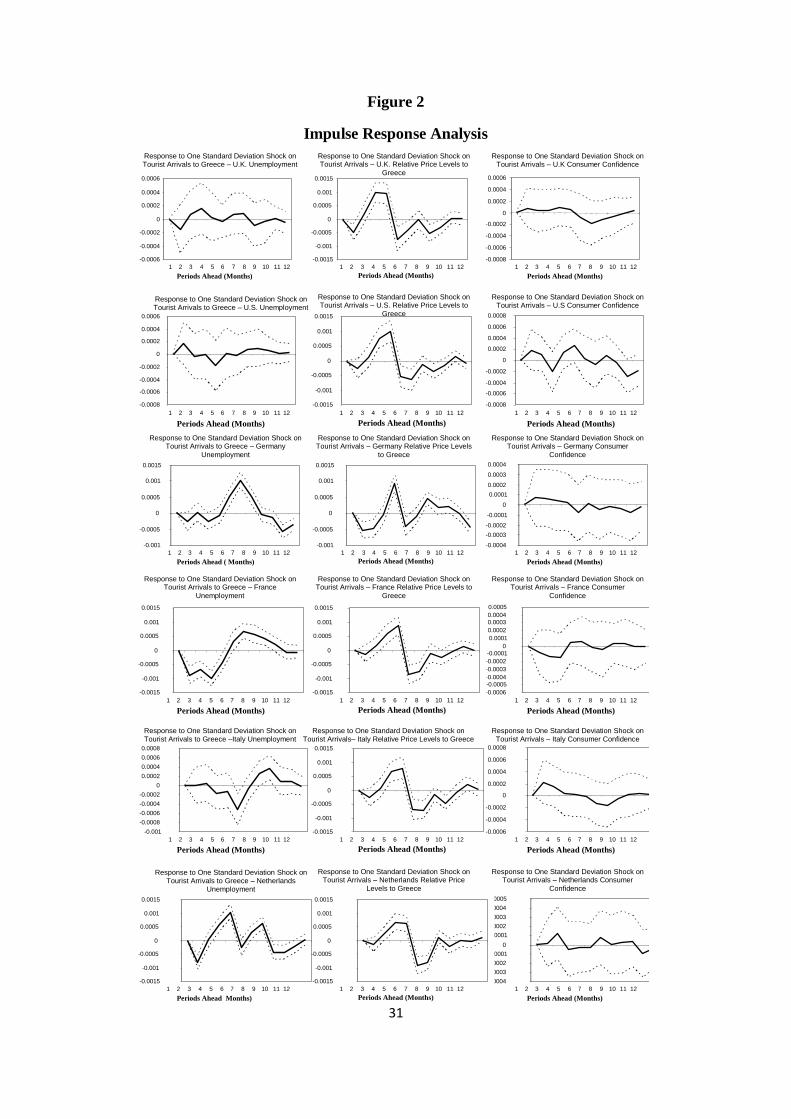
31
Figure 2
Impulse Response Analysis
-0.0006 -0.0004 -0.0002
0 0.0002 0.0004 0.0006
1 2 3 4 5 6 7 8 9 10 11 12 Periods Ahead (Months)
-0.0008 -0.0006 -0.0004 -0.0002
0 0.0002 0.0004 0.0006
1 2 3 4 5 6 7 8 9 10 11 12 Periods Ahead (Months)
-0.0015 -0.001
-0.0005 0
0.0005 0.001
0.0015
1 2 3 4 5 6 7 8 9 10 11 12 Periods Ahead (Months)
Response to One Standard Deviation Shock on Tourist Arrivals to Greece – U.K. Unemployment
Response to One Standard Deviation Shock on Tourist Arrivals – U.K. Relative Price Levels to
Greece
Response to One Standard Deviation Shock on Tourist Arrivals – U.K Consumer Confidence
-0.0008 -0.0006 -0.0004 -0.0002
0 0.0002 0.0004 0.0006
1 2 3 4 5 6 7 8 9 10 11 12 Periods Ahead (Months)
-0.0008 -0.0006 -0.0004 -0.0002
0 0.0002 0.0004 0.0006 0.0008
1 2 3 4 5 6 7 8 9 10 11 12 Periods Ahead (Months)
-0.0015 -0.001
-0.0005 0
0.0005 0.001
0.0015
1 2 3 4 5 6 7 8 9 10 11 12 Periods Ahead (Months)
Response to One Standard Deviation Shock on Tourist Arrivals to Greece – U.S. Unemployment
Response to One Standard Deviation Shock on Tourist Arrivals – U.S. Relative Price Levels to
Greece
Response to One Standard Deviation Shock on Tourist Arrivals – U.S Consumer Confidence
-0.001 -0.0005
0 0.0005
0.001 0.0015
1 2 3 4 5 6 7 8 9 10 11 12 Periods Ahead ( Months)
-0.0004 -0.0003 -0.0002 -0.0001
0 0.0001 0.0002 0.0003 0.0004
1 2 3 4 5 6 7 8 9 10 11 12 Periods Ahead (Months)
-0.001 -0.0005
0 0.0005
0.001 0.0015
1 2 3 4 5 6 7 8 9 10 11 12 Periods Ahead (Months)
Response to One Standard Deviation Shock on Tourist Arrivals to Greece – Germany
Unemployment
Response to One Standard Deviation Shock on Tourist Arrivals – Germany Relative Price Levels
to Greece
Response to One Standard Deviation Shock on Tourist Arrivals – Germany Consumer
Confidence
-0.0015 -0.001
-0.0005 0
0.0005 0.001
0.0015
1 2 3 4 5 6 7 8 9 10 11 12 Periods Ahead (Months)
-0.0006 -0.0005 -0.0004 -0.0003 -0.0002 -0.0001
0 0.0001 0.0002 0.0003 0.0004 0.0005
1 2 3 4 5 6 7 8 9 10 11 12 Periods Ahead (Months)
-0.0015 -0.001
-0.0005 0
0.0005 0.001
0.0015
1 2 3 4 5 6 7 8 9 10 11 12 Periods Ahead (Months)
Response to One Standard Deviation Shock on Tourist Arrivals to Greece – France
Unemployment
Response to One Standard Deviation Shock on Tourist Arrivals – France Relative Price Levels to
Greece
Response to One Standard Deviation Shock on Tourist Arrivals – France Consumer
Confidence
-0.001 -0.0008 -0.0006 -0.0004 -0.0002
0 0.0002 0.0004 0.0006 0.0008
1 2 3 4 5 6 7 8 9 10 11 12 Periods Ahead (Months)
-0.0006 -0.0004 -0.0002
0 0.0002 0.0004 0.0006 0.0008
1 2 3 4 5 6 7 8 9 10 11 12 Periods Ahead (Months)
-0.0015 -0.001
-0.0005 0
0.0005 0.001
0.0015
1 2 3 4 5 6 7 8 9 10 11 12 Periods Ahead (Months)
Response to One Standard Deviation Shock on Tourist Arrivals to Greece –Italy Unemployment
Response to One Standard Deviation Shock on Tourist Arrivals– Italy Relative Price Levels to Greece
Response to One Standard Deviation Shock on Tourist Arrivals – Italy Consumer Confidence
-0.0015 -0.001
-0.0005 0
0.0005 0.001
0.0015
1 2 3 4 5 6 7 8 9 10 11 12 Periods Ahead Months)
-0.0004 -0.0003 -0.0002 -0.0001
0 0.0001 0.0002 0.0003 0.0004 0.0005
1 2 3 4 5 6 7 8 9 10 11 12 Periods Ahead (Months)
-0.0015 -0.001
-0.0005 0
0.0005 0.001
0.0015
1 2 3 4 5 6 7 8 9 10 11 12 Periods Ahead (Months)
Response to One Standard Deviation Shock on Tourist Arrivals to Greece – Netherlands
Unemployment
Response to One Standard Deviation Shock on Tourist Arrivals – Netherlands Relative Price
Levels to Greece
Response to One Standard Deviation Shock on Tourist Arrivals – Netherlands Consumer
Confidence