annual tourist arrivals report 2015/2014 · 2016-06-29 · 2 annual report of tourist arrivals list...
TRANSCRIPT

BARBADOS STATISTICAL SERVICE 5th Floor Baobab Tower, Warrens
St. Michael, BARBADOS Tel: (246) 535-2600 Fax: (246) 421-8294
Web: www.barstats.gov.bb
This publication serves as a substitute for the usual Monthly
Statistical Bulletins of Tourist Arrivals for the year 2015. It presents
a similar statistical analysis, however additional indicators of
tourist arrivals have been included along with a greater level of
disaggregation.
The data for this report was provided by the Immigration
Department from the Embarkation/Disembarkation (E/D) cards
and the cruise ships’ manifests. Detailed information on stay-over
arrivals and summary cruise ship arrivals data were respectively
derived from these sources.
As of December 2014, the Immigration Department defined a new
classification to allow for the identification of crew members who
spend at least one (1) night in Barbados. In light of this new
information the BSS has decided to classify those crew cases as
Business/Conference arrivals. This adjustment should therefore be
taken into consideration when studying historical trends against
current and future purpose of visit statistics for tourist arrivals.
Preface Content
Pg 2. List of Tables List of Figures
Pg 3. Definitions Pg 4. A Comparative Overview
Introduction Stay-Over Arrivals
Cruise Arrivals
Pg 10. Five Year Review Pg 11. Appendix
The Annual Report of Tourist Arrivals 2015/2014 was prepared and published by the Socio-Economic and Gender Statistics Division of the Barbados Statistical Service.
For further information please contact us via the details above or email [email protected].
2015/2014

2
Annual Report of Tourist Arrivals
List of Tables Table 1 Summary of Main Indicators Pg. 11
Table 2 Total Stay-Over Arrivals by Market and Month of Arrival Pg. 12
Table 3 Total Stay-Over Arrivals from CARICOM Market by Country Pg. 13
Table 4 Total Stay-Over Arrivals from CARICOM Market by Month of Arrival Pg. 13
Table 5 Average Length of Stay for Stay-Over Arrivals Pg. 14
Table 6 Total Cruise Passenger Visitor Arrivals by Month of Arrival Pg. 15
Table 7 Total Landed Cruise Passenger Arrivals by Month of Arrival Pg. 15
Table 8 Monthly Stay-Over Arrivals by Year; 2011-2015 Pg. 16
Table 9 Annual Stay-Over Arrivals by Purpose of Visit; 2011-2015 Pg. 16
Table 10 Monthly Cruise Passenger Arrivals by Year; 2011-2015 Pg. 17
Table 11 Monthly Landed Cruise Passenger Arrivals by Year; 2011-2015 Pg. 17
List of Figures Figure 1 Percentage Distribution of Stay-Over Arrivals by Sex Pg. 4
Figure 2 Percentage Distribution of Stay-Over Arrivals by Age Group Pg. 4
Figure 3 Percentage Distribution of Stay-Over Arrivals by Nationality Status Pg. 5
Figure 4 Total Stay-Over Visitor Arrivals by Month Pg. 6
Figure 5 Total Annual Stay-Over Visitor Arrivals by Market Pg. 6
Figure 6 Annual Stay-Over Arrivals by Market Share Pg. 7
Figure 7 2015/2014 Growth in Stay-Over Arrivals by Purpose of Visit Pg. 8
Figure 8 Average Length of Stay for Stay-Over Arrivals by Market Pg. 8
Figure 9 Average Length of Stay for Stay-Over Arrivals by Nationality Status Pg. 8
Figure 10 Total Cruise Passenger Arrivals by Month Pg. 9
Figure 11 Total Annual Stay-Over Arrivals; 2011-2015 Pg. 10
Figure 12 Total Stay-Over Arrivals by Month; 2011-2015 Pg. 10
Figure 13 Total Annual Cruise Passenger Arrivals; 2011-2015 Pg. 10

3
Annual Report of Tourist Arrivals
Definitions Visitor:
Any person (national or alien) normally resident abroad, who enters the island for not more
than six months for legitimate non-immigrant purposes such as recreation, holiday, sports,
conference, health, visiting family or friends, religious pilgrimage or study.
Tourist:
A visitor whose visit includes an overnight stay in the country (also referred to as a stay-over
or overnight visitor).
Cruise Passenger:
A visitor who arrives by cruise ship and whose visit does not involve an overnight stay on the
island, a same-day visitor (or excursionist).
Landed Cruise Passenger:
A cruise ship passenger who permanently disembarked on the island. (Includes direct-transits,
tourists and residents)
CARICOM:
The Caribbean Common Market which includes Antigua, Bahamas, Barbados, Belize,
Dominica, Grenada, Guyana, Haiti, Jamaica, Montserrat, St. Kitts and Nevis, St. Lucia, St.
Vincent and the Grenadines, Suriname and Trinidad and Tobago. Also included here is
Anguilla, an Associate CARICOM member.
Non-Resident (Barbadian) National:
Any (Barbadian) national who usually resides abroad.
Length of Stay:
The intended duration of a visitor’s stay on the island as indicated on arrival.
Seasons:
Winter Season – January to April
Summer Season – May to December

4
Annual Report of Tourist Arrivals
Strong positive
growth recorded for
stay-over visitor
arrivals in 2015
Introduction
Throughout the year 2015, Barbados attracted a total of 1,303,272
visitor arrivals. This translates to an increase of 8.2% when compared
to the 1,204,243 arrivals recorded in 2014. Among these, 591,872
were tourists or stay-over arrivals, representing a 13.9% increase
compared to the previous year, which recorded 519,635. The
remaining 711,400 were cruise ship passengers, which grew by 3.9%
when compared to 2014 (see Pg.11 Table 1).
A Comparative Overview
Stay-Over Arrivals
Demographic Profile
Among total stay-over visitor arrivals the
distribution of demographic characteristics
remained relatively constant over the period
under review, while experiencing mixed rates
of growth.
Figure 1 shows that over the review period, the
majority of stay-over arrivals were females. In
2015, 52.4% of stay-over arrivals or 310,353
tourists were female. While males represented
281,516 tourists or 47.6% of total stay-over
arrivals in the same period (see pg.11 Table 1).
Tourist arrivals by males and females grew by
13.5% and 14.3% respectively when compared
to 2014. The sex ratio of overnight visitors in
2015 was therefore 110 females per 100 males.
With respect to the age distribution of stay-over
arrivals, Figure 2 illustrates the domination of
overnight arrivals by visitors aged 15-64 years.
Those 15-44 years of age represented 41.3% of
total stay-over arrivals in 2015, while those 45-
2015/2014

5
Annual Report of Tourist Arrivals
Continued from page 4
64 years accounted for 38%. Arrivals by children under the
age of 15 and adults 65 years and over accounted for 7.3%
and 13.4% of total stay-overs correspondingly. Growth
rates in tourist arrivals by age group ranged from a low of
4.6% among visitors 0-14 years of age and peaked at 16.2%
among those 15-44 years.
A review of stay-over visitor arrivals by nationality status
also revealed consistency in distribution over the review
period (see Figure 3). Foreign Nationals represented the
vast majority of stay-over arrivals with a 95.1% share in
2015, marginally above the share of 94.2% share recorded
in 2014. This translates to a 15% increase in arrivals by
visitors of foreign nationality when compared to 2014.
Non-Resident Barbadians therefore accounted for the
remaining 4.9% of total stay-over arrivals, moving slightly
below the proportion of 5.8%, which was recorded in the
year 2014. A reduction in arrivals by non-resident
Barbadian nationals was observed in 2015, with a 3.4%
decline falling to 28,978 from 30,005 in the previous year.
Visitor Arrivals in 2015 totaled
1,303,272 (8.2%).
Stay-over arrivals grew by
72,237 tourists (13.9%).
Cruise passengers numbered
711,400 (3.9%).
Landed cruise passengers
numbered 121,578 (2.6%).
Gender ratio for 2015 stay-over
arrivals: 110 females per 100
males.
Arrivals by Barbadians resident
abroad declined (3.4%).
Stay-over arrivals by Foreign
Nationals in 2015 totaled
562,897 (15%).
Most tourists were aged 15-44
years in 2015 (16.2%).
2015/2014
Highlights

6
Annual Report of Tourist Arrivals
Monthly Arrivals Review
Throughout the year 2015, robust monthly
growth contributed to the overall improvement
in stay-over visitor arrivals as depicted below in
Figure 4. The most significant rate of growth
was observed in the month of September, with
an increase of 22.1% to 32,153 tourist arrivals
over the 26,329 recorded in the same month of
2014. This strong performance was closely
followed by increases of 20% and 19.5% in the
months of February and April respectively.
The lowest rates of positive growth occurred in
the months of May and December, which
registered increases of 6.6% and 5.4%
respectively. The remaining months showed
comparatively moderate growth over the
period with increases ranging from 11.1% in
August to 16.5% in October.
Throughout the winter of 2015 (January-April),
stay-over arrivals totaled 223,015 (37.7%
share), representing 16.2% more than the
191,848 recorded in 2014. The summer season
recorded 368,857 arrivals (62.3% share) and
registered growth of 12.5% over the 327,787 of
2014 (see Pg. 12 Table 2).
Market Analysis
Figure 5 clearly shows that with the exception of
the Other European market, stay-over visitor
arrivals in 2015 outperformed those in 2014.
The U.K continued to dominate the overnight
visitor market with a total of 214,175 tourists; a
market share of 36.2% (Figure 6). The U.K
market recorded positive growth of 14.6%,
which was second to that of U.S.A. Stay-Over
arrivals from U.S.A totaled 148,067 tourists, up
by 24.9%, to record the highest level of growth
among visitor markets. This rate of growth was
impacted by increased arrivals in the months of
September (44%) and March (42.4%) (see Pg.12
Table 2). Growth in the tourist arrivals out of the
U.S.A market reflected an increased market
share to 25% from 22.8% in 2014 (Figure 6).
The U.S.A visitor market supplied a significantly larger
number of tourists in the year 2015
compared to 2014

7
Annual Report of Tourist Arrivals
Continued from page 6
Other CARICOM arrivals increased by 14.8% over 2014 to
58,321 visitor arrivals. Among these, the most significant
increases in arrivals were recorded by Bahamas (27.7%), St.
Lucia (21.5%), Grenada (21.5%) and Dominica (21.2%),
while declines were recorded among visitors from Anguilla
(16.9%), Haiti (12.5%) and Montserrat (2.1%). The
remaining CARICOM countries all showed positive growth
in the arrival of stay-over visitors ranging from 6.6% for
Jamaica to 19.5% for Antigua (see Pg.13 Table 3).
Canadian visitor arrivals grew over the period by 13.2%.
This improvement was influenced by strong growth
recorded in the winter season (January - April) of 2015,
which recorded 8,008 (or 26.8%) more visitors than in the
previous year.
As previously noted, in 2015 the Other European market
was the only one which recorded reduced levels of arrivals,
with a 12.9% fall when compared to 2014. As displayed in
Figure 6, this significant decline resulted in reduced market
share from 6.3% in 2014 to 4.8% in 2015. This decline in
arrivals from Other Europe was mainly driven by a 24.6%
decline during the winter season, led by the month of
March which fell by 28.8% (see Pg.12 Table 2).
Positive growth achieved
among stay-over arrivals in
each month of 2015.
Winter season stay-overs grew
by 31,167 (16.2%).
Summer season tourist arrivals
increased by 41,070 (12.5%).
The U.S.A market showed
significant improvement in the
supply of tourists (24.9%).
Stay-Over Arrivals from the
Other European visitor market
fell by 4,230 (12.9%).
2015/2014
Highlights

8
Annual Report of Tourist Arrivals
Purpose of Visit
Among total stay-over arrivals to Barbados in
2015, 486,344 visitors or 82.2% came for
Recreation, representing a 10.4% increase
when compared to 2014 (see Pg.11 Table 1). Of
these, positive growth occurred among
recreational arrivals that came to Visit friends
etc., (6%), on Holiday (11.1%), to Get Married/
Honeymoon (20.4%) and for Sports (19.9%).
While Other Recreation arrivals fell by 18.5%
(Figure 7).
The most significant growth level was clearly
achieved among visitors who travelled to
Barbados on business or to attend conferences,
which showed positive growth of 49.3% when
compared to 2014. Declines in arrivals were
recorded among visitors who came for
purposes of Other Recreation (18.5%), Other
(7.7%), Study (3.3%) and Health Care (0.8%).
Length of Stay
In 2015 the average intended length of stay
among total stay-over visitors was 11 days; this
was one day less than the 12 days spent on
average in 2014 (see Pg.14 Table 5).
From Figure 8 above, it is evident that the
average length of stay also fell among each of
the visitor producing markets. In 2015 the
average length of stay among visitors originating
from Other CARICOM (14 days), Canada (13
days), and the U.K (12 days) were higher than
the average for all visitors in the same year. This
trend was also true for 2014.
An assessment of the length of stay by
Nationality Status revealed that among stay-
over arrivals, non-resident Barbadian nationals
stayed (23 days in 2015 compared to 24 days in
2014) twice as long as visitors of foreign
nationality over the review period (Figure 9).

9
Annual Report of Tourist Arrivals
Cruise Passengers Arrivals
The 3.6% growth recorded among cruise passenger
arrivals in 2015 was largely driven by increased summer
arrivals which moved to 355,408 from 325,144 in
2014, recording a 9.2% increase over the period. Winter
cruise arrivals however fell by 1.6% to 355,992
compared to 361,686 in 2014 (see Pg.13 Table 3).
Throughout the review period, declines in cruise
passenger arrivals were registered in the months of
January, February, March, May and July by rates of 5%,
7.8%, 0.5%, 7.7% and 10% respectively (Figure 10).
The most significant growth among the remaining
months was recorded in June with a 34.7% increase in
cruise passenger arrivals when compared to 2014. The
performance was followed by November which grew at
a rate of 24.6% over the previous year.
The number of landed passengers also increased over
the review period to 124,785 in 2015, compared to
128,932 the previous year (see Pg.11 Table 1). These
increases may have been impacted by an additional 4
cruise liner calls, which were recorded over the review
period.
2015/2014
Highlights
82.2% of Stay-over visitors
came for recreation (10.4%).
Business or conference stay-
over arrivals grew significantly
(49.3%).
The average length of stay fell
to 11 days (1 day).
Non-resident Barbadian
visitors stayed twice as long as
foreign national arrivals.
Total cruise passenger arrivals
increased to 711,400 (3.6%).
Landed cruise passengers rose
to 124,785 (2.6%).
10
Annual Report of Tourist Arrivals
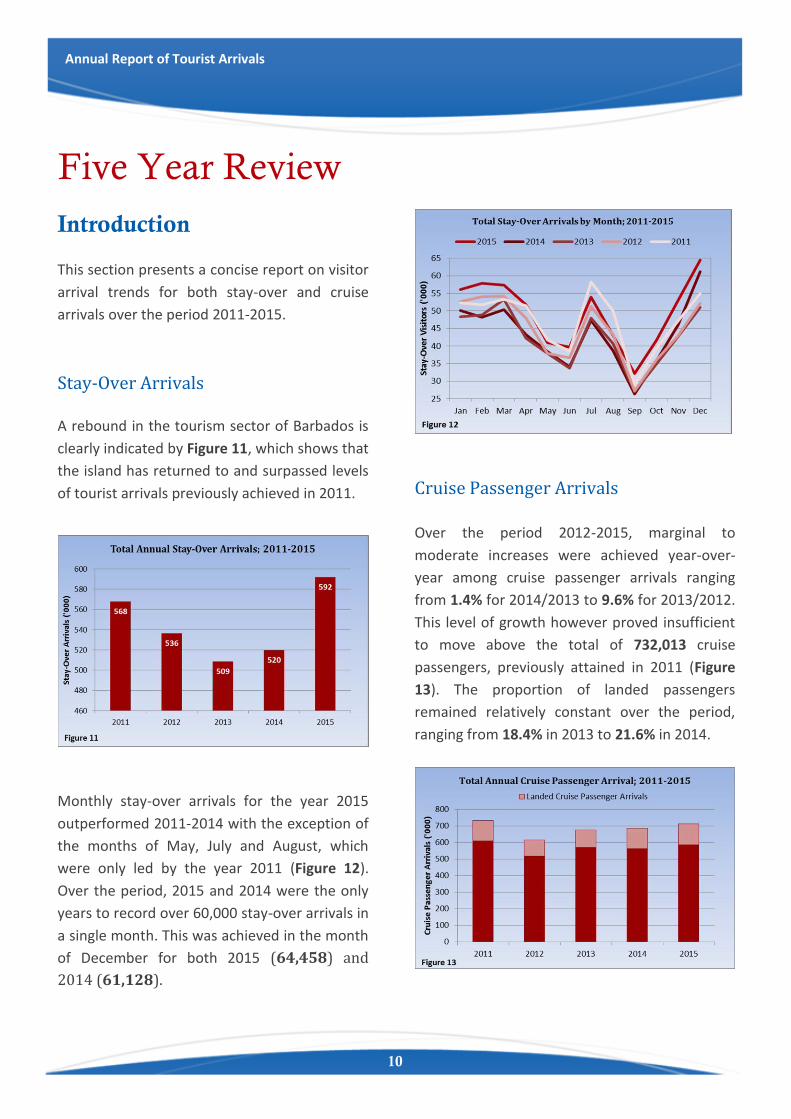
Cruise Passenger Arrivals
Over the period 2012-2015, marginal to
moderate increases were achieved year-over-
year among cruise passenger arrivals ranging
from 1.4% for 2014/2013 to 9.6% for 2013/2012.
This level of growth however proved insufficient
to move above the total of 732,013 cruise
passengers, previously attained in 2011 (Figure
13). The proportion of landed passengers
remained relatively constant over the period,
ranging from 18.4% in 2013 to 21.6% in 2014.
Five Year Review
Introduction
This section presents a concise report on visitor
arrival trends for both stay-over and cruise
arrivals over the period 2011-2015.
Stay-Over Arrivals
A rebound in the tourism sector of Barbados is
clearly indicated by Figure 11, which shows that
the island has returned to and surpassed levels
of tourist arrivals previously achieved in 2011.
Monthly stay-over arrivals for the year 2015
outperformed 2011-2014 with the exception of
the months of May, July and August, which
were only led by the year 2011 (Figure 12).
Over the period, 2015 and 2014 were the only
years to record over 60,000 stay-over arrivals in
a single month. This was achieved in the month
of December for both 2015 (64,458) and
2014 (61,128).

11
Annual Report of Tourist Arrivals
Appendix
Table 1
2014 2015
Total Vistor Arrivals 1,204,243 1,303,272 8.2
Stay-Over Vistor Arrivals 519,635 591,872 13.9Sex Males 248,123 281,516 13.5
Females 271,505 310,353 14.3Not Stated 7 3
Age Group 0-14 Years 41,174 43,071 4.615-44 Years 210,598 244,622 16.245-64 Years 197,545 225,137 14.065 Years and over 70,315 79,040 12.4Not Stated 3 2
Nationality Status Foreign Nationals 489,630 562,894 15.0Non-Resident Barbadians 30,005 28,978 -3.4
Visitor Market U.S.A 118,510 148,067 24.9Canada 65,813 74,494 13.2U.K 186,858 214,175 14.6Germany 11,992 12,338 2.9Other Europe 32,744 28,514 -12.9Trinidad & Tobago 27,915 29,659 6.2Other CARICOM 50,815 58,321 14.8Other Countries 24,988 26,304 5.3
Purpose of Visit Intransit 9,260 9,953 7.5Study 4,594 4,441 -3.3Health Care 1,469 1,457 -0.8Recreation 440,473 486,344 10.4
Holiday 395,402 439,139 11.1Visiting Friends etc 23,174 24,561 6.0Honeymoon/Get Married 5,843 7,037 20.4Sports 6,560 7,865 19.9Other Recreation 9,494 7,742 -18.5
Business/Conference 53,951 80,549 49.3Other 9,888 9,128 -7.7
Cruise Liner ArrivalsTotal Cruise Passengers 684,608 711,400 3.9
Landed Passengers 121,578 124,785 2.6
Cruise Liner Calls 391 395 1.0
Summary Of Main Indicators
2015/2014
Growth (%)

12
Annual Report of Tourist Arrivals
Table 2
Year Month U.S.A Canada U.K GermanyOther
Europe
Trinidad
& Tobago
Other
CARICOM
Other
Countries
ALL
Countries
January 10,783 10,595 20,994 1,732 3,856 1,538 4,364 2,263 56,125
February 12,571 10,772 21,940 1,628 3,318 1,842 3,688 2,030 57,789
March 14,097 9,564 20,768 1,850 2,597 1,995 4,443 2,071 57,385
April 13,043 6,917 19,699 691 1,835 2,368 4,849 2,314 51,716
Winter 50,494 37,848 83,401 5,901 11,606 7,743 17,344 8,678 223,015
May 10,748 4,334 14,285 547 1,550 2,613 4,863 2,053 40,993
June 12,518 3,302 11,977 509 1,561 2,325 4,870 2,625 39,687
July 17,627 4,190 16,244 428 1,947 4,011 6,756 2,761 53,964
August 12,422 3,399 13,128 587 1,789 3,580 6,098 1,924 42,927
September 8,026 2,483 11,707 444 1,125 2,243 4,384 1,741 32,153
October 9,520 4,600 15,968 541 1,787 2,409 4,989 1,874 41,688
November 11,461 5,880 22,591 1,625 2,714 2,254 4,471 1,991 52,987
December 15,251 8,458 24,874 1,756 4,435 2,481 4,546 2,657 64,458
Summer 97,573 36,646 130,774 6,437 16,908 21,916 40,977 17,626 368,857
Total 148,067 74,494 214,175 12,338 28,514 29,659 58,321 26,304 591,872
Year Month U.S.A Canada U.K GermanyOther
Europe
Trinidad
& Tobago
Other
CARICOM
Other
Countries
ALL
Countries
January 9,498 8,348 18,134 1,403 5,097 1,724 3,894 2,024 50,122
February 9,883 7,942 18,525 1,264 4,323 1,452 3,181 1,573 48,143
March 9,899 7,804 19,450 1,540 3,634 2,307 3,588 2,099 50,321
April 9,623 5,746 15,449 1,072 2,340 2,913 4,135 1,984 43,262
Winter 38,903 29,840 71,558 5,279 15,394 8,396 14,798 7,680 191,848
May 9,518 4,197 13,486 522 1,684 2,505 4,483 2,042 38,437
June 10,295 2,945 10,538 437 1,539 2,364 4,231 1,781 34,130
July 13,590 4,099 14,902 434 1,952 3,436 6,353 2,548 47,314
August 9,354 3,244 12,736 477 1,748 3,826 5,148 2,122 38,655
September 5,575 2,369 9,501 564 1,070 1,711 3,823 1,716 26,329
October 7,222 3,842 14,319 593 1,730 1,863 4,143 2,080 35,792
November 9,593 5,500 18,506 1,866 2,877 1,588 3,714 2,358 46,002
December 14,460 9,777 21,312 1,820 4,750 2,226 4,122 2,661 61,128
Summer 79,607 35,973 115,300 6,713 17,350 19,519 36,017 17,308 327,787
Total 118,510 65,813 186,858 11,992 32,744 27,915 50,815 24,988 519,635
Yr/Yr Month U.S.A Canada U.K GermanyOther
Europe
Trinidad
& Tobago
Other
CARICOM
Other
Countries
ALL
Countries
January 13.5 26.9 15.8 23.4 -24.3 -10.8 12.1 11.8 12.0
February 27.2 35.6 18.4 28.8 -23.2 26.9 15.9 29.1 20.0
March 42.4 22.6 6.8 20.1 -28.5 -13.5 23.8 -1.3 14.0
April 35.5 20.4 27.5 -35.5 -21.6 -18.7 17.3 16.6 19.5
Winter 29.8 26.8 16.6 11.8 -24.6 -7.8 17.2 13.0 16.2
May 12.9 3.3 5.9 4.8 -8.0 4.3 8.5 0.5 6.6
June 21.6 12.1 13.7 16.5 1.4 -1.6 15.1 47.4 16.3
July 29.7 2.2 9.0 -1.4 -0.3 16.7 6.3 8.4 14.1
August 32.8 4.8 3.1 23.1 2.3 -6.4 18.5 -9.3 11.1
September 44.0 4.8 23.2 -21.3 5.1 31.1 14.7 1.5 22.1
October 31.8 19.7 11.5 -8.8 3.3 29.3 20.4 -9.9 16.5
November 19.5 6.9 22.1 -12.9 -5.7 41.9 20.4 -15.6 15.2
December 5.5 -13.5 16.7 -3.5 -6.6 11.5 10.3 -0.2 5.4
Summer 22.6 1.9 13.4 -4.1 -2.5 12.3 13.8 1.8 12.5
Total 24.9 13.2 14.6 2.9 -12.9 6.2 14.8 5.3 13.9
20
14
20
15
20
15
/20
14
Gro
wth
(%
)
Total Stay-Over Arrivals by Month of Arrival

13
Annual Report of Tourist Arrivals
Table 3
CARICOM States 2014 20152015/2014
Growth (%)Trinidad & Tobago 27,915 29,659 6.2Other CARICOM 50,815 58,321 14.8
Anguilla 296 246 -16.9Antigua 3,922 4,687 19.5Bahamas 957 1,222 27.7Belize 470 546 16.2Dominica 4,069 4,930 21.2Grenada 4,101 4,984 21.5Guyana 9,842 11,150 13.3Haiti 224 196 -12.5Jamaica 7,367 7,855 6.6Montserrat 194 190 -2.1St Kitts & Nevis 2,780 3,063 10.2St Lucia 7,157 8,697 21.5St Vincent & the Gren. 8,965 10,026 11.8Suriname 471 529 12.3
Total CARICOM 78,730 87,980 11.7
Table 4
Month 2014 20152015/2014
Growth (%)January 5,618 5,902 5.1February 4,633 5,530 19.4March 5,895 6,438 9.2April 7,048 7,217 2.4May 6,988 7,476 7.0June 6,595 7,195 9.1July 9,789 10,767 10.0August 8,974 9,678 7.8September 5,534 6,627 19.8October 6,006 7,398 23.2November 5,302 6,725 26.8December 6,348 7,027 10.7
Total 78,730 87,980 11.7
Total Stay-Over Arrivals from CARICOM Market by Country
Total Stay-Over Arrivals from CARICOM Market
by Month of Arrival

14
Annual Report of Tourist Arrivals
Table 5
2014 2015
Total Stay-over Arrivals 11.97 11.19
Age Group 0-14 Years 12.64 12.26
15-44 Years 10.99 10.03
45-64 Years 10.72 10.12
65+ Years 18.02 17.26
Nationality Status Foreign Nationals 11.22 10.58
Non-Resident Barbadians 24.16 23.17
Visitor Market U.S.A 10.66 9.63
Canada 13.72 12.84
U.K 12.33 11.67
Germany 10.3 9.2
Other Europe 11.33 11.15
Trinidad & Tobago 10.33 9.75
Other CARICOM 14.38 13.73
Other Countries 9.44 8.5
Month January 15.2 14.06
February 11.07 10.15
March 10.36 9.69
April 10.31 9.56
May 10.43 9.99
June 11.48 10.43
July 13.25 12.47
August 12.87 12.48
September 12.79 10.85
October 11.3 10.4
November 11.11 10.98
December 12.9 12.47
Season Winter 11.79 10.88
Summer 12.02 11.39
Average Length of Stay for Stay-Over Arrivals

15
Annual Report of Tourist Arrivals
Table 6
Month 2014 20152015/2014
Growth (%)
January 111,474 105,907 -5.0
February 100,678 92,799 -7.8
March 90,861 90,367 -0.5
April 58,673 66,919 14.1
Winter 361,686 355,992 -1.6
May 25,511 23,554 -7.7
June 18,219 24,543 34.7
July 28,059 25,247 -10.0
August 18,879 21,614 14.5
September 21,912 23,455 7.0
October 31,827 36,169 13.6
November 74,830 93,210 24.6
December 103,685 107,616 3.8
Summer 322,922 355,408 10.1
Total 684,608 711,400 3.9
Table 7
Month 2014 20152015/2014
Growth (%)
January 27,530 27,668 0.5
February 22,811 24,518 7.5
March 21,528 19,748 -8.3
April 5,468 3,294 -39.8
Winter 77,337 75,228 -2.7
May 897 631 -29.7
June 779 604 -22.5
July 674 662 -1.8
August 610 614 0.7
September 654 518 -20.8
October 831 543 -34.7
November 19,482 20,772 6.6
December 20,314 25,213 24.1
Summer 44,241 49,557 12.0
Total 121,578 124,785 2.6
Total Cruise Passenger Arrivals by Month of Arrival
Total Landed Cruise Passenger Arrivals by Month of Arrival

16
Annual Report of Tourist Arrivals
Table 8
Month 2011 2012 2013 2014 2015 2011-2015
January 52,194 52,619 48,288 50,122 56,125
February 51,793 54,056 48,870 48,143 57,789
March 53,257 54,164 53,304 50,321 57,385
April 51,442 47,979 42,234 43,262 51,716
Winter 208,686 208,818 192,696 191,848 223,015
May 41,699 37,935 37,906 38,437 40,993
June 38,490 36,656 33,691 34,130 39,687
July 58,237 51,253 47,935 47,314 53,964
August 49,961 43,191 40,667 38,655 42,927
September 29,144 27,230 26,970 26,329 32,153
October 39,358 36,071 34,938 35,792 41,688
November 47,208 42,975 42,690 46,002 52,987
December 54,941 52,174 51,027 61,128 64,458
Summer 359,038 327,485 315,824 327,787 368,857
Total 567,724 536,303 508,520 519,635 591,872
Monthly Stay-Over Visitor Arrivals by Year
Table 9
Month 2011 2012 2013 2014 2015 2011-2015
Intransit 25,072 10,881 11,861 9,260 9,953
Study 5,213 5,493 4,888 4,594 4,441
Health Care 1,595 1,482 1,489 1,469 1,457
Recreation 464,018 451,377 427,048 440,473 486,344
Holiday 409,602 400,736 382,536 395,402 439,139
Visiting Friends etc. 30,762 27,915 25,125 23,174 24,561
Honeymoon/Get Married 9,497 8,612 6,810 5,843 7,037
Sports 9,188 6,845 5,960 6,560 7,865
Other Recreation 4,969 7,269 6,617 9,494 7,742
Business/Conference 59,026 56,382 52,867 53,951 80,549
Other 14,196 10,768 10,361 9,888 9,128
Total 569,120 536,383 508,514 519,635 591,872
Annual Stay-Over Arrivals by Purpose of Visit; 2011-2015

17
Annual Report of Tourist Arrivals
Table 10
Month 2011 2012 2013 2014 2015 2011-2015
January 84,607 81,412 93,132 111,474 105,907
February 82,757 77,447 74,833 100,678 92,799
March 81,081 75,956 82,926 90,861 90,367
April 90,532 51,067 45,817 58,673 66,919
Winter 338,977 285,882 296,708 361,686 355,992
May 16,073 16,853 19,983 25,511 23,554
June 21,701 13,038 18,658 18,219 24,543
July 18,056 13,256 24,868 28,059 25,247
August 22,334 15,895 21,170 18,879 21,614
September 15,755 11,781 19,182 21,912 23,455
October 21,557 25,726 26,433 31,827 36,169
November 71,887 60,015 63,997 74,830 93,210
December 83,504 74,990 79,264 103,685 107,616
Summer 270,867 231,554 273,555 322,922 355,408
Total 609,844 517,436 570,263 684,608 711,400
Table 11
Month 2011 2012 2013 2014 2015 2011-2015
January 24,550 24,020 19,395 27,530 27,668
February 24,601 21,877 22,488 22,811 24,518
March 20,824 19,446 18,475 21,528 19,748
April 7,439 4,827 3,954 5,468 3,294
Winter 77,414 70,170 64,312 77,337 75,228
May 1,668 598 681 897 631
June 809 472 558 779 604
July 615 834 749 674 662
August 1,196 448 646 610 614
September 848 494 614 654 518
October 1,233 641 774 831 543
November 16,720 9,486 16,402 19,482 20,772
December 21,666 15,389 20,227 20,314 25,213
Summer 44,755 28,362 40,651 44,241 49,557
Total 122,169 98,532 104,963 121,578 124,785
Monthly Total Cruise Passenger Arrivals by Year
Monthly Landed Cruise Passenger Arrivals by Year

The Barbados Statistical Service
wishes to acknowledge and
extend much appreciation to its
staff members who assisted
with the data collection and
compilation for this report, as
well as the staff of the
Immigration Department for
their continued support.
2015/2014