forecasting human capital - education policy data center · forecasting human capital ... methods...
TRANSCRIPT

Forecasting Human CapitalUsing Demographic Multi-State Methods by Age, Sex, and Education to Show the Long-Term Effects of Investments in Education By Wolfgang Lutz, Anne Goujon, Annababette Wils
WP-07-03
EDUCATION POLICY AND DATA CENTERMaking sense of data to improve education
Arushi TerwayBrian DooleyAnne Smiley
Access to education and patterns of non-attendance
MOST VULNERABLE CHILDREN IN
In 2011, FHI acquired the programs, assets, and expertise of AED.

Forecasting Human Capital Using Demographic Multi-State Methods by Age, Sex, and Education to Show the Long-Term Effects of Investments in Education Working Paper WP-07-03
Wolfgang Lutz Anne GoujonAnnababette Wils
July 2005
Working Papers disseminated by the EPDC reflect ongoing research and have received limited review. Views or opinions expressed herein do not necessarily reflect the policy or views of the EPDC, of FHI 360 , or any of the EPDC sponsors.
ii

Recommended Citation Lutz, Wolfgang; Goujon, Anne; Wils, Annababette, 2005. Forecasting Human Capital: Using Demographic Multi-State Methods by Age, Sex, and Education to Show the Long-Term Effects of Investments in Education. Working Paper WP-07-03. Education Policy and Data Center, Washington, DC (Academy for Educational Development).
EPDC The Education Policy and Data Center (EPDC) was launched in 2004 by the Academy for Educational Development, with funding from the U.S. Agency for International Development, as an associate award under the Education Quality Improvement Program 2: Policy, Systems, Management (EQUIP2), to increase the breadth and depth of information easily accessible to researchers and practitioners in international education.
iii

Abstract
This paper argues that forecasting human capital is important for several reasons and that the most appropriate methods for doing so are demographic, multi-state population projections. Under this method the population of a country or region is cross-classified by age (typically five-year or single-year age groups), sex, and different categories (states) of educational attainment. The population is projected into the future based on assumed education-specific fertility, mortality, and migration rates as well as age- and sex-specific transition rates from one educational status into another. This implies, e.g., that the fertility of the total population changes as a consequence of the changing educational composition of the female population of reproductive age. This explicit consideration of such dynamic features makes this method more appropriate for the projection of human capital than other methods previously suggested. Such multi-state models can also be applied to the detailed analysis of education flows, modeling intake and enrolment, as well as completion rates. The paper demonstrates the feasibility of the method through three detailed education projection studies for the priority countries Guinea, Nicaragua, and Zambia. It shows that for most developing countries, the data required for this approach are readily available and that the method is fairly easy to use. To apply this method to projections of educational attainment by age and sex for most countries in the world is hence clearly feasible. Such projections can be very useful for demonstrating the long-term effects on human capital of near-term investments in education.
iv

Table of Contents
ABOUT THE AUTHORS ........................................................................... ix
1. INTRODUCTION.................................................................................... 1
2. WHY IS IT IMPORTANT TO FORECAST EDUCATION AND HUMAN CAPITAL? .................................................................................... 2
2.1. Education matters ................................................................................................. 2
2.2. Forecasts make a difference ................................................................................. 3
2.3. What to project? Mean years of schooling versus educational attainment........... 5
3. METHODS FOR FORECASTING THE EDUCATIONAL COMPOSITION OF THE POPULATION .................................................. 7
3.1. Past efforts ............................................................................................................ 7
3.2. Demographic multi-state projection methods ...................................................... 9
3.3. Education projections for thirteen world regions ............................................... 12
4. MULTI-STATE EDUCATION PROJECTIONS FOR GUINEA, NICARAGUA, AND ZAMBIA ................................................................. 14
4.1. Introduction ........................................................................................................ 14
4.2. Initial conditions for projections......................................................................... 15
4.2.1. Base year population size and education ........................................................ 15
4.2.2. Base year fertility rates ................................................................................... 17
4.2.3. Base year mortality rates................................................................................. 18
4.2.4. Base year migration rates ............................................................................... 19
4.2.5. Base year education transitions ...................................................................... 19
4.3. Scenarios............................................................................................................. 21
4.4. Education scenarios ............................................................................................ 22
4.5. Country-specific results...................................................................................... 25
4.5.1. Attainment of MDG goals................................................................................ 27
4.5.2. Education and the demographic window of opportunity ................................ 27
5. THE POLICY DIMENSION AND THE CROSS-BENEFITS OF IMPROVEMENTS IN EDUCATION........................................................ 28
5.1. Alternative paths to improving educational attainment...................................... 28
5.2. The impact of raising intake versus raising primary completion ....................... 31
5.3. The potential for sub-national forecasts by level of education........................... 33
v

5.4. Cross-sectoral benefits of improved education .................................................. 34
5.4.1. How many children could be saved? ............................................................... 34
5.4.2. How do the education scenarios affect fertility? ............................................. 35
6. CONCLUSIONS AND OUTLOOK...................................................... 36
REFERENCES............................................................................................ 38
APPENDIX ................................................................................................. 42
vi

Tables Table 1: Definition of the levels of education by country.
Table 2: Educational attainment for four broad age groups by country.
Table 3: Real and estimated total fertility rates by education and country in 2000-2005.
Table 4: Under-five mortality rates (5q0) per 1,000 live births by mother’s level of education by country.
Table 5: Estimated life expectancy at birth by sex, education and country in 2000-05.
Table 6: Initial education transitions in 2000-2005 (proportions moving from one educational category to the next) by age, sex, and country.
Table 7: Demographic assumptions by country.
Table 8: Final education transitions in 2025-2030 by scenario (white: Constant; light gray: Trend; dark gray: MDG) by age, sex, and country.
Table 9: Intake rates and average primary promotion rates in 2000 and 2020 to reproduce the stylized Constant, Trend, and MDG scenarios by country.
Table 10: Children dying at ages 0-4 as projected under the different scenarios (proportion and absolute change between selected scenarios) by country.
Table 11: Total fertility rates by country and scenario illustrating the impact of the different educational composition on the fertility in the total population.
Figures Figure 1: Age pyramid by level of formal education for Singapore in 2000.
Figure 2: Principles of regular population projection by age and sex.
Figure 3: Principles of population projection by age, sex, and education.
Figure 4: Specifying the educational transition rates in the multi state projection model.
Figure 5: Population aged 20 to 65 years (in millions) by levels of education, according to the ICPD scenario for four mega-regions, 2000-2030.
Figure 6: Population pyramids (in thousands) with educational attainment in Guinea (1999), Zambia (2002), and Nicaragua (2001).
vii

Figure 7: Past and assumed future trends for primary and secondary educational attainment in Zambia by birth cohort.
Figure 8: Population of Guinea, Nicaragua, and Zambia aged 15-64 by level of education, 2000-2030, according to the Constant, Trend, and MDG scenarios.
Figure 9: Dependency ratio by country, 2000-2030, Trend scenario (ratio of population aged 0-14 and 65+ per 1,000 population aged 15-64).
Figure 10: Net enrolment rates (NER) at the primary and secondary levels, and proportion of adults aged 15-64 with no schooling and with secondary schooling for Nicaragua, 2000-2030, for the Constant, MDG-Intake, and MDG-Completion scenarios.
viii

ABOUT THE AUTHORS Wolfgang Lutz is the Leader of the World Population Program at IIASA and Director of the Vienna Institute of Demography of the Austrian Academy of Sciences.
Anne Goujon is a Researcher at the Vienna Institute of Demography of the Austrian Academy of Sciences, and a part-time Research Scholar in the World Population Program at IIASA.
Annababette Wils is a Senior Technical Advisor at the Education Policy and Data Center of the Academy for Educational Development in Washington, D.C., and a long time collaborator and former staff member with the World Population Program at IIASA.
ix

Forecasting Human Capital Using Demographic Multi-State Methods by Age, Sex, and Education to Show the Long-Term Effects of Investments in Education
1. INTRODUCTION
Education is an essential part of the human condition. The original meaning of the word refers to people (typically young people) being guided into an informed stage in which they can exert independent judgment based on the combination of different skills and pieces of information. This is an important prerequisite for mastering all kinds of challenges for daily life and for improving the human condition both at the individual as well as at the societal level.
When studying education trends at the macro-level of society, it is essential to
distinguish between stocks and flows. In this paper, we use the following terminology: Education is the process (flow) through which people gain skills and knowledge. The stock of educated people with such skills and knowledge is referred to as human capital. Under this definition, education as measured by enrolment or completion rates contributes to the accumulation of human capital stock, which is measured by the educational attainment of the adult population. There is an important time lag: Today’s human capital stock is a result of education over the past decades. Since education is mostly attained at a young age, changes in the human capital of the adult population have a huge momentum. Current education efforts – to the extent they are directed largely at young people - only influence it at the margin. In this paper we will show that these effects of specific near-term education efforts on longer-term changes in human capital can be accurately and comprehensively described and under certain assumptions predicted, using demographic methods.
In this paper we study only formal education. Every human society has
developed systems to educate their young members. These systems differ widely across cultures in terms of methods, content, and duration of education. Focusing on formal education does not imply that more informal learning processes are unimportant. Learning processes before school, parallel to school, and after finishing school can be highly important, but it is difficult to get internationally consistent empirical information about this. And even in the restricted context of formal education it is very difficult to categorize and quantify the multi-dimensional issue of content and quality of education. It is easier to try to simply measure the length of education, because here one can refer to a universal metric, namely, the years spent in formal education. Another closely related but not identical metric refers to international standards of primary, secondary, and tertiary education, and looks at the highest level of education that has been completed. In this paper we discuss both ways of quantitatively describing the
1

extent of education, average years of schooling and highest completed education. In our education forecasts we mostly refer to the latter, because it allows us to better study the educational distribution across the population, rather than just studying one average number for the entire population.
When applying this methodology to sets of countries, one must remember that
the quality of education at formally comparable levels can differ greatly from one country to another. But since there is very little systematic quantitative information on the quality of education available, little can be done to correct these differences at this stage. The situation may improve, however, once new efforts for directly measuring literacy skills and other education-related competences e.g. the LAMP initiative, the International Adult Literacy Survey (IALS)1, provide representative data for the entire adult population in many developing countries.
We will begin by discussing why it is important to forecast education and human
capital. Next, we discuss the demographic multi-state method that is the appropriate tool for doing so. Then we present illustrative applications to three high priority countries: Guinea, Nicaragua, and Zambia. These include distinct discussions of the starting conditions and definition of alternative future enrolment scenarios, presentation of results, and the benefits of better education with respect to other Millennium Development Goals (MDGs),2 in particular child mortality. The paper will conclude with a recommendation for next steps.
2. WHY IS IT IMPORTANT TO FORECAST EDUCATION AND HUMAN CAPITAL?
Forecasting education will be considered an important task if (1) the educational composition of the population is assumed to matter, and (2) some significant benefits are to be gained by studying not only the past and current educational structure, but also the future educational structure. These are two separate questions that will be addressed sequentially.
2.1. Education matters
In this paper we will not attempt to reassess the huge body of literature that exists on the relevance of education, both at the micro and macro level, for example: on education and development (Sen 1999), on education and fertility (Bledsoe et al. 1999), on education and mortality (Alachkar and Serow 1988), on education and economic
1 The International Adult Literacy Survey has been conducted in over 30 countries and is managed by Statistics Canada, the OECD, UNESCO and Eurostat see Murray et.al.; LAMPS is a UIS initiative to measure adult literacy in developing countries.
2 A framework of eight goals, 18 targets, and 48 indicators to measure progress towards the Millennium Development Goals has been adopted by a consensus of experts from the United Nations Secretariat, the International Monetary Fund, the Organization for Economic Co-operation and Development (OECD) and the World Bank. To see the full list of goals, targets, and indicators, visit the UN Statistical Division website: http://millenniumindicators.un.org/unsd/mi/mi_goals.asp.
2

growth (Haddad et al. 1990; Barro and Sala-I-Martìn 1995), on returns to investment in education (Psacharopoulos and Patrinos 2002). It has also been argued that education lowers the risk of conflict (Collier and Hoeffler 2000). In short, there seems to be overwhelming evidence that on the individual level, investments in education have many positive consequences, ranging from higher lifetime income to individual empowerment, and greater social participation to better health and longevity of the educated persons and their families.
On the macro level, the literature is less uniform. Particularly with respect to
gross domestic product (GDP) growth rates, regressions on cross-sectional data sets seem to show different results largely depending on the model specification and especially on the educational indicator used (for an excellent review of former studies see Coulombe et al. 2004; see also Cohen and Soto 2001; De la Fuente and Doménech 2000). A closer reading of the literature shows that in earlier studies, the chosen indicators of educational attainment at the macro level were often very crude and further improvements are clearly possible. Only recently, using the internationally comparable literacy scores from the IALS studies rather than years of schooling, Coulombe et.al. showed clear impacts of investment in human capital on economic growth. For the human capital stock, this study used the total average in the whole population. But using only the average of human capital stock is highly unsatisfactory, if one makes the plausible assumption that, for instance, the educational composition of people aged 25-35 is more relevant for economic growth than that of people aged 65-75. A more specific empirical analysis of the relative importance of education in different age groups can only be made if age-specific education information for the past decades becomes available in time-series form for many countries, a reconstruction task currently being carried out by IIASA.
Since the dynamics of change in the different age-specific human capital
indicators follow very different patterns, as will be shown below, it is problematic to pool them together in one indicator covering all age-groups. We will not perform such new regressions of age-specific education attainment on economic growth in this paper, we will help to prepare the ground for better age-specific indicators of human capital that will subsequently allow for the calculation of models with more age precision.3 More demographic precision in the form of age-specific information can provide a more appropriate picture; this paper will demonstrate that such age-specific information is available in existing datasets, and can be meaningfully forecasted into the future.
2.2. Forecasts make a difference
Assuming that the extent of formal educational attainment is a relevant characteristic for both individuals and societies, we still have to address the question,
3 It should be noted that a similar problem of lacking age detail applies to the very aggregate
indicator of life expectancy that is frequently used in regressions aimed at explaining economic growth. Demographic analysis shows that depending on the level of life expectancy, improvements in this indicator either result from a decline in child mortality or from declines in old age mortality. These are two very different phenomena when it comes to assessing their possible effects on personal investment strategies and consequently economic growth.
3

what is to be gained from trying to forecast education and human capital? Here we distinguish between four functions of forecasting: a) planning, b) orientation, c) realistic target setting, and d) motivation for near-term investments that only produce long-term benefits.
a) In terms of specific government planning in the field of education, the time horizon
tends to be relatively short (not longer than 5-10 years). In this context the forecasting of the student and teacher populations is more relevant than the changing educational composition of the general adult population. Planners need to know where scarce resources should be allocated, e.g., in a process of planned rapid educational expansion in pursuit of the MDG education goals. In countries with still rapidly growing numbers of children (which even under declining fertility rates come as a result of the population momentum caused by increasing numbers of potential mothers), improvements of enrolment rates are a challenge both in terms of recruiting and training the teachers as well as in expanding the infrastructure, including school buildings. Decisions about whether to invest in adult literacy programs, or accelerated bridge programs, can be informed by such forecasts. Since the forecasts are based on the highest grade attained, accelerated courses to reinsert students (such as is done in India) should have demonstrable cost benefits, assuming children can be given grade-equivalent skills. Detailed forecasts of the school population by single-year grades (considering repetition rates), which are based on alternative scenario assumptions that also consider infrastructure and teacher training, can give important guidance for the specific planning of resource allocation for educational expansion under changing demographic conditions.
b) On the aggregate level, the expected changing educational composition of the total
population gives important guidelines for strategic orientation and longer-term planning. The longer-term human capital outlook is an important part in thinking about a country’s future or even changing geopolitical balances. For instance, the likely fact that over the next two decades the China region alone will have more working-age people with secondary and tertiary education than all of Europe and North America taken together (see Lutz and Goujon 2001) will have important implications for long-term economic, geopolitical, and strategic planning. It can also be informative to compare the longer-term human capital potentials of different countries in a similar way, as it turned out to be useful to compare the trends in the United Nations Development Programme (UNDP) Human Development Index (HDI). The structure of the population by age, sex, and education could also be related to other pertinent indicators, such as the “general entrepreneurship monitor” which helps predict the effect of business start-ups in a country. These are just a few examples of the wide array of issues for which the future human capital is assumed to matter.
c) Target setting has become a prominent feature of education strategies. But such
targets do not always reflect the fact that changes in the educational composition of the population have great momentum and improvements cannot take place over night, even in the case of strong political will and good funding. With the rare exception of adult literacy campaigns and on-the-job training programs, education takes place at young ages; it takes decades until the improved education of the young
4

translates into significant improvements for the total adult population. Since this momentum follows strict demographic regularities, it can be precisely quantified using demographic methods. But many politically-driven educational targets in the past have not reflected knowledge about this momentum and were sometimes not only unrealistic but simply unachievable. For example, in a series of global conferences during the 1990s, the goal of halving female illiteracy was officially proclaimed (with changing target years, but most recently 2015). But the education projections by Lutz and Goujon (2001) clearly demonstrate that even under the most optimistic scenario, improved literacy of the young people does not reach this goal until around 2030 because of the persistence of illiteracy among the elderly. But even more, after 2030 the goal would automatically be achieved at current enrolment rates (i.e., without further efforts) because the elderly illiterate will die off and the more educated younger ones will take their place. Hence, an educational goal that is not achievable for the stated time horizon but later on will be achieved without any change to current enrolment rates can safely be called an inappropriate goal. Models of education projection that explicitly quantify the dynamics of change along cohort lines can help to produce more appropriate targets.
d) In the short run investments in education are only a cost and do not produce a
measurable benefit. Hence, government policies aimed at budget consolidation – as has been the case with many so-called structural adjustment programs – may be tempted to simply cut these “unproductive” educational expenses in order to reduce the current budget deficits. Under a less shortsighted perspective, however, such cuts in education will be seen as detrimental, and curbing a country’s human capital development may appear as irresponsible. In this context, education projections that clearly demonstrate quantitatively – and also visually in the form of the educational age pyramids – how short-term improvements in enrolment translate into longer-term improvements of the educational composition of the adult population, can serve a powerful role in convincing governments that indeed the return to their investments will come, but with a significant lag.
In summary, there seem to be many good reasons for forecasting education and
human capital. But whether or not they will be done on a larger scale depends on the availability of an appropriate methodology, sufficient empirical data, and the institutions and funding to carry out such an effort.
2.3. What to project? Mean years of schooling versus educational attainment
Before discussing the demographic multi-state methods that will be used in this paper, it is worth discussing the two most often used quantitative indicators of human capital, comparing their strengths and weaknesses. Mean years of schooling is a frequently used indicator of the human capital stock of a given population in a given year. This indicator can also be measured for separate age groups. Empirically, the data on mean years of schooling typically come from censuses and surveys. Since many of these sources do not directly ask for the number of years a person has attended school, but rather ask for the highest education that the person has completed, this information often needs to be converted into years of schooling by assuming average study times for certain educational attainments. Also the issue of repetition rates, which tend to be very
5
high in several developing countries, makes the direct measurement and interpretation of mean years of schooling complicated.
An obvious advantage of mean years of schooling as an indicator of human
capital stock is that it comes in the form of a single number that can be easily compared and is easy to pluck into regression equations. Its disadvantage is that as an average, it hides the underlying distribution, which in the case of education may be very important. Two countries that have the same number of mean years of schooling of its adult population may have very different educational attainment distributions – one with small, highly educated elites amidst an uneducated majority, and another where broad segments of the population have intermediate education levels. The consequences of these two different education regimes on poverty and economic growth as well as on health and mortality may be very significant. The important policy debate about the best mix of efforts for primary, secondary, or tertiary education can only be informed by studies that explicitly consider these different categories. For this reason we decided to use the full distribution of educational attainment by age and sex (typically using four categories). This has the further advantage of being closer to the original data (where the questions are mostly in terms of different categories) and avoiding the problem of grade repetition (if somebody has completed secondary education, this is measured irrespective of the number of years it took him/her to do this).
0.0 50.0 100.0 150.0 200.0
2000
1995
1990
1985
1980
1975
1970
1965
1960
1955
1950
1945
1940
1935
1930
1925
1920
1915
1910
1905
1900
No education Primary Secondary Higher
females
0.050.0100.0150.0200.0
0
5
10
15
20
25
30
35
40
45
50
55
60
65
70
75
80
85
90
95
100
males
g p
Population (thousands)
Age Period of Birth
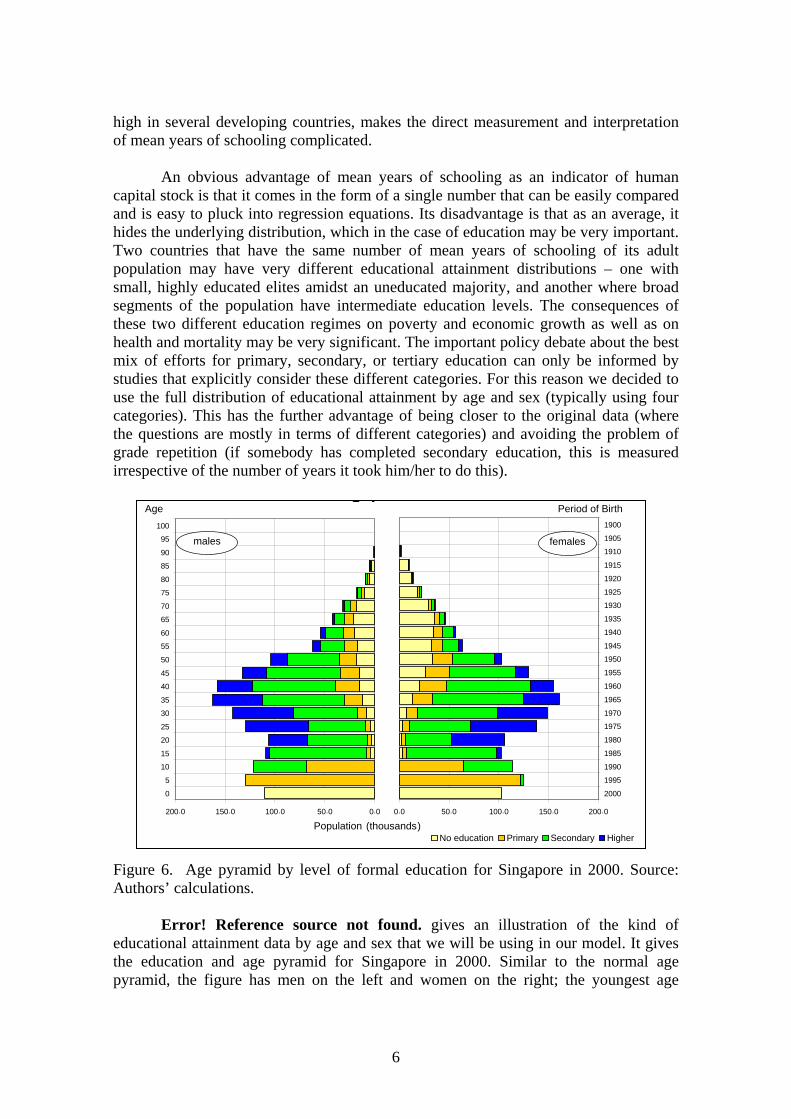
Figure 6. Age pyramid by level of formal education for Singapore in 2000. Source: Authors’ calculations.
Error! Reference source not found. gives an illustration of the kind of
educational attainment data by age and sex that we will be using in our model. It gives the education and age pyramid for Singapore in 2000. Similar to the normal age pyramid, the figure has men on the left and women on the right; the youngest age
6

groups are at the bottom and the oldest at the top. Four levels of education are indicated: No formal education, primary, secondary, and higher education (equivalent to tertiary education).
Singapore is likely to be a record holder in terms of the speed of educational expansion over the past decades. Its past history is still clearly visible from the figure. It shows that of all women born before 1945, more than half had no formal education. They are still alive and now aged 60 and above. But of all young women aged 20-25 today, more than half have already had some tertiary education, which is among the highest in the world. Hence, within only one generation, Singapore’s education system moved from that of a poor developing country to that of a highly advanced society. A comparison of the educational profile of the different age groups clearly shows the history of educational improvement, where the expansion of primary education was soon followed by a rapid expansion of secondary education with the rise of tertiary education being a more recent phenomenon.
While the empirical distribution of the level of education by age and sex,
particularly if the information is available for several points in time, can already be used for an important analysis of the consequences of the changes in the educational composition, the task at hand is to project such complete age pyramids by level of education into the future.
3. METHODS FOR FORECASTING THE EDUCATIONAL COMPOSITION OF THE POPULATION 3.1. Past efforts
The increasing awareness over the past decade of the importance of human capital in development has stimulated several attempts to estimate and project the educational composition of the population. Most empirical studies, however, tend to approximate educational stocks only in terms of cumulated enrolment ratios or illiteracy rates (Mankiw et al. 1992; Romer 1989). What is needed is a complete matrix of the composition of the population by age, sex, and different levels of educational attainment for different points in time. Many attempts to measure human capital stock have failed to meet this aspiration due to problems with data on the level of individual countries and due to the lack of appropriate methodologies (Ahuja and Filmer 1995; Barro and Lee 1993; Dubey and King 1994; Kyriacou 1991; Nehru et al. 1993; Psacharopoulos and Arrigada 1986, 1992). As already discussed, Barro and Lee (1993, 2000) have produced data on educational attainment and average number of years of schooling at various levels for a large number of countries in the world. However, the data set provides the estimates for only two broad age groups, 15+ and 25+, and only for the period 1960-2000.
In terms of forecasting other than through multi-state methods, Ahuja and Filmer
(1995) present the most advanced method. They take existing United Nations (UN) population projections and superimpose onto them an educational distribution estimated
7

for two broad age groups (6-24 and 25+) from given sets of enrolment ratios and UNESCO (United Nations Educational, Scientific and Cultural Organization) enrolment projections. Similar to Nehru et al. (1993) they use the so-called Perpetual Inventory Method, which sums up the total school enrolment over long time series and then converts these estimates of educational attainment of the adult population. Usually, the long time series for this method are unavailable; Ahuja and Filmer overcome this drawback by using the existing Barro and Lee estimates for educational attainment 25+ for the base year. Using this approach, Ahuja and Filmer project the educational composition (for four educational groups) for a significant number of developing countries. Apart from the lack of more specific information by age for the older age-groups, this approach is also unsatisfactory through its static nature, i.e., not allowing the educational composition of the population to influence fertility despite the obvious strong educational fertility differentials in most developing countries.
To our knowledge, the dynamic multi-state approach was first applied to human
capital projections in a study of future development options in Mauritius (Lutz 1994). Rather than rely on a perpetual inventory of school enrollment, the base data for this method are educational attainment by age, which is commonly found in population censuses and national household surveys. Yousif et al. (1996) applied this methodology to project the population by age, sex, and education for six North African countries. Lutz et al. (1999) evaluated the power of this approach, presenting it to a broader forecasting community. Finally, the method was applied to produce the first global level (for 13 world regions) projections by age, sex, and educational attainment to 2030 (Lutz and Goujon 2001). Some of the results of this study will be presented in Section 3.3 below. In 2005, Education Policy and Data Center completed multi-state projections for 60+ mostly lower income, developing countries4 The International Institute for Applied Systems Analysis (IIASA) will complete a set of projections including industrialized as well as developing countries the next year.
There has been another tradition with the goal of forecasting school enrolment.
In the past decades, the UNESCO, as well as some Ministries of Education around the world, developed models to project school enrolment and resources required for the projected pupils. The demographic input of these models is typically limited to a projection of the population of school-entry age. A portion of these children is assumed to enter first grade, and over-age entry is included in the total school entrants. Enrolment in subsequent grades is based on tracking the flows of promotions, repetitions and dropouts.5 More recent versions of the models include the effects of mortality and fertility changes. Another useful approach, applied in 2005 to 34 African countries, is to project the changes in survival and intake rates only, disregarding trends in the size of the school age population (UNESCO, 2005). These models have been very useful for education planning. However, the models end when pupils graduate, and thus, they cannot be used for assessing the educational attainment of the adult
4 Available on www.epdc.org. 5 Examples of two UNESCO models are the EFA Projection Model (EFAPM), which is being
applied in a number of Asian countries (UNESCO 2003b), and the SIMEDUC model (Duvieusart 1991). National models have been developed for Nicaragua (Porta 2004) and Uganda (Moses and Golladay 2004).
8

population, or human capital, and thus, they can also not be successfully used to advocate for the long-term benefits of education.
3.2. Demographic multi-state projection methods
A method that uses widely available data, can project age-specific human capital, takes account of education-specific mortality and fertiltiy, and incorporates school flows, is multi-state population projections. The method has been firmly established over the past two decades and is now a standard ingredient in the toolbox of mathematical demographers around the world. But this method is not yet well known among scholars outside the rather narrow circle of mathematical demographers. This may help to explain the fact that this method, which is most appropriate for the projection of the educational composition of the population by age and sex, has not yet been applied by economists or others working on education and human capital dynamics. This method, which is based on a multi-dimensional expansion of the life table (increment-decrement table) and of the traditional cohort-component method of population projections, was developed at IIASA in Austria during the 1970s (Rogers 1975; Keyfitz 1985). The multi-state model is based on a division of the population by age and sex into any number of “states” which were originally geographic units with the movements between the states being migration streams. But a state can also reflect any other clearly-defined subgroup of the population, such as groups with different educational attainment, with the movements then becoming educational transition rates. Actually, the projection of human capital stocks by age and sex is an ideal example for the application of the multi-dimensional cohort component model, because education tends to be acquired at younger ages and then simply moves along cohort lines.6 Change in the educational composition of the total population is then caused the gradual substitution of older cohorts with their educational attainment by younger cohorts (who are typically better educated). But the multi-state model is also dynamic in the sense that it considers the fact that fertility and mortality (and to some extent migration) are closely associated with education. Women with more education tend to have significantly lower fertility, lower maternal and child mortality, and greater personal longevity. A change in the educational composition of the population of young women will, hence, have direct impacts on the total number of babies born, even if the fertility within each educational group does not change.
The multi-state methodology is typically described in terms of equations with
matrices indexed by age, sex, state, and time. The math is complicated because it has to consider competing risks, i.e., accounting for the fact that individuals are simultaneously exposed to the risks of dying and of moving to another state. Since the method is comprehensively documented in the literature cited above, we will only describe it more intuitively through charts.
Error! Reference source not found. describes the standard method for projecting the population by age and sex only. It starts with an age pyramid for the last
6 The model could also take into account the family education background of children so that there would be a feedback of the parents’ education on their children’s schooling. It has been tested experimentally in Lutz and Goujon (2001) but it is not applied in this paper.
9

year for which empirical data are available and (since we are using five-year age groups) projects it five years into the future. This projection consists of four different processes: Every age group is shifted up the pyramid by one step, i.e., the cohort aged 20-24 in 2000 will be 25-29 in 2005. But some of the members of this cohort will not survive to 2005; this is accounted for by applying a set of assumed age- and sex-specific mortality rates over this five-year period. Similarly, sets of age- and sex-specific migration patterns are applied because some people may leave or enter the population over these five years (assuming a closed migration as we do in this paper will simplify the model). Finally, a set of assumed age-specific fertility rates will be applied to the female cohorts of reproductive age. This results in a certain number of births over the five-year period that, according to the assumed sex ratio at birth and assumed child mortality, will be added to the new age pyramid forming the youngest age group.
Mortality
Figure 7. Principles of regular population projection by age and sex. Figure 8 shows the structure of the multi-state model for human capital
projections in which the population of each age and sex category is divided into four distinct groups according to educational attainment. Fertility, mortality, and migration now have four age- and sex-specific schedules, one for each educational group. In addition, there must be three sets of age- and sex-specific educational transition rates, i.e., the age-specific intensities for young men and women to move, e.g., from the category of primary educational attainment to secondary attainment (Figure 9). Although this model can handle transitions at any age, e.g., through adult education campaigns, in reality this is very rare. Transitions here are concentrated in the age range below age 25, depending on the kind of transition. In the projections presented here, alternative scenarios will be defined about these transition rates that are a function of assumed school enrolment rates at different ages. This structure is used for the scenarios in the next sections.
MigrationMigration
Fertility
Migration
Mortality
Males Females Males Females
Population by Age and Sex Population by Age and Sex2000 2005
MigrationMigration
Fertility
Migration
Males Females Males Females
Population by Age and Sex Population by Age and Sex2000 2005
10

Mortality
Figure 8. Principles of population projection by age, sex, and education.
Populationwith primary
educationby
age and sex
Populationwith secondary
educationby
age and sex
Populationwith tertiary
educationby
age and sex
Fertility
Mortality
= == =
1 2 3
Educational transition rates by age and sex
Fertility by age and education of mother
In- and out-migration by age and education
Mortality by age
Populationwith no
educationby
age and sex
=
1,2,3
Figure 9. Specifying the educational transition rates in the multi state projection model. Source: Lutz and Goujon 2001.
MigrationMigration
Fertility
Migration
Males Females Males Females
Mortality
Population by Age, Sex, and Education Population by Age, Sex, and Education2000 2005
MigrationMigration
Fertility
Migration
Males Females Males Females
Population by Age, Sex, and Education Population by Age, Sex, and Education2000 2005
11

The multi-state model can also be extended beyond the four education groups mentioned to accommodate, for example, educational attainment by single grades, school intake by single-year age of entry, as well as promotion, repetition, dropouts, and graduation, which are all simply transitions from one education state to another. Promotion would move people one grade up. Repetition can be accommodated by assuming that a certain portion of each grade remains in that grade, but moves up one age category. Dropouts and graduations move people out of the school state, and into not-in-school states, which can be distinguished by highest education level attained. Thus, the multi-state model can be used to project human capital, but also school flows. to track the education dynamics that lead to changes in adult educational attainment; it could be an education sector planning tool, as well as an advocacy tool. A downside is that the more states are included in the multi-state model, the more complex the data requirements. A more detailed model is in the testing phase of development at the Education Policy and Data Center in Washington D.C., and some preliminary calculations are presented below.
3.3. Education projections for thirteen world regions
Lutz and Goujon (2001; Goujon and Lutz 2004) produced the first global projections of the population by age, sex, and education to 2030 for 13 world regions. They consider three different scenarios on future educational attainment. Fertility, mortality and migration assumptions differ for each education category, but are the same for all three scenarios. Hence any differences between the scenarios in mortality, fertility or migration are due to the different developments in the educational transitions. The Constant scenario assumes that currently-observed education transition rates (corresponding to current enrolment rates) remain unchanged over the projection period. Applied to sub-Saharan Africa for instance, even this Constant scenario results in a slightly better-educated (and much bigger) population because of past improvements in education reflected in a somewhat better education of the younger age groups The ICPD scenario assumes that it will be possible to meet the targets defined at the International Conference on Population and Development 1994 in Cairo, which include a closing of the gender gap and universal primary education. The American scenario assumes the unlikely case that by 2030, American education transition rates will be reached, which implies more tertiary education. The results show that the difference between the pessimistic Constant scenario and the optimistic American scenario are relatively small: change in the educational attainment of the adult population are largely the result of the great momentum of human capital formation rather than late, quick modifications.
It should be noted at the outset that education transition rates – here defined as
the portion of a people in a particular education group who transition to the next group, for example from primary to secondary – are different from enrolment rates. In theory, two countries that reach, say the ICPD transition rates where 100% of children go into primary school can have very different gross and net enrollment rates, and, within one country, say primary enrollment can change while primary-to-secondary transition rates remain constant.
The human capital projections illustrate the changing educational composition of
the population, which is significant not only for individual development but also a
12

nation’s institutional and economic performance. In this context it is useful to look at absolute numbers of workers by skill levels rather than at the proportions discussed above. Error! Reference source not found. compares four economic mega-regions (Europe and North America together, China, South Asia and sub-Saharan Africa) in terms of trends in the size of the working age population (age 20-65) by educational attainment. The data presented is taken from the ICPD scenario. At present China clearly has the largest total working age population of these four regions, but its educated population (secondary and tertiary together) is still smaller than that of Europe and North America together. In terms of the educated working age population, South Asia is far behind, with less than half the size of that same population in Europe and North America, or China.
Western and Eastern
Europe and North America
China Region South Asia Sub-Saharan Africa
2000 2015 2030
2000 2015 2030
2000 2015 2030
2000 2015 2030
0
400
800
1200
No education Primary Secondary Tertiary
Figure 10. Population aged 20 to 65 years (in millions) by levels of education, according to the ICPD scenario for four mega-regions, 2000-2030. Source: Lutz and Goujon 2001.
Over the next 20 years, South Asia is expected to surpass China in terms of the total size of its working age population. But in terms of the educational composition of the population, the difference between the two regions will be stunning. While in China in 2030, 73 percent of the working age population will be better educated (secondary plus tertiary), it will be only 40 percent in South Asia. The main reason for this divergence lies in the differences in investment in primary and secondary education over the last two decades between the two regions. Among the four major world regions, Europe and North America will continue to have the highest educational levels of working age population, but in terms of absolute numbers of educated people, they will clearly fall behind China. Over the next three decades China’s educated working age population is likely to increase from 390 million to 750 million, while that of Europe (without the former Soviet Union) and North America together will hardly increase from 430 million to 510 million in 2030. These significant future changes in the numbers of skilled workers are likely to have far reaching consequences for the weights in the global economic system. In sub-Saharan Africa, low human capital
13

associated with enormous pressure on the educational system poses significant limits to the prospects for social and economic development in the near term. In 2000, only 19 percent of the population in the 20-65 age group had a secondary education or more. Although this percentage will almost double to 35 percent in 2030 according to the ICPD scenario, this shows how sub-Saharan Africa is far from converging to other regions’ levels of educational attainment.
In the following sections we will present new calculations for three developing
countries to illustrate clearly what would be involved in trying to produce human capital forecasts for all countries in the world.
4. MULTI-STATE EDUCATION PROJECTIONS FOR GUINEA, NICARAGUA, AND ZAMBIA 4.1. Introduction
Guinea, Nicaragua, and Zambia were chosen because they pose different challenges in terms of data availability and are examples of different educational conditions. These countries are also the focus of a number of international education initiatives and represent a range of education experiences. Nicaragua and Zambia have very high rates of primary school enrolment. In Nicaragua, there have been consistent and high rates of growth in secondary school enrolment as well, while in Zambia, the secondary school enrolment for males has stagnated for some time. Guinea, a country with very low rates of enrolment, is one of the countries projected by the Education for All (EFA) Monitoring Report (UNESCO 2003a) to miss the EFA target of full primary school attainment, as well as gender equity, while Zambia and Nicaragua are close to the goals already, with Nicaragua proceeding towards them, and Zambia stagnating at its present level. For all three countries, recent Demographic and Health Surveys (DHS) are available, which provide access to high-quality and detailed information.
Guinea, 1999 Nicaragua, 2001
Males Females Males Females
14

1200 1200 800 800 Zambia, 2002
Males Females
1500 1500
Figure 6. Population pyramids (in thousands) with educational attainment in Guinea (1999), Zambia (2002), and Nicaragua (2001). Source: DHS Guinea 1999; DHS Nicaragua 2001; DHS Zambia 2002.
4.2. Initial conditions for projections
The multi-state population projection software developed at IIASA and the PopEn software presently being tested at the Education Policy and Data Center (EPDC) were both used to produce projections of the population and education for the three countries. This section first discusses the projections made using IIASA software for populations with four education categories. The input data for these projections consists of:
(i) Age-, sex-, and education-specific population by five-year age groups and four
education categories; (ii) Age- and education-specific fertility rates; (iii) Age-, sex-, and education-specific mortality rates; (iv) Age-, sex-, and education-specific net number of migrants; (v) Age- and sex-specific education transition rates.
4.2.1. Base year population size and education
The population by age and sex is taken from the United Nations (2002) estimates. The education attainment levels taken from Demographic and Health Surveys (DHS) in Guinea (1999), Nicaragua (2001), and Zambia (2002), were superimposed on the estimates of the population. The four education groups considered were no education, primary education, secondary education, and higher education. Depending on the available data, one has to choose between two alternative ways of capturing educational attainment: Some primary, secondary, and tertiary, or completed primary,
15

secondary, and tertiary. In theory, one could consider at each level incomplete and complete levels separately, but this results in an impractically long number of categories. A more precise definition of the categories chosen for this study is given in Table 1. Table 1. Definition of the levels of education by country. Source: DHS Guinea 1999; DHS Nicaragua 2001; DHS Zambia 2002.
Guinea Nicaragua Zambia No education
Includes those who never went to school or achieved less than one year of the primary cycle
Includes those who never went to school or achieved less than one year of the primary cycle
Includes those who never went to school or achieved less than one year of the primary cycle
Primary education
Includes those who entered primary education, whether or not they completed the primary cycle. Primary schooling age: 7-12
Includes those who entered primary education and stayed at least one year. Primary schooling age: 7-12
Includes those who entered primary education, whether or not they completed the primary cycle. Primary schooling age: 7-13
Secondary education
Includes those who entered secondary education. Secondary schooling age: 13-16 (junior secondary) and 17-19 (senior secondary)
Includes those who entered secondary education. Secondary schooling age: 13-15 (junior secondary) and 16-17 (senior secondary)
Includes those who entered secondary education. Secondary schooling age: 14-15 (junior secondary) and 16-18 (senior secondary)
Higher education
Includes those who entered tertiary education after successful completion of secondary education
Includes those who entered tertiary education after successful completion of secondary education
Includes those who entered tertiary education after successful completion of the 12th year at the secondary level
Figure 6 shows the population pyramids for Guinea, Nicaragua, and Zambia in
years around 2000, which will be used as the starting year for the education projections. Before looking into the future of these countries, it is instructive to look at the heritage of past education policies and outcomes, to identify trends in education, and to examine some of the obstacles to reaching a highly-educated society. The population with no schooling is shown in the light, innermost color. Moving outwards along each bar to ever-darker colors/shades are those with primary, secondary, and tertiary education. Clearly, the educational attainment of Guinea lags far behind that of the other two countries, with a large portion of even the youngest cohorts never having attended school, both among men and women. The portion without schooling is higher among females than among males. In both Zambia and Nicaragua most adults, from age 15 on, have been to school, but in Nicaragua the proportions of adults with secondary and tertiary education are higher than in Zambia. In Zambia the portions of men with higher education are higher than women, while in Nicaragua, the educational attainments of men and women appear to be more balanced. Table 2 shows in numbers the clear disadvantage women have in Guinea and Zambia. It also shows how few of the
16

children who enter primary school eventually go to secondary, and of those in secondary the small portions who proceed to tertiary – although in the case of tertiary education it is clear that the people who proceed to this level continue to do so into their 30s.
In terms of education trends, the table shows the clear decline in the proportion
of adults with no education for younger age groups in Guinea and Nicaragua, but a stagnation for the same indicator in Zambia, and as a mirror, the portion of people who have attained primary or more, rises the younger the age-group. Attainment of secondary education rises with younger age groups up to the cohort aged 20-24. There is a dip in attainment for the age group 15-19 in both African countries because apparently, many people are still only just starting secondary school during these late teenage years. It is difficult to say whether there is stagnation of tertiary education, because many people enter university during their 20s and 30s Table 2. Educational attainment for four broad age groups by country. Source: DHS Guinea 1999; DHS Nicaragua 2001; DHS Zambia 2002.
No
Educ
atio
n
Prim
ary
only
Seco
ndar
y on
ly
Terti
ary
or m
ore
Prim
ary
or m
ore
Seco
ndar
y or
mor
e
No
Educ
atio
n
Prim
ary
Onl
y
Seco
ndar
y on
ly
Terti
ary
or m
ore
Prim
ary
or m
ore
Seco
ndar
y or
mor
e
Guinea 1999 15-19 44 34 22 0 56 22 69 21 10 0 31 10 20-24 51 17 30 2 49 32 75 12 11 1 24 12 25-34 58 17 18 6 41 24 80 10 6 2 18 8 35+ 77 8 7 7 22 14 91 3 3 2 8 5
Nicaragua 1998 0 0 0 0 15-19 12 48 38 2 88 40 8 40 50 3 93 53 20-24 14 38 36 11 85 47 11 36 38 14 88 52 25-34 17 41 30 12 83 42 15 39 33 13 85 46 35+ 33 41 17 9 67 26 35 41 16 8 65 24
Zambia 2002 0 0 0 0 15-19 6 66 28 0 94 28 9 59 31 0 90 31 20-24 6 48 43 4 95 47 12 54 32 3 89 35 25-34 6 44 41 8 93 49 11 57 27 5 89 32 35+ 14 50 27 8 85 35 37 50 10 3 63 13
4.2.2. Base year fertility rates
All estimates of fertility levels by education were taken from the DHS. These education-specific DHS fertility rates were then adjusted so that the total average fertility levels were equal to the United Nations 2000-2005 estimates (see Table 3).
17

Table 3. Real and estimated total fertility rates by education and country in 2000-2005. Source: Authors’ calculations based on United Nations 2002; DHS Guinea 1999; DHS Nicaragua 2001; DHS Zambia 2002.
Guinea Nicaragua Zambia DHS
1999 Estimated for 2000-05
DHS 2002
Estimated for 2000-05
DHS 2001
Estimated for 2000-05
No education 5.9 6.0 5.7 5.7 7.4 6.8 Primary 4.8 5.6 4.9 (1-3)
3.8 (4-6) 4.2 6.5 6.2
Secondary 3.5 4.7 2.7 2.7 3.9 4.0 Higher 3.0 1.5 1.7 3.3 Total 5.5 5.8 3.6 3.6 5.9 5.6
4.2.3. Base year mortality rates
The DHS surveys provide estimates of infant (below age one) and child (ages 1-4) mortality rates by selected background characteristics, such as mother’s education. Table 4, which aggregates infant and child mortality, shows that a child’s chances of survival are highly dependent on the mother’s level of education.
Table 4. Under-five mortality rates (5q0) per 1,000 live births by mother’s level of education by country. Source: DHS Guinea 1999; DHS Nicaragua 2001; DHS Zambia 2002.
Guinea Nicaragua Zambia No education 204 72 198 Primary 162 43 177 Secondary 104 26 121 Higher 19 Total 195 45 168
Table 5. Estimated life expectancy at birth by sex, education and country in 2000-05. (Source: Authors’ calculation based on United Nations 2002; DHS Guinea 1999; DHS Nicaragua 2001; DHS Zambia 2002).
Guinea Nicaragua Zambia Males No education 46.7 62.7 30.7 Primary 51.5 68.2 32.7 Secondary 55.5 72.8 36.0 Higher 55.5 74.5 36.0 Total 48.8 67.2 32.7 Females No education 48.3 67.5 30.6 Primary 53.3 72.7 32.3 Secondary 59.0 76.7 36.0 Higher 59.0 78.3 36.0 Total 49.5 71.9 32.1
18
These rates were used to estimate differential mortality levels by level of education for the whole population of the three countries using the United Nations’ software package for mortality measurement (MORTPAK LITE).7 For Zambia, because of the HIV epidemic, it was decided to take the mortality rates provided by the United Nations (which reflect the specific age profile of AIDS mortality) and scale them up or down with the educational differentials found through the Mortpak procedure. Table 5 shows the education-specific life expectancy resulting from the Mortpak exercise. The resulting total life expectancy is equivalent to the United Nations total.
4.2.4. Base year migration rates
In all three countries there are net emigration rates that influence the development of the population. To estimate migration flows by education, we took the total net number of migrants as provided by the United Nations and applied a typical migration age schedule. The total migrants were distributed proportionally over the education groups. This way, migration will affect the population by age, but not the education structure.
4.2.5. Base year education transitions
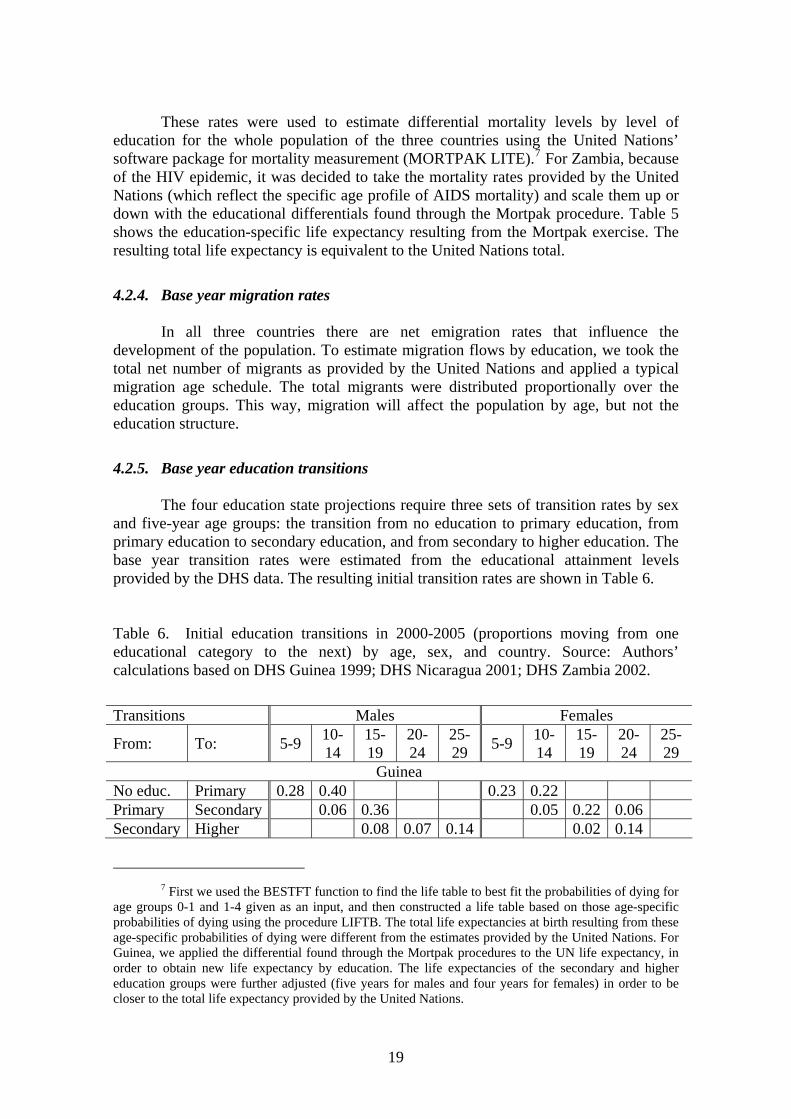
The four education state projections require three sets of transition rates by sex and five-year age groups: the transition from no education to primary education, from primary education to secondary education, and from secondary to higher education. The base year transition rates were estimated from the educational attainment levels provided by the DHS data. The resulting initial transition rates are shown in Table 6. Table 6. Initial education transitions in 2000-2005 (proportions moving from one educational category to the next) by age, sex, and country. Source: Authors’ calculations based on DHS Guinea 1999; DHS Nicaragua 2001; DHS Zambia 2002.
Transitions Males Females
From: To: 5-9 10-14
15-19
20-24
25-29 5-9 10-
14 15-19
20-24
25-29
Guinea No educ. Primary 0.28 0.40 0.23 0.22 Primary Secondary 0.06 0.36 0.05 0.22 0.06 Secondary Higher 0.08 0.07 0.14 0.02 0.14
7 First we used the BESTFT function to find the life table to best fit the probabilities of dying for
age groups 0-1 and 1-4 given as an input, and then constructed a life table based on those age-specific probabilities of dying using the procedure LIFTB. The total life expectancies at birth resulting from these age-specific probabilities of dying were different from the estimates provided by the United Nations. For Guinea, we applied the differential found through the Mortpak procedures to the UN life expectancy, in order to obtain new life expectancy by education. The life expectancies of the secondary and higher education groups were further adjusted (five years for males and four years for females) in order to be closer to the total life expectancy provided by the United Nations.
19

Nicaragua No educ. Primary 0.43 0.75 0.24 0.46 0.75 0.26 Primary Secondary 0.15 0.41 0.21 0.50 Secondary Higher 0.29 0.24 0.30 0.23
Zambia No educ. Primary 0.45 0.71 0.46 0.46 0.67 0.58 Primary Secondary 0.05 0.31 0.23 0.05 0.36 Secondary Higher 0.05 0.12 0.07 0.05 0.09 0.08
Transitions from one level to the next occur at different ages, across two to three age groups, so that the age at which a person will attain his/her highest level of educational attainment can vary. The transitions are calculated as follows:
• The transition from no education to primary in age group 5-9 is equal to the portion with primary attainment in that age group. • The transition from no education to primary in age group 10-14 is equal to the ratio of the difference between the portions with primary in age group 10-14 and 5-9 to the portion with no education in age group 5-9. • Since in most countries the portion with no education is still lower in the age group 15-19 compared with the age group 10-14 – this is the case in Nicaragua and Zambia – we assumed that a transition could occur from no education to primary in age group 15-19 and is equal to the ratio of the portions with no education in age group 15-19 to age group 10-14. • The first transition from primary to secondary occurs in age group 10-14 and is equal to the ratio of the portion that attained secondary in age group 10-14 to the portion that attained primary in age group 5-9. • The transition from primary to secondary in age group 15-19 is equal to the ratio of the difference between the portions with secondary education in age groups 15-19 and 10-14 to the portion with primary education in age group 10-14. The same is applied if a transition from primary to secondary level of educational attainment seems to apply to age group 20-24. • The first transition from secondary to higher education occurs in age group15-19 and is equal to the ratio of the portion with higher education in age group 15-19 to the portion with secondary education in age group 10-14. • The transition from secondary to higher education in age group 20-24 is equal to the ratio of the difference of the portions with tertiary education in age group 20-24 and 15-19 to the portion with secondary education in age group 15-19. The same is applied if a transition from secondary to higher level of educational attainment seems to apply in age group 25-29.
20

As Table 6 shows, the transition into primary school was lowest in Guinea, and roughly equal in Nicaragua and Zambia. Similarly, the transitions from primary to secondary were lowest in Guinea. Male transitions to secondary were again, equal in Nicaragua and Zambia. However, there is an interesting departure regarding the female transitions from primary to secondary. In Zambia, those transitions are lower for women (as is the case in most countries), but in Nicaragua, they are higher by a considerable margin. How has this come about, and how will this affect the status of women in Nicaragua in the coming decades? This is worth exploring for lessons regarding women’s equality in education.
4.3. Scenarios
The projections of the total population by level of education presented below have a 30-year time horizon. For the demographic variables fertility, mortality, and migration, only one demographic scenario was defined for each country, which replicates as closely as possible the medium variant of the UN population projections for these countries (United Nations 2002). But because fertility, mortality, and migration are stratified by education categories, and weights of the education categories change over time, the assumed trends in fertility and mortality had to be defined carefully so that the weighted average in the Constant scenario comes close to the total assumed in the UN projections.8 All the demographic assumptions are shown in Table 7.
The trends of fertility differentials by education over time were modeled so that
by a certain distant date all education categories would converge to the same low level of fertility. This convergence assumption is consistent with the assumption that the role of education as a factor of heterogeneity in fertility decision-making diminishes once the process of education diffusion has been completed. However, the assumed date of convergence is far in the future (after 2050) so that by 2030, in all three countries, significant education differentials still exist.
As in the case of fertility, the principle of convergence was also applied to
mortality differentials. However, as observed in a few studies in developed countries (Doblhammer 1997; Huisman et al. 2002), education remains a strong determinant of mortality patterns, even at very high levels of life expectancy. Therefore, the convergence date was set to the end of the 21st century, and significant life expectancy differentials by education remain throughout the projection period.
The total migration trends to 2030 are taken from the migration assumptions of
the United Nations (2002), and proportionally distributed over the sex and education groups. This way, migration is taken into account but does not upset the weights of the different education categories in the country.
8 The hypothesis that the projection assumptions should follow those of the UN is not obligatory.
As a matter of fact, it can be a nice feature of such multi-state projections that the changing weights of education categories in the population affect the aggregate fertility, mortality, and migration assumptions.
21

Table 7. Demographic assumptions by country.
Guinea Nicaragua Zambia
Indicator Education N
o Ed
ucat
ion
Prim
ary
only
Seco
ndar
y on
ly
Terti
ary
or m
ore
No
Educ
atio
n
Prim
ary
only
Seco
ndar
y on
ly
Terti
ary
or m
ore
No
Educ
atio
n
Prim
ary
only
Seco
ndar
y on
ly
Terti
ary
or m
ore
By education 2000-05
6.0 5.6 4.7 3.0 5.7 4.2 2.7 1.7 6.8 6.2 4.0 3.3
By education 2025-30
3.4 3.2 2.3 1.8 3.5 2.7 2.0 1.7 4.3 3.8 2.4 2.1
Tota
l Fer
tility
Rat
es
Average country 2000-05
5.8 3.6 5.6
Males 2000-05 46.7 51.5 55.5 55.5 62.7 68.2 72.8 74.5 30.7 32.7 36.0 36.0
Males 2025-30 56.6 60.2 62.7 62.7 69.5 74.0 75.0 76.2 40.5 42.3 45.0 45.0
Females 2000-05 48.3 53.3 59.0 59.0 67.5 72.7 76.7 78.3 30.6 32.3 36.0 36.0
Life
exp
ecta
ncy
at b
irth
(in y
ears
)
Females 2025-30 57.7 61.2 65.9 65.9 75.6 78.6 79.1 80.2 39.2 40.0 44.0 44.0
Males 2000-05 -148 -42 -31 -11 -9 -12 -7 -2 -14 -33 -19 -4
Females 2000-05 -190 -26 -12 -3 -9 -12 -7 -2 -20 -36 -12 -2
Males 2005-10 0 0 0 0 -8 -12 -6 -2 -10 -23 -13 -2
Females 2005-10 0 0 0 0 -8 -11 -7 -2 -14 -25 -8 -1
Males 2025-30 0 0 0 0 -6 -13 -8 -3 -1 -1 -1 0
Net
num
ber o
f mig
rant
s (bo
th se
xes)
in
thou
sand
s)
Females 2025-30 0 0 0 0 -6 -12 -9 -3 -1 -1 -1 0
4.4. Education scenarios
Three education scenarios were chosen to illustrate three stylized stories of progress in education. The stories are the same for the three countries, although the implementation levels are different depending on the specific country situation. In the following section we first discuss these stylized scenarios and their long-term consequences on the education composition of the adult population. In the concluding
22

policy section of this paper we will return to this question of improving enrolment over time with a more detailed model on age-specific intake, grade-specific enrolment and completion rates, with specific attention given to the question under what policies certain improvements in enrolment can be achieved.
A: Constant Enrolment scenario: Under this scenario, the transition rates to
primary, from primary to secondary and from secondary to higher education are maintained at constant levels throughout the projection period. This scenario is artificial, but it shows the progress already embedded in the educational structure of today – the education momentum. Despite constant transition rates, the adult education levels improve as younger and more educated cohorts, as a result of recent improvements in education, are replacing the older cohorts.
B: Trend scenario: Here it is assumed that the rate of change in the transition to
primary school and to secondary school as observed over the past decades continues into the future. To estimate the historical trend, it is assumed that each birth cohort’s age-specific educational attainment can be used as a proxy for schooling at the time the birth cohort was of primary or secondary school age To translate these birth-cohort attainments into schooling, it is assumed that primary school entry occurs, on average, by age 10, while secondary school entry occurs on average at age 15. In this way, the primary educational attainment of the birth cohort of 1975 is an indication of the transition into primary school in 1985. In Guinea, primary school attainment was 36 percent of the men aged 40-44 (who entered primary school approximately 30 years ago); 42 percent among men aged 30-34 (who entered primary 20 years ago); and 48 percent among 20-24 year old males (who went to school about 10 years ago). This trend is assumed to continue in a logarithmic fashion up to 2020. This approach of cohort-extrapolation is being applied, for instance, by the UNESCO Institute for Statistics (UIS) in some projection research and by Wils (2002). As an example, Figure 7 shows for Zambia the estimated past schooling rates in the past, as well as the assumed future trend schooling.
C: Millennium Development Goal (MDG) scenario: This scenario assumes
that the objectives set by the MDGs in terms of education (goals 2 and 3) will be achieved within the stated time horizon. Goal 2 aims at achieving universal primary education, ensuring that by 2015, all children will be able to complete a full course of primary schooling. Goal 3 aims at promoting gender equality and the empowerment of women by eliminating gender disparity in primary and secondary education, preferably by 2005, and in all levels of education no later than 2015. Here we assume that full gender equity will be achieved for all levels of education by 2010-2015. In this scenario, intake to primary school is assumed to be complete, but there are no assumptions concerning completion of primary school. However, we assume further increases in the transition to higher education of both males and females. The increase in the transition to secondary education is lower than what would probably take place if primary completion actually occurred by 2015, as discussed below.
23

Males Females
0102030405060708090
100
2007-2011
1997-2001
1987-1991
1977-1981
1967-1971
1957-1961
1947-1951
1937-1941
f bi th
% a
ttain
ing
leve
l
0102030405060708090
100
2007-2011
1997-2001
1987-1991
1977-1981
1967-1971
1957-1961
1947-1951
1937-1941
% a
ttain
ing
leve
l
Primary Primary
SecondarySecondary
Figure 7. Past and assumed future trends for primary and secondary educational attainment in Zambia by birth cohort. Source: Authors’ calculations; DHS Zambia 2002.
A summary of the education assumptions is given in Table 8. In all three scenarios, the absolute number of students enrolled in school increases over time, and the average level of educational attainment of the adult population rises. To what extent this will happen is the question addressed in the next section.
Table 8. Final education transitions in 2025-2030 by scenario (white: Constant; light gray: Trend; dark gray: MDG) by age, sex, and country. For comparison, the figures for the Constant scenario in 2025-2030 are the same as the base year transitions. Source: Authors’ calculations.
Transitions Males Females
From: To: 5-9
10-14
15-19
20-24
25-29
5-9
10-14
15-19
20-24
25-29
Guinea .28 .40 .23 .22 .95 .95 No educ. Primary 1*
1*
.06 .36 .05 .22 .06
.39 .23 .31 .13 Primary Secondary .50* .20*
.50* .20*
.08 .07 .14 .02 .14
.08 .12 .14 .02 .25 Secondary Higher .22* .21*
.22* .21*
Nicaragua .43 .75 .24 .46 .75 .26 .52 .91 .30 .53 .87 .30 No educ. Primary 1*
1*
.15 .41 .21 .50
.18 .50 .24 .59 Primary Secondary .20* .54*
.20* .54*
24

.29 .24 .30 .23
.35 .29 .36 .28 Secondary Higher .38* .32*
.38* .32*
Zambia .45 .71 .46 .46 .67 .58 .93 .91 No educ. Primary 1*
1*
.05 .31 .23 .05 .36
.49 .45 Primary Secondary .53*
.53*
.05 .12 .07 .05 .09 .08
.05 .15 .07 .05 .13 .08 Secondary Higher .07* .18* .10*
.07* .18* .10*
* by 2015.
4.5. Country-specific results
The results of the scenarios along with the 2000 values are shown in Figure 8 and in the pyramids of Appendix Figures A1-A3. Guinea is an example of a country where the heritage of neglect in educational investment will be detrimental to the long-term educational development of the country. In all three scenarios, the absolute number of people with no education will continue to increase until 2020 under the most favorable scenario (MDG) and for the whole projection period under the two other scenarios. Only an aggressive adult education campaign can address this issue. The momentum of past education neglect will continue to have an effect over the next decades. However, there is some modest progress. The portion of the population aged 15-64 with no education starts at almost 70 percent in 2020; by 2015 it is 55 percent in all three scenarios. This progress comes from changes already embedded in the education structure of the population.
GUINEA CONSTANT
0
1000
2000
3000
4000
5000
6000
7000
8000
9000
10000
2000 2005 2010 2015 2020 2025 2030
HISEPRNO
GUINEA TREND
0
1000
2000
3000
4000
5000
6000
7000
8000
9000
10000
2000 2005 2010 2015 2020 2025 2030
HISEPRNO
GUINEA MDG+
0
1000
2000
3000
4000
5000
6000
7000
8000
9000
10000
2000 2005 2010 2015 2020 2025 2030
HISEPRNO
25

NICARAGUA CONSTANT
0
1000
2000
3000
4000
5000
6000
7000
2000 2005 2010 2015 2020 2025 2030
HISEPRNO
NICARAGUA TREND
0
1000
2000
3000
4000
5000
6000
7000
2000 2005 2010 2015 2020 2025 2030
HISEPRNO
NICARAGUA MDG+
0
1000
2000
3000
4000
5000
6000
7000
2000 2005 2010 2015 2020 2025 2030
HISEPRNO
ZAMBIA CONSTANT
0
1000
2000
3000
4000
5000
6000
7000
8000
9000
10000
2000 2005 2010 2015 2020 2025 2030
HISEPRNO
ZAMBIA TREND
0
1000
2000
3000
4000
5000
6000
7000
8000
9000
10000
2000 2005 2010 2015 2020 2025 2030
HISEPRNO
ZAMBIA MDG+
0
1000
2000
3000
4000
5000
6000
7000
8000
9000
10000
2000 2005 2010 2015 2020 2025 2030
HISEPRNO
‘NO’ = no education; ‘PR’ = primary education; ‘SE’ = secondary education; ‘HI’ = higher education.
Figure 8. Population of Guinea, Nicaragua, and Zambia aged 15-64 by level of education, 2000-2030, according to the Constant, Trend, and MDG scenarios. Source: Authors’ calculations.
The implementation of higher intake or promotion does not make any real
difference to the composition of the labor force before 2015, when the children who were affected by the changes finally enter the labor force. Even then it is not until well into the 2020s that real differences are noticeable. The difference in the proportion with no education will be more significant only in 2030: 53 percent in the case of a Constant scenario; 45 percent according to the Trend scenario; and 35 percent according to the MDG scenario. Another striking feature of the education momentum in Guinea is the continued limitation to women’s participation in the formal sector, as they will account for 56 to 58 percent of the no education population during the projection period and across all scenarios.
In Zambia, some progress is similarly embedded in the labor force, despite
recent stagnation in the educational attainment (see Figure 7). Even with the Constant scenario, the share of the no education group in the population aged 15-64 will decline from 13 percent in 2000 to 8 percent in 2030. The share of the primary and secondary education group will increase from 83 to 88 percent. The Trend scenario shows that more and more people will have secondary education, from 29 percent in 2000 to 39 percent in 2030. This would go as high as 47 percent if the MDG scenario were implemented. Once again, one has to be careful as to the quality of the education attained, and Zambia has problems with retention level, very much like Guinea. Also, women remain disadvantaged. Under the Trend scenario and the Constant scenario,
26

women will make up more than 50 percent of the no education and primary education group (together) aged 15-64, but only 43 to 44 percent of the secondary and higher education group. Under the MDG scenario, the proportion of women in these higher educated groups would be 47 percent.
Figure 8 shows that the educational attainment of Zambia and Nicaragua are
quite similar. One main difference is the shape of the overall population pyramid (see Appendix Figures A1-A3). Zambia has barely started its transition to lower fertility levels, whereas Nicaragua is advanced. In 2030, the proportion of the labor force in the no educated categories in Nicaragua should be between 6 and 11 percent, depending on the scenario (from a level of 18 percent in 2000). In 2030, according to the Trend scenario, 36 percent of the labor force should have secondary education and 13 percent tertiary education, which makes up almost 50 percent of the working age population. The MDG scenario would bring a small change compared to the Trend scenario to 38 percent with secondary and 15 percent with tertiary education. Quite astonishing in Nicaragua is the advantage that women have in terms of higher education. They represent between 50 and 55 percent of those with secondary or higher education.
Looking at the education pyramids in Appendix Figures A1-A3, one result is
very clear. Even with the minimum education assumption of no more improvements in the education transitions, the overall educational attainment of the adult population will increase as the younger cohorts, who are benefiting from higher education flows than older generations, gradually fill the pyramid.
4.5.1. Attainment of MDG goals
In the scenario assuming MDG goal attainment, these targets are met as a matter of assumption. But will the Trend scenario – the business-as-usual scenario – also achieve these goals? For Nicaragua, which is already very close to full primary intake, that goal can be met following the present trend. Zambia is very close to the goal of full and equal (by gender) primary entry, but has stagnated at around 90 percent for some time. Following the present trend, even though progress was made, neither the objective of increasing to full access to primary education by 2015, nor the objective of closing the gap between males and females in school will happen, especially in the two countries in sub-Saharan Africa.
The projections show that in Guinea, the share of the population 15 years and
above with at least some primary education will increase to around 40 percent by 2015, leaving 60 percent of the adult population without any formal education. In Zambia, the proportion of the no education group above age 15 would decline from 15 percent in 2000 to 7 percent in 2015.
4.5.2. Education and the demographic window of opportunity
The notion of the “demographic window” has recently gained prominence in the economic literature. As birth rates fall and the aged population remains small, the total dependency ratio declines, which offers the opportunity for rapid economic growth and
27

further investments in education and infrastructure. It is also seen as a unique opportunity for countries to invest in their future human capital by increasing educational enrolment (see Pool 2004; Bloom and Canning 2003). In this section we will discuss to what extent the demographic window exists in our three countries.
Error! Reference source not found.9 shows the dependency ratios over time
for Guinea, Nicaragua, and Zambia in the Trend scenario. Nicaragua has the lowest dependency ratios of the three countries and will remain lowest during the whole projection period. After 2005, Guinea and Zambia will enter a period of declining dependency ratios that will last at least until the end of the projection period. This projected decline in the total dependency ratio will make it easier for those countries to expand their educational enrolment ratios through two distinct mechanisms: First, the absolute increase in the number of children at the age of entering school will increase less rapidly than in the past. Second, the demographic window can be expected to contribute positively to economic growth, thus allowing countries to invest more in education. Here one can also expect a virtuous reinforcing mechanism by which more investments in education will lead to still more rapid fertility decline and hence smaller cohorts of children to be educated and possibly more economic growth, both factors that will ease a further increase in enrolment rates.
500
600
700
800
900
1000
1100
2000 2005 2010 2015 2020 2025 2030
GuineaZambiaNicaragua
Figure 9. Dependency ratio by country, 2000-2030, Trend scenario9 (ratio of population aged 0-14 and 65+ per 1,000 population aged 15-64). Source: Authors’ calculations.
5. THE POLICY DIMENSION AND THE CROSS-BENEFITS OF IMPROVEMENTS IN EDUCATION 5.1. Alternative paths to improving educational attainment
9 The scenario does not affect the dependency ratio level for the 30-year projection period, and
therefore, it was decided to show one line (Trend scenario) in order not to overload the graph.
28

One of the challenges in the interpretation of educational attainment scenarios such as the ones above is in estimating what kinds of education flows – namely, intake, promotion, and repetition – will generate the overall transitions. Education policy can only affect education flows rather than directly affecting the total stock. A more detailed look at these flows will be necessary for a policy analysis and requires the consideration of a larger number of education categories. Fortunately, the mathematics of the multi-state projection method is such that it can be extended to include any number of states. In practice, the to generate a model with education flows the additional education states are single-year grades, and the transitions are be school intake, transition to next grade, repetition, and dropout or graduation. This method can track pupils, like the UNESCO models, and in addition also those who have left school can be tracked in the projection by the highest grade achieved. As a matter of practicality, one can cluster grade levels for education-differentiated fertility and mortality levels.
The EPDC has recently developed such a combined education enrolment and educational attainment model. For the initial conditions, the same data sources are used as above. At this time, fertility and mortality are not differentiated by education in the model and the values for these indicators are set equal to those of the UN medium variant. The initial distribution of education by grade is taken from the DHS and some interpolation and smoothing by the model. The initial intake rates are calculated for ages 6-16, and each age-specific intake rate is equal to the difference between the proportions that have ever attended school age (x) minus the proportions that have ever attended school age (x-1). Repetition rates are obtained from the UIS website10 or the national sources collected by the EPDC.11 The transition to next grade rates are calculated from the repetition and survival rates to grade (x). The survival rates are estimated from DHS, using the recent trends in educational achievements between the cohorts aged 20-24 and 25-29 at the time of the DHS survey.12
All of these rates are more prone to error than straightforward educational attainment by school level, and care was taken to ensure that the initial conditions of the projection, namely gross and net enrolment rates at the primary and secondary levels, matched those estimated by UIS or by the Global Education Database (GED).13 Enrolment rates given by the UIS and the GED differ by as much as 10 or more percentage points in some cases, indicating the levels of uncertainty involved. Still, the preliminary scenarios discussed below offer some useful insights.
First, the intake rates, average transition to next grade rates, and average dropout rates were set to reproduce the three stylized scenarios above. The intake rates are total intake by age15. Transition to next grade rates can be set differently for all grades, but in the scenarios below, have two levels, for all primary and one for all secondary grades. That means, for example, that if there is an increase in the transition from primary to secondary school, then we assume that promotion rates throughout primary school increase, leading to higher survival to the last primary grade, and from there, a higher transition to secondary. This is a simplification that does not take into account the discontinuity that is often observed in transition rates from one school level to the next.
10 www.uis.unesco.org 11 www.epdc.org 12 Survival rates were also estimated from national sources, but these were not different than
those made with DHS data. 13 http://qesdb.cdie.org/ged/tools.htm
29

The results are shown in Table 9. It is useful to compare these results with the assumptions of the stylized scenarios defined in Table 8 in order to understand the dynamics within enrolment flows that are leading to the educational attainment outcomes. In all countries, the Constant scenarios hold the intake and promotion rates constant. But in the Trend and MDG scenarios, there were changes to reflect different education outcomes by 2030. Below, we only discuss the results for promotion rates according to the Trend and MDG scenarios, although the model includes the calculation of dropout and repetition rates.
In Guinea, the Trend scenario assumes that intake rises to 95 percent by 2020. However, the trend is for secondary education to rise only marginally, resulting in a growing primary-secondary gap. If the educational attainment trend continues as assumed, then average transition rates within primary school would actually decline slightly from 61 to 59 percent by 2020 (these very low transition to next grade rates are partly due to very high average repetition rates of around 25 percent). That is not to say this pessimistic future will materialize, although declining quality and promotion are a real issue as countries strive to meet the MDG goals. In fact, the MDG scenario, with a 50 percent secondary attainment by 2020, would arise if promotion rates remained constant. Table 9. Intake rates and average primary promotion rates in 2000 and 2020 to reproduce the stylized Constant, Trend, and MDG scenarios by country. Source: Authors’ calculations.
Guinea Nicaragua Zambia
Intake by age 15
Average primary
transition to next grade
Intake by age 15
Average primary
transition to next grade
Intake by age 15
Average primary
transition to next grade
M* F* M* F* M* F* M* F* M* F* M* F* 2000 57 40 63 61 90 89 79 83 93 91 88 87
2020 Constant 57 40 63 61 90 89 79 83 93 91 88 87 Trend 95 95 62 59 100 100 85 88 93 91 89 90 MDG 100 100 72 74 100 100 87 88 100 100 92 93 * ‘M’ = males; ‘F’ = females
In Zambia, the Trend scenario gives similar results to the Constant scenario – primary attainment remains flat and secondary attainment by 2020 would rise by 30 percent for women and almost nothing for men. A slight improvement in promotion rates for females, from 87 to 90 percent would be sufficient for this improvement.
Nicaragua is the only country set to achieve 100 percent intake by 2020. The present trend would imply that secondary attainment rose from 39 and 48 percent in 2000 for men and women, respectively, to 57 and 66 percent in 2020. To obtain those primary and secondary attainment levels, intake rises to 100 percent by 2020, and the
30

promotion rate would rise from 79 and 83 percent in 2000 for males and females, respectively to 85 and 88 percent respectively in 2020. The MDG scenario differs from the Trend scenario only in that a larger secondary attainment of males is assumed to equal that of females. The associated average male promotion rate is 87 percent.
The secondary attainment levels by 2020 are hardly influenced by intake rate growth over the time period 2005-2020, because many of those who will achieve secondary education are already in school today, and because the initial improvements of intake rate (which will influence secondary attainment up to 2020) are relatively small. Thus, a strategy to improve secondary attainment in the next decade has to focus on quality and retention in the schools today, whereas a policy for higher primary attainment can focus on intake.
5.2. The impact of raising intake versus raising primary completion
From the above, the question arises whether raising primary school intake is the most efficient path towards raising education attainment in the labor force. For the many countries where dropout rates are high, higher intake rates may just result in more dropouts. The reduction of dropout rates has potentially very positive effects in terms of raising educational attainment among adults. The detailed EPDC multi-state education projection model shows just what the differences are. The results are shown here for Nicaragua only for the sake of brevity, but they are similar for Guinea and Zambia. Two scenarios are juxtaposed: MDG-Intake, which assumes only that intake at age 6 reaches 100 in 2015; and MDG-Completion, which assumes in addition, that promotion rates rise to 100% by 2015 with, for now, the simplifying assumption that repetition falls to zero by that year.
The results for net enrolment rates at the primary and secondary level for Nicaragua are shown in Figure 10 with the Constant scenario for comparison. Under the Constant scenario, there is little change in the net enrolment rates at either school level. Under MDG-Intake, when intake rises, so does the net primary enrolment rate, from the present level of about 70 to a bit over 90 by 2020, an increase of about one-third. The model assumes that repetition and promotion rates are constant; therefore, if there is a larger group of children starting school, a proportionally larger group reaches the end of the primary cycle and transitions to secondary. Thus, the secondary net enrolment rate rises from about 30 to about 40, an increase of one-third.
Under MDG-Intake, less than two-thirds of those who start primary school
continue to the end. The MDG-Completion scenario shows how different the outcome is if the primary promotion rates increase to 100 percent by 2015. In this case, net enrolment goes to 100 percent, because all children enter school at the school-entry age, and all remain in school throughout the entire cycle. This is only a 10 percent increase in primary net enrolment compared to the MDG-Intake scenario, but 100 percent of those who begin primary school finish it, causing a much higher flow to secondary school. As a result, in this scenario, the net enrolment rate for secondary education increases to 80 percent by 2020, more than doubling, compared to the meagre one-third increase if only intake rises!
31

What is the impact of these different MDG scenarios on adult educational attainment? Figure 10 shows the proportion of adults aged 15-64 with no schooling and those with secondary education. The proportion of adults with no schooling falls gradually, largely a result of education momentum; the full intake rate in MDG-Intake has some small beneficial impact, but not much because intake by age 15 is already near completion in Nicaragua. The MDG-Completion scenario has no additional impact on the proportion without schooling.
N E R P r im a r y1
0 .9
0 .8
0 .7
0 .62 0 0 0 2 0 1 0 2 0 2 0 2 0 3 0
T im e (Y e a rs )
M a le c o n s ta n tM a le M D G In ta k eM a le M D G C o m p le t io n
N E R S e c o n d a r y1
0 .7 5
0 .5
0 .2 5
02 0 0 0 2 0 1 0 2 0 2 0 2 0 3 0
T im e (Y e a rs )
Portion No Schooling 15-64
0.4
0.3
0.2
0.1
02000 2010 2020 2030
Time (Years)
Portion Secondary 15-64
0.8
0.7
0.6
0.5
0.42000 2010 2020 2030
Time (Years)
Male constantMale MDG IntakeMale MDG Completion
Figure 10. Net enrolment rates (NER) at the primary and secondary levels, and proportion of adults aged 15-64 with no schooling and with secondary schooling for Nicaragua, 2000-2030, for the Constant, MDG-Intake, and MDG-Completion scenarios. Source: Authors’ calculations.
The investment return for reaching the MDG-Completion scenario comes in the increases in the proportion of the adult population with secondary schooling. As more children finish primary and (assuming constant transition rates to secondary) proceed to
32

secondary school, the ranks of the well-educated young adults swell. From about 2010 onward, the line for secondary attainment in the MDG-Completion scenario departs sharply upwards from the other scenarios. In fact, in Nicaragua, reducing the drop-out rates has a much earlier impact on adult educational attainments than raising intake rates. The reason for this is that an improvement in promotion and retention affects all those who are already in school, whereas the effect of higher intake rates begins at first grade and must work its way up through all the grades of the school system.
5.3. The potential for sub-national forecasts by level of education
The multi-state population projection methods that have been described in this paper are not limited to national level applications. They can be applied to any population that is clearly defined (i.e., where it is clear who is a member of the population and who is not) and that has the necessary information by age, sex, and level of education. Such human capital projections have already been published for several settings of sub-national administrative units as well as for urban and rural sub-populations.
Sub-national projections by level of education have been recently published for
the Indian states (Goujon and MacNay 2003). The focus was on anticipating the educational compositions of state-level populations to 2026 for Bihar, Kerala, Madhya Pradesh, Maharashtra, Rajasthan, Tamil Nadu, and Uttar Pradesh. The results show that major efforts would be required in some regions to achieve the United Nations Millennium Development Goal in terms of primary completion by 2015. Even for 2026, there is still likely to be significant illiteracy among young adults aged 20-29, who in 2015 would have been in age groups in which primary schooling should have been completed. The paper shows that efforts to step up the rate of educational progress beyond what was achieved during the 1990s would be required in order to come close to the MDG goals in several states.
In the context of an in-depth case study on population and sustainable
development on the Yucatán peninsula (including the Mexican states of Campeche, Yucatán, and Quintana Roo), human capital projections were carried out at a level that went down to municipalities (Goujon et al. 2000). The municipal level information was then re-aggregated to form eleven so-called socio-ecological groups that correspond to the main ecological zones that were studied, but also could be aggregated further to produce human capital projections for the three states. Such small area projections by level of education were possible because of the easy availability of complete census counts at the municipal level, including age, sex, and highest completed level of education. This could be the basis for running alternative scenarios using different fertility and educational enrolment scenarios to 2030. Because of its spatial detail, these projections were quite useful to the state school authorities in the states concerned.
For China, projections by level of education that separately projected the urban
and rural populations have recently been carried out (Cao and Lutz 2004). Because of the huge urban/rural heterogeneity in China and the great population numbers involved, it turned out to be very instructive to do this exercise separately for the urban and rural populations. The results show that due to massive investments in primary and secondary
33

education over the past decades, both the urban and rural populations will become better educated on average over the coming decades. By 2045 only a small fraction of the urban adult population will be without any secondary education. Even in rural areas, this proportion will decline to less than one-third of the adult population.
Another effort is currently underway to project the population by age, sex, and
level of education for Egypt’s 26 governorates. Again, for this smaller area projection, the base year information by age, sex, and level of education comes from the census, while information about fertility levels and schooling is taken from DHS as well as administrative registers. Since the DHS sample is too small to have representative information for all governorates, this study combines DHS information on educational fertility differentials for greater regions with small area administrative information about the level of education (see Lutz 2004). This shows that the general approach described in this paper is rather flexible and adaptable to very different settings.
Finally, it should be stressed that the same method can be used for making
projections by level of education for any sub-grouping of the population as long as membership can be clearly defined. These could be different ethnic or language groups, or even religious groups within any given countries, if the census and relevant surveys register these distinguishing characteristics.
5.4. Cross-sectoral benefits of improved education
An important aspect of education in the broader development context is that the process of schooling creates numerous byproducts – outcomes that occur as a result of cross-sectoral consequences of the education process. Such indirectly education-related outcomes range from a higher use of modern contraceptive methods for men and women, to higher chances of living in a big city – although this is not part of the curriculum – for men and women with a higher education. We will show only two examples of those benefits associated with education – to child mortality and to fertility – which are apparent from the projection exercise.
5.4.1. How many children could be saved?
It is established beyond a doubt that the education of the mother plays a very strong role in the survival of infants and young children. Table 10 shows how many children would be saved from death at young ages (0-4) by increasing the levels of the mother’s education, according to the three scenarios that are based on the same assumed trends in education-specific mortality.
Although in the three scenarios we assume a generally declining trend in child mortality in all three countries, we see from the calculation presented in Table 10 that one can expect an important incremental effect on reducing child mortality due to the better education of mothers. Comparing the Constant with the MDG scenario, we see that for Guinea under the MDG scenario, there will be 15 percent fewer deaths of children in 2025-2030 than under the Constant scenario. The ratio is similar in Nicaragua and somewhat less in Zambia.
34

Table 10. Children dying at ages 0-4 as projected under the different scenarios (proportion and absolute change between selected scenarios) by country. Source: Authors’ calculations. Children dead in 0-4 age group Percent saved Absolute saved
Constant Trend MDG From
Constant to Trend
From Trend to
MDG
From Constant to MDG
From Constant to Trend
From Trend to
MDG
From Constant to MDG
Guinea 2000-05 75211 75211 75211 0.0 0.0 0.0 0 0 0 2005-10 70710 70682 70679 0.0 0.0 0.0 28 0 32 2010-15 67400 67351 67368 0.1 0.1 0.0 49 50 32 2015-20 62940 62574 61962 0.6 1.0 1.6 366 612 977 2020-25 57481 56302 53803 2.1 4.4 6.8 1179 2499 3677 2025-30 51337 48893 44120 4.8 9.8 16.4 2444 4773 7217
Nicaragua 2000-05 7999 7999 7999 0.0 0.0 0.0 0 0 0 2005-10 7721 7700 7701 0.3 0.0 0.3 21 0 21 2010-15 7434 7362 7295 1.0 0.9 1.9 72 68 139 2015-20 6977 6797 6570 2.6 3.3 6.2 180 227 406 2020-25 6332 6027 5647 4.8 6.3 12.1 305 380 685 2025-30 5584 5191 4769 7.0 8.1 17.1 392 422 814
Zambia 2000-05 91690 91690 91690 0.0 0.0 0.0 0 0 0 2005-10 99322 99244 99244 0.1 0.0 0.1 78 0 78 2010-15 109521 108973 108973 0.5 0.0 0.5 548 0 548 2015-20 119111 117342 115270 1.5 1.8 3.3 1770 2071 3841 2020-25 125773 122123 115419 2.9 5.5 9.0 3650 6703 10354 2025-30 128349 122387 111411 4.6 9.0 15.2 5962 10977 16938
The smaller number of infant deaths can be explained in part by fewer births
over time and across scenarios. For the case of Nicaragua, we calculated what would be the changes in child mortality that are caused purely by the changing educational composition (net of fertility and mortality decline) and found that those are substantial, on the order of 5 to 10 percent, depending on the scenario. In other words, as compared to the educational composition of the female population of Nicaragua today, the changing education profile would bring down child mortality by 5-10 percent. This clearly demonstrates that improvements in the educational structure of the adult population have important positive cross-benefits on other sectors such as health. However, the table also shows that it takes a while until the improvements fully take effect. This is due to the inertia of the educational structure: Once young girls get a better education, it takes many years until this changes the education of all women of reproductive age.
5.4.2. How do the education scenarios affect fertility?
The total fertility rate is sensitive to the changes in the educational composition of the population. Even if the fertility by education categories is assumed to be identical across scenarios, the mere changes in the educational composition of the women in their
35

fertile ages that result from the different scenarios has an impact on the total number of children born. Table 11 shows that the implementation of the MDGs could reduce fertility further by a rate of 2 percent for Nicaragua, 4 percent for Guinea, and 7 percent for Zambia, if we compare to a situation with constant enrolment at the 2000 level. The time horizon of this study only shows the beginning of this effect that would still grow significantly stronger in the longer-term future. Table 11. Total fertility rates by country and scenario illustrating the impact of the different educational composition on the fertility in the total population. Source: Authors’ calculations.
2025-30 2000 Constant Trend MDGGuinea 5.81 3.19 3.15 3.05 Nicaragua 3.58 2.34 2.34 2.29 Zambia 5.61 3.36 3.28 3.12
6. CONCLUSIONS AND OUTLOOK
This paper has tried to demonstrate the importance as well as the feasibility of producing country-level projections of the population by age, sex, and educational attainment. It demonstrated in which ways this method is superior to earlier attempts at forecasting human capital and enrolment, most importantly by considering the full and detailed age and education distribution of the population and by reflecting that persons with different educational attainment tend to have significantly different fertility, mortality, and migration levels.
After an introduction to the methodology of demographic multi-state population
projections, a discussion of measurement issues, and a short description of earlier applications, this paper took a deeper look at the three priority countries Guinea, Nicaragua, and Zambia. These three specific applications demonstrate the feasibility of conducting such human capital projections, even for “difficult” countries with a rather imperfect database. The quality assessment of the DHS data for these countries (provided in the appendices of the DHS reports) shows that the quality is sufficient for the necessary base data on educational attainment, fertility by education, and child mortality by mother’s education.
The three case studies show impressive examples of the momentum of
improvements in the human capital stock. Even the scenarios which assume the very optimistic path of being able to meet the MDG educational goals of full intake and gender equality, in the short run do not produce a human capital stock of the working-age population that is much different from that in the scenario which assumes constant enrolment rates over time. Larger human capital stock differentials begin to show up after two or three decades. A scenario for Nicaragua shows that changing promotion rates to 100 percent in the primary grades can begin to improve human capital earlier, within a decade, largely because promotion affects those already in school. The study
36

also demonstrates that past improvements in education, that are reflected in today’s distribution of education by age, will continue to improve the human capital stock over the coming years, even if no additional efforts in expanding enrolment will be made. This significant momentum of improvements in human capital stock is very important to keep in mind when setting political targets and when studying the costs and benefits of investments in education.
The study also demonstrated that there are significant positive side effects of
improving education on other important MDGs that are not directly related to education. Leaving aside the still somewhat controversial question to what degree better education will help to increase GDP growth and reduce poverty, there is little doubt that a higher education of women will result in lower child mortality and lower fertility in developing countries. For the three countries studied here, these cross-sectoral effects are demonstrated numerically.
Finally, in the context of the upcoming mid-term review of the MDGs, this
paper has shown that systematic studies of past, current, and future educational attainment by age and sex can make important contributions to better understand the dynamics by which many of the MDG indicators change over time. It seems to us that using the methods described in this paper should be clearly superior to the rather simplistic method of just drawing a line between the starting point and the goal set for 2015, and then using this as the basis for a judgment whether individual countries are above or below the MDG target path.
The methods presented here require a bit more effort in the assembly of data and
in the definition of the specific model assumptions, but the data is readily available for many countries of the world and the method is well tested and established in the scientific literature. In other words, there is no good reason for not applying it systematically to a large number of countries, and in fact, this is already being done by IIASA and the EPDC.
37

REFERENCES Ahuja, V. and D. Filmer. 1995. Educational Attainment in Development Countries: New Estimates and Projections Disaggregated by Gender. Washington, D.C.: The World Bank (Mimeo). Alachkar, A. and W.J. Serow. 1988. The socioeconomic determinants of mortality: An international comparison. Genus 44(3-4): 131-151. Barro, R. and J.W. Lee. 2000. International Data on Educational Attainment. Updates and Implications. NBER Working Paper 7911. Cambridge, MA: National Bureau of Economic Research. Barro, R. and J.W. Lee. 1993. International comparison of educational attainment. Journal of Monetary Economics 32: 363-394. Barro, R. and X. Sala-I-Martìn. 1995. Economic Growth. New York: McGraw-Hill. Bledsoe, C.H., J.B. Casterline, J.A. Johnson-Kuhn, and J.G. Haaga. 1999. Critical Perspectives on Schooling and Fertility in the Developing World. Washington, D.C.: National Academy Press. Bloom, D. and D. Canning. 2003. How demographic change can bolster economic performance in developing countries. World Economics 4(4): 1-14. Cao, G.Y. and W. Lutz. 2004. China’s future urban and rural population by level of education. Pages 265-282 in W. Lutz, W.C. Sanderson, and S. Scherbov (eds.), The End of World Population Growth in the 21st Century: New Challenges for Human Capital Formation and Sustainable Development. London: Earthscan. Cohen, D. and M. Soto. 2001. Growth and Human Capital: Good Data, Good Results. OECD Development Centre Technical Papers 179. Paris: OECD. Collier, P. and A. Hoeffler. 2000. Greed and Grievance in Civil War. Policy Research Paper 2355. Washington, D.C.: The World Bank. Available at: http://www.worldbank.org/research/conflict/papers/greedgrievance_23oct.pdf Coulombe, S., J.-F. Tremblay, and S. Marchand. 2004. International Adult Literacy Survey; Literacy Scores, Human Capital and Growth Across Fourteen OECD Countries. Catalogue No. 89-552-MIE. Ottawa, Ontario: Statistics Canada. De la Fuente, A. and R. Doménech. 2000. Human Capital in Growth Regressions: How Much Difference does Data Quality Make? OECD Economics Department Working Papers 262. Paris: OECD. DHS Guinea 1999. Direction Nationale de la Statistique [Guinea] and Macro International, Inc. 2000. Enquête Démographique et de Santé, Guinée 1999. Calverton, M.A.: Direction Nationale de la Statistique and Macro International, Inc.
38

DHS Nicaragua 2001. Instituto Nacional de Estadísticas y Censos [Nicaragua], Ministerio de Salud [Nicaragua], and DHS+/ORC Macro. 2002. Encuesta Nicaragüensede Demografía y Salud 2001. Calverton, M.A.: Instituto Nacional de Estadísticas y Censos, Ministerio de Salud, and DHS+/ORC Macro. DHS Zambia 2002. Central Statistical Office [Zambia], Central Board of Health [Zambia], and ORC Macro. 2003. Zambia Demographic and Health Survey 2001-2002. Calverton, M.A.: Central Statistical Office, Central Board of Health, and ORC Macro. Doblhammer, G. 1997. Socioeconomic Differentials in Austrian Adult Mortality: A Study Based on Linked Census and Deaths Records for the Years 1981/1982. Ph.D. Thesis. Vienna, Austria: Sozial- und Wirtschaftswissenschaftliche Fakultät, Universität Wien. Dubey, A. and E. King. 1994. A New Cross-Country Education Stock Series Differentiated by Age and Sex. Washington, D.C.: The World Bank (Typescript). Duvieusart, B. 1991. SIMEDUC 1.1 A Simulation Model for Educational Development (Working Document). Paris: UNESCO. Haddad, W.D., M. Carnoy, R. Rinaldi, O. Regel. 1990. Education and Development Evidence for New Priorities. World Bank Discussion Papers 95. Washington, D.C.: The World Bank. Huisman, M., A.E. Kunst, O. Andersen, J.-K. Borgan, C. Borrell, G. Costa, P. Deboosere, G. Desplanques, A. Donkin, S. Gadeyne, J. Kytir, C. Minder, E. Regidor, T. Spadea, T. Valkonen, and J.P. Mackenbach. 2002. Socio-economic Inequalities in Mortality in Europe Among Elderly People. Sedha Project. Unpublished. Keyfitz, N. 1985. Applied Mathematical Demography. 2nd Edition. New York: Springer Verlag. Kyriacou, G.A. 1991. Level and Growth Effects of Human Capital: A Cross-Country Study of the Convergence Hypothesis. New York: Department of Economics, New York University (Mimeo). Goujon, A. and W. Lutz. 2004. Future human capital: Population projections by level of education. Pages 121-157 in W. Lutz, W.C. Sanderson, and S. Scherbov (eds.), The End of World Population Growth in the 21st Century: New Challenges for Human Capital Formation and Sustainable Development. London: Earthscan. Goujon, A. and K. MacNay. 2003. Projecting the educational composition of the population of India: Selected state-level perspectives. Applied Population and Policy 1(1): 25-35. Goujon, A., I. Kohler, and W. Lutz. 2000. Future population and education trends: Scenarios to 2030 by socioecological region. Pages 141-172 W. Lutz, L. Prieto, and W.
39

Sanderson (eds.), Population, Development, and Environment on the Yucatán Peninsula: From Ancient Maya to 2030. Research Report RR-00-14. Laxenburg, Austria: International Institute for Applied Systems Analysis. Lutz, W. 2004. Population, human capital, and water in Egypt. POPNET 36: 1-2. Population Network Newsletter. Laxenburg, Austria: International Institute for Applied Systems Analysis. Lutz, W., Ed. 1994. Population-Development-Environment: Understanding Their Interactions in Mauritius. Berlin: Springer Verlag. Lutz, W. and A. Goujon. 2001. The world’s changing human capital stock: Multi-state population projections by educational attainment. Population and Development Review 27(2): 323-339. Lutz, W., A. Goujon, and G. Doblhammer-Reiter. 1999. Demographic dimensions in forecasting: Adding education to age and sex. Pages 42-58 in W. Lutz, J.W. Vaupel, and D.A. Ahlburg (eds.), Frontiers of Population Forecasting. A Supplement to Vol. 24, 1998, Population and Development Review. New York: The Population Council. Mankiw, N.G., D. Romer, and D.N. Weil. 1992. A contribution to the empirics of economic growth. Quarterly Journal of Economics 107(2): 407-437. Moses, K. and F. Golladay. 2004. Recent Uganda Experiences Strategic Projections – EPDC Workshop. Presented at Maps to the Future Workshop on Making Education Projections for Policy, July 12, 2004. Washington, D.C.: Education Policy and Data Center. Murray S.T., Clermont, Y, and Binkley M. 2005. International Adult Literacy Survey Measuring Adult Literacy and Life Skills: New Frameworks for Assessment. Catalogue no. 89-552-MIE, no. 13. Ottawa, Canada: Statistics Canada Nehru, V., E. Swanson, and A. Dubey. 1993. A New Database on Human Capital Stock: Sources, Methodology and Results. Policy Research Working Paper 1124. Washington, D.C.: The World Bank. Pool, I. 2004. Of ‘Demographic Dividends,’ ‘Windows of Opportunity’ and Development: Age-structure, Population Waves and Cohort Flows. Paper presented at CICRED Seminar on Age-structural Transitions: Population Waves, Disordered Cohort Flows and the Demographic Bonus, Paris, February 23-26, 2004. Porta, Emilio. 2004. Nicaragua Sectoral Education Model. Presented at Maps to the Future Workshop on Making Education Projections for Policy, July 12, 2004. Washington, D.C.: Education Policy and Data Center. Psacharopoulos, G. and A.M. Arrigada. 1992. The educational composition of the labor force: An international update. Journal of Educational Planning and Administration 6(2): 141-159.
40

Psacharopoulos, G. and A.M. Arrigada. 1986. The educational composition of the labor force: An international comparison. International Labor Review 125(5): 561-574. Psacharopoulos, G. and H.A. Patrinos. 2002. Returns to Investment in Education: A Further Update. Policy Research Working Paper WPS2881. Washington, D.C.: The World Bank. Rogers, A. 1975. Introduction to Multiregional Mathematical Demography. New York: John Wiley. Romer, P.M. 1989. Human Capital and Growth: Theory and Evidence. NBER Working Paper 3173. Cambridge, MA: National Bureau of Economic Research. Sen, A. 1999. Development as Freedom. Oxford: Oxford University Press. UNESCO. 2005. EFA in Africa: Paving the Way for Action. UNESCO. 2003a. Gender and Education for All: The Leap to Equality. EFA Global Monitoring Report, 2003/4. Paris: UNESCO. UNESCO. 2003b. Development of EFA Planning Simulation Model. Presentation at meeting in Bangkok, Thailand, November 24-29, 2003. Available at: http://www.unescobkk.org/aims/documents/Planning%20Tools.pdf UNESCO. 2002. Statistics Show Slow Progress Towards Universal Literacy. Paris: UNESCO Press. United Nations. 2002. World Population Prospects: The 2002 Revision. New York: United Nations. Wils, A. 2002. On Accelerating the Global Literacy Transition. Research and Assessment Systems for Sustainability Program Discussion Paper 2002-18. Cambridge, MA: Environment and Natural Resources Program, Belfer Center for Science and International Affairs, Kennedy School of Government, Harvard University. Downloadable at: http://ksgnotes1.harvard.edu/BCSIA/sust.nsf/pubs/pub73 Yousif, H.M., A. Goujon, and W. Lutz. 1996. Future Population and Education Trends in the Countries of North Africa. Research Report RR-96-11. Laxenburg, Austria: IIASA.
41

APPENDIX Males 2000 Females
Males 2030 – Constant Females Males 2030 – Trend Females
Males 2015 – MDG Females Males 2030 – MDG Females
No education
Primary
Secondary
Higher
Figure A1. Population projections of Guinea according to the Constant, Trend, and MDG scenarios in 2000, 2015, and 2030. Source: Authors’ calculations.
42

Males 2000 Females
Males 2030 – Constant Females Males 2030 – Trend Females
Males 2015 – MDG Females Males 2030 – MDG Females
No education
Primary
Secondary
Higher
Figure A2. Population projections of Nicaragua according to the Constant, Trend, and MDG scenarios in 2000, 2015, and 2030. Source: Authors’ calculations.
43

Males 2000 Females
Males 2030 – Constant Females Males 2030 – Trend Females
Males 2015 – MDG Females Males 2030 – MDG Females
No education
Primary
Secondary
Higher
Figure A3. Population projections of Zambia according to the Constant, Trend, and MDG scenarios in 2000, 2015, and 2030. Source: Authors’ calculations.
44